Article

Risk Assessment of Alpine Skiing Events Based on Knowledge Graph: A Focus on Meteorological Conditions

1
Public Meteorological Service Center, China Meteorological Administration, Beijing 100081, China
2
Key Laboratory of Virtual Geographic Environment, Ministry of Education, Nanjing Normal University, Nanjing 210023, China
3
Jiangsu Center for Collaborative Innovation in Geographical Information Resource Development and Application, Nanjing 210023, China
4
Urban Planning and Development Institute, Yangzhou University, Yangzhou 225127, China
5
College of Civil Science and Engineering, Yangzhou University, Yangzhou 225127, China
*
Author to whom correspondence should be addressed.
ISPRS Int. J. Geo-Inf. 2021, 10(12), 835; https://doi.org/10.3390/ijgi10120835
Submission received: 26 October 2021 / Revised: 3 December 2021 / Accepted: 13 December 2021 / Published: 15 December 2021
(This article belongs to the Special Issue Semantic Spatial Web)

Abstract

:
The alpine skiing event is particularly vulnerable to changes in meteorological conditions as a winter sport held outdoors. The commonly used risk assessment methods cannot be inflexible and cannot be dynamically adjusted to combine multiple risk factors and actual conditions. A knowledge graph can organize data resources in the risk domain as structured knowledge systems. This paper combines a knowledge graph and risk assessment to effectively assess the risk status. First of all, we introduce the relevant literature review of sports event risk assessment, combining the characteristics of alpine skiing events. Then, we summarize the risk types of alpine skiing events and related risk knowledge. Secondly, a model is proposed to introduce an event risk assessment model based on the RippleNet framework combined with the characteristics of large-scale sports events. Moreover, the validity of the model is verified. The results show that the RippleNet-based event risk assessment model can be used to assess the risk of alpine skiing events. In order to effectively deal with the large-scale sports events that occur with a variety of risks, the smooth implementation of large-scale sports events provides a strong guarantee.

1. Introduction

The alpine skiing event is a winter competitive sport that is extremely challenging because of its high speed and high altitude. The International Ski Federation (FIS) regularly holds a series of events such as the World Championships, the World Cup, and the Winter Olympics. There are inevitably certain risks involved in holding a competition, including personnel safety, facility and equipment risks, logistics risks, and environmental risks [1]. Therefore, event organizers must thoroughly assess the possible risks during the competition and take preventive measures. Meteorological risk is one of the most critical risks in alpine skiing events. The impact of meteorological conditions on alpine skiing events can be reflected in two main aspects. On the one hand, the complicated topography and landform in the mountainous areas make the meteorological conditions more changeable. Bad weather can cause injuries to the event-related personnel, like low temperatures, high winds, snowstorms, etc. [2]. On the other hand, the alpine skiing events primarily use natural snowfall and artificial snow to maintain the venue environment. It will not be possible to maintain the snow on the venue without the suitable meteorological conditions.
Meteorological conditions are an unstable factor in the process of conducting alpine skiing events. Meteorological risks need to be constantly predicted and assessed during the event to reduce the impact. When the meteorological risk reaches a certain level, event managers need to respond well in advance to prevent the danger from happening. Consequently, it is necessary to carry on the scientific and practical risk assessment to the sports event. Risk assessment and event management are prerequisites for the normal operation of alpine skiing events [3]. Big data technology provides enormous amounts of data and analysis tools for risk management. However, massive data are usually fragmented and isolated. Managers are not able to integrate and fully utilize massive data well. If the scattered and fragmented data resources can be integrated to form an interrelated and ordered structured knowledge system. The knowledge could be applied to the risk assessment and management of alpine skiing events [4].
The commonly used qualitative analysis methods are not flexible, unable to combine multiple risk factors and actual situations for dynamic adjustment, and it is difficult to utilize historical experiences. Although the technical representatives have a strict set of rules for deciding if competitions must be postponed or suspended. However, this is not the case in reality. According to our research, technical representatives will adjust to the actual situation, and the rules will only work under ideal conditions. The development of the semantic web and the maturity of knowledge graph (KG) provide an opportunity to solve these problems. KG can systematically integrate the knowledge about the various risks of alpine skiing events. It has the advantages of accuracy, variety, and interpretability when applied to sporting events. First, KG introduced more semantic relationships for each factor, providing event organizers with more specific, in-depth risk factors. It provides different types of relationship connections, which is conducive to the divergence and diversification of inference results. In addition, KG is stored and visualized based on a graph structure that makes it easy to understand the reasoning process to increase the persuasive force. As a result, the objective of this study is to perform a risk assessment of alpine skiing events through KG, which can provide the event management with supporting information about meteorological risks.
In summary, we research meteorological risk assessment for alpine skiing by combining with knowledge graph technology. A RippleNet-based risk assessment model was designed and implemented by linking meteorological risk factors to the KG. The RippleNet was originally designed to automatically discovers users’ hierarchical potential interests by iteratively propagating users’ preferences in the KG [5]. Unlike existing theoretical methods and commercial tools, KG -based model can learn historical empirical knowledge during the training process. We constructed a KG of alpine skiing events. The original input parameters of RippleNet were changed to meteorological data and race data in the KG. Accordingly, RippleNet can obtain more comprehensive safety information of all events. This method can help the event management detect the meteorological risk in time. The applicability also exists in other sports events and fields. Our main contributions in this paper are as follows:
  • For this work, we have applied KG and related techniques to risk assessment of sports events, which is innovative compared with previous methods.
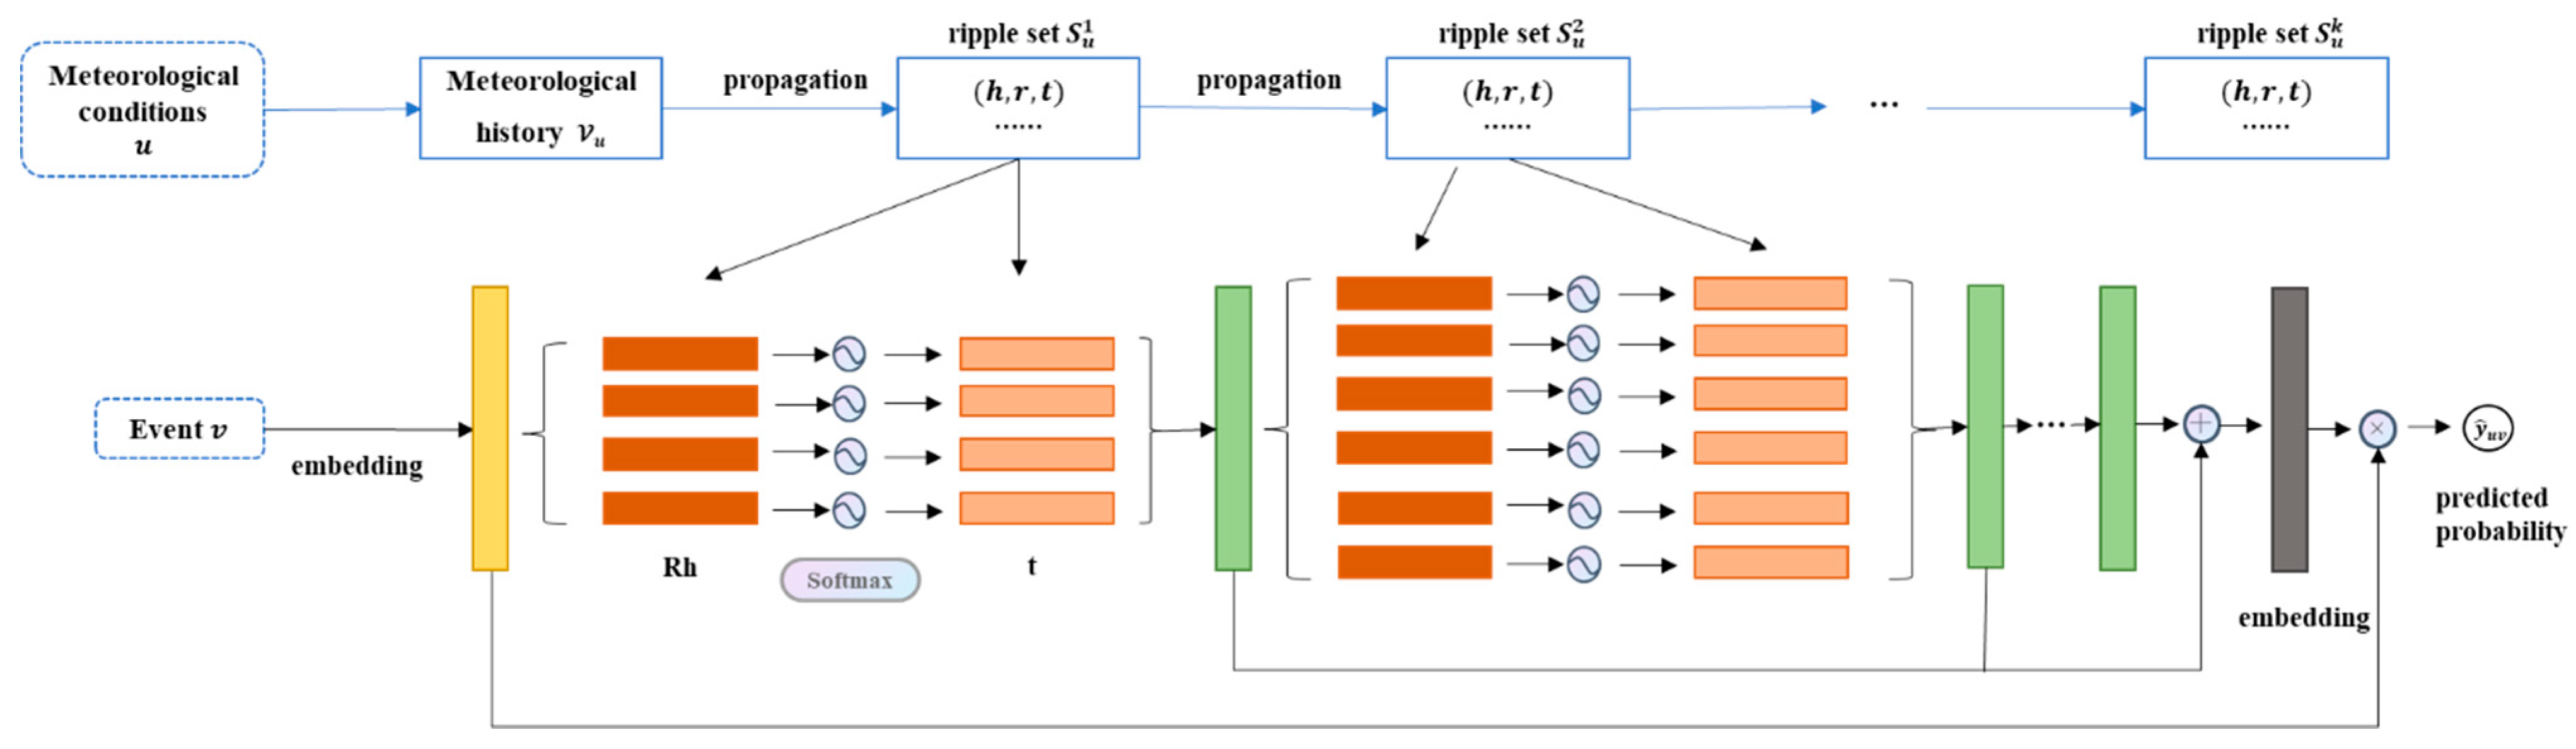
  • By modifying the RippleNet model, the model’s input parameters were changed to the values of the meteorological conditions. It was made possible to assess the meteorological risk of alpine skiing events effectively by the model.
  • The modified RippleNet model is compared with the commonly used qualitative analysis methods. The experimental results show that the method has certain validity and reliability, and the accuracy is improved.
The following sections are expanded as follows: Section 2 summarizes the research progress of sports events and KG; Section 3 presents the research framework and methods of this paper, focusing on the types of analysis and the application of RippleNet framework; Section 4 carries on the case study, and discusses the application value of this method, Section 5 puts forward the conclusion and the future work prospect.

2. Related Work

2.1. Risk Assessment in the Sports Events

In Haynes’ 1895 book Risk as an Economic Factor, the American scholar defined Risk as the possibility of loss or damage. As the research progresses, risk has been gradually given more extensive and profound meaning by various fields. It is gradually paid attention to in the process of decision-making and management [6,7,8,9,10]. With the continuous development of sports events, the number of people in various events is increasing. The various aspects of the events have also become more complicated. This will cause the events to produce more uncertain factors as well as the uncontrollable factor, and thus increases the competition-related risk [11]. Therefore, the application of risk assessment in sports events is becoming more and more significant.
The risk assessment of sports events mainly refers to evaluating the probability of occurrence, the severity of risk, and the impact range of risk, including qualitative, quantitative methods, or a combination of the two ways [12,13,14]. Risk assessment is a basic task for comprehensive management of events [15]. The Special Event Risk Management Manual, published in 1990, is dedicated to the risk management of sporting events [16]. In addition, Sports Stadium Event Planning and Risk Management introduces event planning and operation management, mass management and violent incident prevention, risk management, and operation procedures in more detail [17]. In recent years, the research of event risk has focused on adopting scientific methods to improve the event risk assessment system, enhance the event risk identification and response capabilities.
The sports event manager conducts a comprehensive analysis of the event and can discover the risks in the operation of the event. In this way, a risk assessment index system and assessment rules can be established [18]. The methods of risk assessment mainly include qualitative assessment, semi-quantitative assessment, quantitative assessment, and mixed assessment [19]. The quantitative risk assessment method can get more objective and reliable assessment results. However, the quantitative assessment method requires a large amount of objective and accurate data to support, which takes much time and economic cost to count and analyze these data [20]. In the field of the sports events, qualitative analysis is more commonly used. Although the method of combining quantitative analysis and qualitative analysis has been designed, the scope of application is still not widespread. The common methods of risk qualitative or quantitative assessment include list ranking, matrix analysis, analytic hierarchy process, and probability analysis. Some researchers use the analytic hierarchy process to evaluate the severity of the operational risk factors of alpine skiing venues, then calculate the weight comparison of each risk factor based on the data of the expert evaluation table. Finally, a list sorting method is used to comprehensively sort the probability and severity of the site’s operational risks [12]. These methods rely more on the subjective experience of experts or organizers and give a certain degree of quantitative indicators. The traditional risk indicator system has a threshold range for influencing factor indicators. It is not time-sensitive or dynamic. In addition, it lacks the adaptability and cannot adapt to complex sports events.

2.2. KG and Its Applications in the Risk Field

KG is a knowledge-based technique to represent comprehensive entities and relationships in the real world [21]. KG has been widely used in many fields such as intelligent question answering, semantic search, intelligent recommendation, and decision analysis systems [22,23,24]. KG can be divided into two categories, as General-purpose KG and Domain-specific KG, due to different application fields. The General-purpose KG can be visualized as a structured encyclopedic knowledge base for a general domain, which contains a lot of common sense knowledge in the real world and covers a great deal [25]. At present, relatively mature technologies and related products have been developed in General-purpose KG, including YAGO [26], DBpedia [27], Freebase [28], NELL [29], and Zhishi.me [30]. Domain-specific KG can be combined with different industries to provide corresponding solutions for specific scenarios. In recent years, Domain-specific KG has been successfully applied in medical, finance, e-commerce and other industries [31,32,33,34,35].
KG and related technologies gradually started to be applied in the field of risk management [36,37,38]. KG has a good development prospect in risk identification, assessment, early warning, prevention and control [39]. In terms of information security, KG can be used to assess the security risk of the network and discover potential safety hazards on time [40]. In the field of natural disasters, a typhoon disaster KG is constructed to show the distribution and disaster situation of typhoon disasters, which help people to avoid typhoon disasters [41]. In the ecological field, conceptual Bayesian networks (CBNs) for ecological risk assessment and remediation support at the contaminated sites have also been studied [42]. Some companies have constructed a financial risk KG. They propose a multimodal graph neural network (MAGNN) to learn from these multimodal inputs for financial risk prediction. They also build an intelligent Q&A system based on enterprise risk KG, which helps discover dynamic and sudden financial risks [43,44]. In healthcare, KG can assist in performing risk assessment of miscarriage before and during pregnancy [45]. Especially in 2020, the COVID-19 is ravaging the world. The visual analysis method of KG can be used to monitor the epidemic in real time, discover potential patients, and protect against high-risk groups [46]. In the field of sports events, the KG is still at an early stage of research, with a bias towards the storage and visualization of existing knowledge resources. It is difficult to apply directly to the risk prediction and decision support of emergency management of sports events.
In summary, KG has been applied to risk identification, warning, and prevention. However, there are still some problems in the specific research. First, although KG and risk assessment models have achieved good results in risk management. However, there is not much research on the combination of the two in sports events. Second, in the process of risk assessment, it is necessary to consider not only the existing risk factors, but also historical relevant cases to improve the accuracy and interpretability of the assessment. Third, the accumulated risk data are scattered. There are no uniform and reusable risk knowledge, resulting in inefficient risk management. Therefore, a significant research topic in the risk field is how to effectively store, organize, and manage a large amount of risk knowledge and effectively use existing knowledge for assessment.

3. Research Framework and Methods

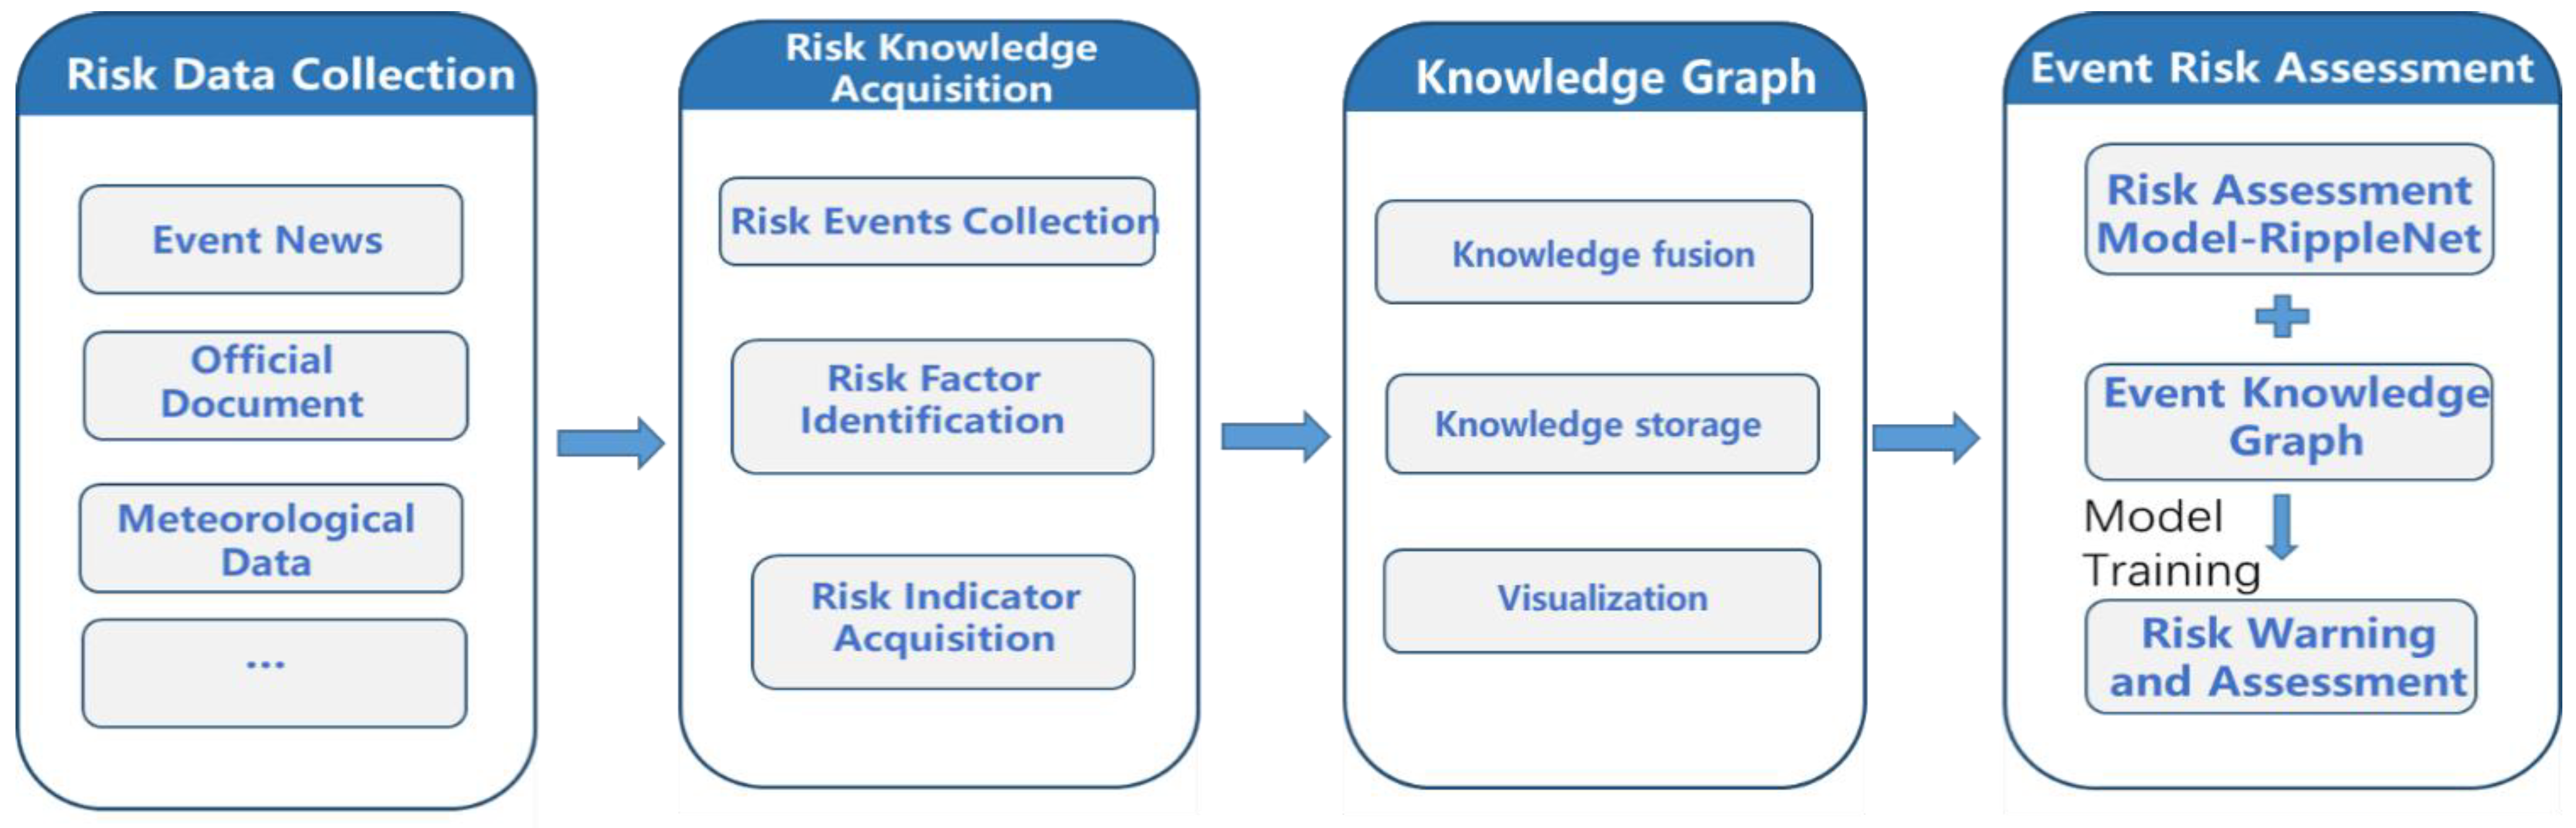
3.1. Research Framework

The risk influencing factors of large-scale sports events are changeable. Traditional research methods usually adopt the definite value range and warning line. The traditional risk index system have some deficiencies in guaranteeing the accuracy and objectivity of qualitative indexes, thus reducing the reliability of risk. Therefore, another method is to use an expert or historical experience knowledge. According to the actual meteorological conditions of the stadium, the risk of the event is predicted and evaluated. Then, adjust the event based on the evaluation results of the model. This method can combine similar historical cases to provide more reliable and interpretable risk assessment results. Moreover, the method allows the event management to adjust based on the assessment results.
In this study, we combine KG and risk assessment models to provide a meteorological risk assessment method based on historical cases and expert knowledge for alpine ski events. The overall research framework is shown in Figure 1. The data collection work is first conducted to obtain the required event data and risk data from event news, official event documents, and meteorological data. Then, risk knowledge and event information are obtained from the data, which includes historical risk events, meteorological risk factors, and meteorological warning indicators specified by the event management. This risk knowledge can play its unique value in the event risk assessment. By summarizing the empirical knowledge based on historical risk cases, and then analyzing the specific risk factors (such as wind speed, rainfall, temperature) in conjunction with the actual situation. In the end, the potential risk of the event can be predicted. This risk knowledge is organized into triples, and the KG of alpine skiing events is obtained by storing the triples using a graph database. Finally, the KG is used as the input parameters of RippleNet model. When the model training is completed, we use it to conduct events risk assessment.

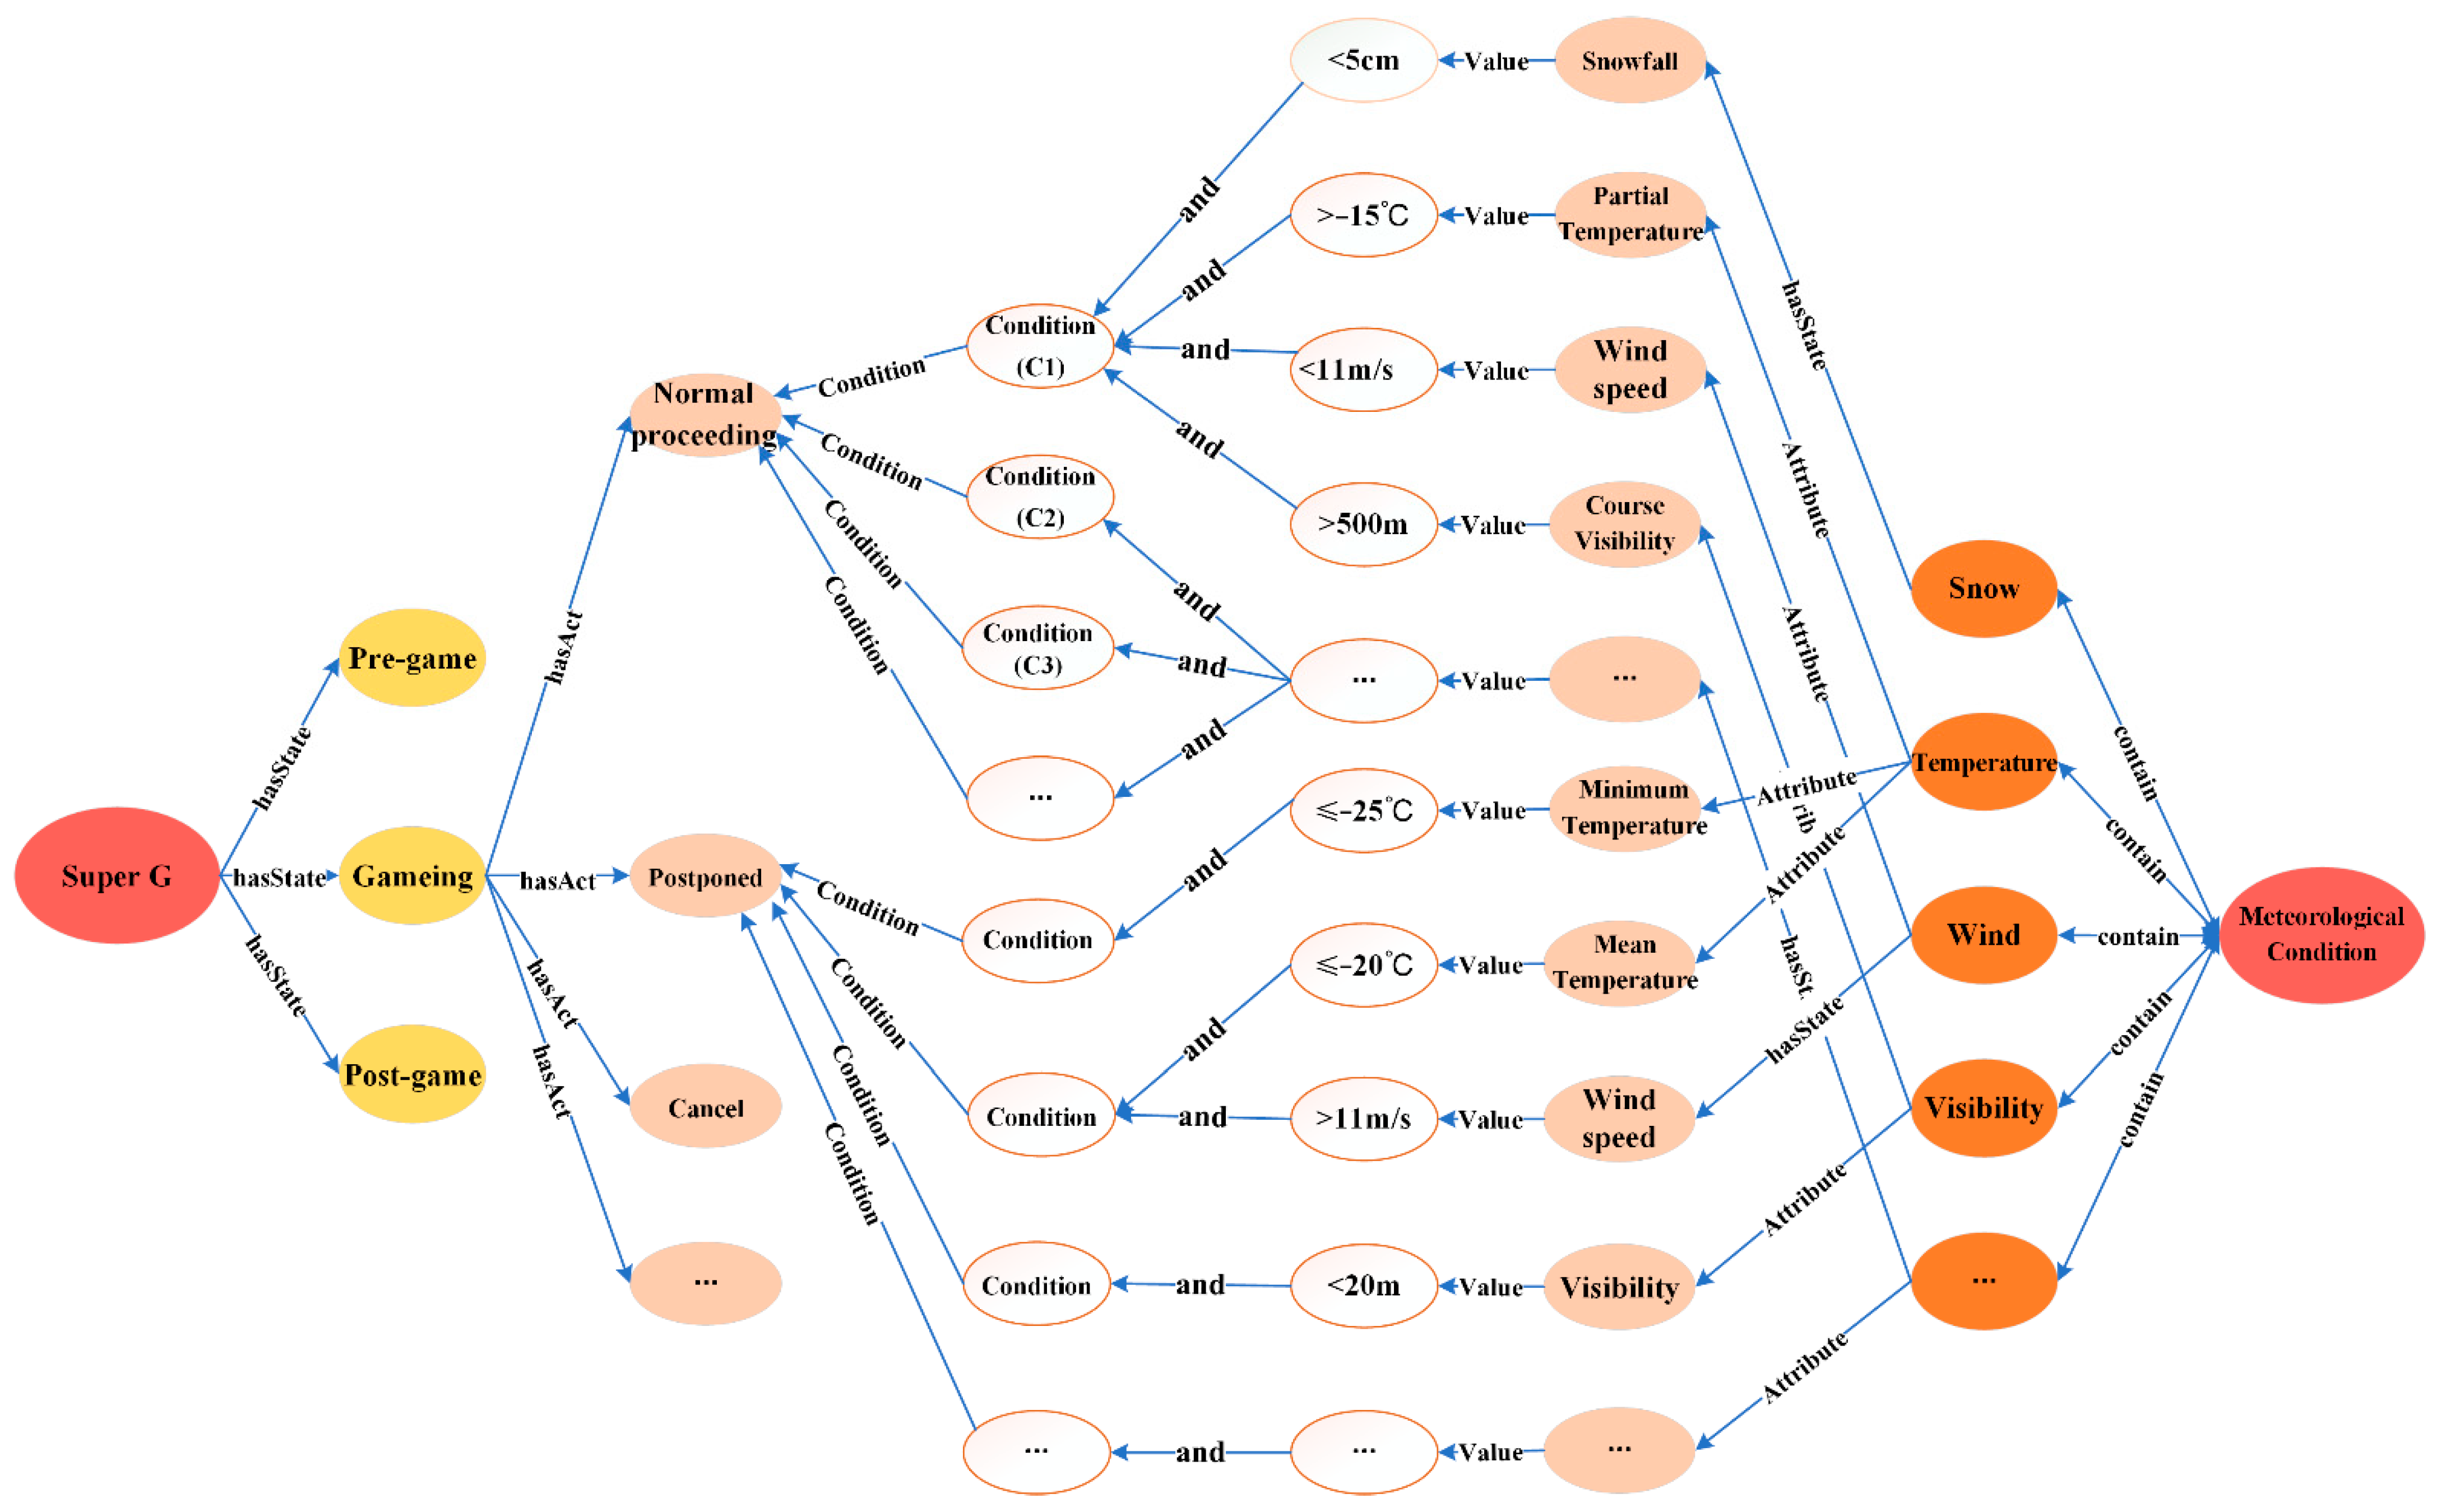
3.2. Knowledge of Meteorological Risks for Alpine Skiing Events

Meteorological conditions are one of the critical risk factors in alpine skiing events. Alpine skiing events sites are usually located in mountainous areas. Changing meteorological conditions in these areas may lead to psychological and physiological fluctuations for the athletes. They will also cause changes in the environment and venues of sports events. These meteorological elements are sensitive factors that affect the operation and management of the event and the athlete’s state [47]. Snowfall and snow quality of the track are the primary factors affecting alpine skiing events. Excessive snowfall can cause tracks to be slippery. It is difficult for athletes to control their bodies and speed. For instance, in the Sochi Paralympic Events, the athletes’ injury rate and unfinished rate were higher than in the Vancouver Paralympic Events [48]. About one third of the athletes were injured. By analyzing the meteorological conditions of the two events, the skiing venues hosting the Sochi Paralympics had higher humidity and snowfall. In addition, the odds of canceling alpine skiing events will also increase significantly if the competition venues lack snow. In fact, not only sport skiing events, but daily skiing will also be affected by bad weather.
Since the alpine skiing event became official winter sports event in 1936, the FIS dominated events management agencies have accumulated many historical events resources [49]. In the past, many events have been postponed or cancelled because the meteorological conditions could not meet the competition requirements (Table 1). These cases are analyzed and sorted according to the meteorological conditions, then develop experience knowledge that event managers can use to conduct risk assessments.
In this paper, the meteorological observation data of PyeongChang, Sochi and Vancouver are selected to analyze the risk sources. By collecting the historical data, the meteorological factors such as snowfall, precipitation, fog, low temperature, strong wind and high temperature are analyzed. The analysis shows that the meteorological conditions required for the alpine skiing events cover precipitation, snowfall, visibility, temperature, relative humidity, wind speed, wind direction, etc. Therefore, these meteorological factors are used as risk sources.
According to different meteorological conditions, the event organizing committee has established corresponding contingency plans to reasonably deal with the change of weather conditions. When one or more meteorological conditions arrive at the threshold index of a certain event, the event organizing committee will decide to stop the competition, and choose a time to carry out. The technical representative has to suspend the event when meteorological conditions meet the indicators (Table 2): (1) the air temperature is lower than −15 °C; (2) the wind speed is higher than 5 m/s or the air temperature is lower than −20 °C; (3) the visibility of the whole track is lower than 500 m; (4) the visibility in some areas is lower than 200 m; (5) the daily snowfall is higher than 5 cm; (6) the snowfall in 2 h is higher than 2 cm; and (7) mixed precipitation or freezing rain.

3.3. The Framework for Integrating KG and Risk Knowledge

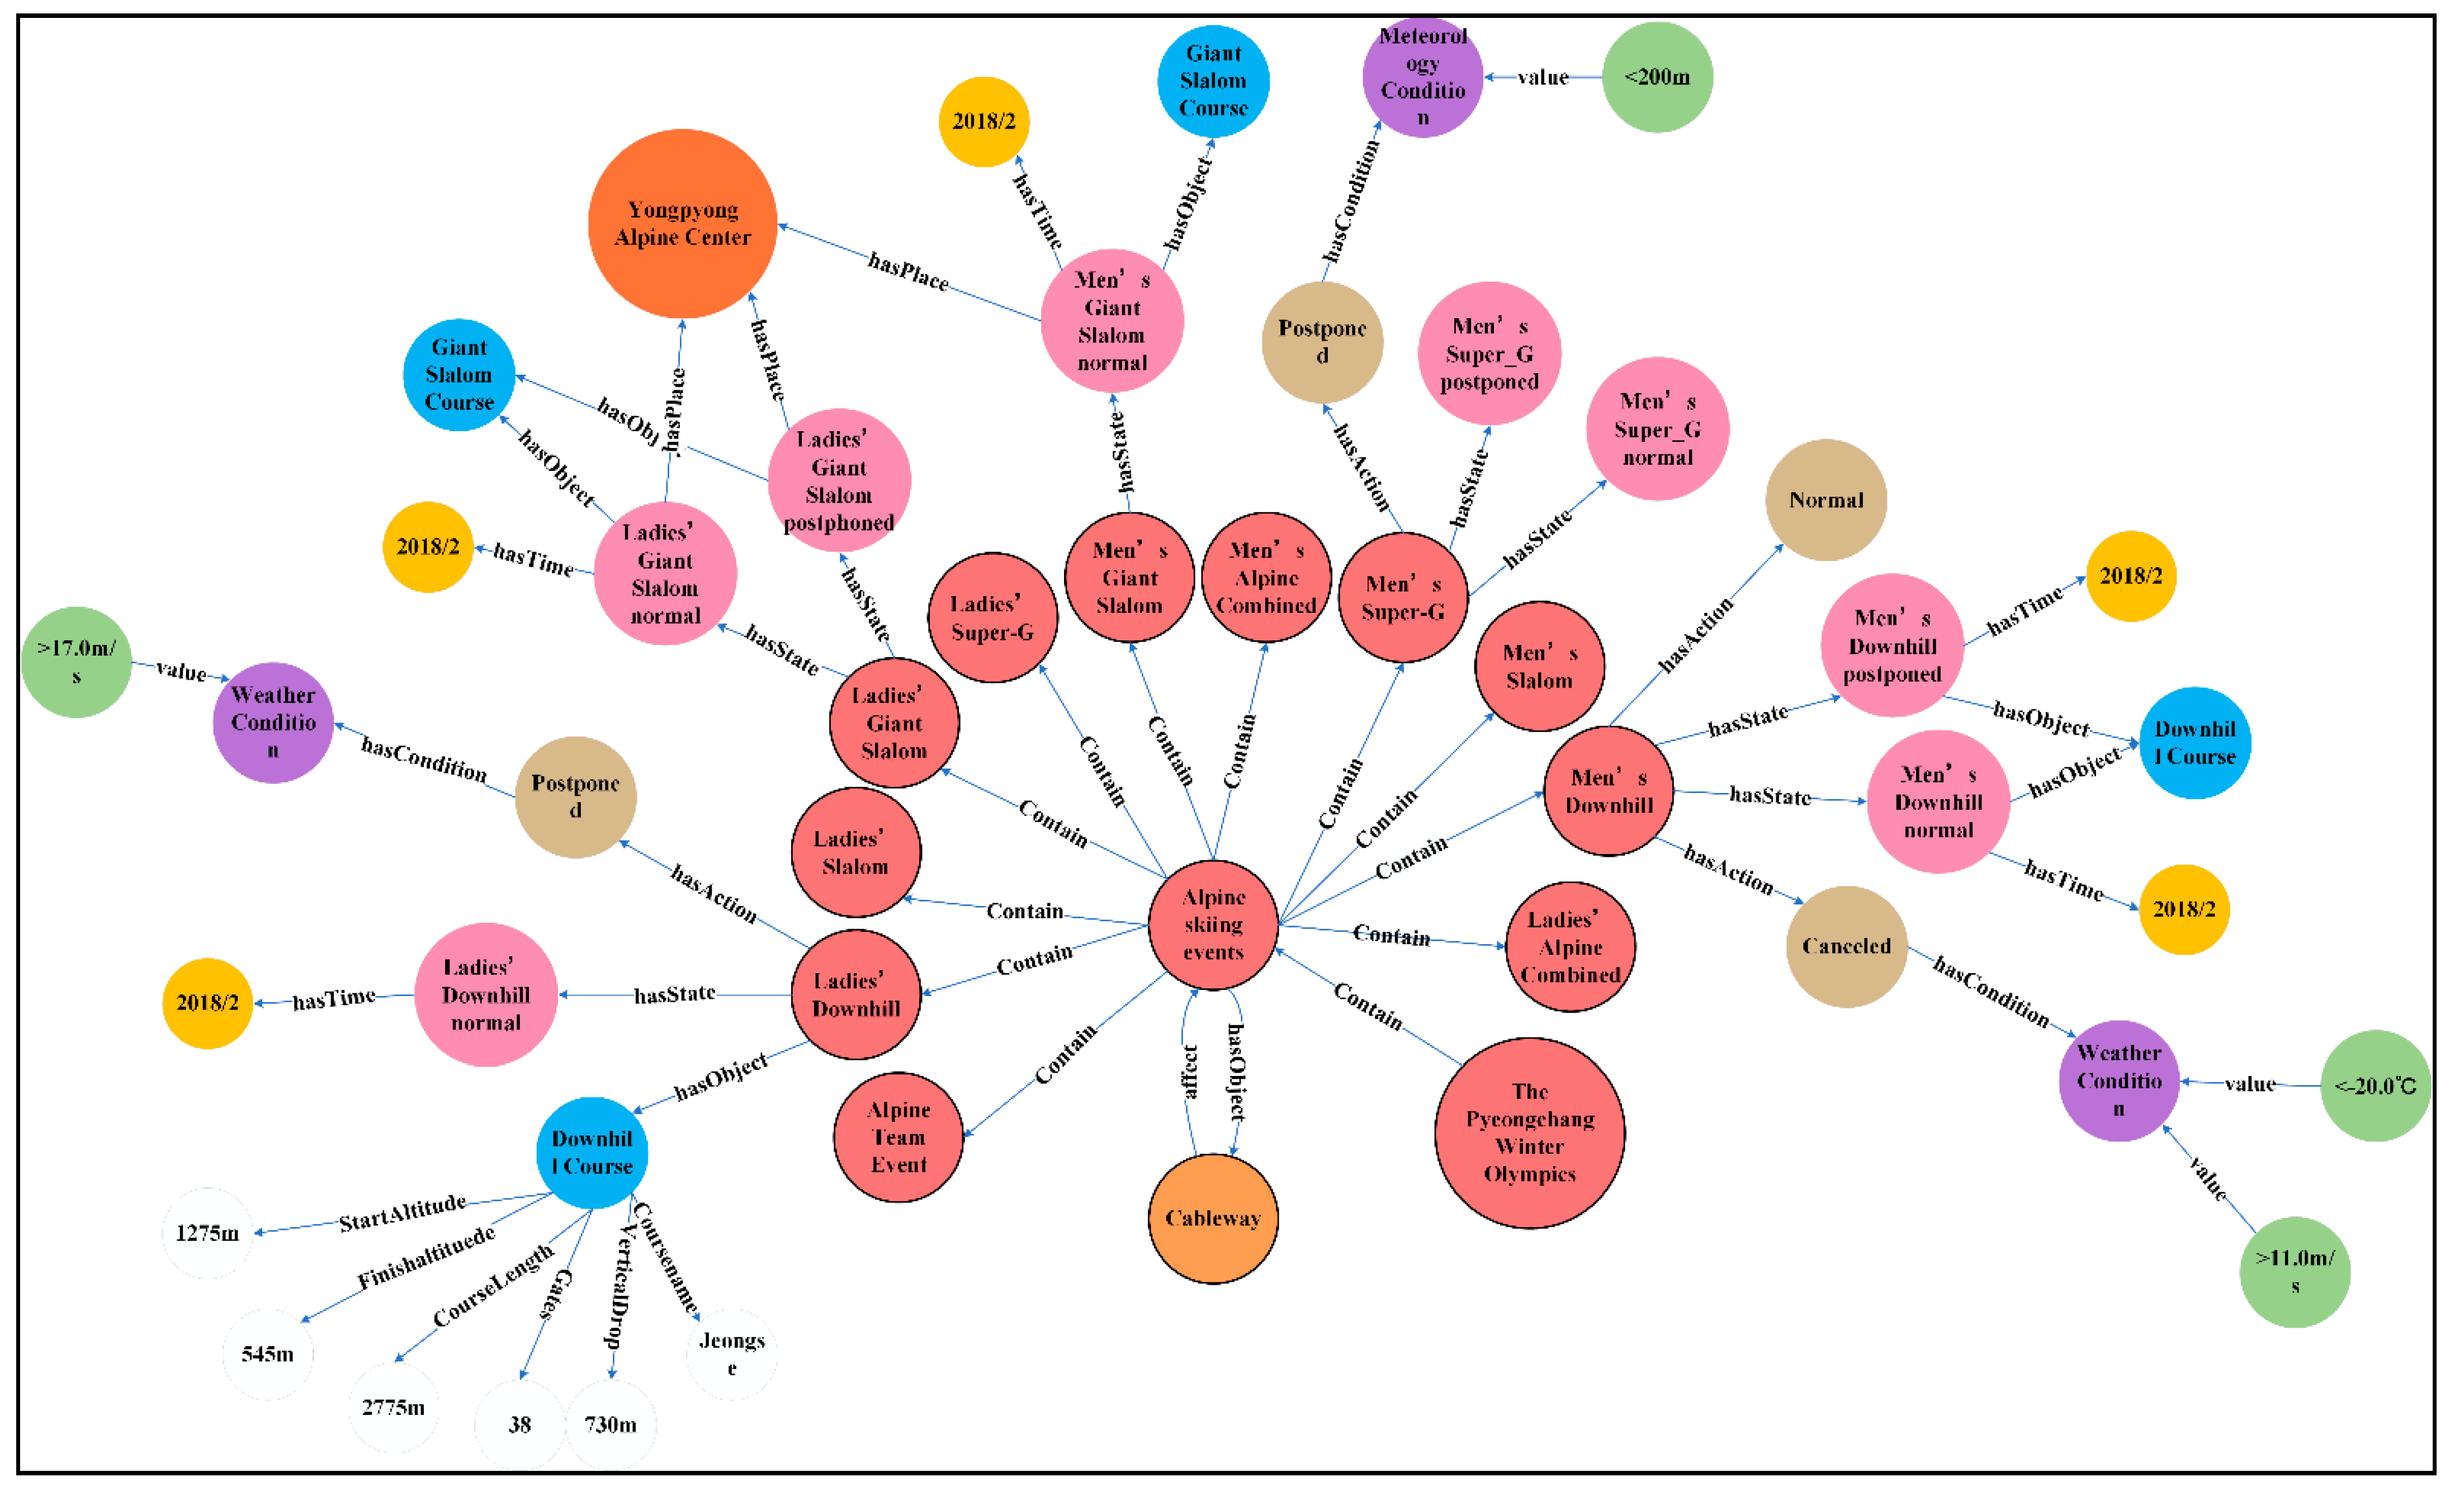
3.3.1. Construction Process of KG

We adopt the top-down method to construct the KG of alpine skiing events, including three basic steps: construction of knowledge representation model, knowledge acquisition, and knowledge storage. We first analyze the components and dynamic characteristics of alpine skiing events, and consider the significant influence of meteorological conditions on alpine skiing events. On this basis, a multi-level knowledge representation model is constructed, named as “Object-Characteristic-Relation” model. Additionally, various relevant data (e.g., event management data, social activities and meteorological conditions, etc.) are collected to extract the entities and characteristics of alpine skiing events. Furthermore, the graph database is used to organize and manage the fused entities and relationships, and the KG of alpine skiing events is constructed (Figure 2).

3.3.2. The Representation and Application of Risk Assessment Rules in KG

Risk assessment is evaluating the potential impact of an event [50]. Rule-based knowledge is an important basis for risk assessment. We express the indicators and rules from Table 2 using KG. According to the proposed “Characteristic value-Relation” representation method, two conditional nodes are connected with characteristic values of different objects, and the influencing conditions between objects are represented through the combination of characteristic. For alpine skiing events, same action conditions may be caused by more than one meteorological factors. As shown in Figure 3, Super G contains “Normal proceeding”, “Postponed” and “Cancelled” actions. Different actions can be triggered by different conditions. One of the conditions of “Normal proceeding”, c1 in Figure 3, consists of four meteorological factors, which are air temperature, wind speed, visibility of race tracks, and the amount of snowfall. For the decision of “postponed”, they require the temperature lower than −20 °C and wind speed faster than 11 m/s; the visibility shorter than 20 m for c2, and the temperature lower than −25 °C.
The meteorological department will monitor the meteorological in real-time during the event and issue accurate time weather forecasts at regular intervals. The values of meteorological factors in the forecast are compared with the meteorological indicators in the KG, including wind speed, temperature, humidity, visibility, and snowfall. When the temperature is more than −20 °C, the visibility is more than 500 m, the snowfall is less than 2 cm, KG will return “Normal” behavior characteristic node, then means the event can be held as normal.

3.3.3. Risk Assessment Based on RippleNet

RippleNet is an end-to-end framework that naturally incorporates the KG into recommender systems. The traditional recommendation algorithms have the sparsity of user-item interactions and the cold start problem. RippleNet can discover the potential connection between two items and provide interpretability for recommendation. Through extensive experiments on real-world datasets, researchers demonstrate that RippleNet achieves substantial gains in a variety of scenarios, including movie, book and news recommendation, over several state-of-the-art baselines.
This article applies the RippleNet framework to the risk assessment of the event. On the one hand, the risk assessment of alpine skiing events should combine the existing risk judgment rules. On the other hand, it needs to refer to the experience and knowledge of past events. These historical events correspond to the historical records required for RippleNet model’s recommended tasks. In the recommendation task of KG, the relationship between entities is the potential association between items, such as (Forrest Gump–County–America). For the event risk assessment, the relationship between events is expressed as the similarity of meteorological conditions. Instead of changing the structure of RippleNet, we used knowledge of alpine skiing risk from the KG as input to the model.
The set of meteorological conditions is expressed as U = { u 1 , u 2 , } . The set of alpine skiing events is represented as V = { v 1 , v 2 , } . The interaction matrix between meteorological conditions and events is represented as Y = { y u v u U , v V } , where
y u v = {   1 ,   if   interaction   ( u , v )   is   observed     0 ,   otherwise
In addition to the interaction matrix Y , we also have a KG available, which consists of massive entity–relation–entity triples ( h , r , t ) . The KG is represented as G = { ( h , r , t ) h , t E , r R } . The k-level corresponding set of entities that define the initial conditions as:
ε   u   k = { t ( h , r , t ) G   and   h ε   u   k 1 }
ε   u   0 = V u = { v y u v = 1 } is the relevant event and its risk condition corresponding to the meteorological conditions. This represents the potential risk of the event under such meteorological conditions. The K-order ripple set of meteorological condition u is defined as a triple set with ε   u   k 1 as the head entity:
S u k = { ( h , r , t ) ( h , r , t ) G   and   h ε   u   k 1 } , k = 1 , 2 , , H
The network structure of RippleNet is shown in Figure 4. In the embedding section, the framework uses TransE embedding. Let item-v pass through embedding and then get v R d . That given the historical record of meteorological condition u as V u . The triple ( h i , r i , t i ) of the first-order wave set and the event risk v will calculate a correlation probability p i as follows:
p i = softmax   ( v T R i h i ) = exp ( v T R i h i ) ( h , r , t ) s u 1 exp ( v T R i h i )
The correlation probability p i can be understood as the semantic correlation between the candidate event v and the historical record V u . The head entity h i on the triplet relation r i . The KG of alpine skiing events is expressed as the similarity between events. Then, the potential association propagates from the head entity h i to the tail entity t i on RippleNet, and accumulates at the tail entity. Therefore, taking the correlation probability p i as the weight, all tail entities t i are summed to obtain the potential correlations on first order RippleNet, which is o u 1 :
o u 1 = ( h i , r i , t i ) S u 1 p i t i
Repeat the above steps until get o u H . Each one can itself be an embedding of the meteorological condition u , which is the result of embedding the u . Last, the H vectors are added together:
u = o u 1 + o u 2 + + o u H
Finally, the vector of meteorological condition u and the vector of candidate event v are combined by inner product to get the prediction value of event risk y ^ u v .
y ^ u v = σ ( u T v ) = 1 1 + exp ( u T v )

4. Case Study

4.1. Study Data

In this study, we have collected alpine skiing events data using web crawlers and information extraction techniques from the Winter Olympics, World Cup, World Championships between 2000 and 2020. The data includes events data, risk types that occur, and meteorological data. Meteorological data was collected from the local meteorological department, including real-time hourly forecast data from the venues. The events data mainly includes the text from the FIS website, the mainstream media websites, and the documents provided by the event organizing committee.
According to the above-mentioned method of KG in Section 3, data preprocessing was done at first to make the dataset standardized and accurate. The events data were extracted from the dataset. The entity and attribute information were designed to be directly extracted from structured dataset. After that, with the help of LAC tool [51] (an open source word segmentation tool) and self-built domain dictionary, the text data were further processed. Words were segmented and their part of speech were tagged, the stop words were also removed. The object, characteristic, and relationship information were finally extracted and fused by relation template, and the triplet set of alpine skiing event knowledge was obtained. All the knowledge was stored and managed using the Neo4j database.

4.2. Experiment Setup

We obtain the risk events occurring in the research event, and count the attribute values of relevant local meteorological conditions when each risk event occurs. The statistical meteorological factors include precipitation, snowfall, visibility, temperature, and wind speed. Each risk event corresponds to data groups containing the values of the above five meteorological factors. All risk events data groups constitute a primary attribute data set. A statistical risk event is recorded as an entity in the KG, and these entities representing risk events are defined as positive samples. The positive sample set consisting of positive samples is defined as p o s = { p 1 , p 2 , , p x , , p y , , p n } . A new set of data is generated for each risk event, and each normal event is recorded as an entity in the KG, that is defined as { s 1 , s 2 , , s x , , s y , , s n } . These entities representing normal events are defined as negative samples, which constitute a negative sample set as n e g = { s 1 , s 2 , , s x , , s y , , s n } . The experimental data contains 70% of positive samples and 30% of negative samples.
There are two relationships between the meteorological conditions of different historical events: similarity and dissimilar. If the relationship between two entities is similar, the two entities are both risk events or normal events. If the relationship between the two entities is not similar, its indicates that one of the two entities is a risk event and the other is normal. In the RippleNet, the two entities are correlated by similarity. For the same type of risk events, the similarity between them is measured according to the prevailing meteorological conditions. The trained RippleNet model was used to predict the probability of the risk.
For the RippleNet, the parameter H (entity link hierarchy) has an impact on the accuracy of the model. A statistical risk event is recorded as an entity in the KG. If the first risk event is similar to the second risk event based on their meteorological conditions, the two events are correlated and the two entities are linked. The second event can be linked to other events, etc. The number of linked entities is parameter H . The H can be set by us during the experiment. Therefore, in this paper, we will perform a sensitivity test on H , analyze the impact of this parameter on the assessment results, and compare the results with the rule-based risk assessment.

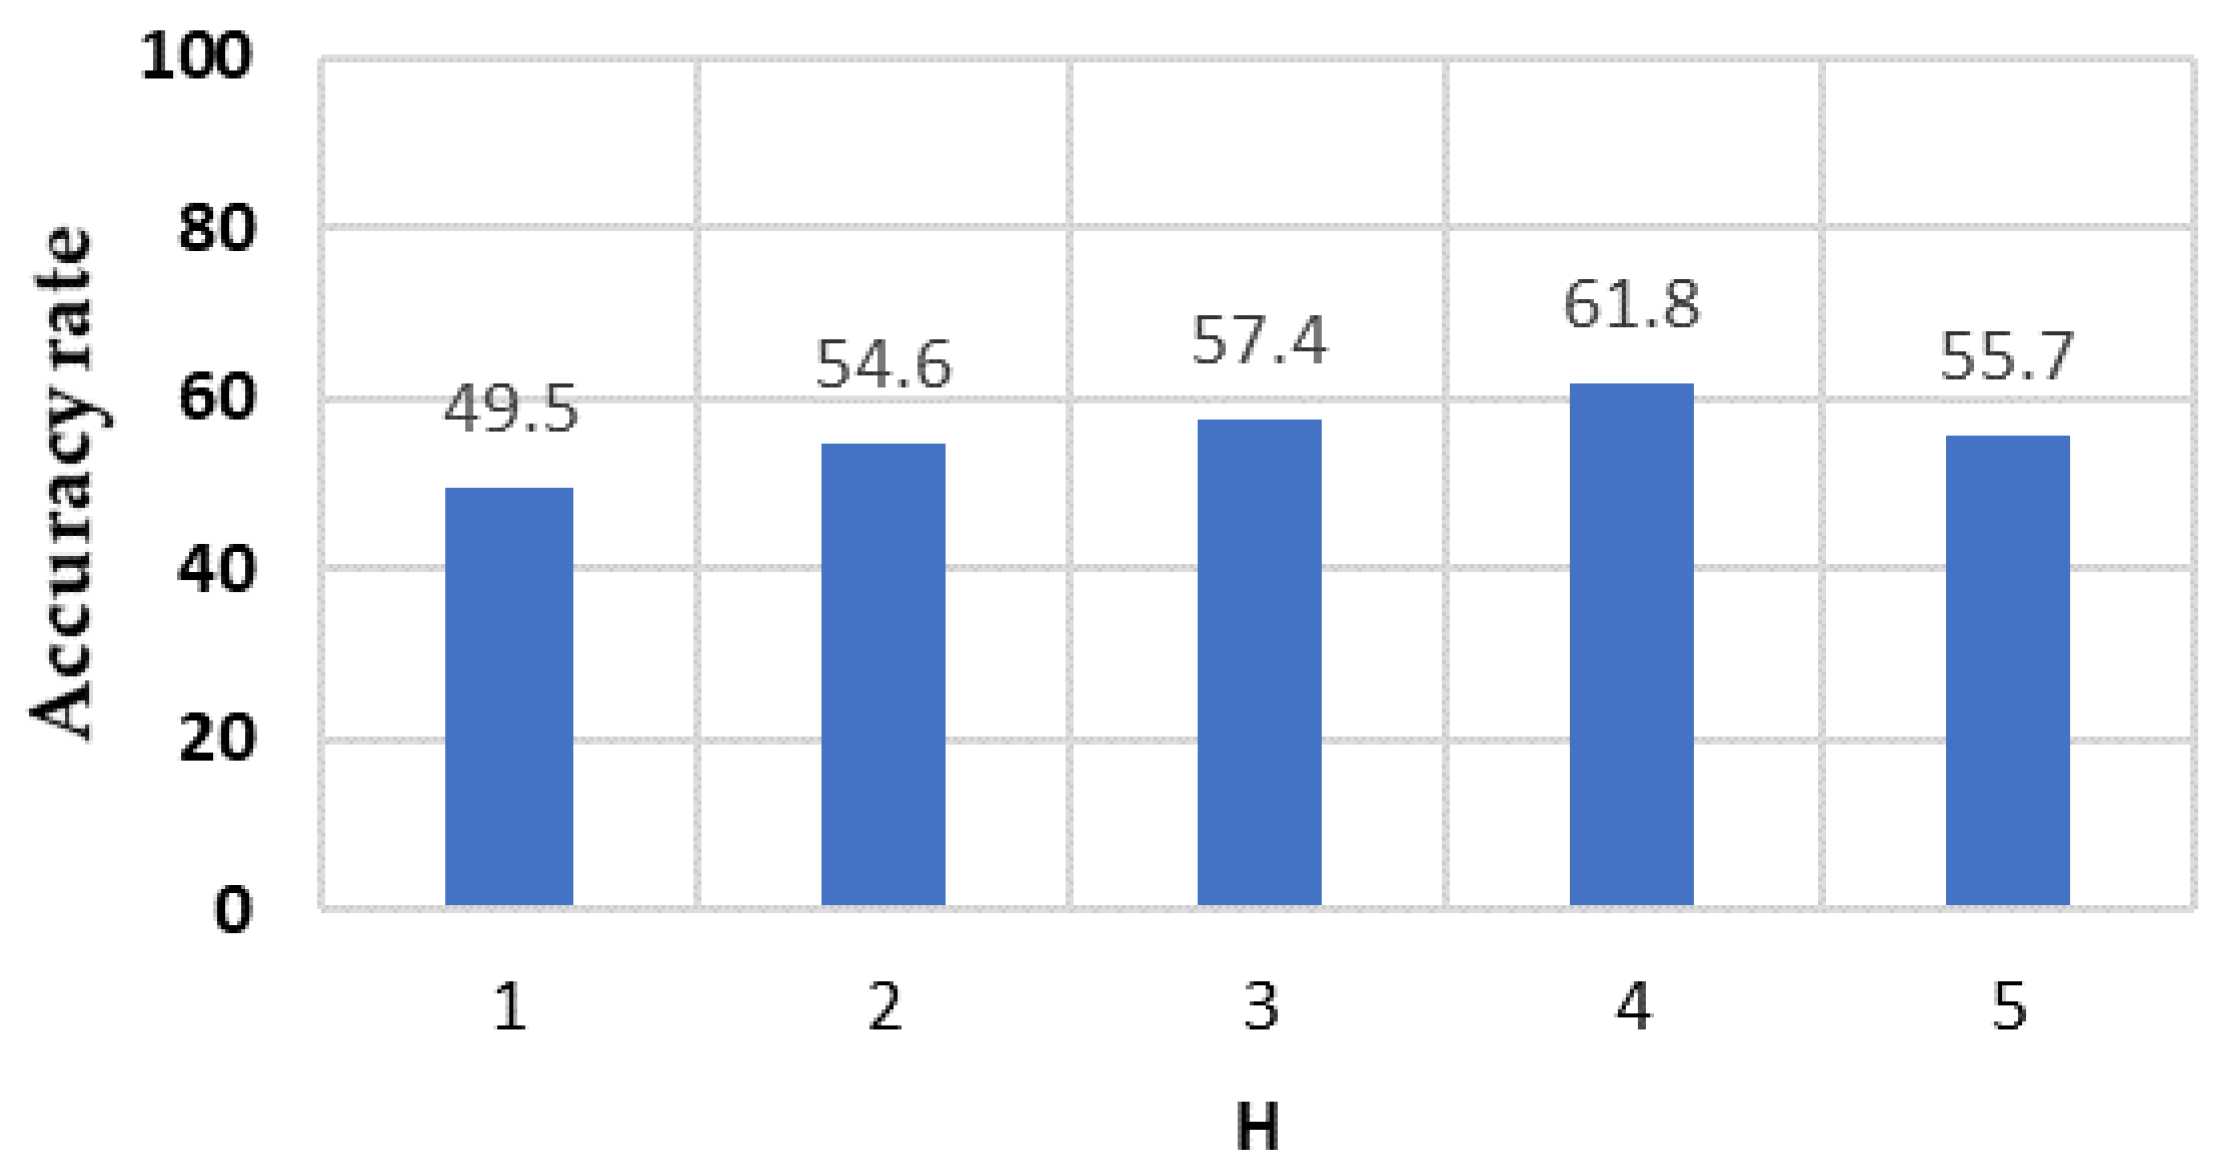
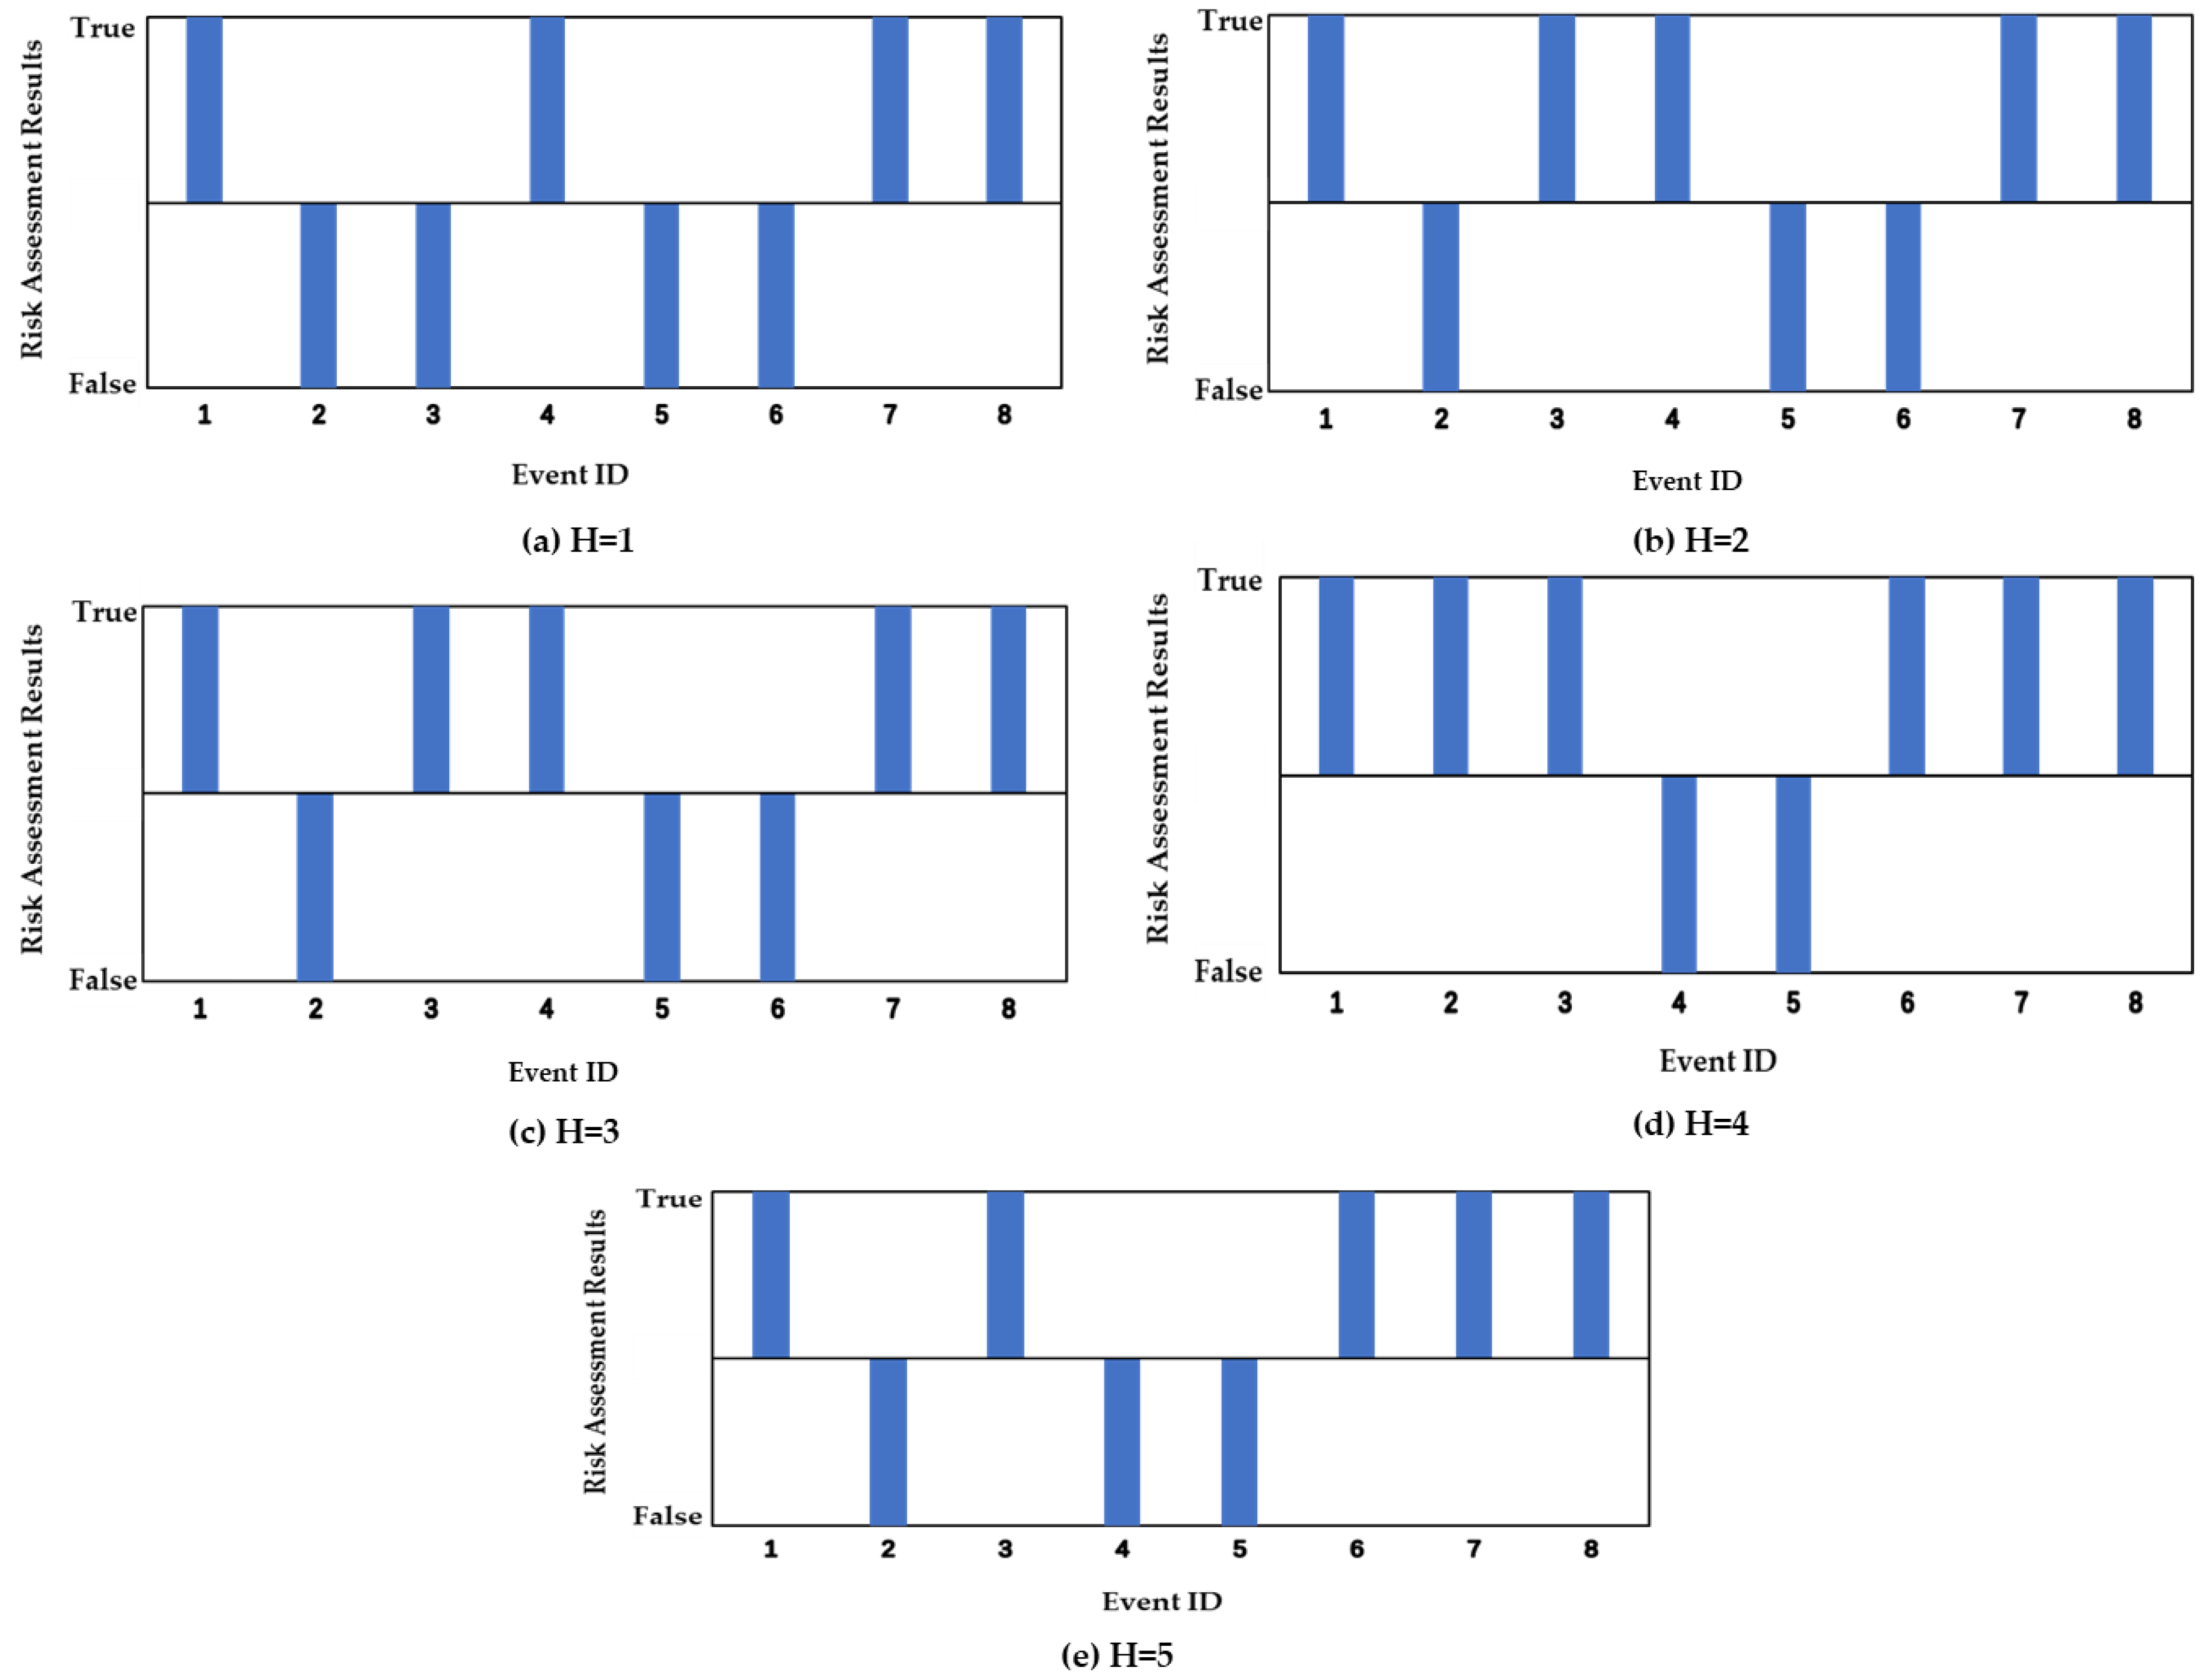
4.3. Events Meteorological Risk Assessment Results

In the case of the Winter Olympics and the World Figure Skating Championships, the Alpine skiing events consists mainly of six categories: Downhill, Slalom, Giant Slalom, Super G, Alpine combined and Team Parallel. In this paper, there are three risk assessment results: normal, postponed and cancelled. Risk assessment of events in the test set is performed using the trained model. Accuracy is used as a metric to measure the model. We have statistically measured the experimental results according to the H parameter, as shown in Figure 5.
As we can see from Figure 5, the accuracy increases as H increases, with the best results at H = 4, and then decreases. Eight groups of sample data from two Winter Olympic Games were selected to display the assessment results under different H parameters, as shown in Table 3. We use the risk indicator rule-based (Table 2) approach for comparison. The RippleNet model with different H values was tested using these 8 sets of data, and the test results are shown in Figure 6. When H = 1, the accuracy was the lowest with four sets of data errors (Figure 6a). When H = 2, H = 3 and H = 5, there were three sets of data errors for the eight samples (Figure 6b,c,e). When H = 4, the assessment accuracy was the highest with two sets of data errors which is Men-Super-G by Alpine in 2018 and Downhill by Vancouver in 2010 (Figure 6d). The former had reached 13.0 m/s of wind speed at the competition venue, and the model assessed that the competition needed to be cancelled. However, the actual situation was that the organizing committee postponed the competition, because the model did not take into account the special nature of the Winter Olympics (the official events cannot be cancelled). In 2010, 1.52 mm of rain fell on the field, and the model assessment indicated that the event could continue, when in fact the organizing committee postponed the event. The margin of error may be due to the fact that during similar events like the Women-Giant-Slalom, 3.30 mm of rain fell, but the race continued as normal.
The experimental results show that the RippleNet model improves accuracy compared to the rule-based approach. Meanwhile, the entity link hierarchy H impacts the accuracy of the model. The accuracy of the model increases as H increases, because the model can learn deeper knowledge. However, the effectiveness of the model decreases when H reaches five instead. As there are too many layers of entities to consider. The first and last layers of entities may not be highly correlated, and the initial and last associated risk events do not have many similarities. Although the model makes use of richer knowledge, the model training consumes more computational resources and the risk assessment results are not as expected. In summary, the RippleNet model can give the assessment results close to the display in most cases. Therefore, the RippleNet model based on KG has certain validity and reliability.

5. Conclusions

With the development of information technology in risk management field, a large amount of data has been accumulated. The full utilization of data is of great significance to risk identification and intelligent risk assessment. Since Alpine skiing events are usually held in outdoor environments such as mountains or forests, their success is closely related to meteorological conditions. There are many types of influencing factors in sports events. The traditional risk indicator system has a threshold range for influencing factor indicators, which does not have certain timeliness and dynamics. Furthermore, it lacks the adaptability of the risk assessment indicator system. It cannot adapt to complex sports events today. In order to integrate the KG into the field of risk, this paper is based on the KG to realize the risk assessment of alpine skiing events flexibly and has certain expansibility.
This is a research and application of sports event risk assessment based on the KG. Firstly, we explain the risks existing in the alpine skiing events and the necessity of risk assessment, expound the relevant literature review on the early warning of risks, and introduce the main research hotspots and existing problems. Secondly, because of the limitation of the traditional sports event risk indicator system, we propose proposes a KG-based risk assessment of alpine skiing events. We explain the model RippleNet and its structure. Then, an experimental analysis of the KG-based alpine skiing events risk assessment was carried out, and the appropriate sample data was selected. The RippleNet model was trained to calculate the training error results of the input results. By comparing the output data with the theoretical data, it is found that the method proposed in this paper is effective and reliable.
This research has a specific reference value for the meteorological risk assessment of alpine skiing events, but some problems still need further study. The first is to increase the types of parameters used to assess the risk of the event. We hope to add evaluation indicators other than meteorological conditions to improve the accuracy of model evaluation. The second is to conduct in-depth research on the chain reaction of meteorological conditions in the sport events. In this way, the role of KGs in knowledge services can be fully realized.

Author Contributions

Conceptualization, Muhua Wang and Xueying Zhang; methodology, Xueying Zhang; software, Yipeng Wang; validation, Deen Feng and Wei Tang; formal analysis, Yipeng Wang; investigation, Xueying Zhang; resources, Deen Feng and Wei Tang; data curation, Deen Feng and Peng Ye; writing—original draft preparation, Yipeng Wang; writing—review and editing, Wei Tang, Xueying Zhang and Peng Ye; visualization, Yipeng Wang; supervision, Muhua Wang; project administration, Muhua Wang and Xueying Zhang; funding acquisition, Muhua Wang and Xueying Zhang. All authors have read and agreed to the published version of the manuscript.

Funding

This work was funded in part by the National Key Research and Development Program of China under Grant 2018YFF0300100 and Grant 2018YFF0300105, and in part by the National Natural Science Foundation of China under Grant 41631177 and Grant 41971337.

Data Availability Statement

Not applicable.

Conflicts of Interest

The authors declare no conflict of interest.

References

  1. Hanstad, D.V. Risk management in major sporting events: A participating national Olympic team’s perspective. Event Manag. 2012, 16, 189–201. [Google Scholar] [CrossRef] [Green Version]
  2. Leopkey, B.; Parent, M. Risk Management Issues in Large-scale Sporting Events: A Stakeholder Perspective. Eur. Sport Manag. Q. 2009, 9, 187–208. [Google Scholar] [CrossRef]
  3. Guo, L. The Mapping Knowledge Analysis about Aboard Ski Sport Risk Research. Sports Res. Educ. 2018, 33, 35–39. [Google Scholar]
  4. Yang, B.; Liao, Y. Research on the construction and application of knowledge graph for enterprise dynamic risk. J. Mod. Inf. 2021, 41, 110–120. [Google Scholar]
  5. Wang, H.; Zhang, F.; Wang, J.; Zhao, M.; Li, W.; Xie, X.; Guo, M. RippleNet: Propagating User Preferences on the Knowledge Graph for Recommender Systems. In Proceedings of the 27th ACM International Conference on Information and Knowledge Management, Torino, Italy, 22–26 October 2018; pp. 417–426. [Google Scholar]
  6. Wu, F.; Wang, M.; Liu, N. Discussion of the Geo-Hazard Model in US Earthquake Risk Assessment. J. Catastrophol. 2012, 27, 109–113. [Google Scholar]
  7. Alaka, H.A.; Oyedele, L.O.; Owolabi, H.A.; Kumar, V.; Ajayi, S.O.; Akinade, O.O.; Bilal, M. Systematic review of bankruptcy prediction models: Towards a framework for tool selection. Expert Syst. Appl. 2018, 94, 164–184. [Google Scholar] [CrossRef]
  8. Fuller, C.; Drawer, S. The application of risk management in sport. Sports Med. 2004, 34, 349–356. [Google Scholar] [CrossRef] [PubMed]
  9. Liu, Y.; Su, Y. Early-warning model of regional geological disasters based on meteorological factor in Qingchuan County, Sichuan Province. J. Eng. Geol. 2019, 27, 134–143. [Google Scholar] [CrossRef]
  10. Zhang, J. Real-Time Traffic Accidents Potential Prediction of Express Way Based on Feature Selection. Master’s Thesis, Beijing Jiaotong University, Beijing, China, 2018. [Google Scholar]
  11. Chang, P.C.; Singh, K.K. Risk management for mega-events: The 1988 olympic winter games. Tour. Manag. 1990, 11, 45–52. [Google Scholar] [CrossRef]
  12. Huang, K. Prospective study on the operation risk of alpine skiing site in the 2022 Winter Olympic Games. Master’s Thesis, Beijing Sport University, Beijing, China, 2019. [Google Scholar]
  13. Liang, H.; Hou, Y.; Xue, H. Sports event risk warning model based on BP neural network. Stat. Decis. 2018, 34, 85–88. [Google Scholar]
  14. Shi, Y.; Huo, X. The mapping knowledge analysis of sport risk domain research. China Sport Sci. 2017, 37, 76–86. [Google Scholar]
  15. Huo, D.; Qiu, H.; Qiu, J. Risk early-warning and coping strategies of major sports events. J. Shenyang Sport Univ. 2014, 33, 6–11. [Google Scholar]
  16. Berlonghi, A.E. The Special Event Risk Management Manual; Alexander Berlonghi/Self Published: Dana Point, CA, USA, 1990. [Google Scholar]
  17. Robin, A.; Southall, R.M.; Ballier, D.A. Sports Venue Event Planning and Risk Management; Liaoning Science and Technology Publishing House: Shenyang, China, 2005. [Google Scholar]
  18. Yuan, F. Research on Risk Management during Competition of Short Track Speed Skating in Winter Olympic Games in 2022. Master’s Thesis, Beijing Sport University, Beijing, China, 2019. [Google Scholar]
  19. Rausand, M. Risk Assessment: Theory, Methods, and Applications; John Wiley & Sons: Hoboken, NJ, USA, 2013; Volume 115. [Google Scholar]
  20. Ho, K.; Leroi, E.; Roberds, B. Quantitative Risk Assessment: Application, Myths and Future Direction. In Proceedings of the ISRM International Symposium, Melbourne, Australia, 19–24 November 2000; p. ISRM-IS-2000-2006. [Google Scholar]
  21. Ehrlinger, L.; Wöß, W. Towards a Definition of Knowledge Graphs. Semantics 2016, 48, 1–4. [Google Scholar]
  22. Yan, J.; Wang, C.; Cheng, W.; Gao, M.; Zhou, A. A retrospective of knowledge graphs. Front. Comput. Sci. 2018, 12, 55–74. [Google Scholar] [CrossRef]
  23. Wang, H.F.; Qi, G.L.; Chen, H.J. Knowledge Graph: Methodology, Practice and Application; Publishing House of Electronics Industry: Beijing, China, 2019. [Google Scholar]
  24. Cao, Q.; Zhao, Y. The technical realization process and related applications of the knowledge graph. Inf. Stud. Theory Appl. 2015, 38, 127–132. [Google Scholar]
  25. Xiao, Y. Knowledge Graph Concept and Technology; Publishing House of Electronics Industry: Beijing, China, 2020. [Google Scholar]
  26. Rebele, T.; Suchanek, F.; Hoffart, J.; Biega, J.; Kuzey, E.; Weikum, G. YAGO: A Multilingual Knowledge Base from Wikipedia, Wordnet, and Geonames. In Proceedings of the 15th International Semantic Web Conference, Kobe, Japan, 17–21 October 2016; Volume 9982, pp. 177–185. [Google Scholar]
  27. Bizer, C.; Lehmann, J.; Kobilarov, G.; Auer, S.; Becker, C.; Cyganiak, R.; Hellmann, S. DBpedia—A crystallization point for the Web of Data. J. Web Semant. 2009, 7, 154–165. [Google Scholar] [CrossRef]
  28. Bollacker, K.; Evans, C.; Paritosh, P.; Sturge, T.; Taylor, J. Freebase: A Collaboratively Created Graph Database for Structur-ing Human Knowledge. In Proceedings of the 2008 ACM SIGMOD International Conference on Management of Data, Vancouver, BC, Canada, 9–12 June 2008; pp. 1247–1250. [Google Scholar]
  29. Carlson, A.; Betteridge, J.; Kisiel, B.; Settles, B.; Hruschka, E.; Mitchell, T. Toward an architecture for never-ending language learning. In Proceedings of the Twenty-Fourth AAAI Conference on Artificial Intelligence, Atlanta, GA, USA, 11–15 July 2010; pp. 1306–1313. [Google Scholar]
  30. Niu, X.; Sun, X.; Wang, H.; Rong, S.; Qi, G.; Yu, Y. Zhishi. me-weaving chinese linking open data. In Proceedings of the 10th International Semantic Web Conference, Bonn, Germany, 23–27 October 2011; Volume 7032, pp. 205–220. [Google Scholar]
  31. Tao, X.; Pham, T.; Zhang, J.; Yong, J.; Goh, W.P.; Zhang, W.; Cai, Y. Mining health knowledge graph for health risk prediction. World Wide Web 2020, 23, 2341–2362. [Google Scholar] [CrossRef]
  32. Zhang, Q.; Wen, Y.; Zhou, C.; Long, H.; Han, D.; Zhang, F.; Xiao, C. Construction of Knowledge Graphs for Maritime Dangerous Goods. Sustainability 2019, 11, 2849. [Google Scholar] [CrossRef] [Green Version]
  33. Yu, T.; Li, J.; Yu, Q.; Tian, Y.; Shun, X.; Xu, L.; Zhu, L.; Gao, H. Knowledge graph for TCM health preservation: Design, construction, and applications. Artif. Intell. Med. 2017, 77, 48–52. [Google Scholar] [CrossRef]
  34. Wu, J.; Zhu, X.; Zhang, C.; Hu, Z. Event-centric Tourism Knowledge Graph—A Case Study of Hainan. In Proceedings of the International Conference on Knowledge Science, Engineering and Management, Hangzhou, China, 28–30 August 2020; Volume 12274, pp. 3–15. [Google Scholar]
  35. Rotmensch, M.; Halpern, Y.; Tlimat, A.; Horng, S.; Sontag, D. Learning a Health Knowledge Graph from Electronic Medical Records. Sci. Rep. 2017, 7, 5994. [Google Scholar] [CrossRef]
  36. Wenhui, L.; Fengtian, C.; Chuna, W.; Xingkai, M. Bayesian Network-Based Knowledge Graph Inference for Highway Transportation Safety Risks. Adv. Civ. Eng. 2021, 2021, 6624579. [Google Scholar] [CrossRef]
  37. Zhang, W.; Liu, Y.; Jiang, L.; Shah, N.; Fei, X.; Cai, H. The Construction of a Domain Knowledge Graph and Its Application in Supply Chain Risk Analysis. In Proceedings of the Advances in E-Business Engineering for Ubiquitous Computing, Shanghai, China, 11–13 October 2019; Springer: Berlin/Heidelberg, Germany, 2020; Volume 41, pp. 464–478. [Google Scholar]
  38. Zhao, Q.; Li, Q.; Wen, J. Construction and application research of knowledge graph in aviation risk field. MATEC Web Conf. 2018, 151, 05003. [Google Scholar] [CrossRef]
  39. Liu, Y.; Li, H. Survey on domain knowledge graph research. Comput. Syst. Appl. 2020, 29, 1–12. [Google Scholar]
  40. Zheng, R.; Ma, H.; Wang, Q.; Fu, J.; Jiang, Z. Assessing the Security of Campus Networks: The Case of Seven Universities. Sensors 2021, 21, 306. [Google Scholar] [CrossRef]
  41. Liu, P.; Huang, Y.; Wang, P.; Zhao, Q.; Nie, J.; Tang, Y.; Sun, L.; Wang, H.; Wu, X.; Li, W. Construction of Typhoon Disaster Knowledge Graph Based on Graph Database Neo4j. In Proceedings of the 2020 Chinese Control and Decision Conference (CCDC), Hefei, China, 22–24 August 2020; IEEE: Piscataway Township, NJ, USA, 2020; pp. 3612–3616. [Google Scholar]
  42. Carriger, J.F.; Parker, R.A. Conceptual Bayesian networks for contaminated site ecological risk assessment and remediation support. J. Environ. Manag. 2021, 278, 111478. [Google Scholar] [CrossRef] [PubMed]
  43. Yang, B.; Yang, M. Research on Enterprise Knowledge Service Model and Application of the Risk Event Driven. Inf. Stud. Theory Appl. 2021, 44. Available online: https://link.springer.com/article/10.1007/s00521-021-06382-z (accessed on 10 December 2021).
  44. Cheng, D.; Yang, F.; Xiang, S.; Liu, J. Financial time series forecasting with multi-modality graph neural network. Pattern Recognit. 2022, 121, 108218. [Google Scholar] [CrossRef]
  45. Tissot, H.C.; Pedebos, L.A. Improving Risk Assessment of Miscarriage during Pregnancy with Knowledge Graph Embeddings. J. Heal. Inform. Res. 2021, 5, 359–381. [Google Scholar] [CrossRef]
  46. Jiang, B.; You, X.; Li, K.; Zhou, X.; Wen, H. Interactive visual analysis of COVID⁃19 epidemic situation using geographic knowledge graph. Geomat. Inf. Sci. Wuhan Univ. 2020, 45, 836–845. [Google Scholar] [CrossRef]
  47. Murav’Ev, A.V.; Kiktev, D.B.; Bundel’, A.Y.; Dmitrieva, T.G.; Smirnov, A.V. Verification of high-impact weather event forecasts for the region of the Sochi-2014 Olympic Games. Part I: Deterministic forecasts during the test period. Russ. Meteorol. Hydrol. 2015, 40, 584–597. [Google Scholar] [CrossRef]
  48. Scott, D.; Steiger, R.; Rutty, M.; Fang, Y. The changing geography of the Winter Olympic and Paralympic Games in a warmer world. Curr. Issues Tour. 2019, 22, 1301–1311. [Google Scholar] [CrossRef]
  49. Tarka, M.C.; Davey, A.; Lonza, G.C.; O’Brien, C.M.; Delaney, J.P.; Endres, N.K. Alpine Ski Racing Injuries. Sports Heal. A Multidiscip. Approach 2019, 11, 265–271. [Google Scholar] [CrossRef] [PubMed]
  50. Aven, T. A risk concept applicable for both probabilistic and non-probabilistic perspectives. Saf. Sci. 2011, 49, 1080–1086. [Google Scholar] [CrossRef]
  51. Jiao, Z.; Sun, S.; Sun, K. Chinese lexical analysis with deep Bi-GRU-CRF network. arXiv 2018, arXiv:1807.01882. [Google Scholar]
Figure 1. Research framework of alpine skiing events risk assessment.
Ijgi 10 00835 g001
Figure 2. Part of the alpine skiing events KG for Neo4j visualization tool.
Ijgi 10 00835 g002
Figure 3. The representation of risk assessment rules in KG.
Ijgi 10 00835 g003
Figure 4. RippleNet structure for alpine skiing event risk assessment.
Ijgi 10 00835 g004
Figure 5. The accuracy of the risk assessment depending on the different H.
Ijgi 10 00835 g005
Figure 6. Experimental results for 8 groups of sample data depending on the different H.
Ijgi 10 00835 g006
Table 1. Some risk events of alpine skiing.
No.YearCountryCityRisk Events and Meteorological Conditions
12006ItalyTurinThe snowfall caused the temporary structure to collapse
22006ItalyTurinWomen’s Super-G postponed for 1 day due to bad weather
31998JapanNaganoAlpine skiing event postponed for 2 days due to bad weather
41992FranceAlbertvilleAthlete hits the snow machine resulting in death
51984YugoslaviaSarajevoMen’s and women’s downhill postponed due to bad weather
61964AustriaInnsbruckTwo athletes died in an accident due to insufficient snowfall
Table 2. Meteorological risk indicators for alpine skiing events.
Threshold IndexSnowfall (cm)Wind Speed (m/s)Visibility (m)Precipitation (mm)Temperature (°C)
Critical threshold>30 cm1. Average wind speed > 17 m/s
2. gust velocity > 17 m/s
The track < 20 m15 mm/6 h<−25 °C
Decision point>15 cm and < 30 cmAverage wind speed > 11 cm and <17 m/sA part of track < 20 m>0 mm
basic conditions1. >5 cm
2. >2 cm/2 h
gust velocity > 14 cm and >17 m/sThe track > 20 m and <50 m
Table 3. Results of meteorological risk assessment for 8 alpine skiing events.
Event IDRisk EventMeteorological ConditionsActualRule-Based
Results
12018 Pyeongchang-Alpine
Men-Downhill
Wind: 12.0 m/spostponedpostponed
22018 Pyeongchang-Alpine
Women-Slalom
Wind: 11.0 m/spostponedpostponed
32018 Pyeongchang-Alpine
Men-Super-G
Wind: 13.0 m/spostponednormal
42018 Pyeongchang-Alpine
Women-Alpine-Combined
Wind: 10.0 m/spostponednormal
52010 Vancouver-Alpine
Men-Downhill
Rainfall: 1.52 mmpostponednormal
62010 Vancouver-Alpine
Women-Super-Combined
Rainfall: 10.41 mmpostponednormal
72010 Vancouver-Alpine
Men-Super-Combined
Rainfall: 15.24 mmpostponedpostponed
82010 Vancouver-Alpine
Women-Giant-Slalom
Rainfall: 3.30 mmnormalnormal
Publisher’s Note: MDPI stays neutral with regard to jurisdictional claims in published maps and institutional affiliations.

