Article

Functional Classification of Urban Parks Based on Urban Functional Zone and Crowd-Sourced Geographical Data

1
Faculty of Geomatics, Lanzhou Jiaotong University, Lanzhou 730070, China
2
Institute of Remote Sensing and GIS, Peking University, Beijing 100871, China
3
College of Geoscience and Surveying Engineering, China University of Mining and Technology, Beijing 100083, China
*
Author to whom correspondence should be addressed.
ISPRS Int. J. Geo-Inf. 2021, 10(12), 824; https://doi.org/10.3390/ijgi10120824
Submission received: 23 September 2021 / Revised: 18 November 2021 / Accepted: 27 November 2021 / Published: 6 December 2021

Abstract

:
Urban parks have important impacts on urban ecosystems and in disaster prevention. They also have diverse social functions that are important to the living conditions and spatial structures of cities. Identifying and classifying the different types of urban parks are important for analyzing the sustainable development and the greening progress in cities. Existing studies have predominantly focused on the data extraction of urban green spaces as a whole, while there have been relatively few studies that have considered different categories of urban parks and their impact, which makes it difficult to characterize or predict the spatial distribution and structures of urban parks and limits further refinement of urban research. At present, the classification of urban parks relies on the physical features observed in remote sensing images, but these methods are limited when mapping the diverse functions and attributes of urban parks. Crowd-sourced geographic data may more accurately express the social functions of points of interest (POIs) in cities, and, therefore, employing open data sources may assist in data extraction and the classification of different types of urban parks. This paper proposed a multi-source data fusion approach for urban park classification including POI and urban functional zone (UFZ) data. First, the POI data were automatically reclassified using improved natural language processing (NLP) (i.e., text similarity measurements and topic modeling) to establish the links between urban park green-space types and POIs. The reclassified POI data as well as the UFZ data were then subjected to scene-based data fusion, and various types of urban parks were extracted using data attribute analysis and social attribute recognition for urban park mapping. Experimental analysis was conducted across Beijing and Hangzhou to verify the effectiveness of the proposed method, which had an overall classification accuracy of 82.8%. Finally, the urban park types of the two cities were compared and analyzed to obtain the characteristics of urban park types and structures in the two cities, which have different climates and urban structures.

1. Introduction

Urban green spaces play an important role in urban ecosystems [1,2], and they can include many types of spaces, such as protective green spaces, educational and scientific green spaces, and residential land used as accessory green spaces. Changing the composition and layout of urban green spaces can improve the quality of ecosystem services, thus ensuring more sustainable urban development [3]. Urban parks are an integral part of urban green spaces and provide important ecosystem services [4]. They impact the ecological balance, the environmental beautification, and the quality of life for residents in cities. In recent years, the rapid urbanization process has created large areas of artificial, impervious surfaces that have replaced the native natural areas such as grasslands, wetlands, and forests [5]. This has led to a year-over-year reduction in urban green spaces [6] that has also caused a series of problems, such as changes in the urban environment [7], a decline in the quality of life for urban residents [8], and the destruction of urban ecosystems [4].
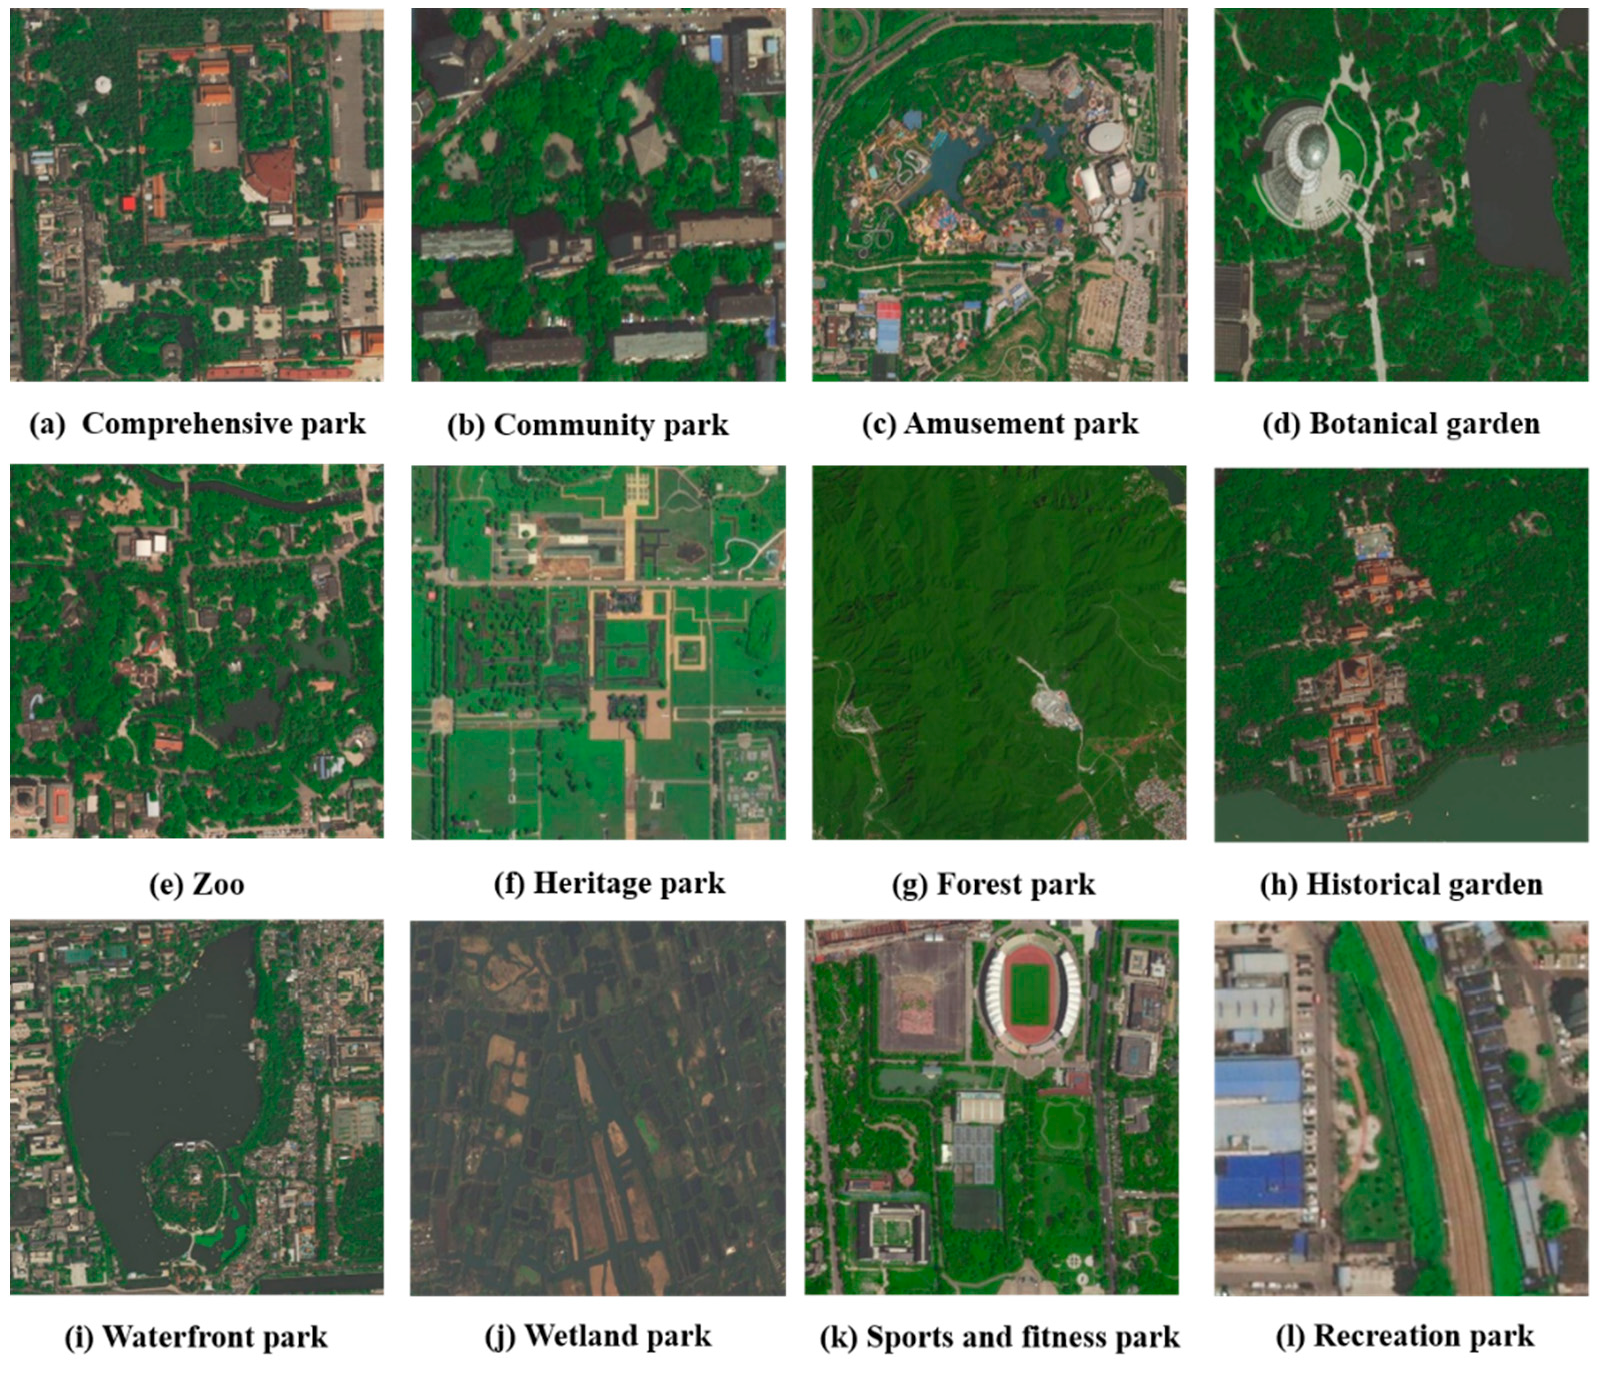
As the number of studies regarding urban parks increases, detailed maps that include the social functions and the spatial structures of urban parks are in high demand. Any city, regardless of its level of development, faces the challenge of effective planning and construction of urban parks, especially as creative land use options and variations continue to expand. Data extraction of urban parks is an important step for urban park mapping that can identify various types of urban parks using data fusion and accurately presenting them on a map. According to the GB 51346-2019 Urban Green Space Planning Standards (the recommended national standards of China) [
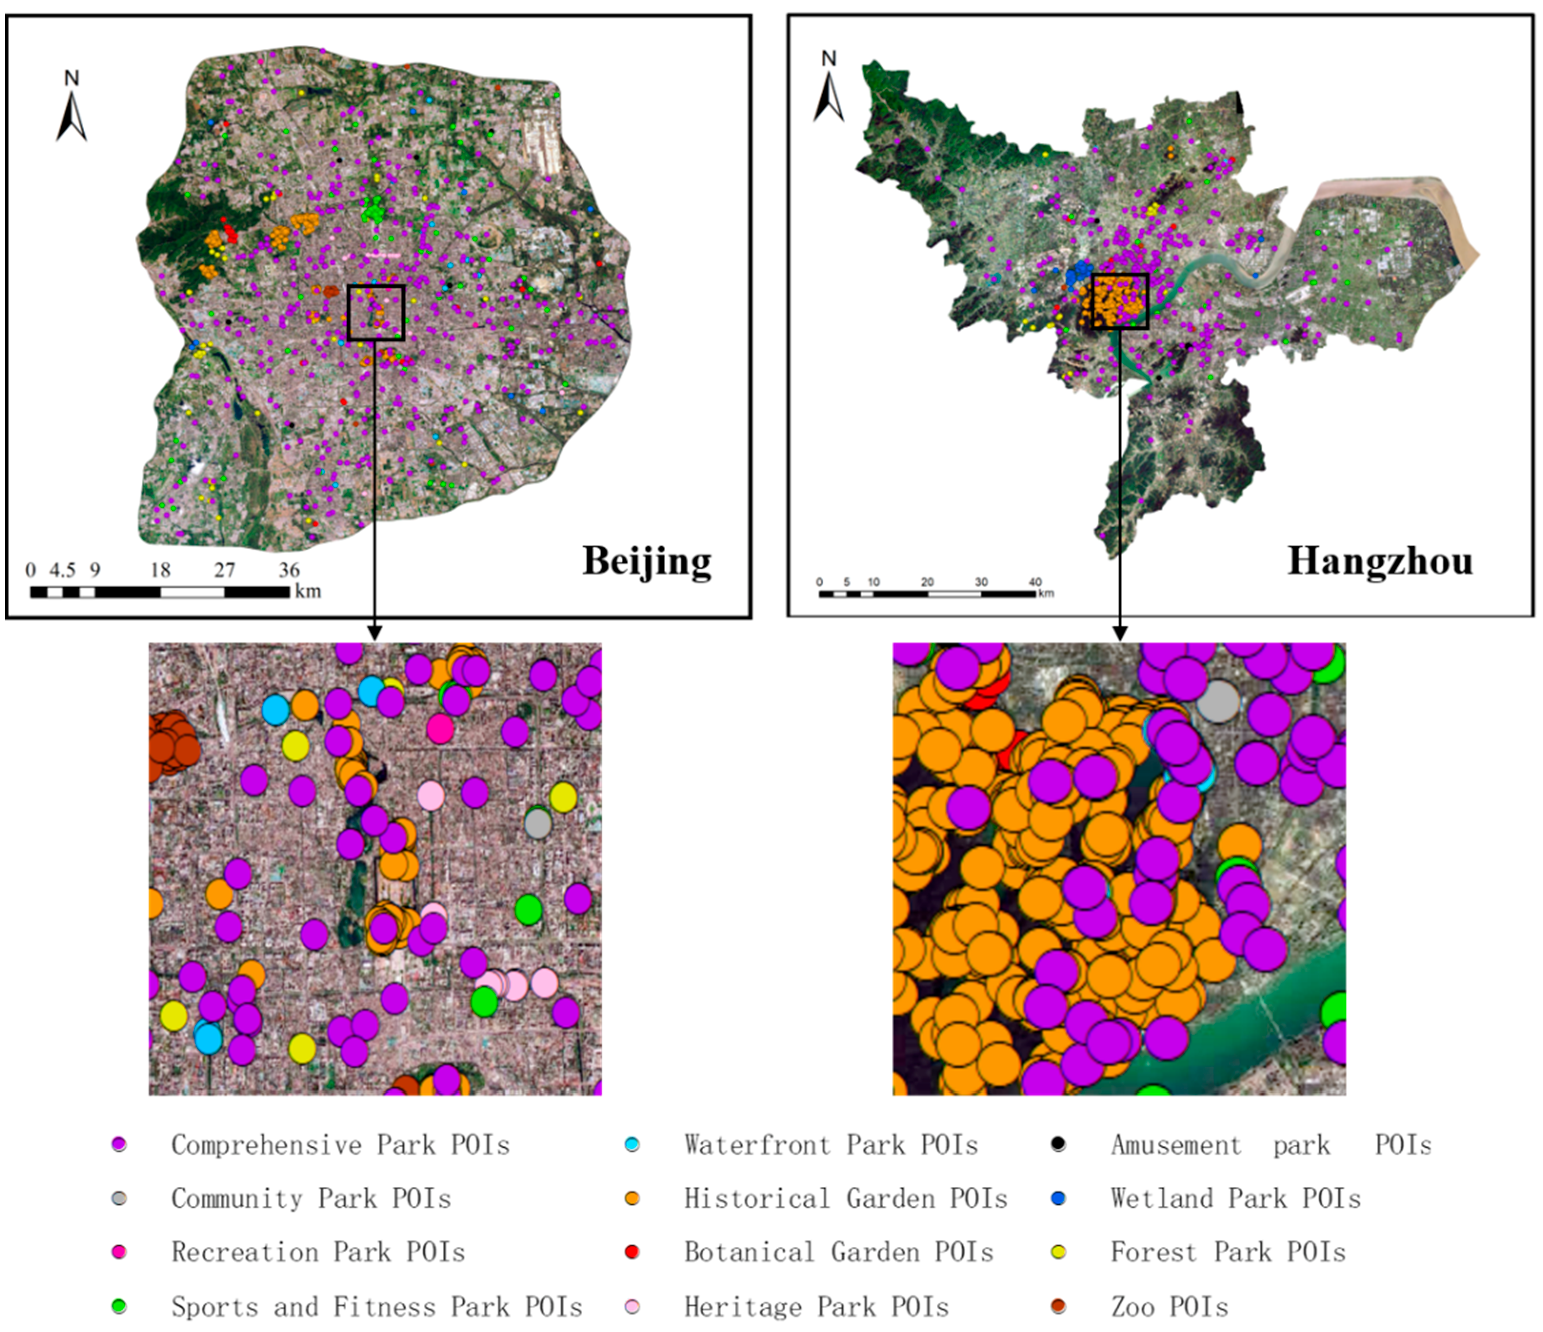
9], urban parks in China are divided into 12 types (Figure 1), each of which has a specific social function (Table 1). For example, botanical gardens have been described as scientific research units that investigate, collect, and share scientific knowledge about plants as well as provide gardens that the public can tour and enjoy, whereas community parks have been categorized as centralized green spaces for the sole benefit of residents. Each type of urban park has been linked to its surrounding environment and the quality of life for the residents. Thus, urban park mapping is crucial for a more refined analyses of urban development, planning more sustainable and healthy cities.
In recent years, the acceleration of urbanization has led to the formation of, as well as changes to, various functional zones, such as residential, commercial, and industrial areas, in cities to meet the residents’ diverse socio-economic needs [10,11]. However, the diversity of urban parks as well as, for some, their lack of unique physical features to differentiate them have limited the information acquired using remote sensing data extraction. As a basic unit of urban planning and management, urban functional zone (UFZ) data have played an important role in analyzing spatial structures of cities and understanding their physical and social attributes [12,13]. UFZ-based data extraction has been the basis for documenting the processes of urbanization and construction, evaluating the urban ecological environment, analyzing urban spatial patterns, and promoting zoned spatial planning and sustainable development. For example, Hu et al. [
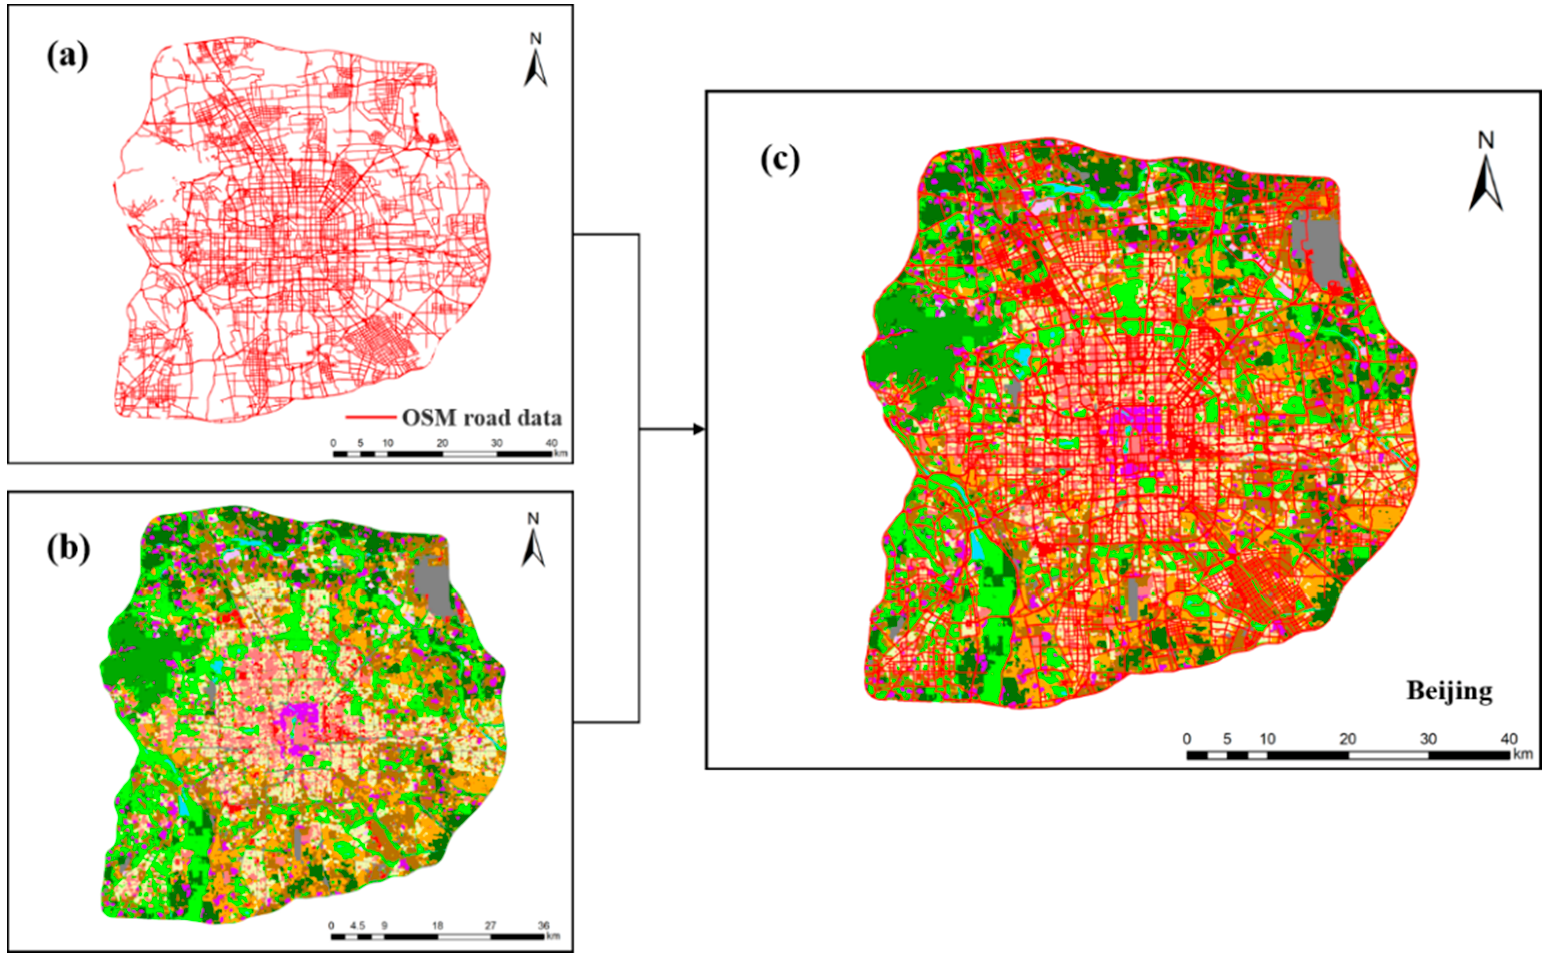
14] extracted parcel cells from OpenStreetMap (OSM) road data and used points of interest (POIs) data and Landsat images to produce urban land use maps according to similarity and thresholding methods. Zhang et al. [15] used very-high-resolution (VHR) satellite imagery and POI data to classify UFZs in Beijing using a hierarchical semantic cognition (HSC) approach that effectively delineated UFZs. Huang et al. [16] proposed a semi-transferred deep convolutional neural network (STDCNN) method for maintaining the integrity of urban land-use patterns and improving the accuracy of urban land use maps. Du et al. [10] proposed a target-based mapping method for UFZs extracted using VHR remote sensing imagery, which overcame the shortcomings of predetermined mapping units. Voltersen et al. [17] used land cover information to characterize urban neighborhoods and then applied a collaborative approach based on knowledge and statistical feature selection to define urban structure types. Zhang and Du [18] proposed a top-down and bottom-up iterative approach to land cover and UFZ classification, which significantly improved land cover and functional zone mapping. Du [19] also proposed a method for large-scale UFZ mapping that combined remote sensing imagery and open-urban data using a combination of latent Dirichlet allocation (LDA) and a support vector machine (SVM) to classify segmented UFZs by integrating physical features from the remote sensing imagery with the attribute features from POI data. Although these studies have been able to differentiate UFZs and refine basic information extraction, related studies on UFZs have overlooked other data, such as the spatial distribution and social attributes of urban parks. Therefore, data extraction based on UFZs cannot distinguish between different types of urban parks.
As crowd-sourced geographic data have become increasingly accessible, its application in urban research has expanded as well [20,21,22]. As compared to remote sensing data, crowd-sourced geographic data have obvious advantages: The “sensors” involved in obtaining the data are individuals using smart devices (e.g., mobile phones, computers, etc.) that reflect their activities at a granular level, and they capture socio-economic characteristics [23]. As UFZ data do not include these two characteristics, crowd-sourced geographic data can be used to supplement UFZ data [24]. In the era of big data, various sources for crowd-sourced geographical data are available, including mobile phone information, digital maps, public transportation information, etc., all of which include multitudes of data points. For example, POI data contain rich contextual information (e.g., name, address, coordinates, type, etc.) [25] that offers in-depth details, large coverage areas, and accurate location information. In addition, POI name attributes are described using natural language [26]. However, POI data are expressed in the form of point-feature information, which only represents data related to the physical location; thus, POI data must be combined with other remote sensing data to extract the scope and type data of urban parks. While recent studies have integrated UFZ and POI data for their purposes, none have employed a similar method for urban park mapping, but they have suggested that using the attribute information extracted from POI data could be beneficial for urban parks mapping [27,28].
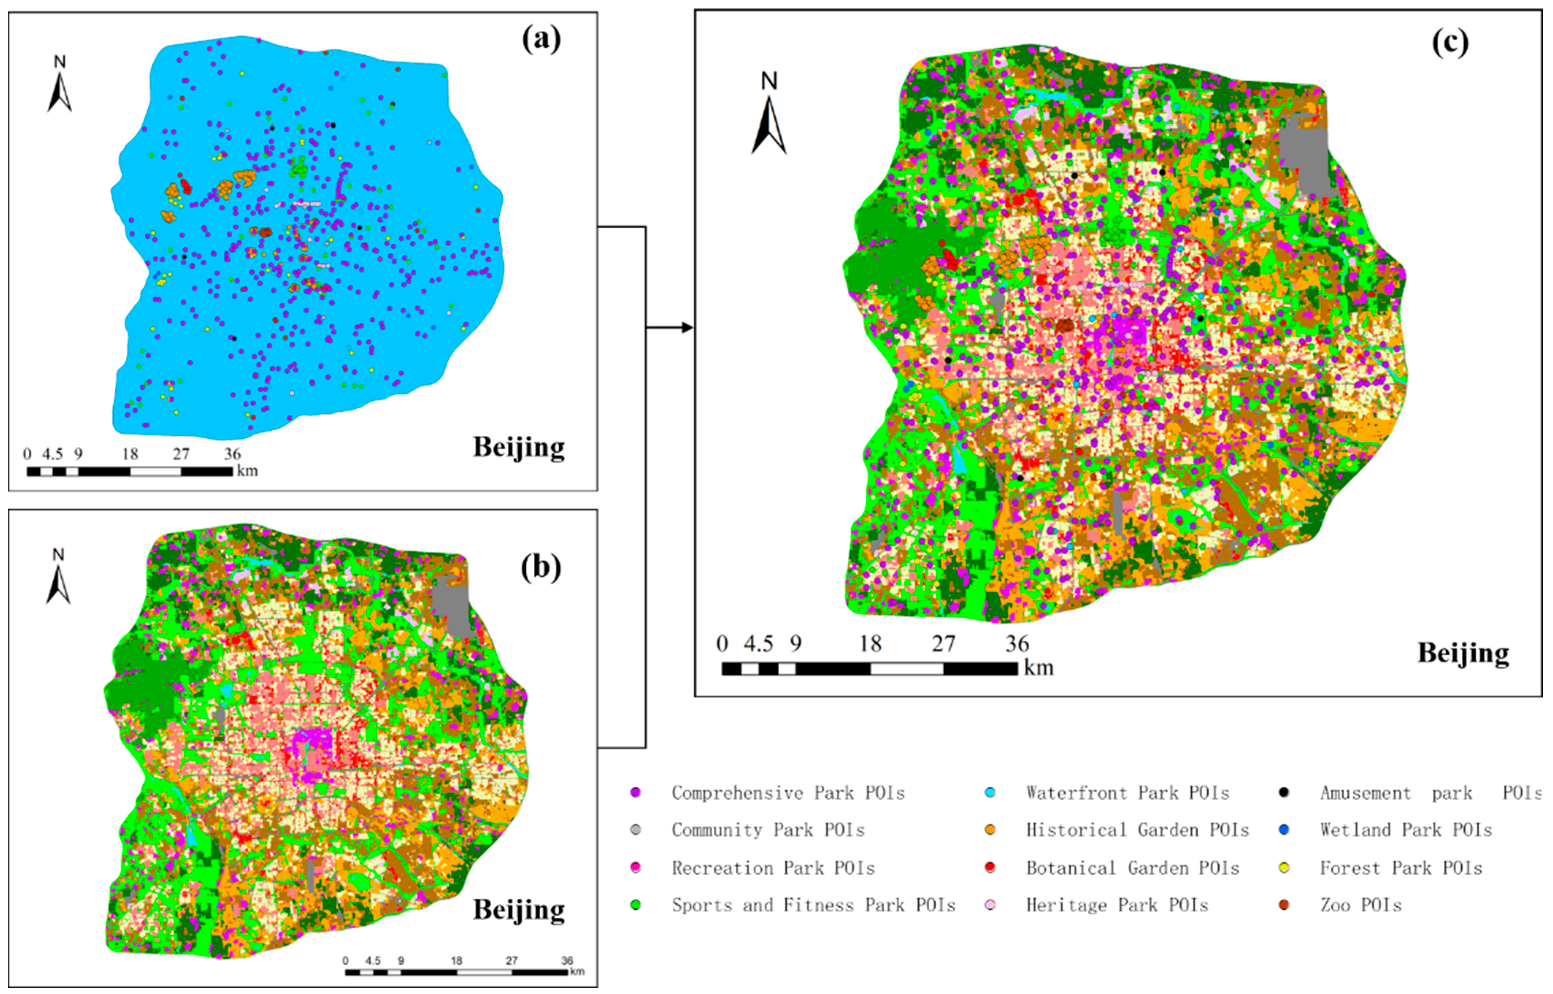
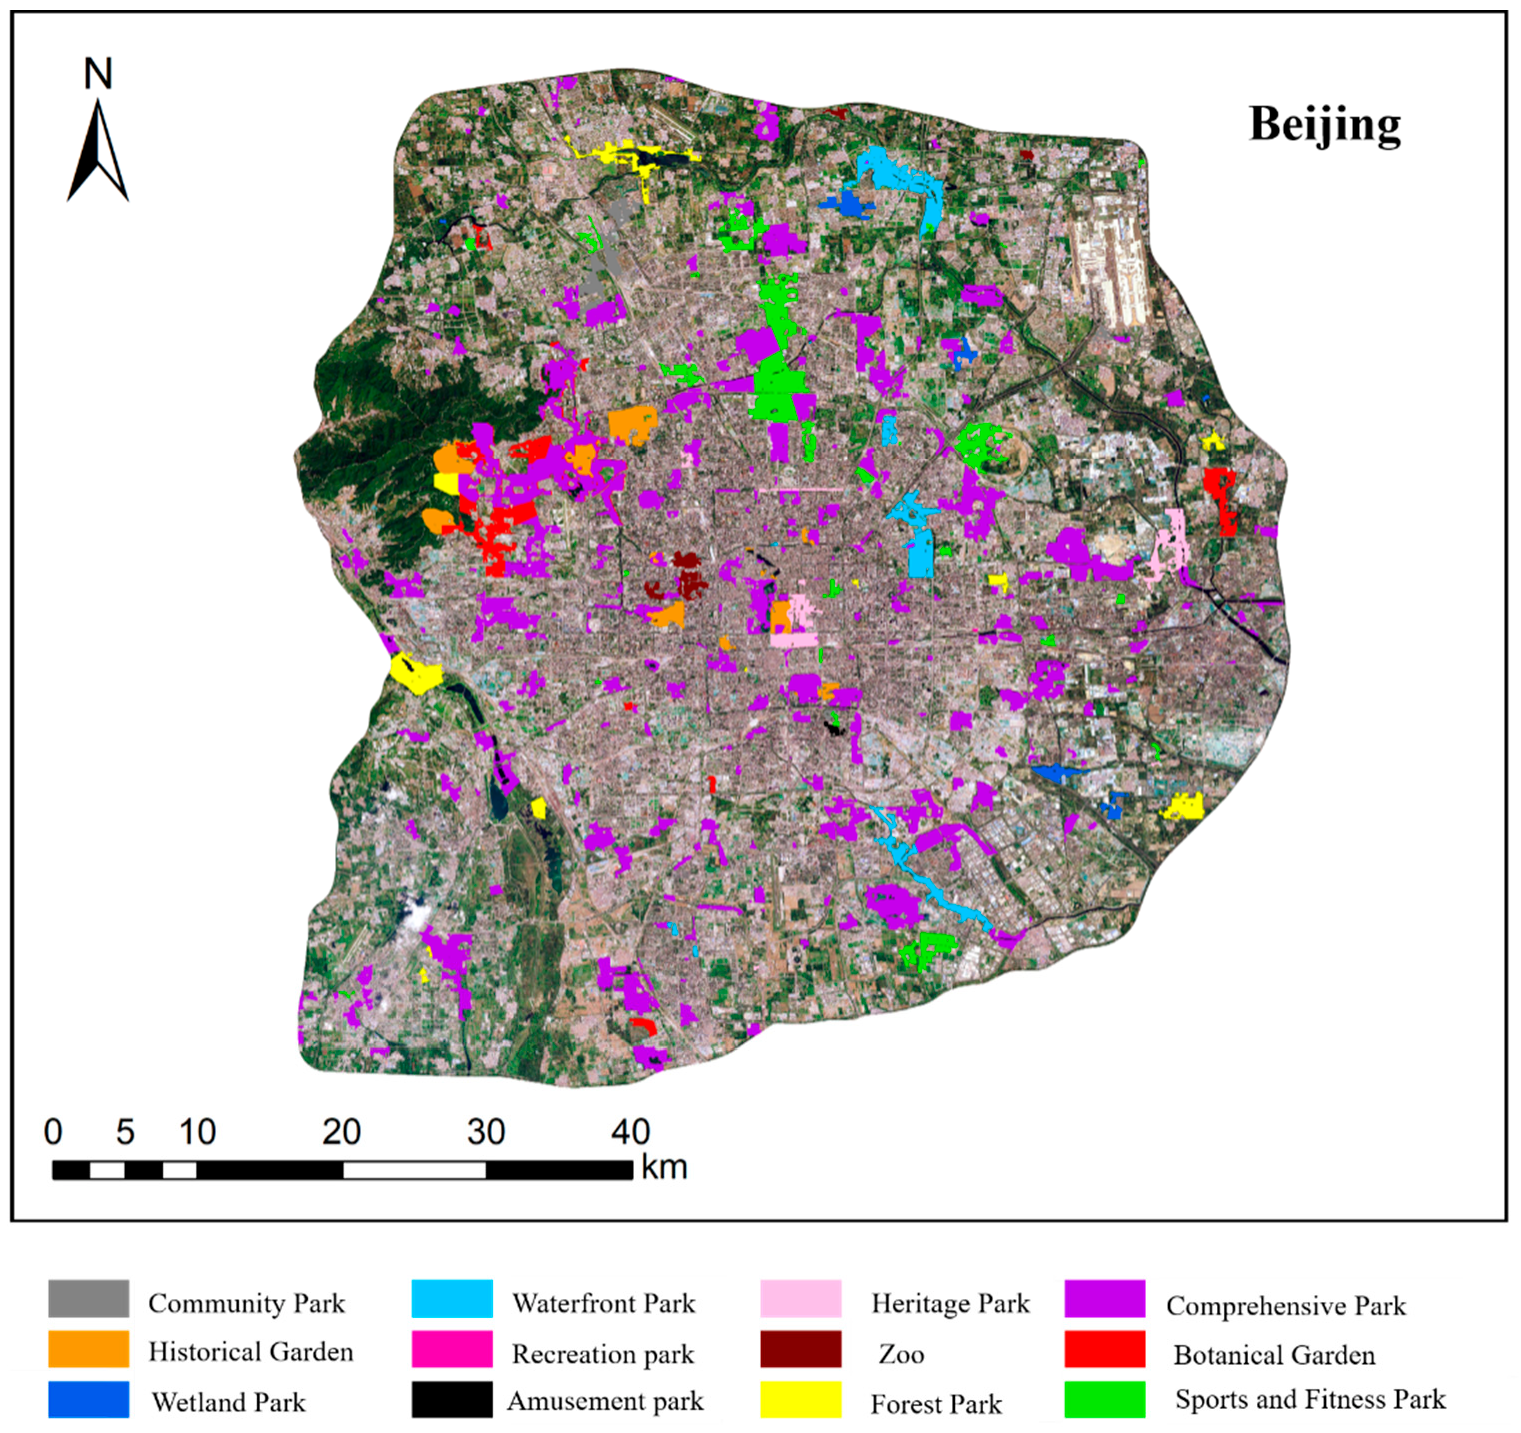
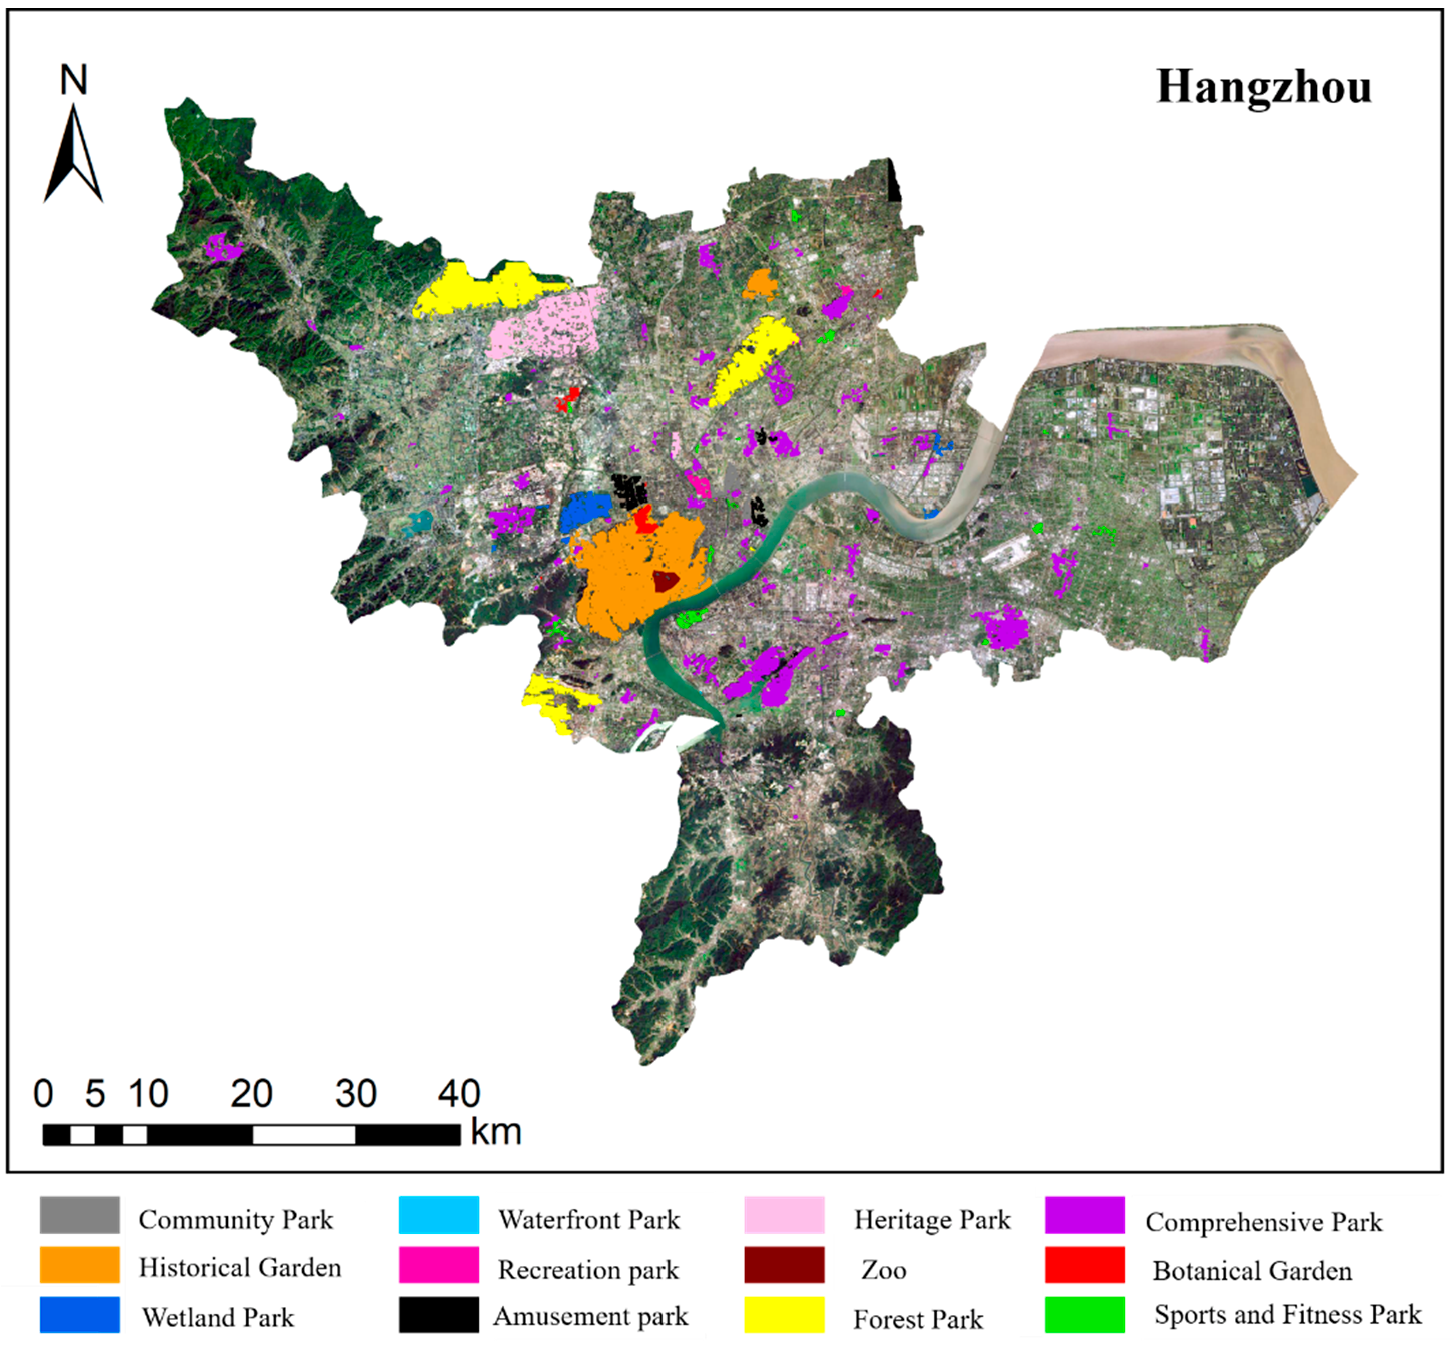
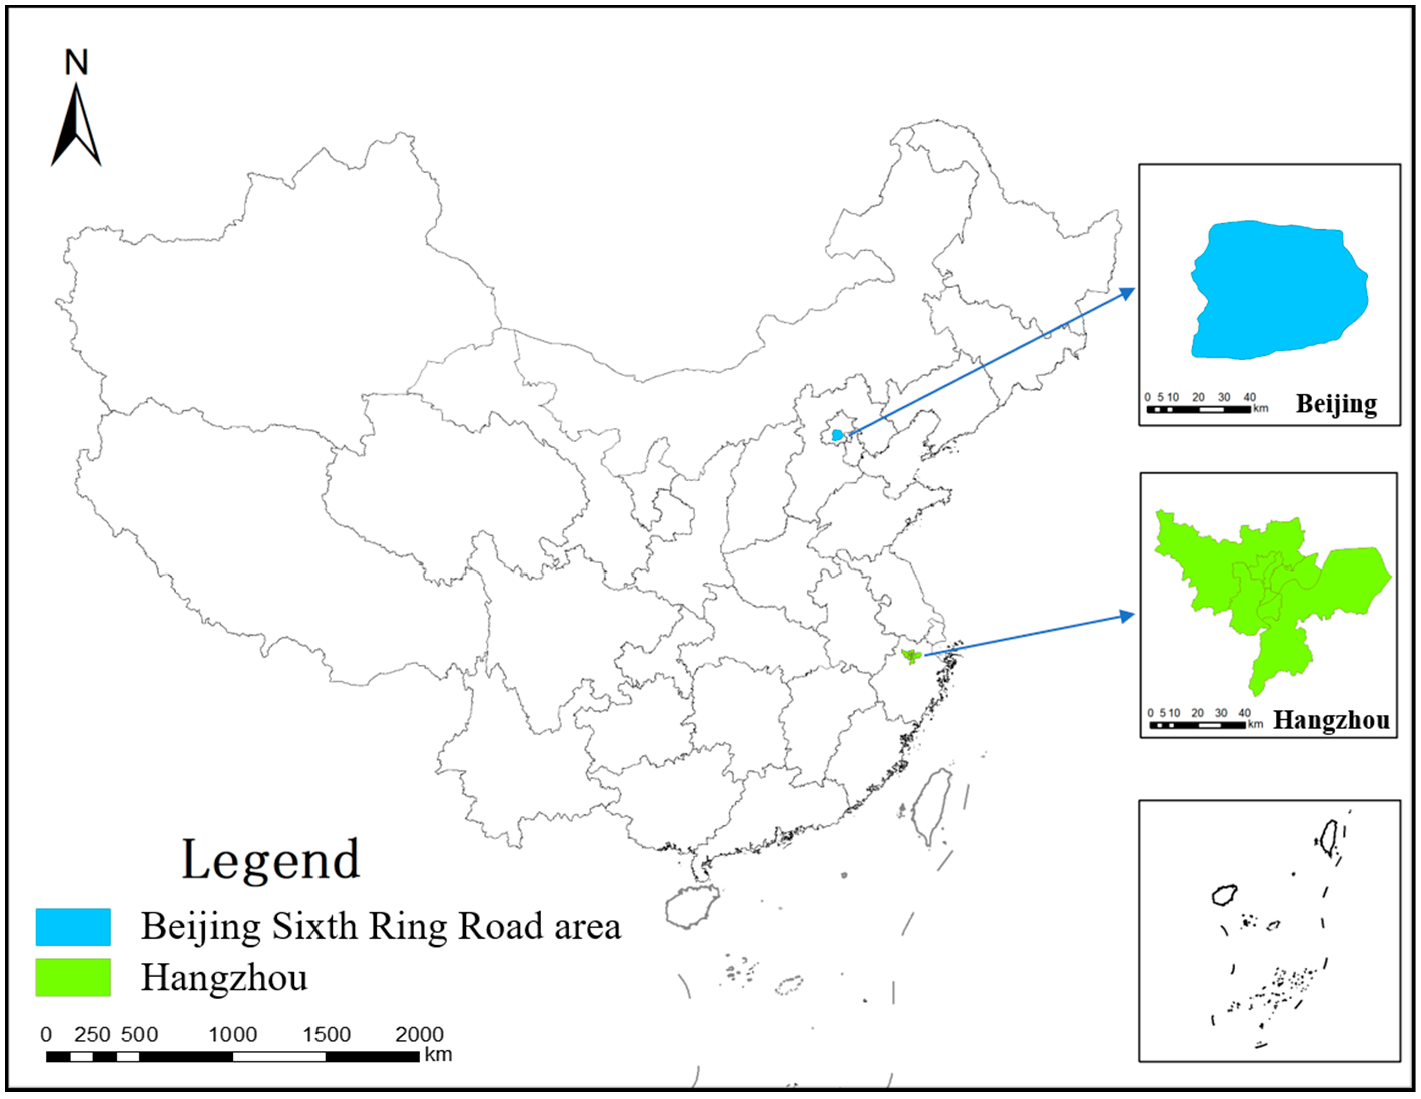
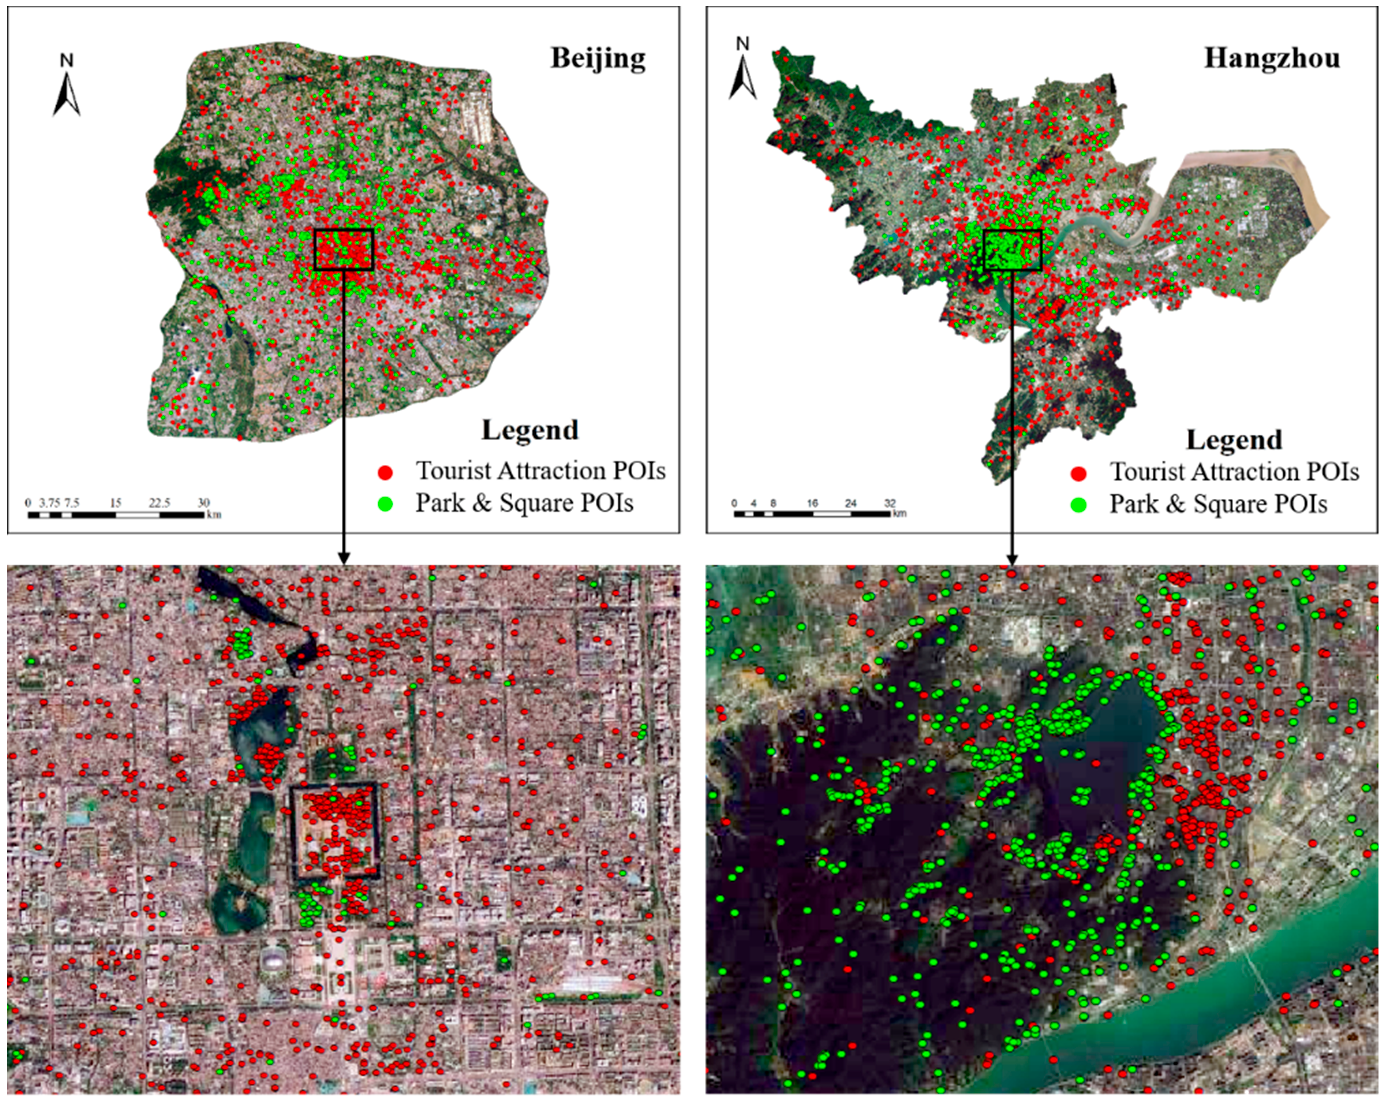
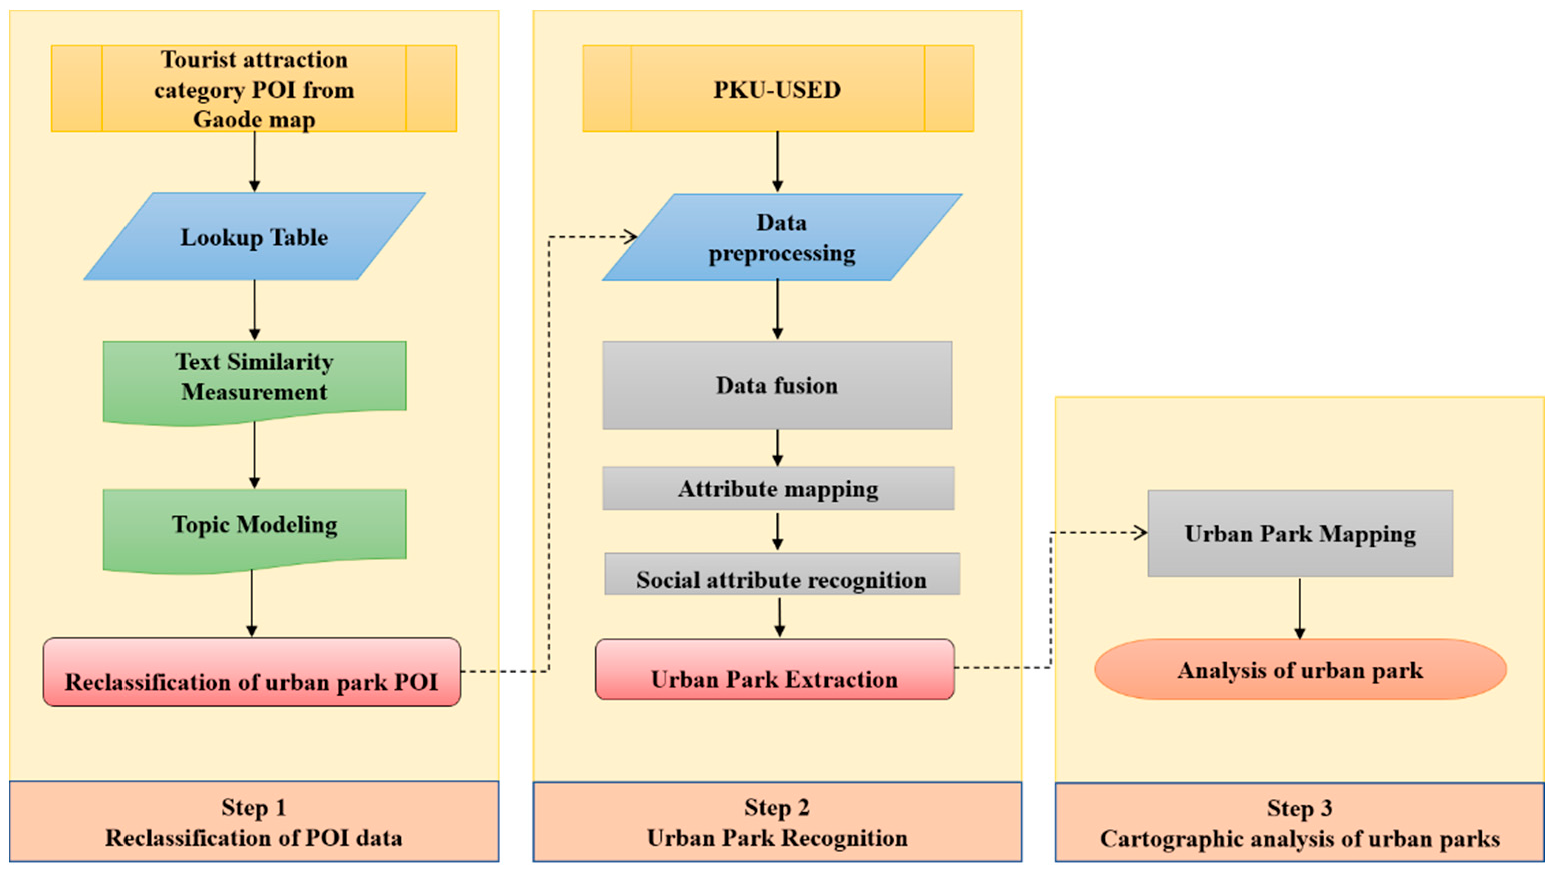
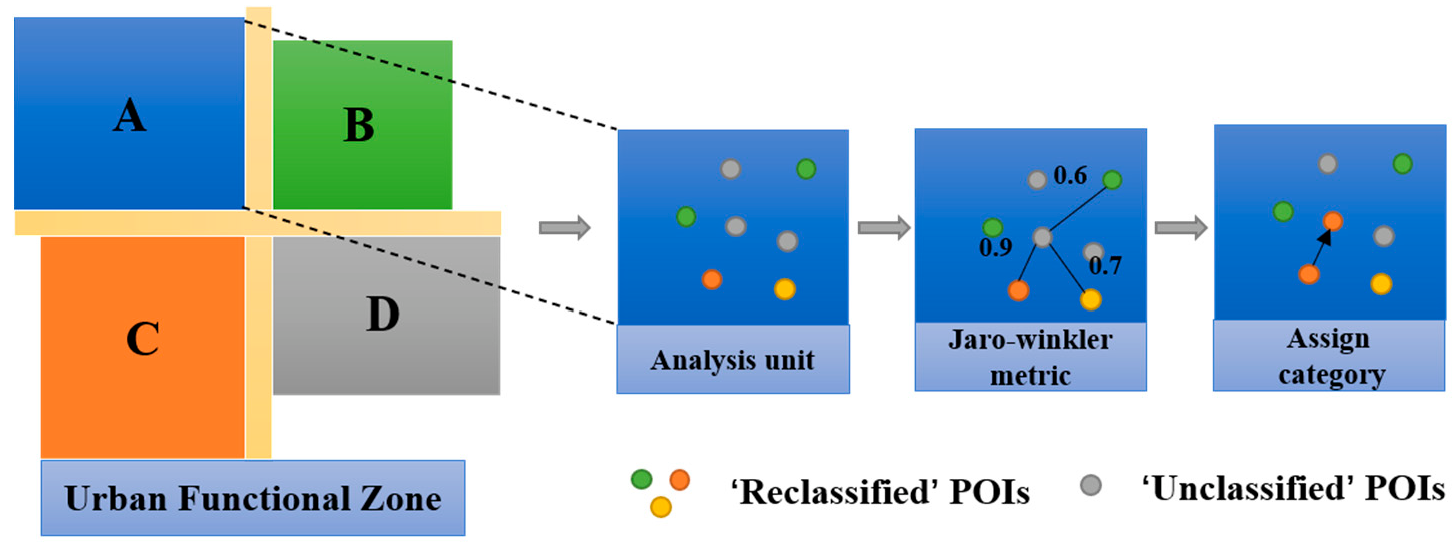
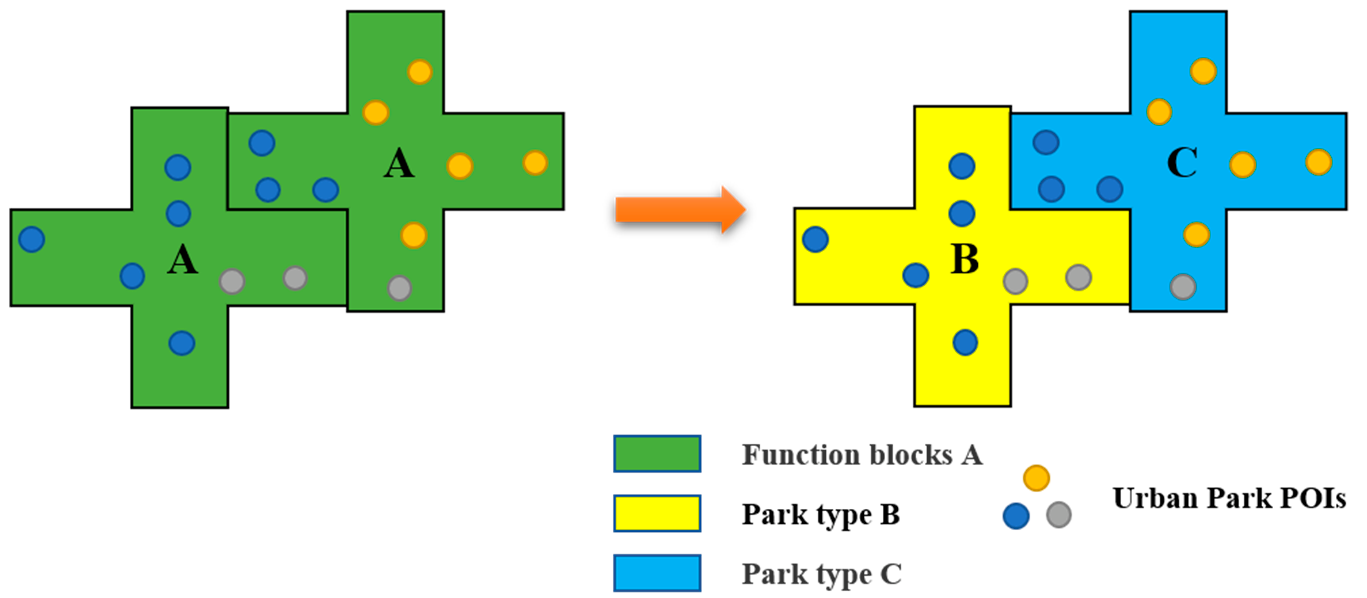
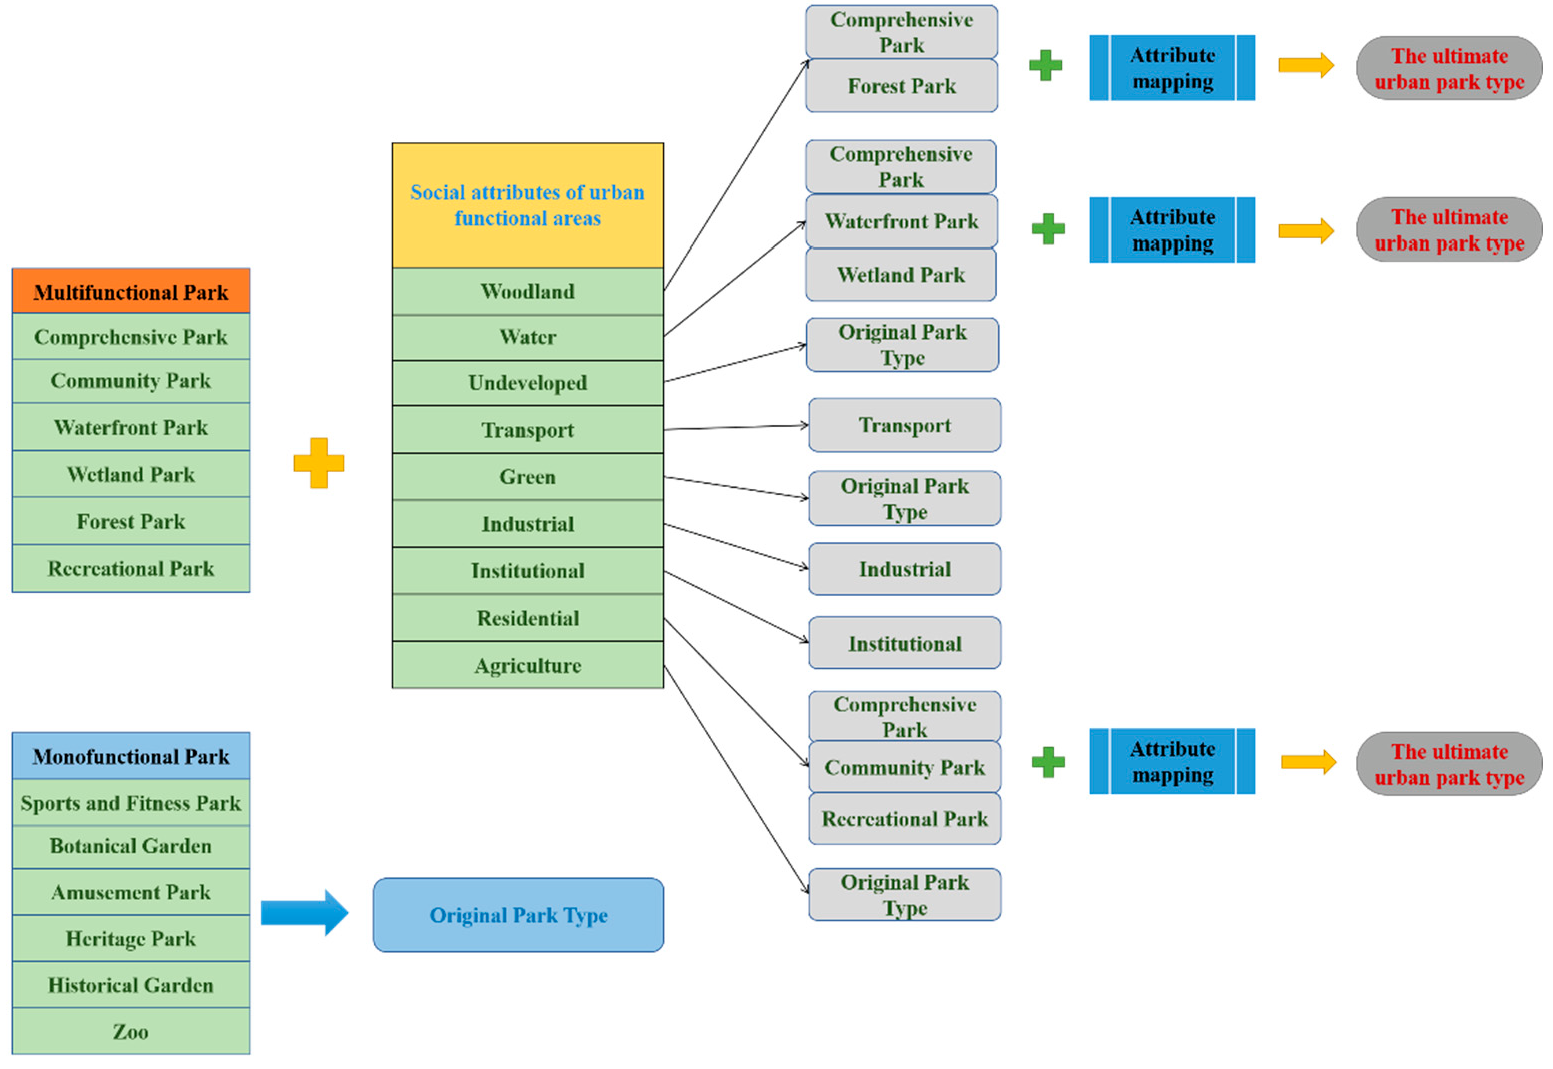
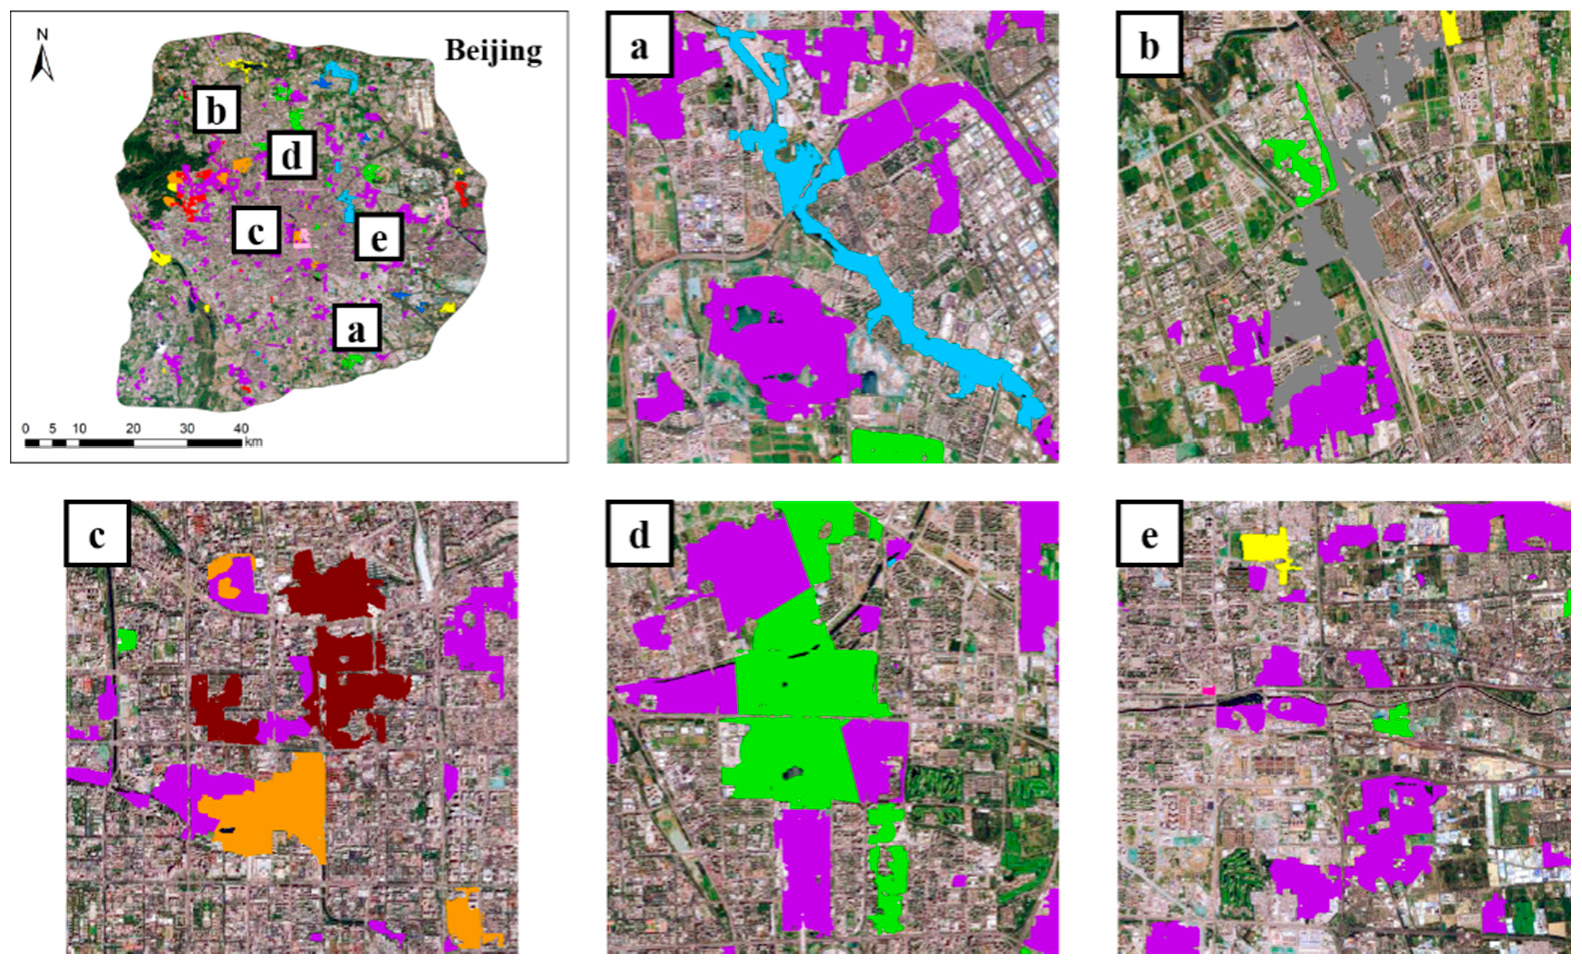
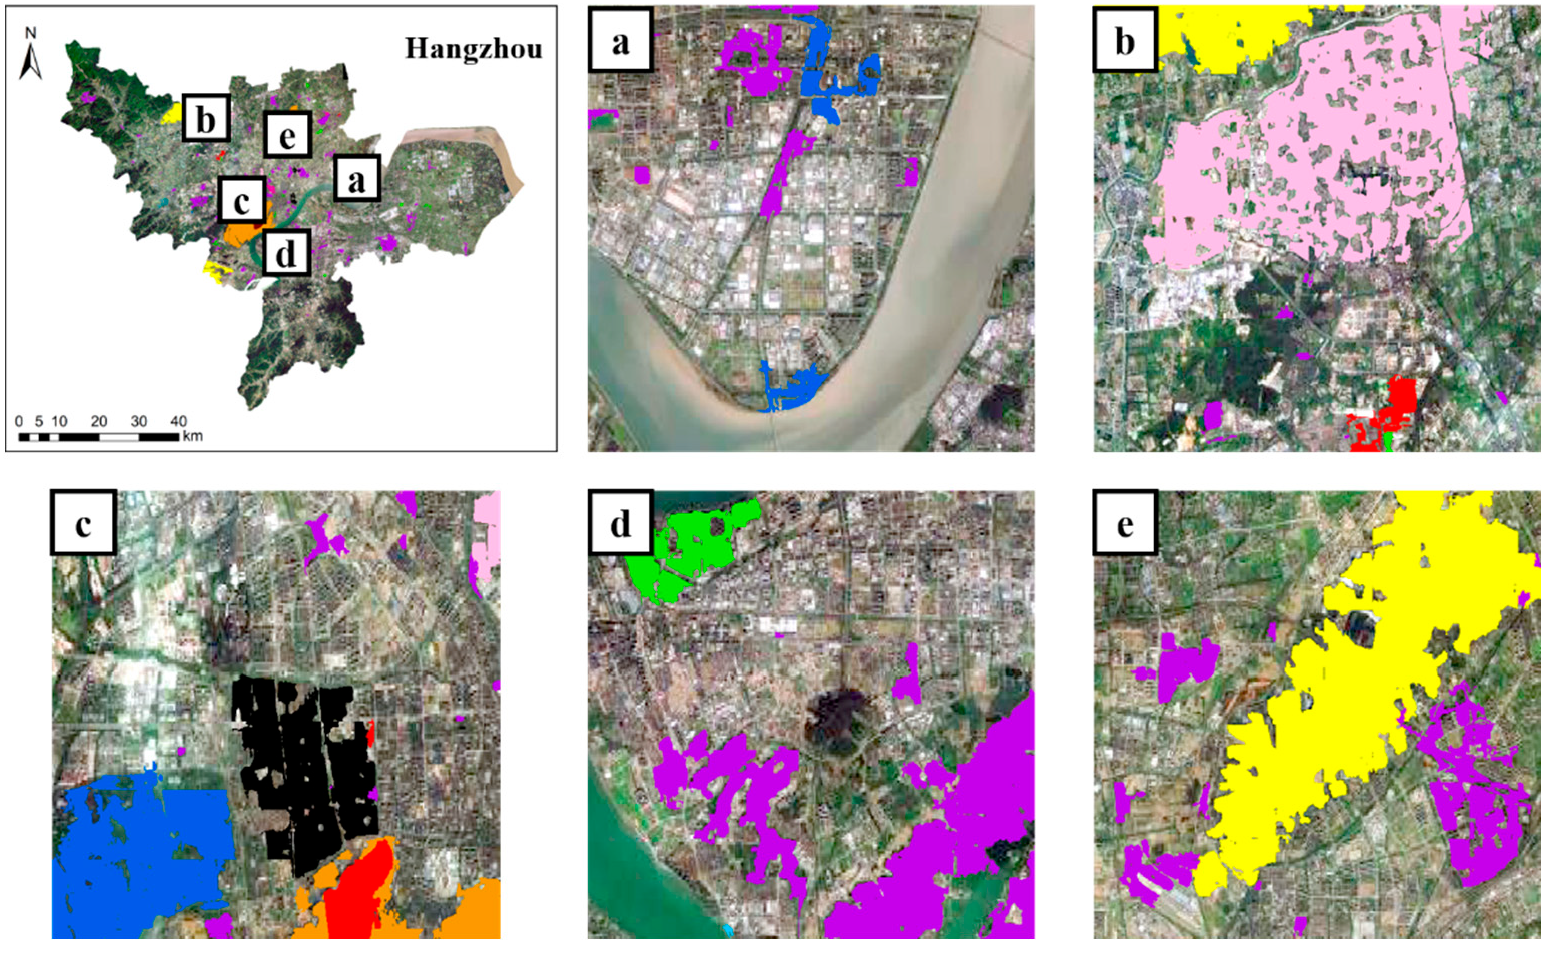
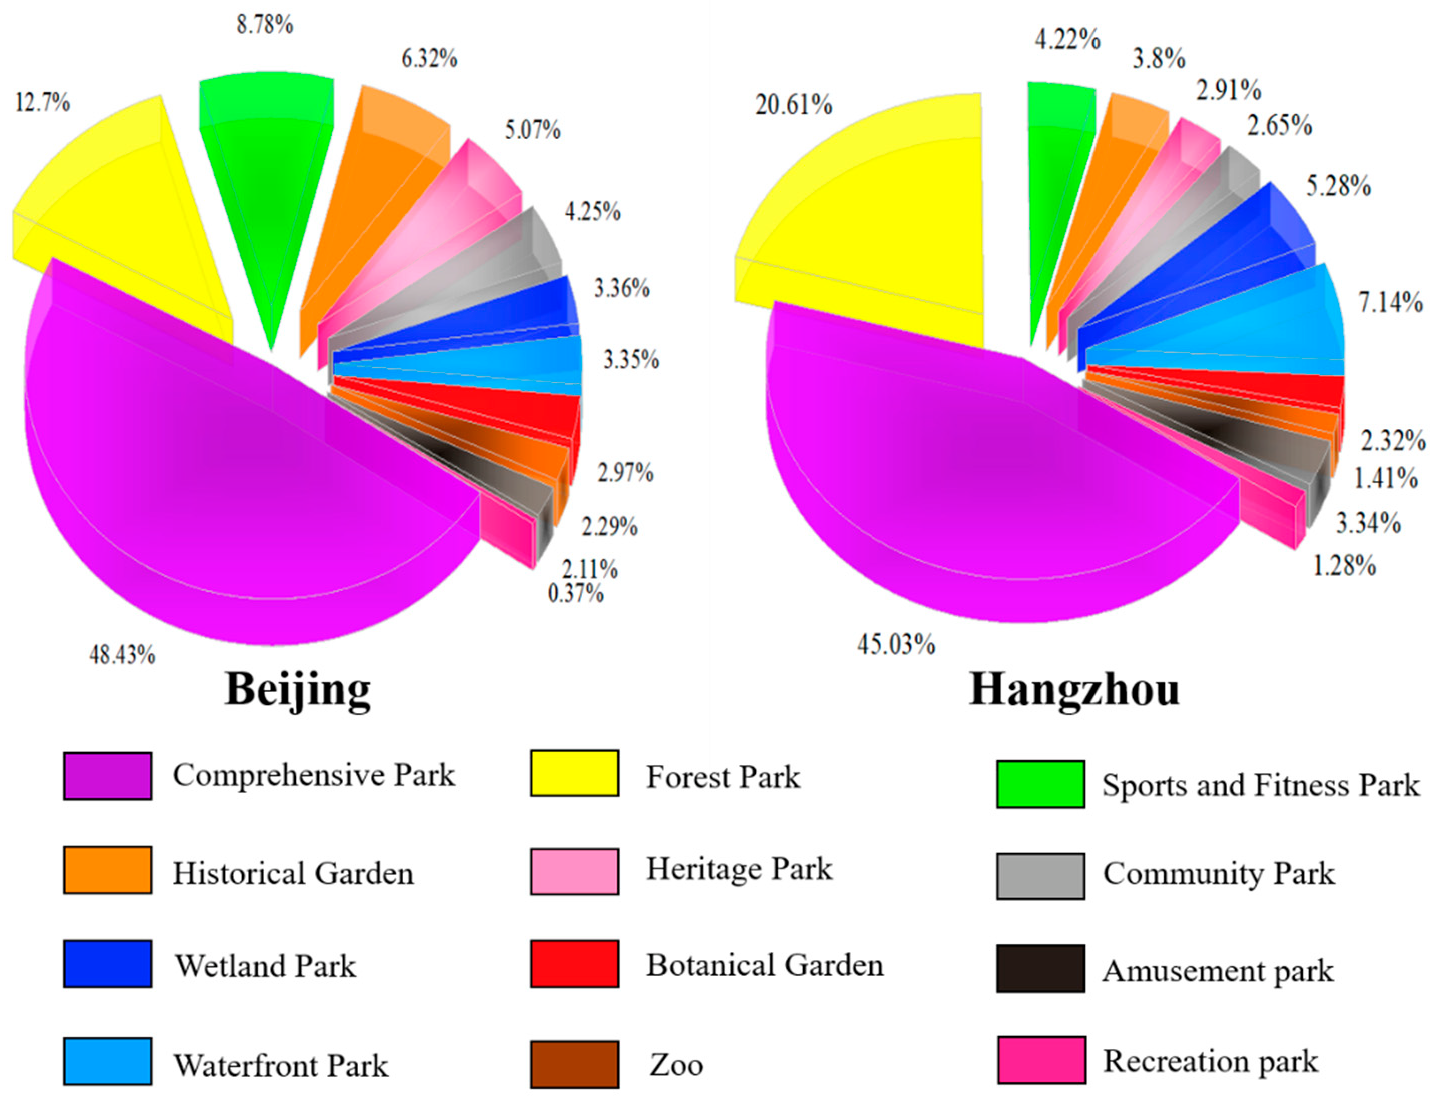
In conclusion, UFZ data have been widely used for urban planning purposes, including for the identification of urban green spaces, but these data cannot accurately identify urban parks by type, which is why the integration of POI and UFZ data extraction is so important to study. However, there are various challenges. First, POI data can only provide point-location and point-feature information about an urban park, which does not accurately express the scope, area, and type. Second, remote sensing images only reflect the visual characteristics of a location and cannot include the social attributes determined by human activities. Therefore, combining existing UFZ data with crowd-sourced POI data could be an effective method to extract details and more accurately classify urban parks by type. This study proposes an urban park extraction and classification method that combines UFZ and POI data. First, the POI data were automatically reclassified using an improved natural language processing (NLP) to link urban park types and POIs. Second, the reclassified POI and UFZ data were then integrated to categorize urban parks by type using attribute mapping and social attribute recognition. Finally, experimental analyses were performed in Beijing and Hangzhou to verify the effectiveness of the method developed in this study, as well as a comparative analysis of each type of urban park classified.

2. Study Area and Data

2.1. Study Area

In this study, Beijing and Hangzhou in China were selected as the experimental locations (Figure 2). Beijing, the capital of China, is located in the northern part of the North China Plain. The urban space is central, extending from the First to the Sixth Ring Roads with the Forbidden City as the center of the circle. To date, Beijing has eight administrative areas in total with a population of 23 million. Hangzhou is the capital of the Zhejiang Province and has eight main municipal districts with a population of 8.7 million. Beijing and Hangzhou, as typical cities in northern and southern China, have rich varieties of vegetation, diverse functional zone structures, and complex urban environments. The difference in the climates between the areas north and south of the Qinhuai River in China has had a profound impact on the urban environment, and thus urban greenery, vegetation types, and park distribution have been affected. In the areas north of the Qinhuai River, the temperature is lower and there is less rain, while in the South, the temperature is higher and the rain is abundant. The analyses of their urban park structures are of great significance to refine urban research.

2.2. Data Collection

2.2.1. UFZ Data of Peking University (PKU) Urbanscape Essential Dataset

Urbanization and different land uses form different types of UFZs (e.g., commercial, residential, and industrial areas). To assist in urban planning and management, highly accurate, large-scale UFZ data were needed. To this end, Zhang [18,29] of DoLab Laboratory at Peking University proposed a system of theories and methods for UFZ analysis based on geographic characteristics (Figure 3). The UFZ data categorized urban spaces into UFZs according to different social attributes. High-precision UFZ data contained information on the spatial structures and distribution ranges of urban parks. Beijing and Hangzhou UFZ data were divided into 12 categories and had a spatial resolution of 2.4 m (Table 2).

2.2.2. POI Data

POI data are commonly used for urban functional analysis [15]. Gaode Map is currently the most popular digital map for collecting geospatial data and provides reliable, real-time POI data for all cities in China. We used the application programming interface (API) provided by the web crawler to collect 1,052,428 POI data points in Beijing and 526,214 POI data points in Hangzhou in 2020. These POI data points were then assigned to primary and sub-categories: 23 primary categories (e.g., automotive services, food, beverage services, shopping services, lifestyle services, sports and leisure services, scenic spots, scientific, educational and cultural services, etc.), 264 secondary categories (e.g., parks, squares, scenic spots, etc.), and 870 tertiary categories (e.g., parks and squares, zoos, botanical gardens, aquariums, city squares, internal park facilities, etc.). As parks and squares belonged to the secondary category of tourist attractions, this study used a total of 7670 tourist attraction POIs in Beijing and 5045 tourist attraction POIs in Hangzhou (Figure 4).

2.2.3. OpenStreetMap Road Data

OSM is an open-source world map that can be freely used under an open license and can be edited by anyone. With the popularization of open-source data and electronic map applications, the quality and volume of OSM data continue to increase. The OpenStreetMap road data contained 27 road types, so this study used primary, secondary, and tertiary roads to locate the UFZs and removed the redundant road types (e.g., pavements, pedestrian streets, bicycle lanes, and unknown roads).

3. Method

This study proposed a refined mapping method for urban parks (Figure 5). First, we built a classification scheme for urban park POI data based on an improved NLP method to reclassify the original POI data extracted from Gaode Map into an urban park classification system. Second, using UFZ units, the social attributes of UFZ and POI data were combined for urban park classification. Finally, experimental analysis was conducted in Beijing and Hangzhou to verify the validity of the method that had been developed in this study, and a comparative analysis of each type of park in the two cities was also conducted.

3.1. Reclassification of POI Categories

To classify POI data with social attribute information, it was necessary to reclassify the original POI urban park data types into 12 urban park data types. In this experiment, a new POI data classification structure (Table 3) was designed. As approximately 80.85% of the crawled POI data had initial categories that did not directly infer the park type, they had to be reclassified into urban park types using improved NLP methods. Finally, a POI data structure applicable to urban park classification was built.

3.1.1. Text Similarity Measurement

Text similarity measurement was used to identify similar POI data referencing park type and then identify unclassified POI data based on the special naming rules of POI data. For example, there are many POI data points related to a single park that could, when considered individually or together, suggest the type of park. This study used the textual similarity measurement to infer the park type based on relevant POI data points.
The text similarity measurement is a three-step process (Figure 6). First, UFZs were used as analysis units. Second, the similarity of POI names was measured using the Jaro–Winkler similarity algorithm [30]. This method considers the common prefix length of two texts and is mainly used for short texts [31], thus it was chosen for calculating the similarity between two POI names (i.e., unclassified and classified). An analysis unit usually contains POI data with the known and unknown types at the same time. For example, if there are three POI points with unknown types and four POI points with known types in UFZ A, the type of unknown POI data can be determined by calculating the text similarity between POI names of unknown types and POI names of four known types. According to Chen [32], two POI names are similar when their similarity values are greater than 0.85. Finally, we added the reclassified POI data to the dataset of different urban park types.

3.1.2. Topic Modeling

When there was no known type of POIs in UFZs, the method of text similarity alone could not determine the type of POI. Topic modeling was used to identify unclassified POIs of unknown type. The topic modeling treated each POI name attribute as a statement and classified POIs with the same urban park type as a POI document into urban park categories. First, the name attributes of the POI data were split, and the split words were consolidated into word sets. Second, a modified version of term frequency-inverse document frequency (TF-IDF) model, the term frequency-inverse word frequency (TF-IWF) model (Equation (1)), was used to measure the degree of correlation between words and POI urban park categories. Compared with the traditional TF-IDF model, the TF-IWF model calculated the similarity of word segmentation according to different position weights and then merged the words with high similarity and sorted the keywords according to their weights. This weighting method reduced the influence of the same type of texts in the corpus on the word weights and accurately expressed the importance of words in the document [33]. Considering that non-Chinese words in place names (e.g., street, district, city, etc.) and POI names could not be used as subject words for the reclassified POI categories, they had to be removed before the TF-IWF was calculated. Then, the larger the TF-IWF value of a word was, the more important the word was to the park-type classification. The TF-IWF value was sorted to generate a subject dictionary for each classified POI category. We then ranked the TF-IWF values of the words from highest to lowest and extracted the top 10 sub-words with TF-IWF values greater than the turning point as topic words to express the urban park types of the POI data (Figure 7). Finally, we matched the subject terms from (Equations (2) and (3)) to determine the urban park type of the corresponding unclassified POI and calculated the classification accuracy of the POI using a confusion matrix:
T F I W F i   T F i × I W F i = G i A i × l o g i = 1 k N i N i
where T F I W F i is the TF-IWF value of category i in the reclassified POIs, G i denotes the number of occurrences of words of POI category i in the reclassified POIs, A i denotes the total word frequency of POI words of category i , i = 1 k N i denotes the total word frequency of reclassified POI words, and N i denotes the total word frequency of POI words of category i in the reclassified POIs ( i = 12 in this experiment).
ω j = min N ω t h e m e
where N ω t h e m e denotes the number of topic word sets of POI category i and ω j denotes the minimum value of the number of topic word sets.
P O I   c a t e g o r y i = c a t e g o r y   |   ω j N ω j = 1 c a t e g o r y   |   m i n R a n k ω j t h e m e T N ω j t h e m e   ( N ω j > 1 )
where P O I   c a t e g o t y i   denotes uncategorized POI category   i , R a n k ω j t h e m e denotes the range of T F I W F values taken by topic word ω j   in the corresponding topic word set, and T N ω j t h e m e denotes the total number of word frequencies of the corresponding topic words.

3.2. Urban Park Classification

This study proposed a multi-source data fusion method based on UFZ units (Figure 8). The UFZ data were used as the base, and the redefined urban park POI data were used as social attributes to classify urban parks.

3.2.1. Data Preprocessing of UFZ

Due to the complexity of urban spatial structures, the UFZ contained some areas that were too small to be of practical significance, so it was necessary to remove these (Figure 9). As some functional blocks had not been completely separated in the UFZ data, it was important to further identify functional areas. However, as the wrong connections of UFZs could be precisely segmented using OpenStreetMap road-vector data, this study used OpenStreetMap road-vector data to automatically segment UFZ connections (Figure 10).

3.2.2. Attribute Mapping

When POI data for one or more types of urban parks existed in the UFZ, the park type of the UFZ was determined according to attribute mapping (Figure 11). Comprehensive parks were larger in area than other types of parks by usually more than 1 km 2 . In addition, comprehensive parks had a wealth of facilities, including water systems, forests, and other natural environments, so comprehensive parks contained a small amount of POI data from other types of parks. For this reason, when the analysis unit covered an area of more than 1 km 2 and had more than three POIs related to urban park types, the analysis unit was considered as a comprehensive park. When the analysis unit had POIs of less than three types of urban park types, the analysis unit was identified as the type of urban park with the highest proportion by Equation (4).
  P T R i = p n i P N j × 100 %   i 3   S 1   km 2   Comprehensive   park   i > 3   S > 1   km 2
where p n i denotes the number of reclassified POI park type i , P N j denotes the total number of reclassified POIs in functional block j in the UFZ data, and S represents the area of the attribute block.

3.2.3. Social Attribute Recognition

Different UFZ categories had different social attributes. There was a corresponding relationship between UFZ social attributes and urban park type. The social attributes of a UFZ played an auxiliary role in determining the type of urban park. First, urban park types were divided into “Monofunctional Park” and “Multifunctional Park” (Table 4). The “Monofunctional Park” had a single internal environment, and the accuracy was higher by data fusion methods, whereas the “Multifunctional Park” had a complex internal environment, and the accuracy was lower by data fusion methods. The definition of “Multifunctional Park” was vague, and UFZ social attributes had a strong influence on the classification of “Multifunctional Park”; thus, “Multifunctional Park” was judged by the social attributes of UFZ areas. The “Monofunctional Park” was clearly defined, and UFZ social attributes had little influence on the classification of “Monofunctional Park”; therefore, this urban park type did not need UFZ social attribute for classification. Finally, the corresponding relationship between UFZ social attributes and urban parks was used to reclassify the “Multifunctional Park”, and the final urban park type was determined according to the attribute mapping method for better accuracy (Figure 12).

3.2.4. Urban Park Area Ratio (UPR)

The UPR represented the ratio of the urban park area to the overall urban area (Equation (5)), which reflected the greening level of the city and could be used as an evaluation index of the urban ecological environment. A high urban park area ratio represented a well-developed urban ecological environment and greening, which contributed to the sustainable development of the urban environment.
U P R = T A P T U A × 100 %
where U P R stands for Urban Park Area Rate, T A P stands for Total Park Area, and T U A stands for Total Urban Area.

3.2.5. Urban Park Type Rate (UTR)

The UTR represented the distribution of each urban park type, which reflected the proportion of urban park area for each type, and thus assisted in the analysis of the relationship between the climate of the city and the type of urban park. This study classified urban parks into 12 types, each with unique characteristics and functions. For example, forest parks were characterized as having large forest areas to purify and cool urban spaces, amusement parks were described as having a large number of architectural and recreational facilities to provide entertainment for citizens, and waterparks were determined by having a large amount of water to help reduce urban temperatures. The climate and geographic conditions of different cities vary significantly, which had been reflected in their classification attributes. This study conducted a differentiated analysis of the urban park area to determine the urban park type rate (Equation (6)).
U T R i = A P G i T A P × 100 %
where U T R i denotes the park area rate of category i in the municipality, A P G i denotes the total area of category i parks in the municipality, and T A P represents the total area of urban parks.

4. Result

4.1. Mapping Result

Urban parks were classified into 12 categories according to the GB 51346-2019 Urban Green Space Planning Standard in China. The results for Beijing are shown in Figure 13 and Figure 14, while the results for Hangzhou are represented in Figure 15 and Figure 16. The distribution of urban parks in Beijing was relatively even. The Haidian and Shijingshan Districts in the northwest of Beijing are rich in water systems and dense in urban parks, while the Fengtai and Chaoyang Districts in the Southeast have comparatively fewer water systems and a sparse distribution of urban parks. The northwest and southwest areas of Hangzhou are predominantly mountainous with fewer urban parks. Hangzhou’s urban parks are predominantly located in the west-central West Lake District and the Xiaoshan District, which both have plenty of rain and warm weather, and the parks are concentrated around the West Lake District. While the Yuhang District to the north of the city and the Xiaoshan District to the south of the city have had slower urban development with sparse, diverse urban parks. The urban park map makes an important contribution to the refinement of urban research by visually and numerically displaying the distribution of various urban parks in Beijing and Hangzhou.

4.2. Accuracy Assessment

The accuracy evaluation showed that the urban park classification method performed well (Table 5). The overall accuracy (OA) was calculated by comparing the Gaode network map with a visual interpretation method. The OA was 82.8% and the Kappa coefficient was 0.74. The number of comprehensive parks accounted for the highest proportion of urban parks, and the UA (%) and PA (%) of comprehensive parks obtained with this method were 89.8% and 91%, respectively. The comprehensive parks were mostly distributed in dense urban areas, and when they occurred in the surrounding areas, they were predominantly distributed in residential, commercial, and school areas. The comprehensive parks may have been misclassified as community parks or sports and fitness parks, but the number of comprehensive parks was large, and the overall extraction accuracy was relatively high. The UA (%) and PA (%) of botanical gardens, zoos, and amusement parks were all 100%. The classification accuracy of these three types of urban parks was high because their numbers were small and the areas of the parks were large. The community parks were less evenly distributed throughout the city. In recent years, the greening of urban residential areas has significantly improved, and many community parks have been transformed into comprehensive parks, which could also be considered residential green spaces and thus reducing the classification accuracy of the community parks. The UA (%) and PA (%) of forest parks were both 77.8%. The forest parks were distributed over a large area and were often adjacent to other types of parks, which increased the risk of misclassification for forest parks. The wetland and waterfront parks could also have been misclassified as water functional zones because they contained a high percentage of water. Some other types of parks also contained water resources, and these, too, may have been misclassified as wetland or waterfront parks, which reduced the extraction accuracy of these two types. The UA (%) and PA (%) for historic parks were 66.7% and 78.3%, respectively, and the UA (%) and PA (%) for heritage parks were 52.9% and 75.0%, respectively, which indicated that the accuracy was low. A reason for this could be that as historic and heritage parks are typically small, they may have been misclassified as other types of parks. The high percentage in UA and PA when identifying comprehensive parks, botanical gardens, sports and fitness parks, wetland parks, zoos, wetland parks, waterfront parks, and amusement parks indicated that this method had high accuracy for these types. The UA (%) and PA (%) of community, heritage, historical, and amusement parks were lower, and these types of parks may have been misclassified as other park types, which resulted in lower extraction accuracy. The overall extraction accuracy of the method was acceptable and indicated that it could effectively identify urban-park types.

4.3. UPR Result

The overall area of Beijing is smaller than that of Hangzhou, while the total area of urban parks in Beijing (i.e., 272.42 km 2 ) is larger than that of Hangzhou (i.e., 225.92 km 2 ); similarly, the rate of urban parks in Beijing was larger than that in Hangzhou (Table 6). Beijing has attached great importance to urban greening and environmental sustainability in recent years, and with advanced urban park planning and construction, the city has developed areas within the Sixth Ring Road with well-structured UFZs and evenly distributed urban parks. Although Hangzhou has rich vegetation and warm weather, the developed urban areas are lagging behind the industrial and agricultural development of the Yuhang and Xiaoshan districts. Urban parks have been concentrated within the main urban areas, resulting in a smaller urban park area rate in Hangzhou than in Beijing. This data illustrated the achievements of urban greening construction in these two cities over the years and may indicate the future environmental sustainability of these two cities.

4.4. UTR Result

The analysis was performed using the rates of urban park types in Beijing and Hangzhou (Figure 17) and the ratios of park types throughout the two cities (Figure 18). The map of urban parks in Beijing (Figure 13) showed that urban parks were concentrated within the city boundaries, with comprehensive parks accounting for 48.43% of the total park area. Beijing has a crowded urban structure and a high population density, and residents have had a relatively high demand for comprehensive parks. The built-up area of Hangzhou was small in comparison, and most of the urban parks have been concentrated around the West Lake area (Figure 15). Due to its long history and culture, Beijing has many historic parks, which account for 6.32% of the total parks. Hangzhou has a wide distribution of water systems, and waterfront parks accounted for 7.14% of Hangzhou’s total parks. Beijing is relatively arid and has fewer water systems, and waterfront parks only accounted for 3.35%. Hangzhou is mainly surrounded by mountains with a large number of forests, and the urban forest parks of Hangzhou accounted for 20.61% of the park type total. Beijing, however, is surrounded by mountains, and most of the urban areas have been developed; therefore, the proportion of urban forest parks was much smaller than in Hangzhou. Of the total parks in Beijing, 8.78% were sports and fitness parks, which was higher than Hangzhou’s 4.22%. Hangzhou’s climate is suitable for vegetation growth, and Hangzhou has more small-area green spaces while Beijing has fewer small-area green spaces; Hangzhou also had more recreational parks than Beijing. The overall area of urban parks in Beijing was larger than in Hangzhou. The population of Beijing is 23 million, Hangzhou is 8.7 million, with the per capita urban park area of Hangzhou being 22.77 m 2 while that of Beijing is 17.16 m 2 .

5. Discussion

5.1. Pros and Cons

5.1.1. Pros of This Study

Although mapping urban parks from social attributes was challenging, a detailed workflow for urban-park classification was constructed by integrating UFZ data and crowd-sourced geographic data. This study had the following contributions.
First, the urban park is important in the refinement of urban green space research. Previous studies have mostly focused on the extraction and the analysis of urban green space as a whole while overlooking the types of urban parks and their distribution in urban spaces. This study focused on this specific type of urban park data extraction [34], mapping, and analysis of the distribution of urban parks in two major cities in China, Beijing and Hangzhou. We concluded that different cities had different distributions of urban parks for various stated reasons, and this conclusion will help refine future research of urban green spaces.
Second, previous studies have predominantly used urban remote sensing images to analyze urban spatial structures from a macro perspective [34,35]. However, this method overlooks the functionality and specific attributes of urban inner regions, which is not conducive to more granular studies of cities. In this study, the UFZ was adopted as an analysis unit, and the urban spatial structure was analyzed from a more detailed perspective based on the properties and structures of a single UFZ, which was conducive to better precision and efficiency.
Finally, previous studies predominantly focused on extracting urban based on the physical attributes found in remote sensing data [36,37] and without the benefit of detailed attributes found in other data sources. Based on the social attributes of UFZ and crowd-sourced geographic data, this study was able to accurately describe individual UFZs and classify them into 12 categories of urban parks, which reflected the advantages of this method for refining urban research.

5.1.2. Cons of the Study

First, the UFZ data used in this study over-segmented functional blocks and had insufficient segmentation accuracy. Although these problems were resolved by using OpenStreetMap road segmentation and parcel deletion methods, they still affected the accuracy and efficiency of urban park classification. Future work in urban research should consider using UFZ data with higher accuracy alongside updated crowd-sourced POI data for better results.
Second, the data in this study had some limitations. Only the POIs in the tourist attraction category were used to classify parks in this study, which disregarded other likely relevant data points that could indicate the presence of facilities, transportation information, and distance to urban centers. External factors (e.g., amenities around the park) encourage people to visit parks near and far, so future studies should examine the impact of these factors.
Third, the method is apparently more accurate to identify some types of parks than others. For instance, the POIs of heritage and historical parks are more easily classified as other types of parks, thus these two types of parks have lower UA and PA percentages than other types of parks. Future improvements may be possible through more precise POI classification methods.
Finally, the analysis process could have been more in-depth. While different types of urban parks were considered in this study, usage, pedestrian flow, popularity, average area per type, vegetation coverage, and accessibility were not considered, which are important for the improvement of urban analysis and should be considered in future research.

5.2. Uncertainties Regarding the Urban Park Mapping

5.2.1. Impact of POI Data Classification

The accuracy of urban park classification in this study was largely influenced by the classification accuracy of the POI data. The original POI data did not carefully distinguish between the various types of urban parks, and it had been impossible to recognize multiple types of urban parks using the original POI data. This study employed an improved NLP method to maximize the retention of social attributes in the POI data; the overall accuracy was 84.3% and the kappa coefficient was 0.79 (Table 7), indicating that the method performed well in the classification of various types of urban park POIs and effectively improved the accuracy of urban park classification.

5.2.2. Impact of Social Attribute Recognition

Social attribute refinement should be applied after the initial analysis and classification of urban parks, as it may improve the overall efficiency and accuracy of urban park classification (Table 8). When some urban park types were initially classified as comprehensive parks, the social attribute refinement was used to revise the park type, which effectively improved the accuracy. In future research, multi-type data should be used to improve classification accuracy via various relevant attributes.

6. Conclusions

Urban park mapping is important for comprehensive urban analysis. In this study, urban park mapping was based on POI and UFZ data extraction and refined with relevant social attributes. First, POI data were automatically reclassified using an improved NLP method. Then, these reclassified POI data were combined with UFZ data via data fusion for attribute extraction, and the various types of urban parks were determined using data attribute analysis. The extracted results were revised based on relevant social attributes in order to develop an urban park map. Finally, the validity of the research method was verified by producing a map of urban parks in Beijing and Hangzhou to compare and analyze the spatial structures of their urban parks. The experimental results showed that this method accurately extracted urban park data to produce more accurate urban park maps. The overall accuracy using the method was 82.8% and the kappa coefficient was 0.74, indicating its reliability. The urban park maps produced in this study may provide a scientific basis for future urban park planning advice for the Chinese government. If used in accordance with the classification standards of urban green spaces and urban parks in other countries, this method may also be applicable.

Author Contributions

Conceptualization, Su Cao; Methodology, Su Cao; Writing—original draft, Su Cao; Writing—review and editing, Su Cao, Shihong Du, Shuwen Yang, and Shouhang Du; Funding acquisition, Shihong Du. All authors have read and agreed to the published version of the manuscript.

Funding

This research is supported by the National Key Research and Development Program of China (No. 2021YFE0117100), the China Postdoctoral Science Foundation (No. 2021M703511).

Institutional Review Board Statement

Not applicable.

Informed Consent Statement

Informed consent was obtained from all subjects involved in the study.

Data Availability Statement

The POI data are freely available from the Gaode Open Platform. https://lbs.amap.com/api/webservice/download (accessed on 22 September 2021). The UFZ data used in this study is obtained from the Do Lab, Peking university. http://geoscape.pku.edu.cn/index.html (accessed on 22 September 2021). The OSM data are freely available from the Open Street Map website. https://wiki.openstreetmap.org/wiki/Key:highway (accessed on 22 September 2021). The Jaro-Winkler similarity algorithm are freely available from the website. https://pypi.org/project/pyjarowinkler/ (accessed on 22 September 2021).

Conflicts of Interest

The authors declare no conflict of interest.

References

  1. Graça, M.; Alves, P.; Gonçlves, J.; Nowak, D.J.; Hoehn, R.; Farinha-Marques, P.; Cunha, M. Assessing how green space types affect ecosystem services delivery in Porto, Portugal. Landsc. Urban Plan. 2018, 170, 195–208. [Google Scholar] [CrossRef]
  2. Silva, L.T.; Fonseca, F.; Pires, M.; Mendes, B. SAUS: A tool for preserving urban green areas from air pollution. Urban For. Urban Green. 2019, 46, 126440. [Google Scholar] [CrossRef]
  3. Liu, O.Y.; Russo, A. Assessing the contribution of urban green spaces in green infrastructure strategy planning for urban ecosystem conditions and services. Sustain. Cities Soc. 2021, 68, 102772. [Google Scholar] [CrossRef]
  4. Loures, L.; Santos, R.; Panagopoulos, T. Urban Parks and Sustainable City Planning-The Case of Portimão, Portugal. WSEAS Trans. Environ. Dev. 2007, 15, 171–180. [Google Scholar]
  5. He, C.; Liu, Z.; Tian, J.; Ma, Q. Urban expansion dynamics and natural habitat loss in China: A multiscale landscape perspective. Glob. Chang. Biol. 2014, 20, 2886–2902. [Google Scholar] [CrossRef] [PubMed]
  6. Golding, E.Y. Modeling the environmental impacts of urban land use and land cover change—A study in Merseyside, UK. Landsc. Urban Plan. 2005, 71, 295–310. [Google Scholar]
  7. Feyisa, G.L.; Dons, K.; Meilby, H. Efficiency of parks in mitigating urban heat island effect: An example from Addis Ababa. Landsc. Urban Plan. 2014, 123, 87–95. [Google Scholar] [CrossRef]
  8. Grimm, N.B.; Foster, D.; Groffman, P.; Grove, J.M.; Hopkinson, C.S.; Nadelhoffer, K.J.; Pataki, D.E.; Peters, D.P. The changing landscape: Ecosystem responses to urbanization and pollution across climatic and societal gradients. Front. Ecol. Environ. 2008, 6, 264–272. [Google Scholar] [CrossRef] [Green Version]
  9. Standard for Classification of Urban Green Space; China Building Industry Press: Beijing, China, 2019; pp. 16–19.
  10. Du, S.; Du, S.; Liu, B.; Zhang, X. Mapping large-scale and fine-grained urban functional zones from VHR images using a multi-scale semantic segmentation network and object based approach. Remote Sens. Environ. 2021, 261, 112480. [Google Scholar] [CrossRef]
  11. Zhang, X.; Du, S. A Linear Dirichlet Mixture Model for decomposing scenes: Application to analyzing urban functional zonings. Remote Sens. Environ. Interdiscip. J. 2015, 169, 37–49. [Google Scholar] [CrossRef]
  12. Banzhaf, E.; Hofer, R. Monitoring Urban Structure Types as Spatial Indicators with CIR Aerial Photographs for a More Effective Urban Environmental Management. IEEE J. Sel. Top. Appl. Earth Obs. Remote Sens. 2008, 1, 129–138. [Google Scholar] [CrossRef]
  13. Cao, S.; Hu, D.; Zhao, W.; Mo, Y.; Yu, C.; Zhang, Y. Monitoring changes in the impervious surfaces of urban functional zones using multisource remote sensing data: A case study of Tianjin, China. GIScience Remote Sens. 2019, 56, 967–987. [Google Scholar] [CrossRef]
  14. Hu, T.; Yang, J.; Li, X.; Gong, P. Mapping Urban Land Use by Using Landsat Images and Open Social Data. Remote Sens. 2016, 8, 151. [Google Scholar] [CrossRef]
  15. Zhang, X.; Du, S.; Wang, Q. Hierarchical semantic cognition for urban functional zones with VHR satellite images and POI data. Isprs J. Photogramm. Remote Sens. 2017, 132, 170–184. [Google Scholar] [CrossRef]
  16. Bo, H.; Bei, Z.; Song, Y. Urban land-use mapping using a deep convolutional neural network with high spatial resolution multispectral remote sensing imagery. Remote Sens. Environ. 2018, 214, 73–86. [Google Scholar]
  17. Voltersen, M.; Berger, C.; Hese, S.; Schmullius, C. Object-based land cover mapping and comprehensive feature calculation for an automated derivation of urban structure types at block level. Remote Sens. Environ. 2014, 154, 192–201. [Google Scholar] [CrossRef]
  18. Zhanga, X.; Dua, S.; Wang, Q. Integrating bottom-up classification and top-down feedback for improving urban land-cover and functional-zone mapping. Remote Sens. Environ. Interdiscip. J. 2018, 212, 231–248. [Google Scholar] [CrossRef]
  19. Du, S.; Du, S.; Liu, B.; Zhang, X.; Zheng, Z. Large-scale urban functional zone mapping by integrating remote sensing images and open social data. GIScience Remote Sens. 2020, 57, 411–430. [Google Scholar] [CrossRef]
  20. Crooks, A.; Pfoser, D.; Jenkins, A.; Croitoru, A.; Stefanidis, A.; Smith, D.; Karagiorgou, S.; Efentakis, A.; Lamprianidis, G. Crowdsourcing urban form and function. Int. J. Geogr. Inf. Sci. 2015, 29, 1–22. [Google Scholar] [CrossRef]
  21. Rios, S.A.; Munoz, R. Land Use detection with cell phone data using topic models: Case Santiago, Chile. Comput. Environ. Urban Syst. 2017, 61, 39–48. [Google Scholar] [CrossRef]
  22. Tu, W.; Cao, J.; Yue, Y.; Shaw, S.L.; Zhou, M.; Wang, Z.; Chang, X.; Xu, Y.; Li, Q. Coupling mobile phone and social media data: A new approach to understanding urban functions and diurnal patterns. Int. J. Geogr. Inf. Sci. 2017, 31, 2331–2358. [Google Scholar] [CrossRef]
  23. Liu, Y.; Liu, X.; Gao, S.; Gong, L.; Kang, C.; Zhi, Y.; Chi, G.; Shi, L. Social Sensing: A New Approach to Understanding Our Socioeconomic Environments. Ann. Assoc. Am. Geogr. 2015, 105, 512–530. [Google Scholar] [CrossRef]
  24. Zhang, Y.; Li, Q.; Huang, H.; Wu, W.; Wang, H. The Combined Use of Remote Sensing and Social Sensing Data in Fine-Grained Urban Land Use Mapping: A Case Study in Beijing, China. Remote Sens. 2017, 9, 865. [Google Scholar] [CrossRef] [Green Version]
  25. Yuan, N.J.; Zheng, Y.; Xie, X.; Wang, Y.; Zheng, K.; Xiong, H. Discovering Urban Functional Zones Using Latent Activity Trajectories. IEEE Trans. Knowl. Data Eng. 2015, 27, 712–725. [Google Scholar] [CrossRef]
  26. Jiang, S.; Alves, A.; Rodrigues, F.; Ferreira, J.J.; Pereira, F.C. Mining point-of-interest data from social networks for urban land use classification and disaggregation. Comput. Environ. Urban Syst. 2015, 53, 36–46. [Google Scholar] [CrossRef] [Green Version]
  27. Ye, T.; Zhao, N.; Yang, X.; Ouyang, Z.; Liu, X.; Chen, Q.; Hu, K.; Yue, W.; Qi, J.; Li, Z. Improved population mapping for China using remotely sensed and points-of-interest data within a random forests model. Sci. Total Environ. 2019, 658, 936–946. [Google Scholar] [CrossRef] [PubMed]
  28. Chen, W.; Zhou, Y.; Wu, Q.; Chen, G.; Yu, B. Urban Building Type Mapping Using Geospatial Data: A Case Study of Beijing, China. Remote Sens. 2020, 12, 2805. [Google Scholar] [CrossRef]
  29. Zhang, X. Geoscene-Based Modeling and Analysis of Urban Functional Zoning. Geogr. Geo-Inf. Sci. Geogr. Geo-Inf. Sci. 2020, 36, 149. [Google Scholar]
  30. Winkler, W.E. The State of Record Linkage and Current Research Problems. In Statistical Research Division, US Census Bureau; Citeseer: Tokyo, Janpan, 1999. [Google Scholar]
  31. Cohen, W.W.; Ravikumar, P.; Fienberg, S.E. A Comparison of String Distance Metrics for Name-Matching Tasks. In Proceedings of the IIWeb, Acapulco, Mexico, 9–10 August 2003; Volume 2003, pp. 73–78. [Google Scholar]
  32. Yeh, C.H.; Loh, C.H.; Tsai, K.C. Overview of Taiwan Earthquake Loss Estimation System. Nat. Hazards 2006, 37, 23–37. [Google Scholar] [CrossRef]
  33. Wang, X.; Yang, L.; Wang, D.; Zhen, L. Improved TF-IDF Keyword Extraction Algorithm. Comput. Sci. Appl. 2013, 3, 64–68. [Google Scholar]
  34. Chen, W.; Huang, H.; Dong, J.; Zhang, Y.; Tian, Y.; Yang, Z. Social functional mapping of urban green space using remote sensing and social sensing data. ISPRS J. Photogramm. Remote Sens. 2018, 146, 436–452. [Google Scholar] [CrossRef]
  35. Alonzo, M.; Bookhagen, B.; Roberts, D.A. Urban tree species mapping using hyperspectral and lidar data fusion. Remote Sens. Environ. Interdiscip. J. 2014, 148, 70–83. [Google Scholar] [CrossRef]
  36. Xia, J.; Yokoya, N.; Iwasaki, A. Fusion of Hyperspectral and LiDAR Data with a Novel Ensemble Classifier. IEEE Geosci. Remote Sens. Lett. 2018, 15, 957–961. [Google Scholar] [CrossRef]
  37. Yan, J.; Zhou, W.; Han, L.; Qian, Y. Mapping vegetation functional types in urban areas with WorldView-2 imagery: Integrating object-based classification with phenology. Urban For. Urban Green. 2018, 31, 230–240. [Google Scholar] [CrossRef]
Figure 1. Various types of parks in satellite images of Beijing (al).
Ijgi 10 00824 g001
Figure 2. The study area of Beijing and Hangzhou, China.
Ijgi 10 00824 g002
Figure 3. PKU Urbanscape Essential Dataset for Beijing and Hangzhou.
Ijgi 10 00824 g003
Figure 4. Points of interest (POIs) data of tourist attraction and Park and Square in Beijing and Hangzhou.
Ijgi 10 00824 g004
Figure 5. Urban park classification process.
Ijgi 10 00824 g005
Figure 6. The workflow of the text similarity measurement.
Ijgi 10 00824 g006
Figure 7. Classification results of urban parks using POI data.
Ijgi 10 00824 g007
Figure 8. Multi-source data fusion process of Beijing. (a) POI data of urban parks, (b) urban functional zone (UFZ) data, and (c) data synthesis image.
Ijgi 10 00824 g008
Figure 9. Urban functional zones of no practical significance in Beijing.
Ijgi 10 00824 g009
Figure 10. Connected urban functional zone are automatically divided. (a) OpenStreetMap road data, (b) urban functional zone data, and (c) data fusion used for automatic segmentation.
Ijgi 10 00824 g010
Figure 11. POI attribute mapping methods.
Ijgi 10 00824 g011
Figure 12. Social attribute determination flow chart.
Ijgi 10 00824 g012
Figure 13. Map of Beijing urban parks.
Ijgi 10 00824 g013
Figure 14. Local details of Beijing urban park map (ae).
Ijgi 10 00824 g014
Figure 15. Map of Hangzhou urban parks.
Ijgi 10 00824 g015
Figure 16. Local details of Hangzhou urban park map (ae).
Ijgi 10 00824 g016
Figure 17. Proportion distribution of 12 types of urban parks in Beijing and Hangzhou.
Ijgi 10 00824 g017
Figure 18. Comparison of 12 types of urban parks in Beijing and Hangzhou.
Ijgi 10 00824 g018
Table 1. Urban parks type definition.
Definition
Comprehensive ParkWith abundant recreational features, corresponding facilities, and large land scale, and suitable for all kinds of public outdoor activities
Community ParkA concentrated green space with a small area for recreational features and facilities for nearby residents
Recreational ParkA small open park for the public to relax and walk outdoors
Sports and Fitness ParkA special park with sports and fitness facilities for various competitions and training as well as for daily leisure, fitness, and sports activities
Waterfront ParkClose to a city’s river or beach; employs vegetation, bank slope, or water surface as a special park feature
Historical GardenHistorical importance with a high visibility garden
Botanical GardenA scientific research unit that investigates, collects, identifies, introduces, domesticates, preserves, and promotes plants and their uses as well as provides a garden with public access
Heritage ParkA park dominated by important historical sites and/or memorials
Wetland ParkA park of predominantly grassy wetlands
Forest ParkA park built with a large area of artificial or natural forest as the main attraction
ZooA place where wild animals are exhibited for public educational purposes or study
Amusement ParkA large park with a variety of large recreational facilities for the public
Table 2. PKU Urbanscape Essential Dataset class and definition.
IDClassDefinition
1WoodlandsWoodland, grassland, etc.
2WaterNatural and artificial water bodies
3Undeveloped zonesUndeveloped land within cities, villages, and towns, and bare soil
4Transport zonesCity roads, transportation facilities, etc.
5GreenPublic open space such as parks and protective green space
6Industrial zonesIndustrial, mining, storage
7Institutional zonesAdministrative, cultural, educational, sports, health, etc.
8Commercial zonesCommercial and entertainment, etc.
9Residential-1 zonesLow-rise residences
10Residential-2 zonesMultiple, medium, and high-rise residences
11Residential-3 zonesShantytowns, rural homesteads, etc.
12Agriculture zonesFarmland, paddy field, orchard, etc.
Table 3. The lookup table for reclassifying points of interest (POIs) categories into urban park types.
The Initial Classification System of POIA Framework for the Classification of POI Urban Parks
Level ILevel IILevel III
Tourist AttractionPark & SquareParkComprehensive Park
Botanical GardenCommunity Park
AquariumRecreational Park
City PlazaSports and Fitness Park
Facilities within the ParkWaterfront Park
Scenery SpotWorld HeritageHistorical Garden
Provincial View SpotBotanical Garden
Memorial HallHeritage Park
Wetland Park
Forest Park
Zoo
Amusement Park
Table 4. Social attribute classification.
Monofunctional ParkMultifunctional Park
Sports and Fitness ParkComprehensive Park
Botanical GardenCommunity Park
Amusement ParkWaterfront Park
Heritage ParkWetland Park
Historical GardenForest Park
ZooRecreational Park
Table 5. The confusion matrix of urban park mapping results.
CPPCMPRPSPWFTHGBGHPWLPFPZooAPUA (%)
CPP2128253201120089.8
CMP517220000000065.4
RP20730000000058.3
SP320350000000087.5
WFT100010001100076.9
HG310311801000066.7
BG000000800000100.0
HP30000309020052.9
WLP20003000800061.5
FP200200000140077.8
Zoo000000000040100.0
AP000000000004100.0
PA (%)91.0%60.7%63.6%70.0%58.8%78.3%100.0%75.0%80.0%77.8%100.0%100.0%
OA: 82.8%Kappa: 0.74
(CPP, Comprehensive Park; CMP, Community Park; RP, Recreational Park; SP, Sports and Fitness Park; WFT, Waterfront Park; HG, Historical Garden; BG, Botanical Garden; HP, Heritage Park; WLP, Wetland Park; FP, Forest Park; AP, Amusement Park; PA, Producer’s Accuracy; UA, User’s Accuracy; OA, Overall Accuracy).
Table 6. The urban park area ratio.
The Urban-Park-Area Ratio
BeijingHangzhou
The total area of urban parks (km2)272.42225.92
The proportion of urban park area (%)11.028.56
Table 7. The confusion matrix was used to calculate POI classification accuracy.
C POICO POIR POIS POIWF POIH POIB POIHE POIWL POIF POIZ POIA POIUA (%)
C POI3718353431171190.9
CO POI530420000000073.2
R POI605130400000079.7
S POI840570000000082.6
WF POI700024011100168.6
H POI810314801000077.4
B POI201000200000087.0
HE POI1420003038050061.3
WL POI201030002500080.6
F POI800200000970090.7
Z POI000000200014087.5
A POI10010000000675.0
PA (%)85.966.785.078.177.481.476.992.792.689.093.375.0
OA: 84.3% Kappa: 0.79
(C POI, Comprehensive Park POI; CO POI, Community Park POI; R POI, Recreational Park POI; S POI, Sports and Fitness Park POI; WF POI, Waterfront Park POI; H POI, Historical Garden POI; B POI, Botanical Garden POI; HE POI, Heritage Park POI; WL POI, Wetland Park POI; F POI, Forest Park POI; Z POI, Zoo POI; A POI, Amusement Park POI; PA, Producer’s Accuracy; UA, User’s Accuracy; OA, Overall Accuracy).
Table 8. Comparison of the effects of social attribute recognition.
Accuracy before Social Attribute RecognitionAccuracy after Social Attribute Recognition
CPPCMPRPFPUA (%) CPPCMPRPFPUA (%)
CPP23482494.4CPP21282294.6
CMP7213067.7CMP5172070.8
RP518057.1RP207077.8
FP4201875.0FP2001487.5
PA (%)93.665.661.581.8 PA (%)95.968.063.687.5
OA: 0.89Kappa: 0.69 OA: 0.92Kappa: 0.74
(CPP, Comprehensive Park; CMP, Community Park; RP, Recreational Park; FP, Forest Park; PA, Producer’s Accuracy; UA, User’s Accuracy; OA, Overall Accuracy).
Publisher’s Note: MDPI stays neutral with regard to jurisdictional claims in published maps and institutional affiliations.

