Abstract
Previous VideoGIS integration methods mostly used geographic homography mapping. However, the related processing techniques were mainly for independent cameras and the software architecture was C/S, resulting in large deviations in geographic video mapping for small scenes, a lack of multi-camera video fusion, and difficulty in accessing real-time information with WebGIS. Therefore, we propose real-time web map construction based on the object height and camera posture (RTWM-HP for short). We first consider the constraint of having a similar height for each object by constructing an auxiliary plane and establishing a high-precision homography matrix (HP-HM) between the plane and the map; thus, the accuracy of geographic video mapping can be improved. Then, we map the objects in the multi-camera video with overlapping areas to geographic space and perform the object selection with the multi-camera (OS-CDD) algorithm, which includes the confidence of the object, the distance, and the angle between the objects and the center of the cameras. Further, we use the WebSocket technology to design a hybrid C/S and B/S software framework that is suitable for WebGIS integration. Experiments were carried out based on multi-camera videos and high-precision geospatial data in an office and a parking lot. The case study’s results show the following: (1) The HP-HM method can achieve the high-precision geographic mapping of objects (such as human heads and cars) with multiple cameras; (2) the OS-CDD algorithm can optimize and adjust the positions of the objects in the overlapping area and achieve a better map visualization effect; (3) RTWM-HP can publish real-time maps of objects with multiple cameras, which can be browsed in real time through point layers and hot-spot layers through WebGIS. The methods can be applied to some fields, such as person or car supervision and the flow analysis of customers or traffic passengers.
1. Introduction
With the rapid development of information technology, video surveillance technology has been widely used in security control, smart city construction, natural resource monitoring, and other fields [1,2,3,4]. Compared with traditional monitoring technologies, such as laser speed-measuring devices, induction coils, etc., surveillance video has the advantages of a low price, real-time application, and high definition. Furthermore, it has been an important component of information platforms, such as criminal detection, violation investigation, traffic supervision, and land monitoring. Currently, public places usually deploy numerous cameras [5]. Security personnel mostly use the pane view to observe each surveillance video, which makes the information scattered, independent, and difficult to combine. This mode brings a large number of difficulties with regard to overall observation, comprehensive research and judgment, simulation, and prediction. Compared with a video surveillance system, a geographic information system (GIS) mainly presents spatiotemporal information in the form of 2D or 3D maps. Spatiotemporal data are managed through a rigorous spatial reference system, which can ensure the geographic location and direction of the extracted objects when video and geospatial data are fused and can realize the unified management of video data and geographic data [6,7,8]. The integration of a video surveillance system and GIS, namely, VideoGIS, can simultaneously take advantage of these [9,10,11], and it has become one of the hot topics in current GIS research. At present, VideoGIS has made great progress, mainly in two fields: GIS and computer vision (CV). In the field of GIS, both Chinese and international scholars have obtained many research results in mutual mapping between video and 2D/3D GIS [12,13,14], video coverage models of GIS [15,16], and spatial–temporal VideoGIS analysis [17,18,19,20,21]. In the field of CV, studies mainly focus on intelligent video analysis algorithms [22,23]. With the development of deep learning technology, object detection algorithms and their accuracy are continuously being improved [24,25]. The application of specific scenarios is close to the practical level in terms of accuracy and efficiency.
However, previous research mainly used geographic homography mapping, the related processing was mainly for independent cameras, and the software architecture was C/S, resulting in large deviations in geographic video mapping in small scenes, a lack of fusion of multi-camera videos, and difficulty in accessing real-time information for WebGIS. In the GIS field, the traditional homography matrix solution mainly depends on homonymous points in the video and 2D map, and object height information is not considered. For a large scene, a traditional homography matrix can meet the application’s demands [26]; however, for a small scene, the accuracy is low, so it is essential to consider the object height in image space and constrain it in a plane. In the CV field, the fusion of multi-camera image/video mostly concentrates on the image space [27]. Image-based fusion methods mostly use SIFT, SURF, and other feature points for stitching [28], and the perspective of each camera is quite different. A stitched image will cause ghosting and dislocation, resulting in difficulty in merging the same object captured with different cameras [29]. In addition, the scope of object activities was not considered, and there was a lack of position adjustment. Therefore, it is necessary to fuse objects under multiple cameras based on GIS. Moreover, most existing VideoGIS platforms adopt the C/S architecture [30,31] and mainly use independent and closed local area networks. It is difficult to interoperate this method with other web information platforms, and it cannot be accessed through the internet. Based on GIS, multi-camera object information fusion can make the spatial–temporal information multi-source, sophisticated, and collaborative, and it can achieve a better sharing of resources [32]. To summarize, based on GIS, this paper proposes a new method of real-time web map construction based on the object height and camera posture (RTWM-HP), which includes three aspects: (1) a higher-precision homography matrix calculation method (HP-HM) based on the object height; (2) an algorithm for object selection in overlapping FOVs (OS-CDD) based on the confidence of the object, the distance, and the angle between the object and the camera; (3) a real-time method for publishing maps of objects with multiple cameras. In addition, we develop a multi-camera spatial–temporal information fusion framework that is easily compatible with other network information platforms.
The structure of this paper is as follows: Section 2 provides an overview of the literature. Section 3 describes the processing flow and related technical details of the RTWM-HP. In Section 4, the real-time mapping method and the visualization effect are discussed and analyzed according to the experimental results. Section 5 summarizes the main conclusions and discusses planned future work.
2. Literature Review
Facing an increasing number of cameras, it is urgent to improve the accuracy of object mapping, solve the problem of the fusion of the same object from multiple cameras, display video information on the map, and expand the degree of information sharing. In this section, we introduce related works from three perspectives: mutual mapping between video and geographic space, object detection, and the integration of video and GIS.
2.1. Mutual Mapping between Video and Geographic Space
The mutual mapping of surveillance video and 2D geospatial data aims to realize the mutual conversion between the image coordinates of surveillance video and 2D map coordinates, and it can realize the mutual sharing of data and achieve the purpose of mutual enhancement [7]. This mainly includes the mapping of surveillance video to geospatial data and the mapping of geospatial data to surveillance video, both of which are based on the geometric mutual mapping model. The methods of video geo-specialization are divided into three categories: methods based on a camera model [33,34,35], methods based on the intersection between sight and DEM [36], and methods based on a homography matrix [26,37]. However, the above three methods have shortcomings in geographic mapping. Methods based on a camera model need to define the parameters of the camera. Such methods require accurate camera calibration in advance, and the process is tedious and time-consuming. Methods based on the intersection between sight and DEM are executed by calculating the intersection point of the line of sight with the video and DEM. These methods require a high-precision DEM and are suitable for small-scale scenes with few artificial objects. For methods based on a homography matrix, it is necessary for the area in the image and the corresponding area in the map or remote sensing image to be flat. This is suitable for mutual mapping between fixed-camera video and 2D geospatial data. This method can meet the needs of mutual mapping in a large scene [38,39,40]. In summary, for small scenes, such as an office or parking lot, we improve the homography method by creating auxiliary surfaces in video images to improve the accuracy of mapping.
2.2. Object Detection
Object detection is used to predict the category and location of an object in a video, which is very important for real-time GIS mapping. Object detection algorithms based on deep learning obtain the object features automatically through a convolutional neural network. Girshick R. et al. proposed the R-CNN [41] and Fast R-CNN [42] algorithms, which introduced the CNN method into the object detection field to improve the accuracy of the object. However, the integration of various parts of the algorithms is difficult, and the detection speed is slow. To improve the speed of object detection, Ren et al. optimized and improved the Fast R-CNN algorithm and proposed the Faster R-CNN [43] algorithm to form an end-to-end object detection framework. Redmon J. et al. proposed the YOLO series [44,45,46] of algorithms, which introduced the idea of regression, and the detection effect was effectively improved. However, the detection effect is still not ideal for small objects and objects that are close to each other. Liu W. et al. proposed the SSD [47] algorithm, which inherited the regression idea from YOLO and the anchor mechanism from Faster R-CNN. It is less affected by the performance of the basic model and can achieve real-time detection. In summary, the existing object detection models are not aimed at typical geographic scenes and have poor generalization ability. Therefore, we need to conduct object training on geographic scenarios based on experimental requirements. In this paper, for GIS-related applications, based on SSD, models of a person’s head and car were trained to interact with office and parking lot scenes.
2.3. Integration of Video and GIS
A map is an important carrier of geographic information and a vital form of expression of spatial phenomena [48]. VideoGIS is mainly used to express video information in different geographical locations through visual maps [49]. It is also mainly used for the fusion of video images and lacks the fusion of image object information [50,51]. Faced with multiple cameras with an overlapping FOV, the object will be imaged on different cameras, resulting in a large amount of redundant data, and it is difficult to extract useful information. Therefore, it is necessary to design an algorithm to select an object from multiple cameras.
The VideoGIS construction technology has two architectures: C/S (client/server) and B/S (browser/server) [52]. The former is widely used and has many functions. It is mostly used in internal systems. However, it is difficult for other systems to interoperate with this approach, and it is independent and closed. At present, the C/S architecture is mainly oriented toward a specific number of users, mainly concentrated in a local area network, which is difficult to use on a large scale. B/S is an improvement upon the C/S architecture and is the current development direction of the application system [53]. B/S has the advantages of convenient access, and users can view the geographic spatial data through a browser. WebGIS mainly uses the B/S architecture [54,55]. However, for VideoGIS, it cannot be realized only by relying on the existing WebGIS because it involves a large amount of real-time video processing. This processing requires high-performance computing, which must be carried out in an application of C/S architecture. Considering the requirements of high-performance computing and real-time map publishing, this paper combines C/S and B/S to integrate a video surveillance system and WebGIS.
3. Methodology
In this paper, we propose a new method of real-time web map construction based on multiple cameras and GIS (named RTWM-HP), which takes into account the object height and camera posture. The RTWM-HP method involves three main steps. The first step is geographic video mapping. The high-precision homography matrices (named HP-HM) between multiple cameras and a 2D map are calculated. Through an object detection model, the type and minimum bounding rectangle (MBR) of each object are extracted. The pixel coordinate of each object is converted into the corresponding geographic coordinate. The methods of the HP-HM calculation, object detection, and geographic mapping are depicted in Section 3.1. The second step is object optimization. Based on geographic video mapping, we perform object selection in an overlapping FOV (named OS-CDD). Furthermore, in order to achieve better map visualization, the objects’ positions in the map must be adjusted (named OPA). The method of object optimization and location adjustment is discussed in Section 3.2. The third step is real-time publishing. In order to better integrate with other systems or meet the needs of internet access, this paper designs a mixed-software architecture of C/S and B/S. The functions mainly include the pushing and forwarding of real-time object streams. Section 3.3 introduces the implementation process of the real-time map. The proposed workflow is shown in Figure 1.
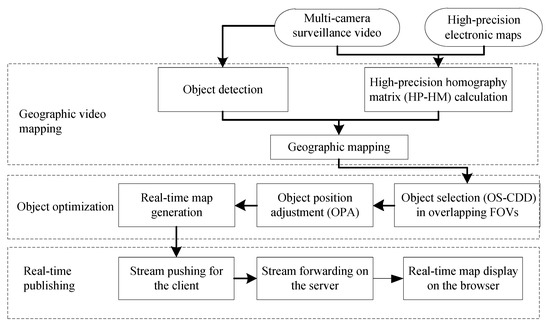
Figure 1.
Flowchart of the RTWM-HP method.
3.1. Geographic Video Mapping
3.1.1. High-Precision Homography Matrix Calculation
The first problem to be solved in this study is the conversion from pixel coordinates into geographic coordinates; namely, video spatialization. The camera collects the video of the real world in perspective using pixel coordinates, while the map or remote sensing image is the orthophoto of the real world using geographic coordinates. When converting the monitored scene onto a plane, the traditional method is the homography method [26]. Firstly, four or more corresponding points between the video and corresponding remote sensing images or map are selected. Then, based on these corresponding points, the conversion matrix is calculated.
For example, if points p (p1, p2…pn) are the feature points in the video, the points P (P1, P2…Pn) are the corresponding points in the map or remote sensing data. The relationship between p and P is shown in Equation (1). H (H11, H12, H13, H21, H22, H23, H31, H32, H33) is a 3 × 3 matrix. By using H, the pixel coordinate can be converted into the corresponding geographic coordinate, and the opposite coordinate transformation can be realized through H−1 (H inverse matrix).
The above method is suitable for some large scenes. The objects (people, cars, etc.) in the video can be directly mapped to the map by the H-matrix. The mapping accuracy can meet the application requirements. However, for a small scene, the camera height is relatively low. If this method is adopted, the object’s position will deviate greatly.
Based on the knowledge that the height of the monitored objects is approximate and the virtual plane formed by their top is roughly parallel to the ground, a high-precision H-matrix calculation method (named HP-HM) is proposed in this paper. Firstly, a virtual plane is created in video and the feature points are selected. As shown in Figure 2, where (a) is an indoor scene, an auxiliary surface is created based on the positions of the heads of the persons, and six control points are selected, from p1 to p6. In the same way, b is an outdoor scene. Based on the top of the vehicle, a virtual plane is also created and six control points are selected. Secondly, from the high-precision electronic map or remote sensing image, the corresponding points are selected. Finally, the H-matrix is calculated.

Figure 2.
The virtual plane. The left image (a) is an indoor scene and the right image (b) is an outdoor scene.
If there are multiple cameras in the monitored scene, the respective homography matrices (Hi) can be calculated, and we can obtain homography matrices Hc, and Hc = {H1, H2… Hn}.
3.1.2. Object Detection
Object detection means that the computer automatically determines the supervised objects from videos. Usually, after object detection, the minimum bounding rectangle (MBR), category, and confidence of the object can be obtained. The MBR uses pixel units. As shown in Figure 3, in the left image, five human heads are detected.
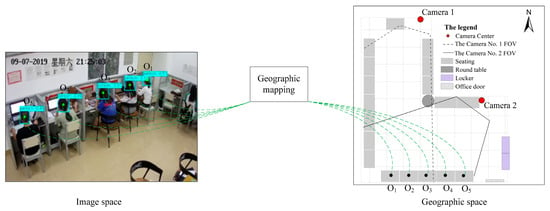
Figure 3.
Object detection and geographic mapping.
At present, the object detection SSD algorithm based on deep learning has achieved good results in terms of accuracy and efficiency. Based on the SSD model, through transfer learning, according to the GIS application, the human head model and the car model were separately trained, and they are represented by Headmodel and Carmodel. The specific process of model training and use was as follows: Firstly, the scene video was collected, and the objects that needed to be supervised were labeled; secondly, based on the pre-trained model, these labeled data were trained to obtain the required model; thirdly, the model only needed to be trained once, and then it could be applied in similar scenarios.
3.1.3. Geographic Mapping
Geographical mapping refers to mapping of an object in an image space to a geographic space through a homography matrix. In this paper, based on the object detection models and the HP-HM calculation of each camera, the objects of each camera can be mapped to geographic space. As shown in Figure 3, in the left image, based on Headmodel, five human head objects (O1 to O5) were detected, and we could obtain the center point of each object MBR. Then, through the HP-HM of camera 2, these objects could be mapped to the map.
3.2. Object Optimization
Object optimization in geographic space is a process of fusing objects to create a real-time object distribution map. It mainly includes object selection in overlapping FOVs, object position adjustment, and real-time map generation.
3.2.1. Object Selection in Overlapping FOVs
A specific location P, such as a seat in the office, will be imaged by multiple cameras. If they are projected onto the map, there will be multiple objects at that location on the map. As shown in Figure 4a, C1 and C2, respectively, represent two cameras, Cc1 and Cc2 represent the main optical axis, and the P point object will be imaged by both cameras. However, due to the offset of geographic mapping, the same object from the two cameras cannot be exactly at point P on the map, but will be near that point.
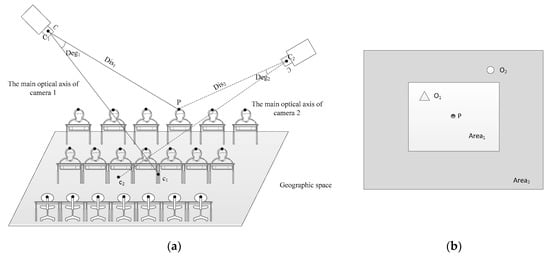
Figure 4.
Object selection in overlapping FOVs. (a) A scene of two cameras; (b) the range of location P.
In order to make a unique selection for the same object in the map, multiple objects of location P in the map need to be analyzed according to the spatial relationship. Thus, we proposed a new method for an object selection algorithm (named OS-CDD) to determine the unique object, as shown in Figure 4b. Firstly, from the map, we select the area corresponding to point P, which is represented by Area1, which is a white quadrilateral in Figure 4b; secondly, we perform buffer analysis on Area1 and set the buffer radius to half of the height of Area1, and the buffer result is Area2, which is the gray area in Figure 4b; thirdly, we select the objects that fall within the range of Area2 to form the object set Os and Os = {O1,O2…On}, where n represents the number of cameras. If there are two or more objects captured by the same camera in the area, the one closest to the point P will be kept.
For the objects in Os, the best one needs to be selected according to certain conditions. Combining object detection accuracy and object imaging posture, three factors for object selection are selected. The optimization factors are as follows: the confidence of the object (Con), the distance from the object to the camera (Dis), and the angle between the object and camera center line and the main optical axis (Deg).
Con: The confidence of each object can be obtained after object detection using Headmodel or Carmodel trained by the SSD-based algorithm. Con represents the probability of an object being at a certain position in the image.
Dis: The distance between P and C; P represents the location of the object in geographic space, which is obtained from the pixel coordinates of the object in the image space after homography transformation. As shown in Figure 4a, for the object at position P, the distances from the two cameras are PC1 and PC2, respectively. Dis is calculated through Equation (2).
Deg: Assuming that point is the coordinate of the intersection point between the main optical axis and the ground, Deg is the angle between and , as shown in Equations (3) and (4).
In order to express the object optimization with a unique index, the three factors are normalized, and then the mean value is obtained, which is named Availability. The normalized method is shown in Equations (5)–(7). The Availability is represented by UAve, as shown in Equation (8).
Finally, the object with the largest UAve in Os corresponding to the object (O) is selected as the only optimized object.
3.2.2. Object Position Adjustment
Object position adjustment (named OPA) is the process of moving the object position (Oi) to the nearest seat or car seat (P) in a geographic space. As shown in Figure 5, Oi is the selected object of location P from multiple cameras. In order to display a more suitable map, we need to move Oi to P.
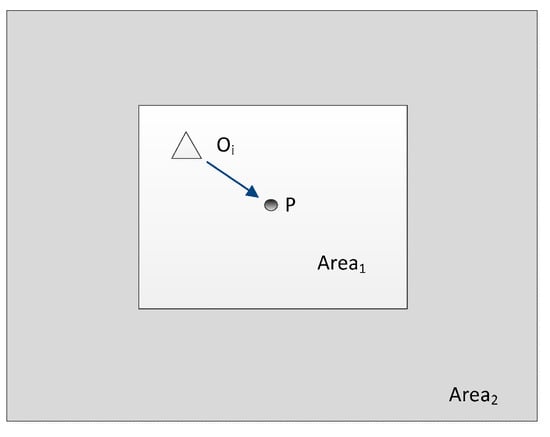
Figure 5.
Object position adjustment.
3.2.3. Real-Time Map Generation
Real-time map generation needs to symbolize each object and generate a heat map, which includes two major processes: point symbol and heat map design. The point symbol is composed of the object icon and the duration, which can indicate the existence of the object and its duration information. The duration of the object is the difference between the detection start time (T0) and the end time (T1) when the object leaves the position. In this paper, the kernel density estimation algorithm is used, and the heat map of object distribution expresses the aggregation of objects with different colors. Kernel density estimation is the calculation of the data aggregation status in the whole region based on the input element dataset (discrete point elements). Using point elements as the core, a circular surface is created with a given search radius. Then, the number of point elements within that circle surface is counted. The kernel density [56] is calculated as in Equation (9).
where n is the number of point elements within the search radius, h is the search radius, function K is the kernel density function, and represents the distance from the estimated point to the sample point.
3.3. Real-Time Web Map Publishing
Currently, real-time map data from multiple cameras are mostly displayed by standalone or client-based software, which greatly limits their application [57]. This paper provides a real-time map service based on multiples cameras that includes the type, location, and time information of the objects. The service is open, in real time, and easily integrated with WebGIS. At the same time, due to the demand for real-time access to object stream data through the internet, a new software architecture was designed, mainly including stream pushing for the client, stream forwarding on the server, and real-time map display on the browser, as shown in Figure 6.
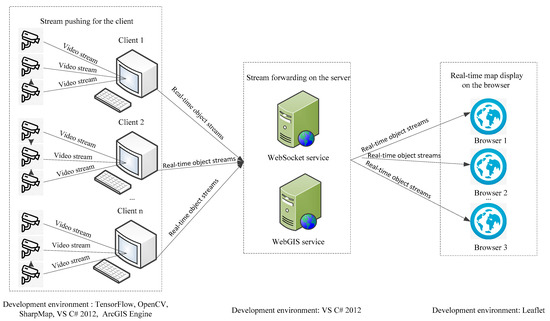
Figure 6.
The video WebGIS system architecture.
3.3.1. Stream Pushing for the Client
Stream pushing for the client involves a client that receives video streams from multiple cameras and performs real-time information fusion through geographic video mapping and object optimization. Then, it sends the fused results of real-time object streams to the WebSocket server by WebSocket technology. The WebGIS server provides a basic map service.
3.3.2. Stream Forwarding on the Server
Stream forwarding on the server means that the browser provides a rectangular range (lower-left and upper-right coordinate values) and sends requests to the servers. The WebSocket server and WebGIS server receive the requests from the browser and forward the received real-time object streams to the browser.
3.3.3. Real-Time Map Display on the Browser
According to the user’s needs, the browser receives real-time object stream data (SelObjsInfo) from the WebSocket server based on the extent of the requested map. Then, the object streams are visualized in the map through a point symbol layer and heat map layer, where each point represents an object. If it is a person object, it is represented by a head symbol, and car objects are represented by a car symbol. The browser displays the real-time object stream data through HTML5. The real-time object stream data (SelObjsInfo) include the object ID, object type, longitude, latitude, time, and other property information, as shown in Table 1.

Table 1.
The real-time object stream data.
4. Experiments and Results
4.1. Experimental Environment and Data
In the case study, TensorFlow, OpenCV, SharpMap, VS C# 2012, ArcGIS Engine, etc. were used, and we developed a real-time web map system based on multiple cameras and GIS. The computer environment of the object detection model training included a CPU (Intel Core i5 6300HQ) and GPU (GTX-1060 with 8G). In this paper, we selected an office and a parking lot as the experimental area, as shown in Figure 7 and Figure 8. We deployed two cameras with an overlapping FOV in an office and a parking lot, respectively. The corresponding electronic maps of the two regions were made. At the same time, we collected head samples in the office, including 7333 back-view and 67,324 front-view samples, which included an open dataset [58]. At the same time, we collected 8500 car samples in the parking lot.
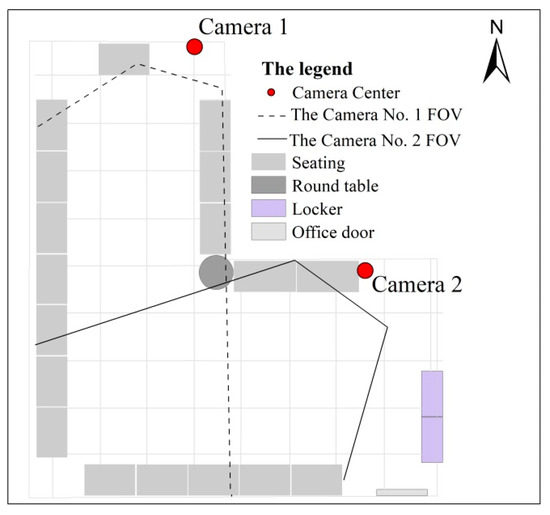
Figure 7.
The 2D map of an office.
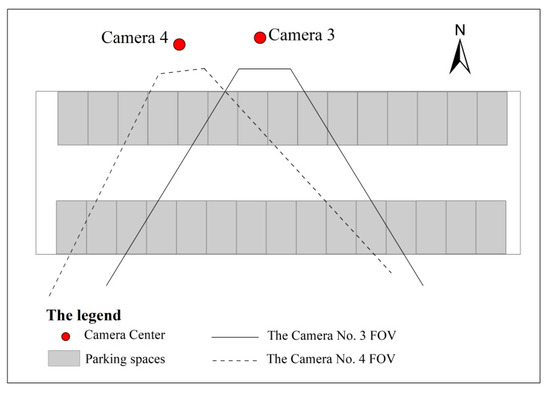
Figure 8.
The 2D map of a parking lot.
4.2. Experimental Results
4.2.1. HP-HM Calculation
In the experimental area of the office, the heights of the heads and the desk fences were approximately the same when the staff were sitting. When the homography matrices of the two cameras were calculated in this scene, we selected the top of the desk fence and the corresponding position of the high-precision electronic map as the control points. Similarly, for the parking lot experimental area, the car locations and the center points of the corresponding parking spaces in the high-precision electronic map were used as the control points.
4.2.2. Object Detection Effect
A TensorFlow Object Detection API pre-training model was used to train the human head and car sample data in the two scenarios. For example, for the office scene, the human head samples were divided into a training set and test set according to a ratio of 4:1. The training time was 545 min with 15,260 steps, and the training accuracy was 97%. The object detection effect in the office experimental area is shown in Figure 9, where the head objects are displayed with rectangles, and the number in the upper-right corner represents the degree of confidence.
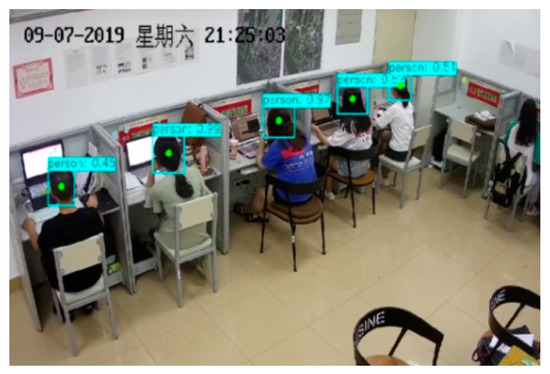
Figure 9.
The detection effect of office employees’ heads.
To evaluate the actual effect, some frames were selected for verification, where n represents the number of missed or wrongly detected objects, m represents the total number of objects in a frame, and PR represents the accuracy of object detection; the calculation is performed according to Equation (10).
The actual test was carried out for two experimental scenes. One frame was extracted every minute—20 frames were extracted in total, and the frame numbers started from 1. The results shown in Figure 10 are the object detection accuracies of the office and parking lot scenes. The lowest object detection accuracies for the office and parking lot were 83.33% and 80%, and the highest were both 100%.
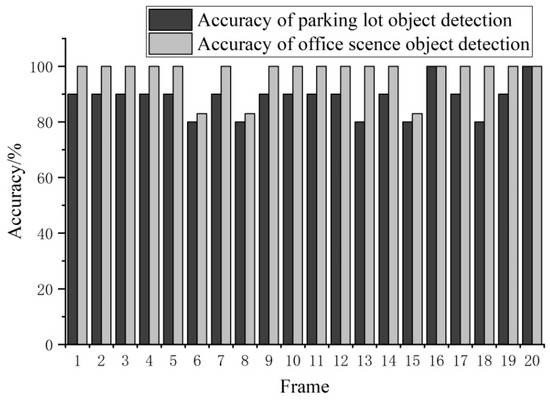
Figure 10.
The object detection accuracy in different scenarios.
4.2.3. Object Mapping Deviation of Different Homography Matrices
In the office, Camera 1 selected eight experimental points, and Camera 2 selected seven experimental points. In the parking lot, Camera 3 selected nine experimental points, and Camera 4 selected eight experimental points. These object points were numbered in order. We set the geographic coordinates of the seat center and car center in the 2D map to the true values. For the experimental points, we calculated their mapping coordinates through the traditional homography matrix method and the HP-HM method. represents the offset of the calculated value and true value, as shown in Equation (11). is the difference between the x coordinates of two points. is the y difference.
As shown in Figure 11 and Figure 12, for the office scene, the offsets of the object geographic coordinates calculated by the HP-HM method were all less than 1 m, and in the parking lot experimental area, the geographic coordinate offsets calculated by the HP-HM method were all less than 6 m. The geographic coordinate offsets calculated by the traditional homography matrix method were larger, and the maximum was 15.83 m.
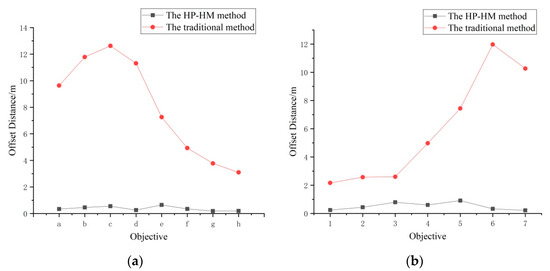
Figure 11.
The object mapping deviation of different homography matrices in the office: (a) Camera 1 and (b) Camera 2.
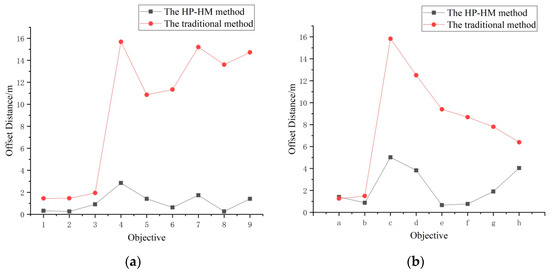
Figure 12.
The object mapping deviation of different homography matrices in the parking lot: (a) Camera 3 and (b) Camera 4.
4.2.4. The Calculation of the OS-CDD Algorithm
After object detection and mapping for each camera in the two experimental areas, the object optimization was performed based on the OS-CDD algorithm. Figure 13 shows the objects in the overlapping FOVs of Cameras 1 and 2 in the office scene. The five objects detected by Camera 1 are listed as a, b, c, d, and e. The five objects detected by Camera 2 are numbered 3, 4, 5, 6, and 7. Meanwhile, Figure 14 shows the objects in the overlapping FOVs of Cameras 3 and 4 in the parking lot. The six objects detected by Camera 3 are numbered 3, 4, 5, 6, 7, and 8, while the six objects detected by Camera 4 are listed as a, d, e, f, g, and h.
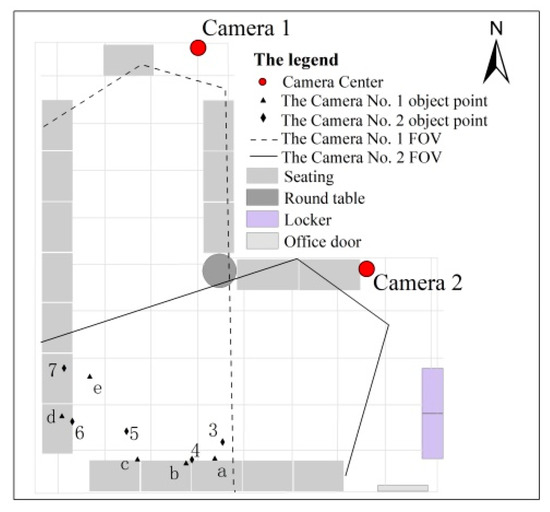
Figure 13.
The objects’ distribution in the overlapping FOV of the office.
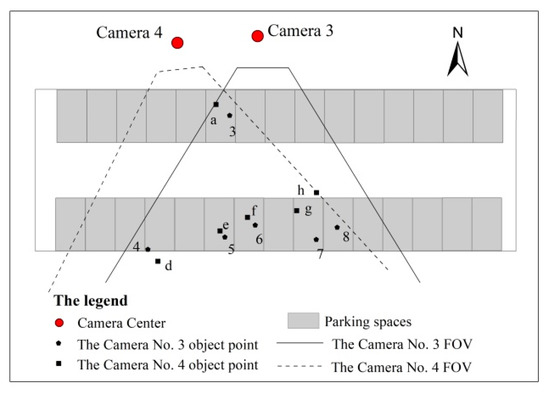
Figure 14.
The objects’ distribution in the overlapping FOV of the parking lot.
For objects in the overlapping field, a unique selection was made based on the optimization factors, and the object with the largest UAve was identified as the unique object. Table 2 and Table 3 show the results of the OS-CDD algorithm for the office and parking lot experimental areas, respectively. For example, in the office scene, the letter a and number 3 were the same object. The UAve of a was 0.73 while the UAve of 3 was 0.897; thus, 3 was the optimized object.

Table 2.
The OS-CDD algorithm for an overlapping field in the office.

Table 3.
The OS-CDD algorithm for an overlapping field in the parking lot.
4.2.5. Comparative Analysis
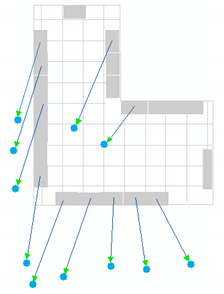
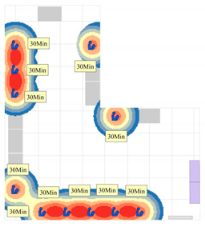
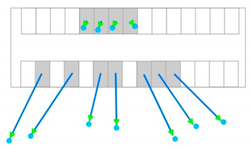
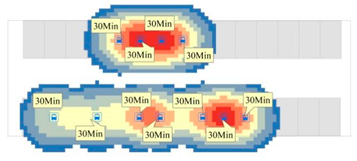
In order to show the effect of the RTWM-HP method more clearly, we produced real-time maps of the traditional method and RTWM-HP method, respectively, as shown in Table 4. The traditional method displays the final effect of the map after using the traditional homography matrix, the OS-CDD method to select objects, and the OPA method to adjust the objects’ positions. RTWM-HP displays the final effect of the map through the HP-HM method for geographic video mapping, the OS-CDD method for selecting objects, and the OPA method for adjusting the objects’ positions and heat layer generation. Obviously, the RTWM-HP method has advantages in terms of mapping accuracy and map visualization, which are mainly reflected in three aspects. (1) The solved homography matrix has higher accuracy. In the traditional homography matrix method, the homography matrix is solved based on the ground in the video with the corresponding points in the 2D map. This matrix has a large offset when it is applied to the mapping of a person’s head or a car to the 2D map. The starting point of the arrow in Table 4 is the real position and the end is the position solved by the traditional method, and the maximum deviation reaches 15.83 m. However, the HP-HM method not only has higher mapping accuracy, but can also accurately locate the actual position after the position adjustment operation. (2) High object detection accuracy: In this paper, we used a deep learning method to train two scenes—indoor and outdoor—and the object detection accuracy was greater than 96%. Especially for indoor scenes, we comprehensively considered the two situations of a front view and back view of the human head, and the object detection accuracy was greatly improved. (3) The fusion effect of overlapping FOV objects is better. The OS-CDD algorithm takes into account the camera attitude and confidence, which is more effective in selecting high-quality objects. Furthermore, based on the numbers of people and cars, the heat maps are separately generated, which further improves the visualization effect of the map. To summarize, the OS-CDD algorithm and OPA method provide an effective fusion of objects from multiple cameras to obtain a more reasonable position of the objects in the map. The expression of symbols not only highlights the real-time status, but also expresses the duration.

Table 4.
The effects of real-time maps based on the traditional method and our method.
4.3. The Design and Realization of a Real-Time Web Publishing System
This system is oriented toward the need for the integration of WebGIS and videos. In WebGIS, Leaflet was selected as the experimental platform; the software is open source and uses the JavaScript language. For the videos, we selected OpenCV or Emgu to implement the related algorithms, which are also open source; OpenCV uses the C++ language. Emgu is the twin version of OpenCV and uses the C# language. The publishing system adopts a mixed architecture of C/S and B/S and includes three parts.
The first part is VideoMapCreateSys, which is used for the fusion of multiple cameras. The main function includes camera connection, object detection, video geographic mapping, object fusion, object stream sending, etc. For the object stream sending function, the software sends the fused object stream data to the server and uses the WebSocket to connect the server.
The second part is VideoServerSys, which is deployed on the server. VideoServerSys uses the WebSocket library to implement the function of receiving the information from VideoMapCreateSys and forwarding this information to the browser. At the same time, the common WebGIS server is also deployed on the server, mainly including the GIS data.
The third part is VideoBrowserSys, which is used by common users through the internet. It adopts Leaflet to realize the general WebGIS functions. Most importantly, it realizes the functions of the WebSocket stream request and reception from VideoServerSys. Based on the browser, VideoBrowserSys can display the real-time object information and create the heat map. The main interface is shown in Figure 15. The object stream data and hotspot map in the platform are the data used in the previous experiments in this paper. The top area of the map is the indoor experimental scene and the bottom area is the parking lot scene.
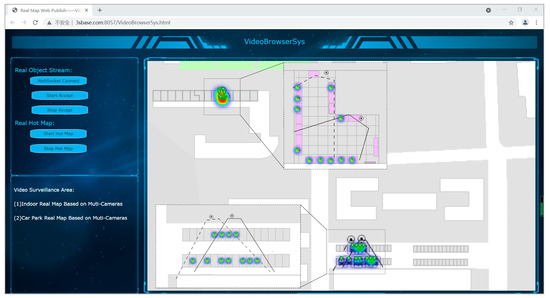
Figure 15.
The main interface of VideoBrowserSys.
The three systems cooperate with each other to realize the in-depth integration of multiple cameras and WebGIS. On the one hand, the unified management of video data is realized through WebGIS, which can easily locate, measure, and analyze the objects in graphic scenes. On the other hand, real-time and high-precision object stream data provide rich data sources for WebGIS, which can further broaden the GIS applications in many other fields, such as in smart cities, security protection, etc.
5. Conclusions and Discussion
Previous studies on VideoGIS paid little attention to the demand for the high-precision geographic mapping of video in small scenes and the fusion of multi-camera videos with large attitude differences. Moreover, it is difficult to access real-time maps through the internet. Therefore, a real-time map construction method called RTWM-HP is proposed. We carried out comprehensive and in-depth explorations into the method design, algorithm implementation, experimental comparison, and prototype system development. This study makes the following contributions: (1) The calculation in the HP-HM method based on prior knowledge is proposed. According to the reference objects with similar heights, such as persons or cars in the scene, and their corresponding positions in the 2D map, the calculated matrix is made more accurate. (2) The OS-CDD algorithm was built. The comprehensive optimization is performed based on confidence, distance, and the angle with respect to the camera center point. (3) The method of OPA and map visualization was designed. In the 2D map, we designed an algorithm for object position adjustment. The heat layer and duration can enrich real-time map information. In addition, a real-time map platform based on multiple cameras was designed and implemented to meet the requirements of real-time WebGIS.
The RTWM-HP method can be used to enhance existing network map applications, such as Google Maps, Baidu Maps, etc., and can be applied to areas such as smart cities, emergency rescue, and security. However, this method has several shortcomings: (1) Due to the differences in object posture in a scene, such as that of a person, whose posture can include standing, sitting, squatting, etc., this paper uses a single mapping matrix method, which will cause a large mapping deviation. It is necessary to accurately detect an object’s posture and build multiple mapping matrices in a follow-up study. (2) For the problem of fusion of objects with overlapping FOVs from multiple cameras, the objects mapped to the map are merged according to a fixed distance, which has a great impact on the accuracy of object fusion. It is important to study the geometric relationships among the mapping deviation, the object size, and the distance threshold value in future research. (3) In this paper, the RTWM-HP experiments were carried out for only four camera videos in two scenes. For large-scale camera networks, it is also necessary to deeply study the methods of fast retrieval and multi-scale visualization of real-time maps. Therefore, in future research, we will pay more attention to real-time cartography technology for large-scale camera networks in complex scenes, which will promote the further application of VideoGIS.
Author Contributions
Xingguo Zhang conceived and designed the method and coordinated the implementation. Xinyu Shi and Xiaoyue Luo conceived the idea for the project and supervised and coordinated the research activities. Yinping Sun and Yingdi Zhou helped to support the experimental datasets and analyzed the data. All authors participated in the editing of the paper. All authors have read and agreed to the published version of the manuscript.
Funding
The work described in this paper was supported by the National Natural Science Foundation of China (NSFC) (NO. 41401436), the Natural Science Foundation of Henan Province (NO. 202300410345), and the Nanhu Scholars Program for Young Scholars of XYNU.
Institutional Review Board Statement
Not applicable.
Informed Consent Statement
Not applicable.
Data Availability Statement
Not applicable.
Acknowledgments
The author appreciates the editors and reviewers for their comments, suggestions, and valuable time and efforts in reviewing this manuscript.
Conflicts of Interest
The authors declare no conflict of interest.
References
- Milosavljevic, A.; Dimitrijevic, A.; Rancic, D. GIS-augmented video surveillance. Int. J. Geogr. Inf. Sci. 2010, 24, 1415–1433. [Google Scholar] [CrossRef]
- Naoyuki, K.; Yoshiaki, T. Video monitoring system for security surveillance based on augmented reality. In Proceedings of the 12th International Conference on Artificial Reality and Telexistence, Tokyo, Japan, 4–6 December 2002; pp. 180–181. [Google Scholar]
- Li, D.R. Brain Cognition and Spatial Cognition: On Integration of Geo-spatial Big Data and Artificial Intelligence. Geomat. Inf. Sci. Wuhan Univ. 2018, 43, 1761–1767. [Google Scholar]
- Oner Sebe, I.; Hu, J.H.; You, S.Y. 3D video surveillance with augmented virtual environments. In Proceedings of the First ACM SIGMM International Workshop on Video Surveillance, Berkeley, CA, USA, 2–8 November 2003; pp. 107–112. [Google Scholar]
- Wang, X.G. Intelligent multi-camera video surveillance: A review. Pattern Recognit. Lett. 2013, 34, 3–19. [Google Scholar] [CrossRef]
- Lewis, J. Open Geospatial Consortium Geo-Video Web Services. 2006. Available online: http://www.opengeospatial.org/legal/ (accessed on 15 February 2006).
- Zhang, X.G.; Liu, X.J.; Wang, S.N.; Liu, Y. Mutual Mapping between Surveillance Video and 2D Geospatial Data. Geomat. Inf. Sci. Wuhan Univ. 2015, 40, 1130–1136. [Google Scholar]
- Cheng, Y.; Lin, K.; Chen, Y.; Tarng, J.; Yuan, C.; Kao, C. Accurate planar image registration for an integrated video surveillance system. In Proceedings of the IEEE Workshop on Computational Intelligence for Visual Intelligence, Nashville, TN, USA, 30 March–2 April 2009. [Google Scholar]
- Sobral, A.; Vacavant, A. A comprehensive review of background subtraction algorithms evaluated with synthetic and real videos. Comput. Vis. Image Underst. 2014, 122, 4–21. [Google Scholar] [CrossRef]
- Milosavljević, A.; Rančić, D.; Dimitrijević, A.; Predić, B.; Mihajlović, C. Integration of GIS and video surveillance. Int. J. Geogr. Inf. Sci. 2016, 30, 2089–2107. [Google Scholar] [CrossRef]
- Xie, X.; Zhu, Q.; Zhang, Y.T.; Zhou, Y.; Xu, W.P.; Wu, C. Hierarchical Semantic Model of Geovideo. Acta Geod. Cartogr. Sin. 2015, 44, 555–562. [Google Scholar]
- Liu, Z.D.; Dai, Z.X.; Li, C.M.; Liu, X.L. A fast fusion object determination method for multi-path video and three-dimensional GIS scene. Acta Geod. Cartogr. Sin. 2020, 49, 632–643. [Google Scholar]
- Hsu, S.; Samarasekera, S.; Kumar, R.; Sawhney, H.S. Pose estimation, model refinement, and enhanced visualization using video. In Proceedings of the IEEE Conference on Computer Vision and Pattern Recognition. CVPR 2000 (Cat. No.PR00662), Hilton Head Island, SC, USA, 13–15 June 2000; Volume 1, pp. 488–495. [Google Scholar]
- Zhou, F. Research on the registration and rendering method of video image enhanced virtual 3D scene. Acta Geod. Cartogr. Sin. 2019, 48, 801. [Google Scholar]
- Gao, F.; Wang, M.Z.; Liu, X.J.; Wang, Z.R. A Road Network Coverage Optimization Method in Surveillance Camera Network. Geomat. Inf. Sci. Wuhan Univ. 2020, 45, 362–373. [Google Scholar]
- Mavrinac, A.; Chen, X. Modeling coverage in camera networks: A survey. Int. J. Comput. Vis. 2013, 101, 205–226. [Google Scholar] [CrossRef]
- Song, H.Q.; Liu, X.J.; Lv, G.N.; Zhang, X.G. A Cross-camera Adaptive Crowd Density Estimation Model. Chin. Saf. Sci. J. 2013, 23, 139–145. [Google Scholar]
- Sawhney, H.S.; Arpa, A.; Kumar, R.; Samarasekera, S.; Hanna, K.J. Video Flashlights: Real Time Rendering of Multiple Videosfor Immersive Model Visualization. In Proceedings of the 13th Eurographics Workshop on Rendering Tech-Niques, Pisa, Italy, 26–28 June 2002. [Google Scholar]
- Xie, Y.J.; Wang, M.Z.; Liu, X.J.; Wu, Y.G. Intergration of GIS and moving objects in surveillance video. ISPRS Int. J. Geo-Inf. 2017, 6, 94. [Google Scholar] [CrossRef]
- Pissinou, N.; Radev, I.; Makki, K. Spatio-temporal modeling in video and multimedia geographic information systems. GeoInformatica 2001, 5, 375–409. [Google Scholar] [CrossRef]
- Wu, C.; Zhu, Q.; Zhang, Y.T.; Du, Z.Q.; Zhou, Y.; Xie, X.; He, F. An Adaptive Organization Method of Geovideo Data for Spatio-Temporal Association Analysis. ISPRS Ann. Photogramm. Remote Sens. Spat. Inf. Sci. 2015, 2, 29. [Google Scholar] [CrossRef]
- Viola, P.; Jones, M. Rapid object detection using a boosted cascade of simple features. In Proceedings of the IEEE Conference on Computer Vision and Pattern Recognition, Kauai, HI, USA, 8–14 December 2001; pp. 511–518. [Google Scholar]
- Dalal, N.; Triggs, B. Histograms of oriented gradients for human detection. In Proceedings of the IEEE Conference on Computer Vision and Pattern Recognition, San Diego, CA, USA, 20–25 June 2005; pp. 886–893. [Google Scholar]
- Sultana, F.; Sufian, A.; Dutta, P. A review of object detection models based on convolutional neural network. Intelligent Computing: Image Processing Based Applications. Adv. Intell. Syst. Comput. 2020, 1157, 1–16. [Google Scholar]
- Chen, K.Q.; Zhu, Z.L.; Deng, X.M.; Ma, C.X.; Wang, Z.A. A survey of deep learning research on multi-scale target detection. J. Softw. 2021, 32, 1201–1227. [Google Scholar]
- Sourimant, G.; Morin, L.; Bouatouch, K. GPS, GIS and video registration for building reconstruction. In Proceedings of the 2007 IEEE International Conference on Image Processing, San Antonio, TX, USA, 16 September–19 October 2007; Volume 6, pp. 401–404. [Google Scholar]
- Gonzalez-Diaz, R.; Jimenez, M.J.; Medrano, B. Topological tracking of connected components in image sequences. J. Comput. Syst. Sci. 2018, 95, 134–142. [Google Scholar] [CrossRef]
- Usmani, D.; Ahmad, T.; Akram, M.U.; Saeed, A.D. Fundus image mosaic generation for large field of view. In Proceedings of the 2014 14th International Conference on Hybrid Intelligent Systems, Kuwait City, Kuwait, 14–16 December 2014; pp. 30–34. [Google Scholar]
- Ma, Y.Y.; Zhao, G.; He, B. Design and implementation of a fused system with 3DGIS and multiple-video. Comput. Appl. Softw. 2012, 29, 109–112. [Google Scholar]
- Kong, Y.F. Design of GeoVideo Data Model and Implementation of Web-Based Video GIS. Geomat. Inf. Sci. Wuhan Univ. 2010, 35, 133–137. [Google Scholar]
- Foresti, G.L. A real-time system for video surveillance of unattended outdoor environments. IEEE Trans. Circuits Syst. Video Technol. 1998, 8, 697–704. [Google Scholar] [CrossRef]
- Zhang, X.G. Research on Multi-Camera Object Tracking with Geographic Scene Collaboration. Ph.D. Thesis, Nanjing University, Nanjing, China, 2014. [Google Scholar]
- Jones, G.A.; Renno, J.R.; Remagnino, P. Auto-calibration in multiple-camera surveillance environments. In Proceedings of the IEEE International Workshop on Performance Evaluation of Tracking and Surveillance, Copenhagen, Denmark, 1 January 2002. [Google Scholar]
- Hartley, R.I.; Zisserman, A. Multiple View Geometry in Computer Vision; Cambridge University Press: Cambridge, UK, 2004. [Google Scholar]
- Zhang, Z.; Li, M.; Huang, K.; Tan, T. Practical camera auto-calibration based on object appearance and motion for traffic scene visual surveillance. In Proceedings of the IEEE Conference on Computer Vision & Pattern Recognition, Anchorage, AK, USA, 5 August 2008. [Google Scholar]
- Kanade, T.; Collins, R.; Lipton, A.; Burt, P.; Wixson, L. Advances in cooperative multi-sensor video surveillance. In Proceedings of the DARPA Image Understanding Workshop, Monterey, CA, USA, 20–23 November 1998. [Google Scholar]
- Sankaranarayanan, K.; Davis, J.W. A Fast Linear Registration Framework for Multi-Camera GIS Coordination. In Proceedings of the fifth IEEE International Conference on Advanced Video and Signal Based Surveillance (AVSS 2008), Santa Fe, NM, USA, 1–3 September 2008. [Google Scholar]
- Collins, R.T.; Lipton, A.J.; Fujiyoshi, H.; Kanade, T. Algorithms for cooperative multisensor surveillance. Proc. IEEE 2001, 89, 1456–1477. [Google Scholar] [CrossRef]
- Tan, T.N.; Sullivan, G.D.; Baker, K.D. Recognizing objects on the ground-plane. Image Vis. Comput. 1994, 12, 164–172. [Google Scholar] [CrossRef]
- Stein, G.; Romano, R.; Stein, G. Monitoring activities from multiple video streams: Establishing a common coordinate frame. IEEE Trans. Pattern Anal. Mach. Intell. 1999, 22, 758–767. [Google Scholar]
- Girshick, R.; Donahue, J.; Darrell, T.; Malik, J. Rich feature hierarchies for accurate object detection and semantic segmentation. In Proceedings of the IEEE Conference on Computer Vision and Pattern Recognition, Columbus, OH, USA, 28 June 2014; pp. 580–587. [Google Scholar]
- Girshick, R. Fast R-CNN. In Proceedings of the 2015 IEEE International Conference on Computer Vision (ICCV), Santiago, Chile, 7–13 December 2015; pp. s1440–s1448. [Google Scholar]
- Ren, S.Q.; He, K.M.; Girshick, R.; Sun, J. Faster R-CNN: Towards Real-Time Object Detection with Region Proposal Networks. IEEE Trans. Pattern Anal. Mach. Intell. 2015, 39, 1137–1149. [Google Scholar] [CrossRef]
- Redmon, J.; Divvala, S.; Girshick, R.; Farhadi, A. You only look once: Unified, real-time object detection. In Proceedings of the IEEE Conference on Computer Vision and Pattern Recognition, Las Vegas, NV, USA, 27–30 June 2016; pp. 778–779. [Google Scholar]
- Redmon, J.; Farhadi, A. YOLO9000: Better, faster, stronger. Computer Vision and Pattern Recognition. In Proceedings of the 2017 IEEE Conference on Computer Vision and Pattern Recognition (CVPR), Honolulu, HI, USA, 21–26 July 2017; pp. 6517–6525. [Google Scholar]
- Redmon, J.; Farhadi, A. YOLOV3: An incremental improvement. arXiv 2018, arXiv:1804.02767. [Google Scholar]
- Liu, W.; Anguelov, D.; Erhan, D.; Szegedy, C.; Reed, S.; Fu, C.Y.; Berg, A.C. SSD: Single Shot MultiBox Detector. In European Conference on Computer Vision; Springer International Publishing: Cham, Switzerland, 2016; pp. 21–37. [Google Scholar]
- Chen, K.W.; Lee, P.J.; Hung, L. Egocentric View Transition for Video Monitoring in a Distributed Camera Network, Advances in Multimedia Modeling; Springer: Berlin/Heidelberg, Germany, 2011. [Google Scholar]
- Haan, G.; Scheuer, J.; Vries, R.; Post, F. Egocentric navigation for video surveillance in 3D virtual environments. In Proceedings of the IEEE Symposium on 3D User Interfaces, Lafayette, LA, USA, 14–15 March 2009. [Google Scholar]
- Wang, Y.; Bowman, D.A. Effects of navigation design on Contextualized Video Interfaces. In Proceedings of the IEEE Symposium on 3D User Interfaces, Singapore, 19–20 March 2011. [Google Scholar]
- Lewis, P.; Fotheringham, S.; Winstanley, A. Spatial video and GIS. Int. J. Geogr. Inf. Sci. 2011, 25, 697–716. [Google Scholar] [CrossRef]
- Yoo, H.H.; Kim, S.S. Construction of facilities management system combining video and geographical information. KSCE J. Civ. Eng. 2004, 8, 435–442. [Google Scholar] [CrossRef]
- Leleito, E.; Ohgai, A.; Koga, M. Using videoconferencing and WebGIS to support distributed concurrent urban planning workshops. AIJ J. Technol. Des. 2009, 15, 541–546. [Google Scholar] [CrossRef][Green Version]
- Mathiyalagan, V.; Grunwald, S.; Reddy, K.R.; Bloom, S.A. A WebGIS and geodatabase for Florida’s wetlands. Comput. Electron. Agric. 2005, 47, 69–75. [Google Scholar] [CrossRef]
- Shiffer, M.J. Interactive multimedia planning support: Moving from stand-alone systems to the World Wide Web. Environ. Plan. B Plan. Des. 1995, 22, 649–664. [Google Scholar] [CrossRef]
- Anderson, T.K. Kernel density estimation and k-means clustering to profile road accident hotspots. Accid. Anal. Prev. 2009, 41, 359–364. [Google Scholar] [CrossRef] [PubMed]
- Sacchi, C.; Fabrizio, G.; Regazzoni, C.S.; Oberti, F. A real-time algorithm for error recovery in remote video-based surveillance applications. Signal Process. Image Commun. 2002, 17, 165–186. [Google Scholar] [CrossRef]
- Peng, D.; Sun, Z.; Chen, Z.; Cai, Z.; Xie, L.; Jin, L. Detecting heads using feature refine net and cascaded multi-scale architecture. In Proceedings of the 2018 24th International Conference on Pattern (ICPR), Beijing, China, 29 November 2018. [Google Scholar]
Publisher’s Note: MDPI stays neutral with regard to jurisdictional claims in published maps and institutional affiliations. |
© 2021 by the authors. Licensee MDPI, Basel, Switzerland. This article is an open access article distributed under the terms and conditions of the Creative Commons Attribution (CC BY) license (https://creativecommons.org/licenses/by/4.0/).
