Abstract
Human ecology has played an essential role in the spread of mosquito-borne diseases. With standing water as a significant factor contributing to mosquito breeding, artificial containers disposed of as trash—which are capable of holding standing water—provide suitable environments for mosquito larvae to develop. The development of these larvae further contributes to the possibility for local transmission of mosquito-borne diseases in urban areas such as Zika virus. One potential solution to address this issue involves leveraging unmanned aerial vehicles that are already systematically becoming more utilized in the field of geospatial technology. With higher pixel resolution in comparison to satellite imagery, as well as having the ability to update spatial data more frequently, we are interested in investigating the feasibility of unmanned aerial vehicles as a potential technology for efficiently mapping potential breeding grounds. Therefore, we conducted a comparative study that evaluated the performance of an unmanned aerial vehicle for identifying artificial containers to that of conventionally utilized GPS receivers. The study was designed to better inform researchers on the current viability of such devices for locating a potential factor (i.e., small form factor artificial containers that can host mosquito breeding grounds) in the local transmission of mosquito-borne diseases. By assessing the performance of an unmanned aerial vehicle against ground-truth global position system technology, we can determine the effectiveness of unmanned aerial vehicles on this problem through our selected metrics of: timeliness, sensitivity, and specificity. For the study, we investigated these effectiveness metrics between the two technologies of interest in surveying a study area: unmanned aerial vehicles (i.e., DJI Phantom 3 Standard) and global position system-based receivers (i.e., Garmin GPSMAP 76Cx and the Garmin GPSMAP 78). We first conducted a design study with nine external participants, who collected 678 waypoint data and 214 aerial images from commercial GPS receivers and UAV, respectively. The participants then processed these data with professional mapping software for visually identifying and spatially marking artificial containers between the aerial imagery and the ground truth GPS data, respectively. From applying statistical methods (i.e., two-tailed, paired t-test) on the participants’ data for comparing how the two technologies performed against each other, our data analysis revealed that the GPS method performed better than the UAV method for the study task of identifying the target small form factor artificial containers.
1. Introduction
Artificial containers—which are human-made containers as opposed to containers formed via natural processes—play an important role in the breeding of mosquitoes and the transmission of mosquito-borne diseases. Examples of such artificial containers that are capable of holding standing water include tires, bottles, plastic containers, vases, buckets, and cans. Although natural containers can support a higher density of mosquito larvae, artificial containers are found to contain a greater variety of mosquito species [1]. Artificial containers also serve as the primary habitat for the Aedes mosquito, including Aedes aegypti and Aedes albopictus [2].
According to the Centers for Disease Control and Prevention (CDC), Aedes aegypti Figure 1 is a vital mosquito in spreading vector-borne diseases. Such diseases include chikungunya, which can lead to symptoms like fever and joint pain in infected individuals [3]; dengue, which is a deadly disease in the tropical regions of the world where individuals infected with the dengue virus can suffer from high fever, low white blood cell count, and bodily pains/rashes [4]; and Zika, which can cause major problems in the pregnancies of infected women [5]. While the Aedes albopictus mosquito is less likely to spread these diseases, it is still a competent vector [5]. With a sufficient amount of standing water, Aedes aegypti mosquitoes can breed and lay eggs in the water, leading to the development of larvae [2]. With artificial containers disposed of in the outside environment as trash having the ability to collect and hold rainwater, the presence of Aedes aegypti mosquitoes at such containers can become an even greater possibility.
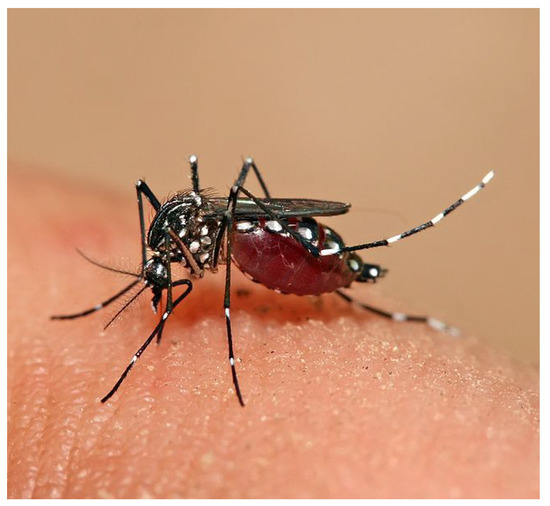
Figure 1.
An Aedes aegypti mosquito (Muhammad Mahdi Karim, https://commons.wikimedia.org/wiki/File:Aedes_aegypti_feeding.jpg, GNU Free Documentation License, Version 1.2, User: Muhammad Mahdi Karim, Wikimedia).
For urban areas in parts of the world in particular, artificial containers play a role as the primary mosquito habitat. One study conducted at a university campus in Malaysia focused on an area susceptible to dengue, where both artificial and natural containers were examined for suitable mosquito breeding sites [2]. Of the containers examined, 262 containers were identified as potential breeding sites, with 65 of the containers and more than half of the plastic containers discovered to have contained larvae. The study concluded that the presence of water in containers was the most significant factor in determining mosquito breeding.
Using geographic information system (GIS) technology to map the locations of artificial containers would help to determine potential future hotspots for mosquito breeding. Unmanned aerial vehicles (UAVs) have potential advantages over other types of geospatial technology, in that they provide high resolution imagery as well as having the ability to update spatial data in a real-time manner [6]. Prior research works have also specifically leveraged UAVs for addressing the various challenges in mapping potential mosquito breeding grounds (e.g., [7,8,9]).
Unlike these prior works, we focus our paper on a less-explored set of potential mosquito breeding grounds associated with smaller artificial containers such as bottles, cups, bags, and so on. These particular locations are relatively smaller and do not benefit from algorithms that locate visible patches of dark colors or water in similar papers that explore mosquito breeding ground identification. More specifically, our work investigates how a UAV would compare to ground-truth GPS technology for mapping in a small geographical area and identifying relatively smaller artificial containers in terms of time, cost, and accuracy [10]. We do so by investigating the effectiveness between unmanned aerial vehicles and global position system technology in surveying a study area. We first conducted a design study with nine external participants, who collected 678 waypoint data and 214 aerial images from commercial GPS receivers and UAV, respectively. The participants then processed these data with professional mapping software for visually identifying and spatially marking artificial containers between the aerial imagery and the ground truth GPS data, respectively. From applying statistical methods (i.e., two-tailed, paired t-test) on our selected metrics for measuring effectiveness, we describe how these two technologies perform against each other.
The remainder of this paper is organized as follows. Section 2 describes our literature review of various computing technologies that directly or peripherally relate to relevant mapping approaches for identifying objects of interest. Section 3 describes our methodology that compares our implemented approach that leverages UAV technology to the ground-truth GPS approach for mapping artificial containers in a real-world location. Section 4 details our results and discussions on the outcomes of comparing the two approaches. Section 5 describes potential next steps for expanding our work. Section 6 overviews and outlines the contributions of our work.
2. Related Work
Various computing technologies have been or could potentially be leveraged for mapping our target interest of mapping artificial containers, and we outline these representative technologies on what has been done for driving our implemented approach for comparison. Specifically, we investigate relevant works from approaches that leverage geospatial and image data from technologies such as from GPS, UAVs, and smartphones. We additionally discuss prior related UAV-driven approaches for mapping potential mosquito breeding grounds and how they differ from our work.
2.1. Geospatial Approach
Computing devices are becoming more intelligent and efficient as physical devices that connect to data from wireless and satellite networks [11]. For example, devices that utilize geospatial data from sensors such as GPS devices do so through a satellite-based system for receiving positioning information. This positioning information is provided via coordinates by measuring the distances between the receiver antennas and satellites, which have a known location. In absolute positioning, only data retrieved from the satellites are used in computing coordinates [12]. Through triangulation, positional accuracy can be achieved within centimeter accuracy, making the resulting coordinates ground-truth data [13]. The advantages of GPS include high accuracy, wide range of measurement, real-time capabilities, a common reference system and proximity to the location of measurement. Static and kinematic tests accessed with a GPS indicate a high level of accuracy. In 2002, a small antenna was installed at a known location, and GPS measurements were collected for 14.5 h. The standard deviations of the latitudinal and longitudinal coordinates were both less than 2 m, such that the re-positioning of the coordinates were consistent [13]. However, historical disadvantages of GPS include the potential high-cost of the receivers and their complex computer computations [12]. This high cost could prohibit public health organizations in global regions with smaller resources to afford the use of GPS for identifying potential mosquito breeding groups. More recent technological trends have led to declining costs of commercially available GPS devices that are becoming more standard on newer commercial UAVs and as low-cost independent devices with lower accuracies [14], and remain seldom studied in comparison to performance with existing high-cost GPS in their deployment on related mapping tasks to our work.
2.2. Computer Vision Approach
Approaches that leverage computer vision data from robots closely relate to our implementation and comparison study, and such approaches have been explored for various environments and activities (e.g., indoor workspaces [15]). These approaches also consist of outdoor visual identification activities in populated environments using UAVs, which involve low-altitude aerial photography capabilities for capturing photographs from low altitudes. To capture this photography, UAVs utilizes two components: GPS to attain geospatial accuracy and a sensor for data collection [16]. The sensors of these aircrafts utilize infrared sensitive films that can distinguish different types of vegetation, based on the varying spectral reflectance of plant species. Specifically, the reflectance of near-infrared radiation from leaf surfaces is between two and eight times greater than occurs in the visible part of the spectrum [17]. Compared to satellite imagery and GPS, camera images from UAVs could provide high-resolution pixels for providing clearer imagery that could potentially make visual identification more efficient.
2.2.1. Mapping Land Change
In a study of zoonotic malaria in Malaysia, researchers theorized that land change was a key factor in influencing the local transmission of the disease [6]. When a forest clearing occurred, this land change could be mapped quickly and updated with the use of a UAV, aiding in the study of the relationship that land change has on disease transmission.
2.2.2. Recognizing Objects from Imagery
Researchers in Sweden were interested in determining whether UAVs would visually recognize plant species from the processed imagery effectively [18]. Using a UAV, recruited participants produced a high-overlap orthomosaic with high spatial accuracy of one lake and one river. Identification of plant species was done visually, based on printouts of the images. The accuracy of identification at each test site was respectively 95.1% and 80.4%. When visualizing objects on imagery, the researchers observed: “The human interpreter considers a larger range of interpretation elements including size, shape, shadow, colour, texture, pattern, location, and associations with the object’s surrounding, and thus uses the full potential of the high-spatial resolution image.” In addition, the researchers shared that the ability of the UAV to fly at low altitudes, avoiding cloud interference, as well as the high overlap of the imagery (70%), enabled the production of a clear, high-resolution vegetation map.
2.2.3. Capturing Geographic Data
Researchers in Ireland conducted a study for assessing the spatial accuracy of a UAV against GPS technology [19]. In the study, a UAV was flown over the site with a 1 cm ground sampling distance (GSD) in a grid-like pattern to capture at least 80% image overlap. Moreover, 45 ground markers were utilized to capture known XYZ coordinates, and 728 photographs that were taken by the UAV were aligned and georeferenced. Distances were measured from the center of each target point—as they appeared on the orthomosaic—to the center of the target as measured by GPS, where the GPS data was compared with digital elevation model (DEM) data. From the study, the researchers observed that the UAV was more efficient in capturing geographic data in terms of time, cost, and accuracy. That is, the researchers observed that mapping the XYZ coordinates of the 45 ground markers with the high resolution camera-equipped UAV through photogrammetry achieved 95% reliability, which was similar in reliability to real-time kinetic (RTK) GPS.
2.3. Smartphone Approach
Smartphone devices—with the ability to connect to existing electronic databases—could provide quick, real-time updates that can minimize costs and data errors. With mosquitoes breeding in containers with standing water, researchers observed a group of surveyors using a smartphone mobile app to first enter data that were collected from each studied container, and then stored these data onto a server [20]. To minimize discrepancy, the surveyors were trained to use the smartphone mobile app. Both time and error were studied to assess the efficiency of the application in comparison to using paper to log data. Based on the sites of study, it took an additional 384 min to process the data from the paper to the database. Regarding accuracy, each container was identified with the type of container, the presence of water, the presence of mosquito pupae, and the presence of mosquito larvae. The results indicated that the duration of time and the proportion of errors with using the smartphone mobile app was lower compared to using paper. This study demonstrated that a low-cost approach such as with ubiquitous smartphones could be feasible for identifying potential mosquito breeding grounds in an effective manner. However, the approach also required the services of more than one person that was physically at the site, which may not scale as well as the number of sites for examining increases.
2.4. UAV Approach
As our work investigates a commercial UAV for surveying potential outdoor moquito breeding grounds, we explore recent representative literature that similarly utilizes UAVs in such surveying tasks and discuss how they differ from the work in this paper. Haas-Stapleton et al. [21] describe their UAV approach for surveying regions of potential mosquito breeding grounds, which involved equipping a UAV with a high-magnification camera for detecting color-contrasted artificial containers of varying sizes. Case [22] describes their work that incorporates a neural networks approach to aerial image data, which was collected from a commercial UAV data of densely-populated neighborhoods. Aragão [7] performed a study that investigated various modelings of optimal UAV configurations for use in identifying mosquito breeding grounds. Suduwella [8] described a UAV-based appraoch for surveying potential mosquito breeding grounds, which utilized certain dark colors from aerial images to locate environments associated with a certain subset of such mosquito breeding grounds. Dias [9] describes the work that targets the automatic detection of relatively larger artificial containers (e.g., abandoned tires, small pools of water) that are candidate mosquito breeding grounds.
From these described works, there has been strong progress in the usage of UAVs for surveying potential mosquito breeding grounds from aerial data of outdoor environments with artificial containers. At a high level, these prior related works often employ UAV approaches that are either specialized adaptations of existing commercial UAVs, investigate artificial containers with larger form factors or contrasting colors, or lack a comparative baseline study to baseline GPS surveying efforts. In comparison, the novelty of our work that differentiates from these prior works consists of at least the following: (1) a comparative study of publicly available devices for two prominent technologies for surveying mosquito breeding grounds (i.e., commercially available UAVs and GPS receivers) and mapping software tools, and (2) a study that involves non-experts utilizing these technologies for surveying less commonly investigated smaller form factor artificial containers. We believe that exploring these novelty points will provide researchers with valuable insights on the current state of UAV technologies to baseline GPS technologies. Furthermore, we hope to motivate the need for improved techniques on surveying work of such mosquito breeding sites and publicly-available devices that can lead to efforts, such as crowd-driven solutions for expanding surveying knowledge of potential spread of infectious diseases connected to mosquitoes.
3. Methodology
3.1. Equipment
For comparing the efficiency of UAV technology to GPS technology in terms of timeliness, sensitivity, and specificity, we utilized a DJI Phantom 3 Standard (i.e., the UAV) for the UAV technology Figure 2 and two Garmin GPS receivers—the Garmin GPSMAP 76Cx and the Garmin GPSMAP 78 (i.e., theGPS receivers)—for the GPS technology. The UAV has built-in GPS sensors as well as direction indicators, with a built-in camera that uses 2.7K HD Video and an aperture and 20 mm equivalent lens. The GPS receivers were capable of obtaining spatial (i.e., latitude and longitude) coordinates for a location within an accuracy of three meters.
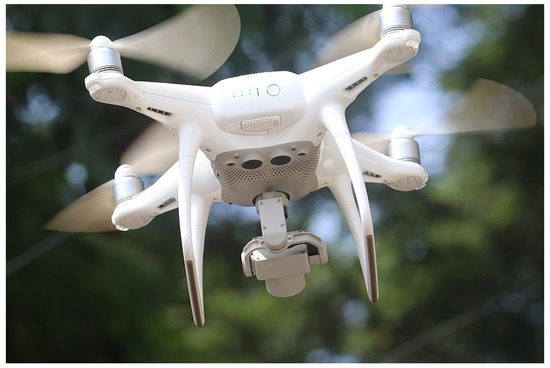
Figure 2.
DJI Phantom 3 Standard (TheSachuHopes, https://commons.wikimedia.org/wiki/File:DJI_phantom_Drone.jpg, Creative Commons Attribution-Share Alike 4.0 International, User:TheSachuHopes, Wikimedia).
3.2. Study Site
The area of interest for the study was an isolated parking lot of a demolished apartment complex, located in a student residential area near a public university (Figure 3). This area was chosen due in part to convenience sampling and for containing a large density of artificial containers disposed of as trash.
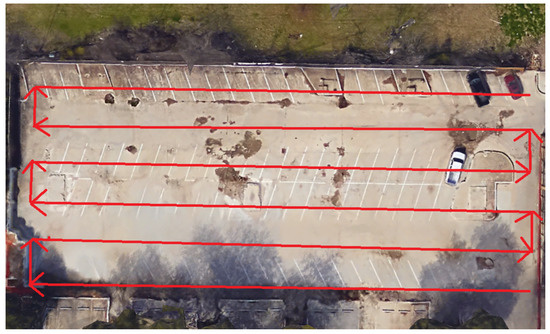
Figure 3.
Grid flight pattern of UAV.
3.3. Study Design
For the study design, we organized the study site (i.e., the target parking lot area) into length-wise divisions of two equal sections. In order to minimize our bias of gathering GPS spatial coordinates and identifying aerial imagery of locations of the artificial containers, we recruited nine (9) external participants to serve as volunteers for performing the study. Each volunteer was instructed on how to use the GPS receivers to obtain spatial coordinates for each object of interest, and then to make a note of the container’s type for future referencing. Volunteers surveyed one section of the study site by walking through the entirety of their assigned section in a grid-like pattern. That is, five volunteers individually surveyed one section, while the other four volunteers surveyed the other section. In addition to obtaining coordinates for each artificial container, each volunteer also took notes of the container’s type for later facilitating identification of the container from the aerial imagery. The following code system Table 1 was shared with the volunteers for identifying the different container types.

Table 1.
Code system for different container types for volunteers to identify. For plastic lids, we chose to label as “Plid” instead of “Pl” for greater clarity. We also separated the type of cups due to the larger proportion of plastic versus non-plastic ones.
The nine volunteers surveying their given section of the parking lot collected a total of 678 waypoints from the two GPS receivers, where the containing information consisted of the coordinates and type of each object that the volunteers identified as artificial containers. These waypoints were uploaded into the GPS receivers’ software that was organized by volunteers into individual files. To measure the accuracy of each volunteer’s aerial imagery identification against the GPS data, we utilized the participants’ collected GPS data from each section of the parking lot as the ground truth data. After labeling suitable artificial containers as viable candidates for holding standing water, we identified one section of the parking lot as containing a total of 66 artificial containers, while the other section as containing a total of 73 containers.
From the obtained aerial data, the volunteers geolocated and processed 214 images of the study site were geolocated and processed on Pix4dmapper (https://www.pix4d.com/), a photogrammetry software for professional drone mapping. Overall, 98% of the images (211 images) were calibrated in producing a high-resolution orthomosaic and DSM (digital surface model). There was a median of about 8318.78 matches per calibrated image. Georeferencing was not necessary, since the UAV featured a built-in GPS mechanism. The images were overlapped and transformed on a WGS84 image coordinate system (Figure 4 and Figure 5). The resulting orthomosaic and DSM were projected on an output WGS84/UTMzone 14N coordinate system.
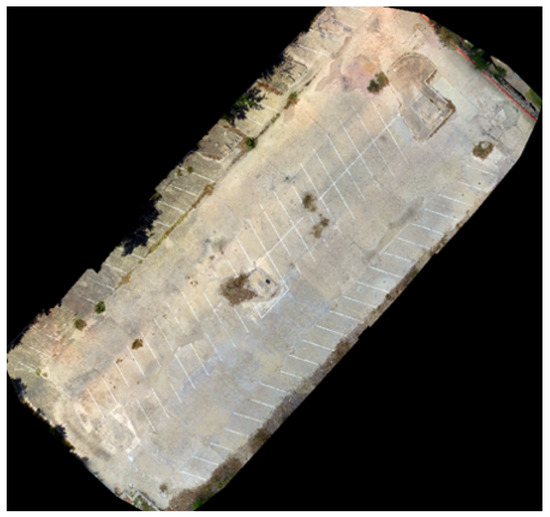
Figure 4.
Orthomosaic image of study site as true-color composite.
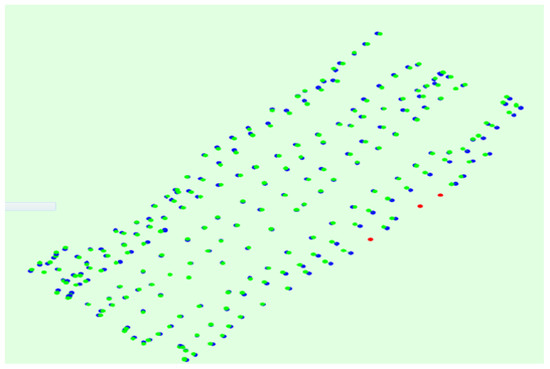
Figure 5.
Offset between initial image positions from the GPS coordinates (blue dots) and the calculated image positions from the photogrammetry analysis (green dots). Uncalibrated images (red dots).
The time length to process the orthomosaic and DSM images was 145 min. The output orthomosaic was subsequently imported into ArcMap 10.1 (https://desktop.arcgis.com/en/arcmap/) as four GeoTIFF files consisting of spectral bands. On ArcMap, these four bands were combined into a true-color composite band (RGB-123). We then imposed a fishnet on the image, in order to divide the lot into quadrants and facilitate in the identification process. The imposed fishnet resulted in 175 quadrants.
Using the composite image with the fishnet, each volunteer observed the section of the parking lot that they did not survey with the GPS receiver. The volunteers each used digitization to mark objects that they believed were artificial containers that could hold enough standing water for mosquito breeding. Moreover, each volunteer’s points were saved as its own shape file.
4. Results and Discussion
4.1. Data Analysis
When analyzing the experiments in comparison with each other, we contrasted each method in terms of the average time length to obtain the field data. When assessing sensitivity and specificity, we created a confusion matrix based on true positives, false positives, true negatives, and false negatives.
- A true positive is correctly identifying an object as an artificial container.
- A false positive is falsely identifying an object as an artificial container.
- A true negative is correctly identifying an object as not an artificial container. Identifying true negatives on the imagery was done on a sectional level.
- Lastly, a false negative is falsely identifying an object as not an artificial container.
The confusion matrix was based on the volunteers visually identifying artificial containers from the aerial imagery and contrasting their identifications with our obtained ground truth GPS data.
4.2. Results
Following the completion of the study, we received insights on different aspects of the study (Table 2 and Table 3). In terms of timeliness, we calculated the average time for a volunteer to survey a section of the parking lot with GPS information at 41 min, while the UAV imagery identification took 36 min. With that was generated from a two-tailed, paired t-test, we did not reject the null-hypothesis of the differences between the two time durations as not statistically significant. That is, there were no significant differences in the timeliness of the two approaches for surveillance.
Table 2.
Results from the UAV method.
Table 3.
Results from the GPS method.
In terms of sensitivity, we first counted the number of artificial containers from the GPS survey of the study site, which was 66 artificial containers for one section and 73 artificial containers for the other section. When comparing this ground truth data with the shape file data of each participant, the overall sensitivity of the UAV method was 42%, while the sensitivity of the GPS method was 90%. The GPS method demonstrated a higher specificity (82%) compared to the UAV method (29%). The F1-score, which uses precision and sensitivity to measure accuracy, was significantly higher with the GPS method (86%) in comparison to the UAV method (30%). Running a two-tailed, paired t-test on sensitivity, we calculated . From these calculations, we rejected the null-hypothesis of the differences between the two sensitivities as not significant and accepted the alternative hypothesis.
There were quadrants of the study site that contained true positives (green) and false negatives (red) from both methods that were more than two standard deviations above their respective averages (Figure 6 and Figure 7). These outliers were due to the presence of clusters of containers that were easily identifiable by volunteers, as well as clusters of containers being greatly obscured by natural constraints such as trees and shade.
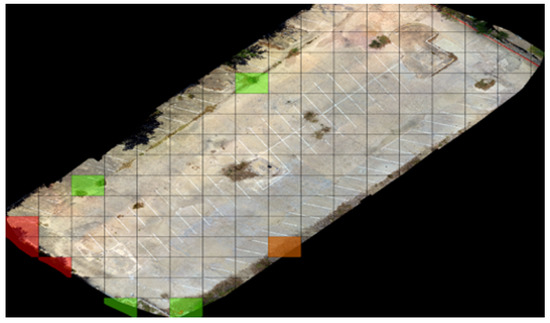
Figure 6.
UAV outliers of true positives and negatives.
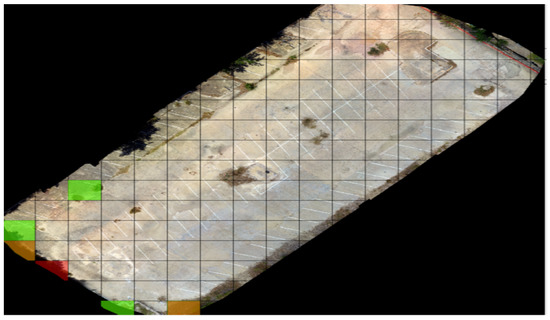
Figure 7.
GPS outliers of true positives and negatives.
4.3. Discussion
Based on the results of the study, we observed that the UAV method was not as efficient as the GPS method for identifying artificial containers as potential candidates for mosquito breeding. Specifically, the highest resolution from the UAV cameras could not provide texture and shape to many of the small-sized containers (e.g., bottle caps), which were incorrectly identified in the approach. Furthermore, a cluster of containers were obscured from the collected images. Possible ideas such as flying the UAV at a lower altitude—with a lower GSD—may increase the definition of small containers. Additionally, capturing impervious areas at a sufficient camera angle may lead to more identifiable respective containers. Given the risks of infectious diseases such as the Zika virus and the resources needed to identify and eradicate potential mosquito breeding areas, further investigation is needed to discover a method that is more efficient than the GPS method.
5. Future Work
The outcomes and insights of our work provide potential new ideas as next steps in expanding our work. We particularly focus on next steps that relate to improvements on the technical surveying approach with UAVs and extended ideas that involve deploying the UAV approach with real-world execution.
5.1. Areas for Improvement for UAV Method
The outcomes of our study demonstrated that the the baseline GPS approach performed better than the deployed approach for the UAV. However, we believe that there is strong potential in exploring other setups with the UAV approach that may lead to viable improvements over the conventional GPS method. With improvements in machine learning techniques (e.g., computer vision) and imaging technology (e.g., multispectral imaging), the process of identifying objects through automated tagging with would help improve the accuracy performance of UAV methods for surveying of artificial containers, especially those with smaller form factors as pursued in our study (e.g., similar to the neural network approach from [22]). There are also alternative approaches for leveraging UAVs in the surveying tasks, such as more closely taking images of candidate areas for artificial container identification of smaller form factors, which may present its own challenges with privacy and safety laws as noted by [22]); utilizing a hybrid approach that takes the strengths of both the UAV and GPS method for potentially enhancing the artificial container identification process, included with the growing ubiquity of newer low-cost GPS devices [14]; and completing UAVs with other types of mobile computing technologies for addressing the device limitations with a UAV-only method.
5.2. Real-World Deployment of UAV Approach
The focus of the work has been a comparative study between the UAV and GPS technologies. However, with the focus emphasizing the leveraging of commercial UAVs with default setups for surveying localized areas of artificial containers with smaller form factors, there is strong potential to explore qualitative studies with societal benefits. Specifically, an additional next step would involve recruiting participants with novice expertise to perform surveying tasks in their local communities as a way to crowdsource the surveying task, which would better inform both researchers and residents of those communities of potential risks of hazardous mosquito breeding grounds that may originate infectious diseases. Such a deployment of a UAV approach to the surveying task would evaluate the technical performance of the approach and the viability performance of conducting such a task.
6. Conclusions
Artificial containers that litter outdoor locations can gather water from weather precipitation, where such objects may serve as potential candidates for dangerous mosquito breeding that may lead to the spread of infectious diseases. In this work, we conducted a study that compared methods from two types of technologies—a UAV method and a GPS method—for identifying less explored smaller artificial containers that may serve as potential candidates for dangerous mosquito breeding grounds. Specifically, we explored the possibility of a novel method that leveraged UAV technology for comparison to conventional GPS technology for surveying a representative area containing real-world collections of artificial containers. We designed and conducted a study that recruited nine external participants for using commercial UAV and GPS technologies to map an area of interest—an abandoned parking lot with a large density of artificial containers—for first surveying the area with the provided technologies: 678 waypoints with GPS and 214 aerial images with the UAV.
From our study, we calculated three effectiveness metrics—timeliness, sensitivity, and specificity—for the two investigated methods—the UAV approach and the GPS approach—to identify potential mosquito breeding grounds from artificial containers of relatively smaller sizes (e.g., cups, bottles) that have been seldom explored in prior research literature. Using the participant’s collected and processed data, we contrasted both approaches by analyzing the data from the participants’ visual identification insights on a confusion matrix. From the data analysis, we observed from the three metrics that the GPS method performed better than the UAV method for our target task of identifying relatively smaller artificial containers. That is, we rejected the null-hypothesis () from a two-tailed, paired t-test that the two approaches were statistically significant. These insights demonstrate that further research is still needed to enhance the viability of newer UAV methods of this more challenging type of breeding ground type.
Author Contributions
Conceptualization, methodology, software, validation, formal analysis, investigation, data curation, writing—original draft preparation, J.S.; writing—review and editing, P.T.; visualization, J.S. and P.T.; supervision, T.H., D.G., and J.H.; resources, project administration, funding acquisition, T.H. and D.G. All authors have read and agreed to the published version of the manuscript.
Funding
The open access publishing fees for this article have been covered by the Texas A&M University Open Access to Knowledge Fund (OAKFund), supported by the University Libraries. This work is supported by NSF SBE: 1560106 REU Site: Cyber-Health GIS—Multidisciplinary Research Experiences in Spatial Dynamics of Health Project.
Conflicts of Interest
The authors declare no conflict of interest.
References
- Yee, D.A.; Allgood, D.; Kneitel, J.M.; Kuehn, K.A. Constitutive differences between natural and artificial container mosquito habitats: Vector communities, resources, microorganisms, and habitat parameters. J. Med. Entomol. 2012, 49, 482–491. [Google Scholar] [CrossRef] [PubMed]
- Dhang, C.; Hanlim, L.; Stella-Wong, S.; Lau, K.; Azirun, M. Container survey of mosquito breeding sites in a university campus in Kuala Lumpur, Malaysia. Dengue Bull. 2009, 33, 187–193. [Google Scholar]
- Centers for Disease Control and Prevention. Chikungunya Virus. 2016. Available online: http://www.cdc.gov/chikungunya/ (accessed on 10 July 2020).
- Centers for Disease Control and Prevention. Dengue. 2016. Available online: http://www.cdc.gov/dengue/ (accessed on 10 July 2020).
- Centers for Disease Control and Prevention. Zika Virus. 2016. Available online: http://www.cdc.gov/zika/vector/range.html (accessed on 10 July 2020).
- Fornace, K.; Drakeley, C.; William, T.; Espino, F.; Cox, J. Mapping Infectious Disease Landscapes: Unmanned Aerial Vehicles and Epidemiology. Trends Parasitol. 2014, 30, 514–519. [Google Scholar] [CrossRef] [PubMed]
- Aragão, F.; Zola, F.; Marinho, L.; de Genaro Chiroli, D.; Junior, A.; Colmenero, J. Choice of unmanned aerial vehicles for identification of mosquito breeding sites. Geospat. Health 2020, 15. [Google Scholar] [CrossRef] [PubMed]
- Suduwella, C.; Amarasinghe, A.; Niroshan, L.; Elvitigala, C.; De Zoysa, K.; Keppetiyagama, C. Identifying mosquito breeding sites via drone images. In Proceedings of the 3rd Workshop on Micro Aerial Vehicle Networks, Systems, and Applications, Niagara Falls, NY, USA, 23 June 2017; pp. 27–30. [Google Scholar]
- Dias, T.; Alves, V.; Alves, H.; Pinheiro, L.; Pontes, R.; Araujo, G.; Lima, A.; Prego, T. Autonomous Detection of Mosquito-Breeding Habitats Using an Unmanned Aerial Vehicle. In Proceedings of the 2018 Latin American Robotic Symposium, 2018 Brazilian Symposium on Robotics (SBR) and 2018 Workshop on Robotics in Education (WRE), Joao Pessoa, Brazil, 6–10 November 2018; IEEE: Washington, DC, USA, 2018; pp. 351–356. [Google Scholar]
- Matese, A.; Toscano, P.; Di Gennaro, S.; Genesio, L.; Vaccari, F.; Primicerio, J.; Belli, C.; Zaldei, A.; Bianconi, R.; Gioli, B. Intercomparison of UAV, Aircraft and Satellite Remote Sensing Platforms for Precision Viticulture. Remote Sens. 2015, 7, 2971–2990. [Google Scholar] [CrossRef]
- Kar, R.; Haldar, R. Applying Chatbots to the Internet of Things: Opportunities and Architectural Elements. Int. J. Adv. Comput. Sci. Appl. 2016, 7, 147–154. [Google Scholar] [CrossRef]
- Persson, C.G. Terrestrial Methods in Surveying, Mapping, and Establishment of Geographic Data Bases; Technical Report Working Paper no. S-801; National Land Survey: Gävle, Sweden, 1995. [Google Scholar]
- Tiberius, C. Handheld GPS receiver accuracy. In GPS World; North Coast Media: Cleveland, OH, USA, 2003; Volume 14, pp. 46–51. [Google Scholar]
- Kauth, H.R.; Lonsinger, R.C.; Kauth, A.J.; Gregory, A.J. Low-cost DIY GPS trackers improve upland game bird monitoring. Wildl. Biol. 2020, 2, 1–7. [Google Scholar] [CrossRef]
- Papoutsidakis, M.; Kalovrektis, K.; Drosos, C.; Stamoulis, G. Intelligent design and algorithms to control a stereoscopic camera on a robotic workspace. Int. J. Comput. Appl. 2017, 167, 32–35. [Google Scholar] [CrossRef]
- Martínez-del Pozo, J.; Cerrillo-Cuenca, E.; Salas-Tovar, E. Low Altitude Aerial Photography Applications for Digital Surface Models Creation in Archaeology. Trans. GIS 2013, 17, 227–246. [Google Scholar] [CrossRef]
- Gilbertson, D.D.; Kent, M.; Pyatt, F.B. Mapping and Aerial Photography. In Practical Ecology for Geography and Biology; Chapter Aerial Photography and Satellite Imagery; Springer: New York, NY, USA, 1985; pp. 176–193. [Google Scholar]
- Husson, E.; Hagner, O.; Ecke, F. Unmanned aircraft systems help to map aquatic vegetation. Appl. Veg. Sci. 2014, 17, 567–577. [Google Scholar] [CrossRef]
- Barry, P.; Coakley, R. Accuracy of UAV photogrammetry compared with network RTK GPS. Int. Arch. Photogramm. Remote Sens. 2013, XL-1/W2, 27–31. [Google Scholar] [CrossRef]
- Lozano-Fuentes, S.; Ghosh, S.; Bieman, J.M.; Sadhu, D.; Eisen, L.; Hernandez-Garcia, E.; Garcia-Rejon, J.; Wedyan, F.; Tep-Chel, D. Using Cell Phones for Mosquito Vector Surveillance and Control. In Proceedings of the 24th International Conference on Software Engineering and Knowledge Engineering, Redwood City, CA, USA, 1–3 July 2012; pp. 763–767. [Google Scholar]
- Haas-Stapleton, E.; Barretto, M.; Castillo, E.; Clausnitzer, R.; Ferdan, R. Assessing Mosquito Breeding Sites and Abundance Using An Unmanned Aircraft. J. Am. Mosq. Control Assoc. 2019, 35, 228–232. [Google Scholar] [CrossRef] [PubMed]
- Case, E.H. MosquitoNet: Investigating the Use of Unmanned Aerial Vehicles and Neural Networks in Integrated Mosquito Management. Master’s Thesis, Cornell University, Ithaca, NY, USA, 2017. [Google Scholar]
Publisher’s Note: MDPI stays neutral with regard to jurisdictional claims in published maps and institutional affiliations. |
© 2020 by the authors. Licensee MDPI, Basel, Switzerland. This article is an open access article distributed under the terms and conditions of the Creative Commons Attribution (CC BY) license (http://creativecommons.org/licenses/by/4.0/).