1. Introduction
Plant phenotyping is a key technology for the plant breeders to produce crops with desirable traits such as higher yield, disease resistance, and drought tolerance [
1]. Among other measurements, plant phenotyping typically assesses quantitatively the crop phenotypes such as leaf area, leaf angle, and stem diameter [
2]. The stem diameter of a plant is a good indicator of plant’s health and biomass accumulation. A plant with a thicker stem is usually considered as healthier with higher yield potential than other plants at the same growth stage [
3]. The manual measurement of stem diameter is laborious, time consuming, and error prone [
4]. Robotic phenotyping will help plant geneticists to investigate the interaction between genotype and environment more readily in order to improve crop yields and resilience to environmental stresses [
1]. Literature reports many image-based stationary phenotyping systems to mitigate the issues with manual measurements.
Vázquez-Arellano et al. [
5] developed a method to estimate the position and height of the maize stem from 3D reconstruction of the plant using the point cloud data from a time-of-flight (TOF) camera. The experimental results showed that their method could determine the position and height of the stem with an average mean error of 24 and 30 mm. Chaivivatrakul et al. [
6] developed an automated plant phenotyping system that could measure morphological traits of maize plants via 3D holographic reconstruction. A TOF camera and a rotating table were used to acquire point cloud image data. The proposed method showed promising results to measure plant phenotypic data such as the stalk widths (major and minor axes), and height. Jin et al. [
7] proposed a median normalized-vector growth (MNVG) algorithm that could segment leaf and stem, and also extract phenotypic traits such as leaf area, stem diameter, and plant height using terrestrial Light Detection and Ranging (LIDAR) data. The algorithm was tested for maize plants with different height and leaf numbers at three growth stages. The experimental results showed that MNVG method had high accuracy for phenotypic traits extraction at individual plant level (R
2 could be up to 0.96), followed by leaf and stem levels. Das Choudhury et al. [
8] developed an algorithm to automatically compute the angle of maize stem. They postulated that this trait may be an indicator for plant’s susceptibility to lodging. A graph theory-based approach was applied to recognize leaf-tips and leaf-junctions from visible light images. A regression line curve was fitted through the leaf junctions to form the stem axis, and the angle between the stem axis and the vertical axis was determined as stem angle. The method achieved an accuracy of 84% in a mixed dataset of panicoid grasses. These reports mostly used the image processing techniques to achieve the expected task. However, for many complex phenotyping tasks, conventional image processing pipelines have experienced limited flexibility and unsatisfactory performance; and many believe that machine learning techniques are expected to take a prominent role in the future of image-based phenotyping [
9] in stationary or vehicle-based systems.
Various vehicle-based systems were used or proposed for field-based high-throughput plant phenotyping [
10]. Lottes et al. [
11] developed a system consisting of a 4-channel camera (RGB+ NIR (near-infra-red)) attached to a mobile robot to detect sugar beet plants from weeds. Vidoni et al. [
12] introduced a semi-autonomous mobile robot equipped with LIDAR to measure the shape and volume of orchards and vineyards canopy. A ground-based phenotyping system was presented to acquire information of peanut canopy architecture (height, width, and shape), and density [
13]. Two RGB cameras, a thermal camera, and a laser scanner were attached to a ground-based, remotely controlled cart. The result showed that the system was able to collect the data with faster speed and higher resolution compared to manual collection. Andrade-Sanchez et al. [
10] developed a high-throughput phenotyping platform to measure the dynamic traits of cotton in the field. Several different sensors were used to measure the canopy height, reflectance, and temperature simultaneously on four adjacent rows. The results indicated that the plant traits could be measured by the system rapidly and accurately. Xu et al. [
14] designed an autonomous ground robot for high-throughput phenotyping in cotton field. Color images were captured from the cotton plants using RGB cameras. The color images were used to construct 3D plant point cloud, and also to detect and count opened cotton bolls. The experimental results confirmed that the robot could collect the phenotypic information autonomously. Young et al. [
15] introduced a high-throughput phenotyping robot to collect plant phenotypic data of energy sorghum in the field. A stereo camera and a depth sensor were mounted on a mobile robot to measure the plant height and stem width. The robot could accurately measure the architectural traits of individual plant. Bao et al. [
16] demonstrated a system to characterize several architectural traits of maize plants at multiple growth stags in the field. A mobile robot was equipped with TOF cameras to acquire side-view 3D point cloud data of crop rows. An algorithm was developed to extract plant height, leaf angle, plant orientation, and stem diameter for each plant. The plant phenotypes were estimated with satisfactory accuracies except for the stem diameter due to the insufficient resolution of the TOF cameras. A mobile robot equipped with RGB camera and LIDAR was deployed to sorghum field to estimate the stem width [
17]. The results showed that it was predicted with high accuracy.
As the field of robotics is expanding into broader applications, the demand for using robotic manipulators to accomplish unstructured tasks is increasing [
18]. Unstructured tasks refer to tasks that cannot be determined ahead of time (such as acquiring plant phenotypes). Lu et al. [
19] reported an automated robotic phenotyping platform for characterizing morphological traits of corn seedlings. A TOF camera was attached to the end-effector of a robotic manipulator. The camera was positioned in different views by the robotic arm in order to obtain 3D point cloud data of the plant. This robotic system could satisfactorily segment the stem and leaves of a plant, and measure the stem height and leaf length of corn seedlings. Mueller-Sim et al. [
1] developed a high-throughput ground-based agricultural robot that could navigate between sorghum rows in the field and collect plant phenotypic data autonomously. The robot used a mobile platform, a three degree of freedom (DOF) manipulator, a customized gripper consisting of a digital force gauge, and a needle to measure the stem strength, as well as other non-contact sensors such as a stereo camera to gather phenotypic data. The results of outdoor experiments demonstrated that the algorithm for stem detection worked well and all identified stems were grasped by the gripper successfully. Atefi et al. [
20] developed a plant phenotyping robotic system to realize automated measurement of leaf reflectance and leaf temperature of maize and sorghum plants in greenhouse. The robotic system consisted of a TOF camera, a four DOF robotic manipulator, an optical fiber cable (coupled to a portable spectrometer) and a thermistor for leaf spectral reflectance and leaf temperature measurements, and a custom-designed gripper to integrate the sensors to the end-effector of the robotic manipulator. Image processing techniques were used to segment plants from the background, detect the stem, separate the stem from the leaves, and determine an appropriate grasping point on leaves. The experimental results showed that the robotic system could satisfactorily measure leaf physiological and chemical traits directly and automatically.
Our previous work [
20] focused on the automated grasping leaves and measuring their properties. As a continuation, this work focuses on developing a robotic phenotyping system which has the capability to detect and physically grasp the stem of maize and sorghum. Literature lacks such an effort to grasp the stem of plants which can have significant applications in phenotyping. Such a system has the ability to deploy various sensors such as sap flow, which needs a direct contact with the stem for measurement. In this study, stem diameter measurement is used to demonstrate the effectiveness of the system in stem grasping. The objective of this study was to develop an automated plant phenotyping robotic system that could detect the stem using deep learning, grasp the stem, and automatically measure the stem diameter of maize and sorghum plants in greenhouse. The performance of the robotic system was evaluated by conducting a validation experiment in the greenhouse. The plant phenotyping robotic system that could automatically detect and grasp the stem, and measure the stem diameter in real-time employing both contact-based and image-based approaches has not been reported in literature.
2. Materials and Methods
2.1. Hardware of the Robotic System
Vision system: A TOF camera (Model: SR4500, Mesa Imaging Inc., Zürich, Switzerland) was used to take images of plants. The camera has a resolution of 176 × 144 pixels with 69° × 55° field of view. XYZ coordinates (three channels) of each pixel in the image relative to the center of the camera coordinate system are provided by the camera. A grayscale image can be created using each channel of the image.
Robotic manipulator: A four DOF robotic manipulator (Model: MICO2, KINOVA Inc., Boisbriand, QC, Canada) was used in the robotic system.
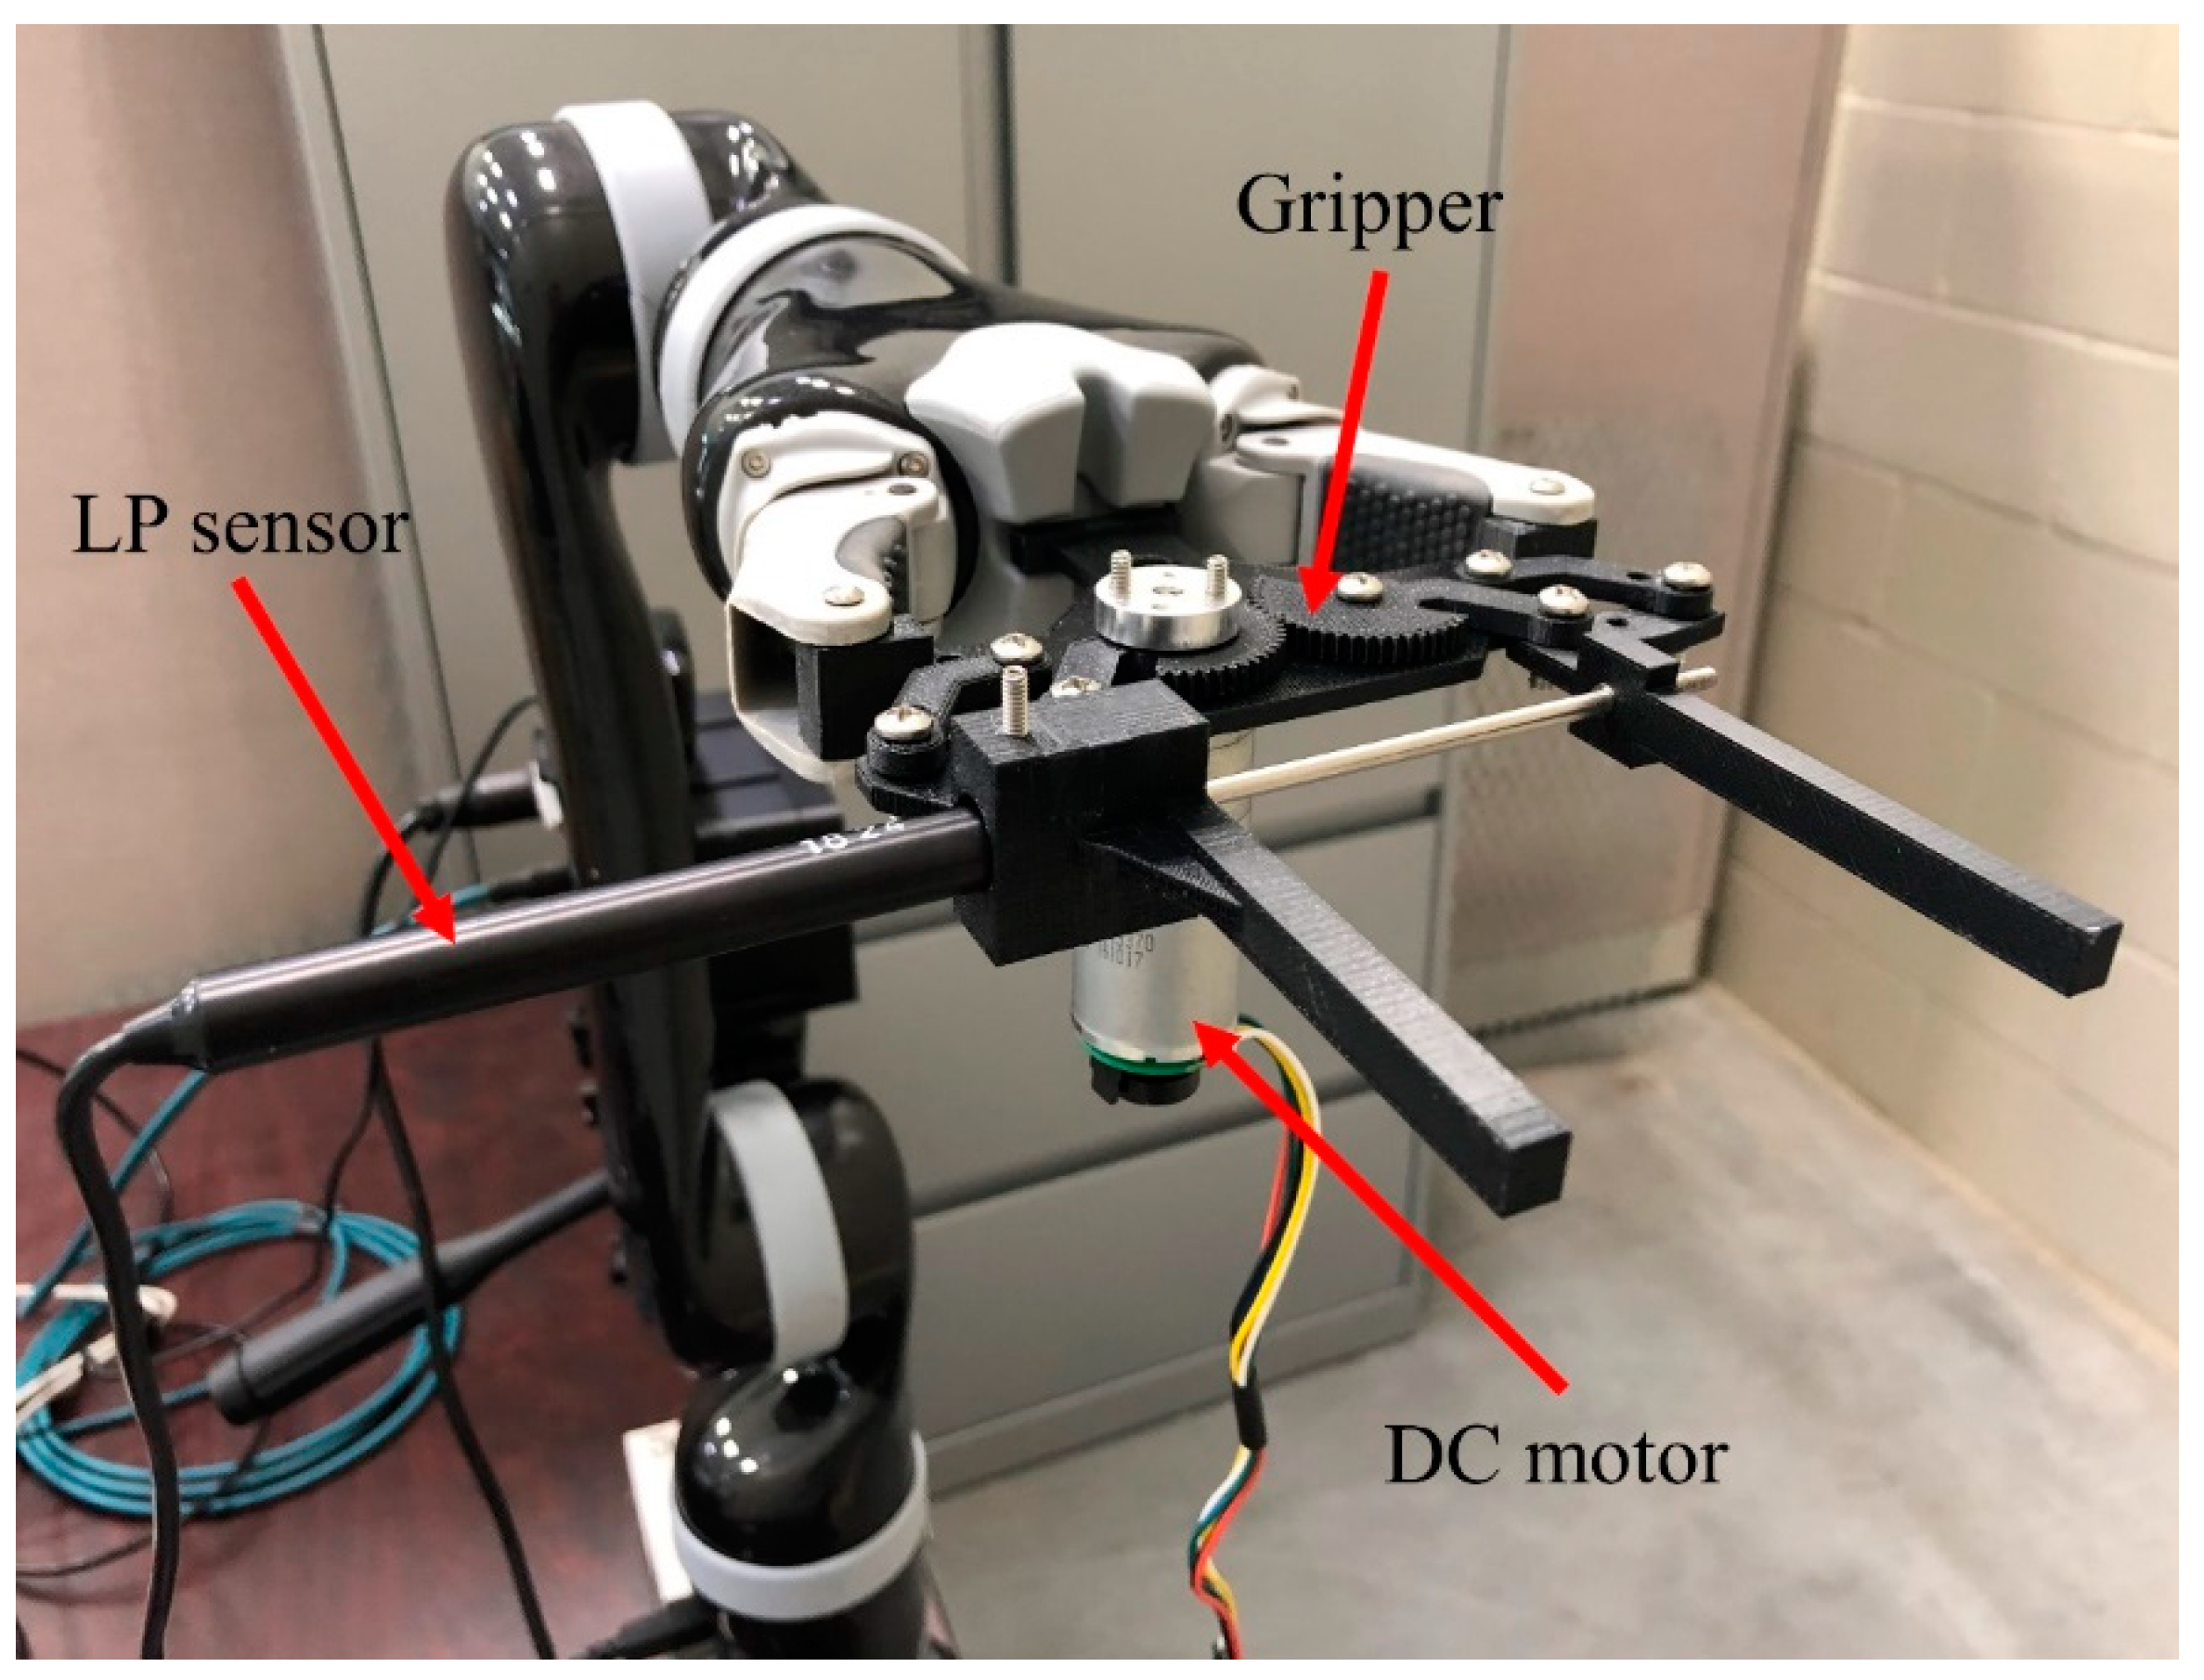
Sensing system: A linear potentiometer (LP) sensor (Model: LP804-03, OMEGA Engineering Inc., Norwalk, CT, USA) was used to measure the stem diameter (
Figure 1). The LP sensor has a weight of 28 g and it can measure linear displacement up to 76 mm with a resolution of 0.00127 mm. A gripper was designed to integrate the LP sensor to the end-effector of the robotic manipulator (
Figure 1). The design of the gripper allowed for linear movement for the fingers of the gripper, which enabled the LP sensor for linear displacement measurement. The gripper was made of plastic material to reduce its weight and was prototyped using a 3D-printer. A data acquisition system (Model: LabJack U6, LabJack Corporation, Lakewood, CO, USA) was used to interface the LP sensor with the robot’s task computer.
The LP sensor was calibrated using a digital caliper. The output voltage of the sensor was converted to linear displacement (stem diameter) using Equation (1) (calibration equation).
Where: is the linear displacement (stem diameter) in cm and is the output voltage of the LP sensor in Volts.
A microcontroller (Model: Arduino Uno ATmega328 board) combined with a dual H-bridge motor driver (Model: Qunqi L298N) was used to control a low-power DC motor (
Figure 1). The brushed gear DC motor (Model: 47:1 Metal Gearmotor, Pololu Corporation, Las Vegas, NV, USA) with a 47:1 gearbox and a 48 CPR (counts per revolution) quadrature encoder was used to open and close the gripper’s fingers for stem grasping (
Figure 1).
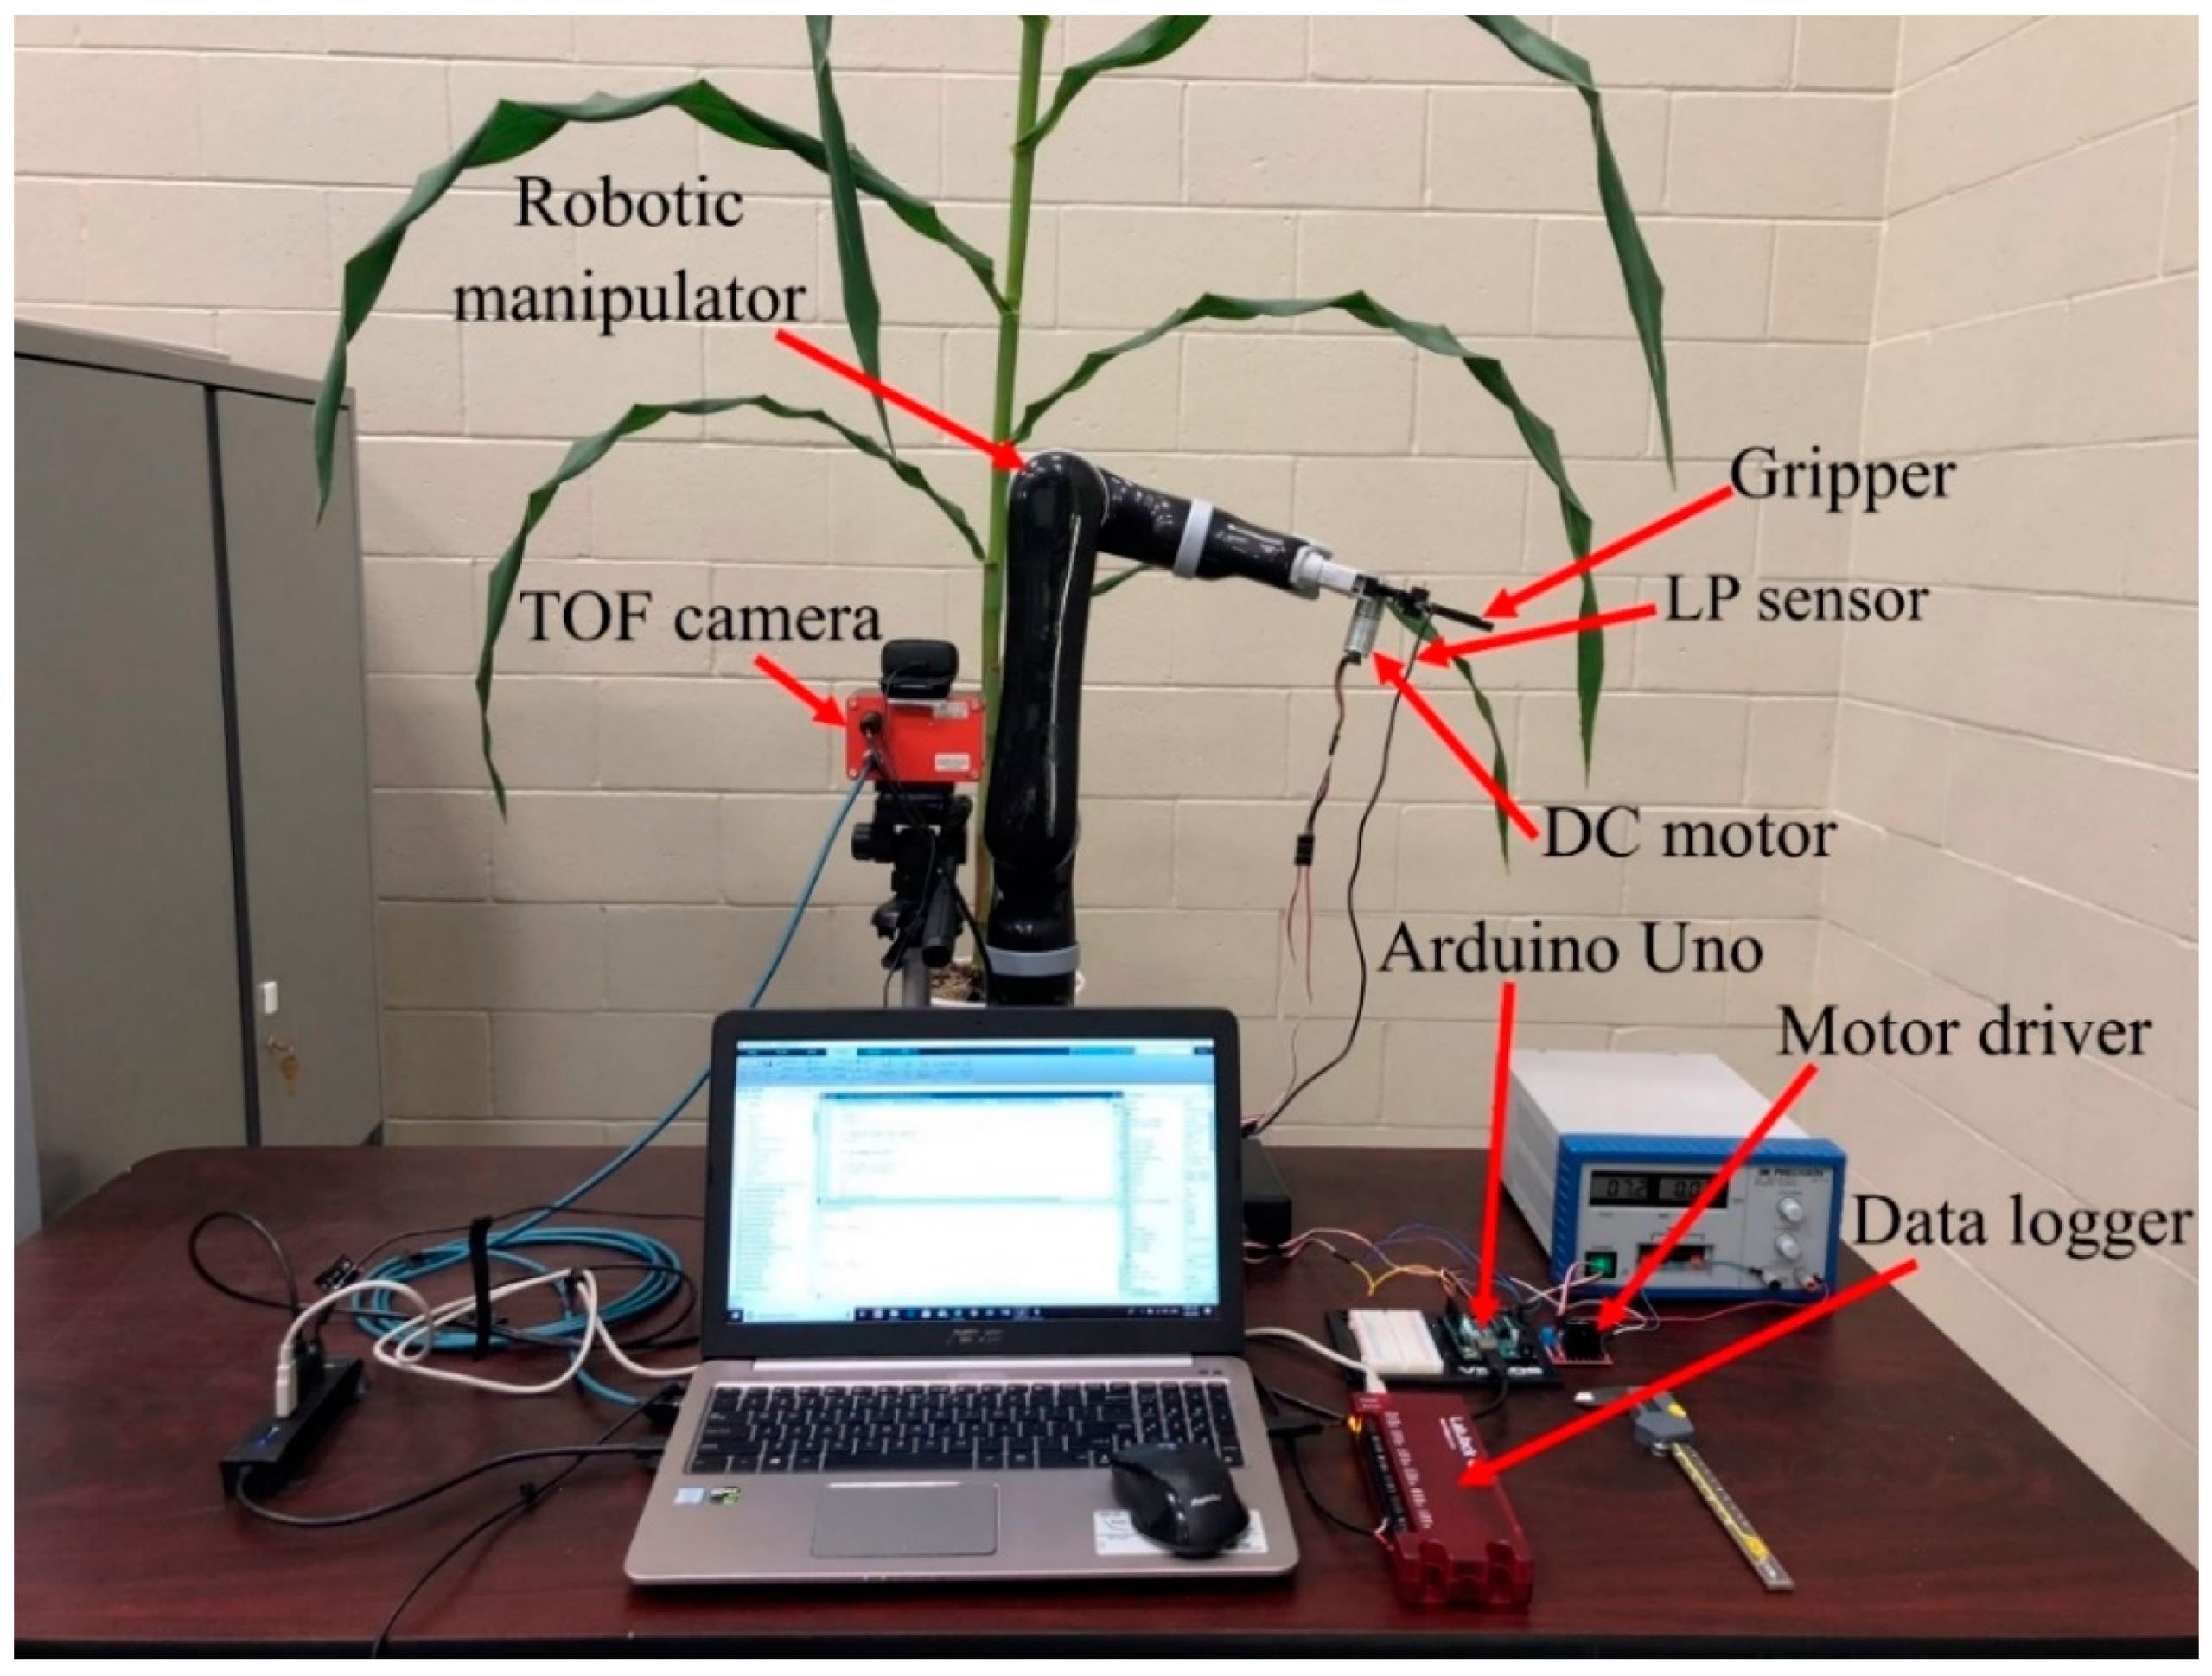
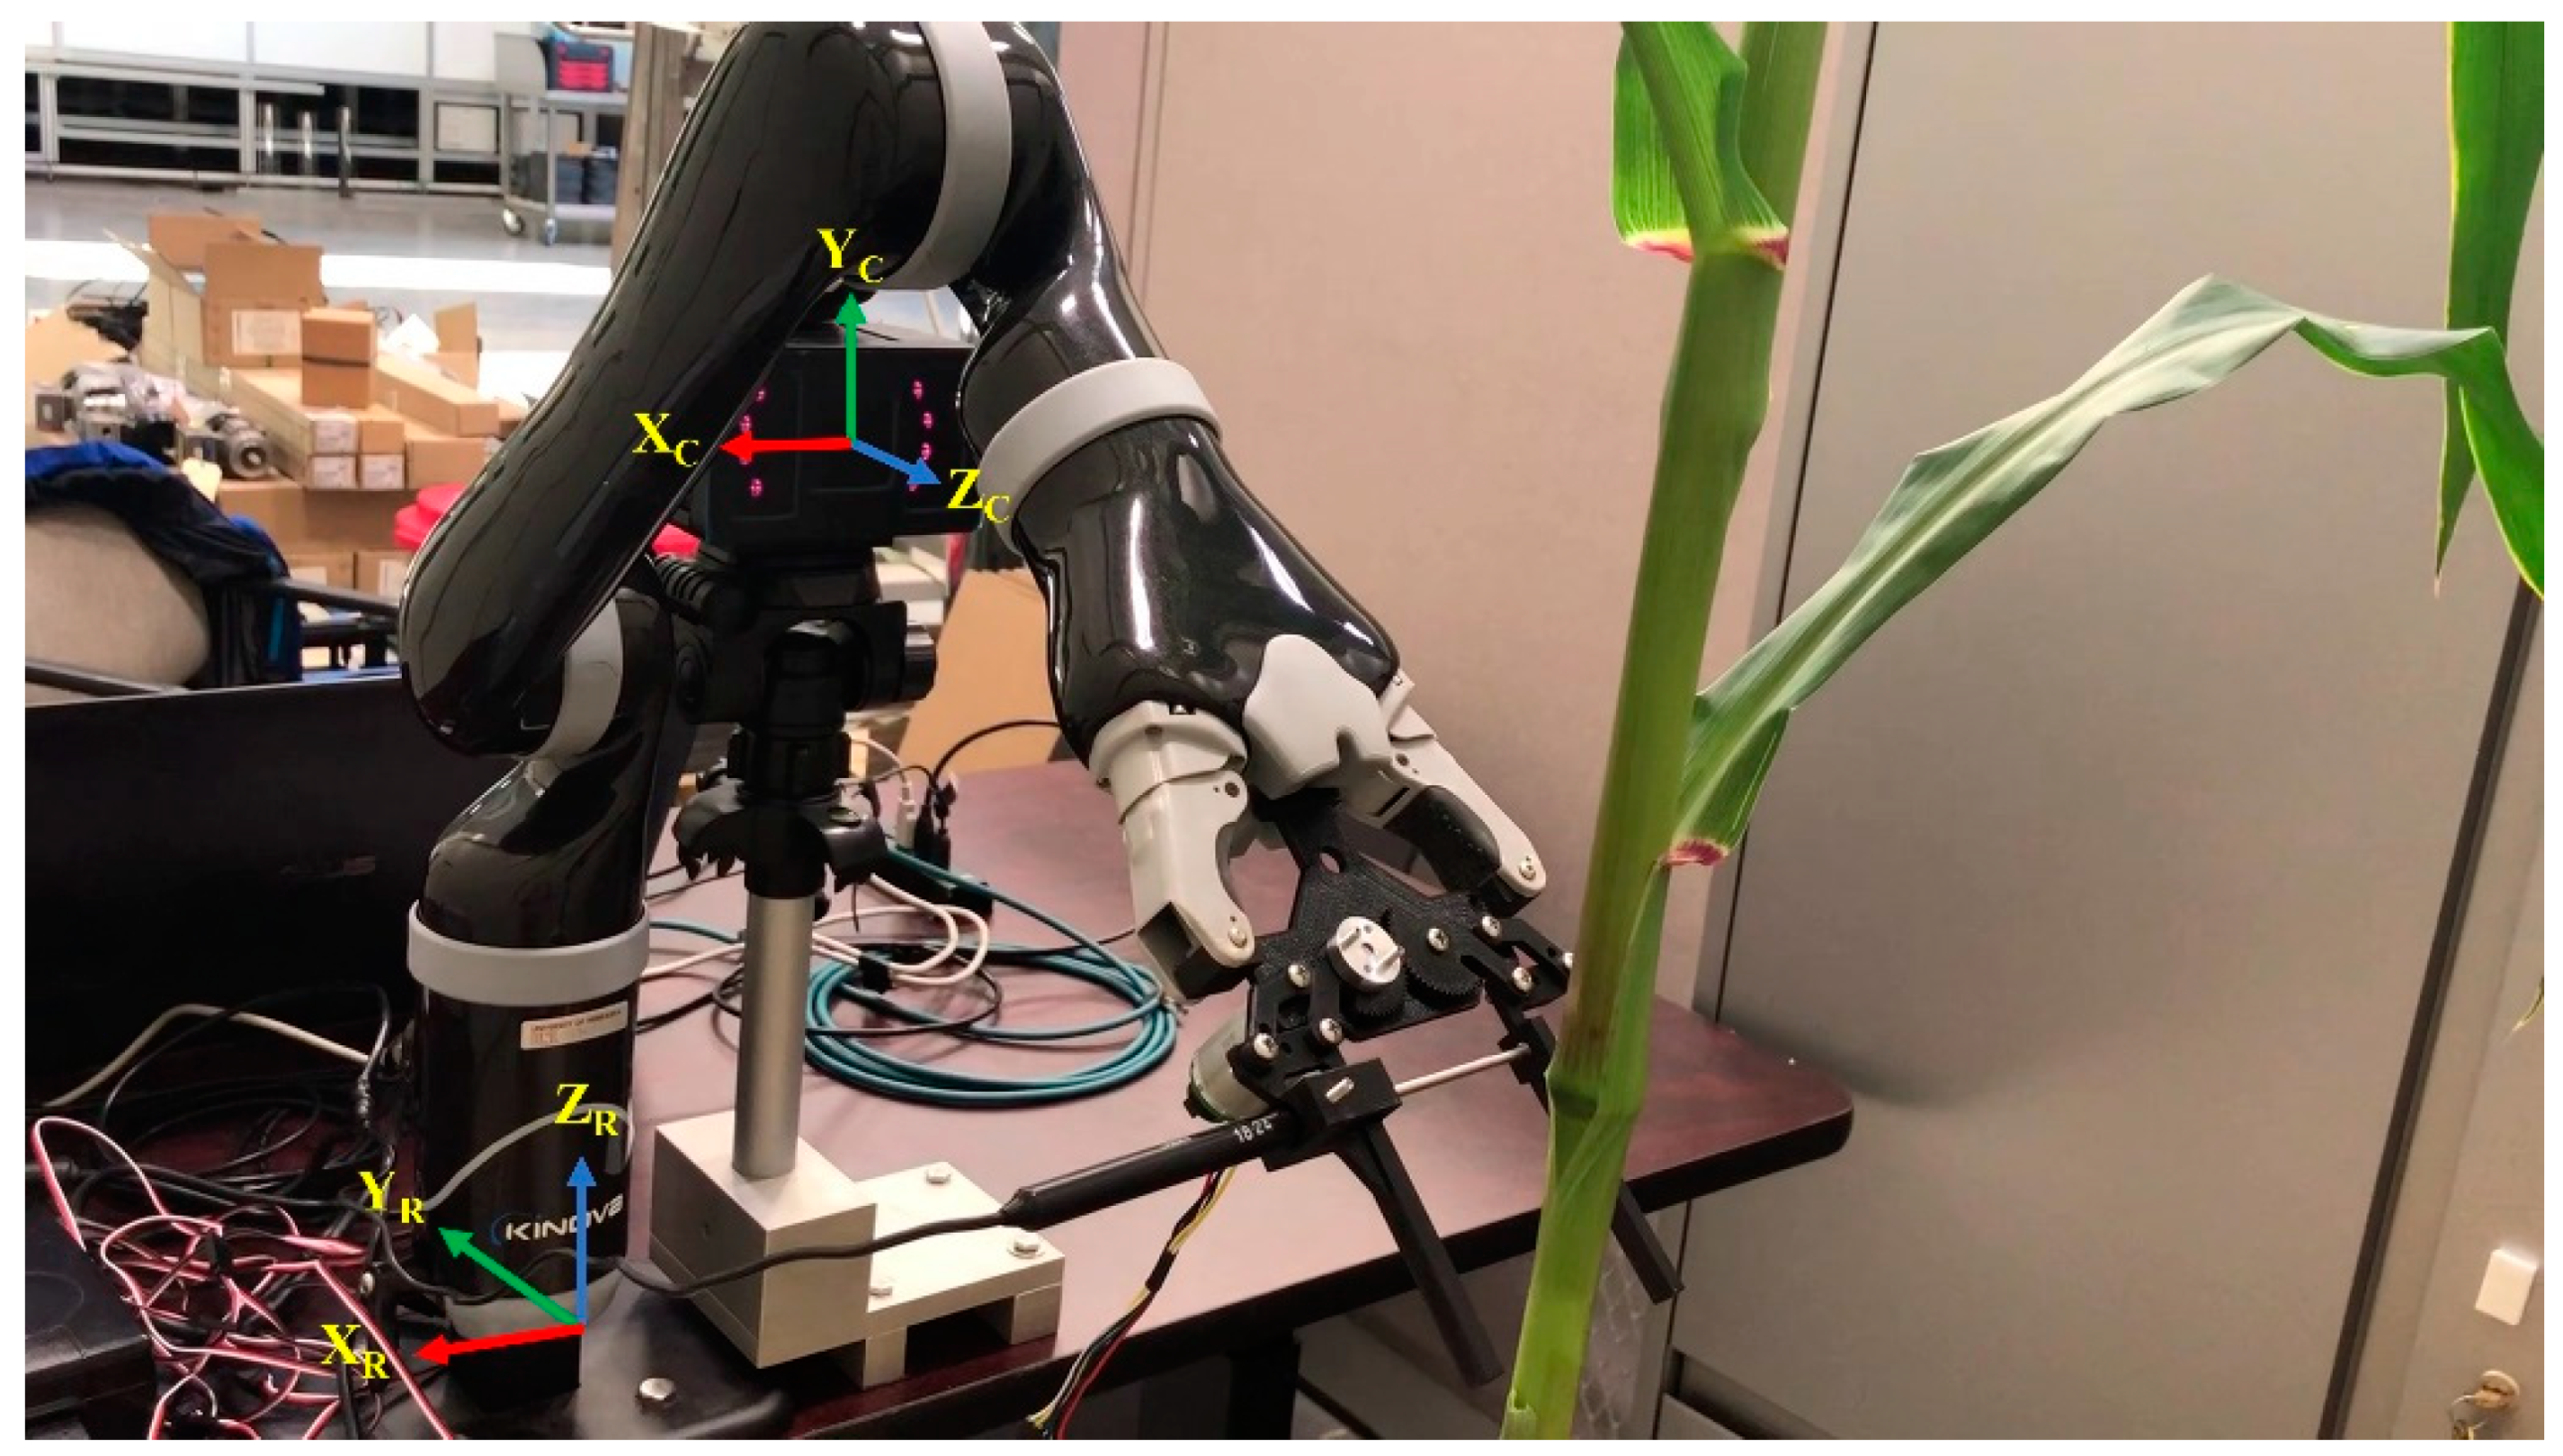
Integration of the robotic system: The TOF camera was installed near the robotic manipulator. The LP sensor and the DC motor were attached to the gripper. To adjust the robotic system with the height of the plants, all components were mounted on the top of a height adjustable desk (
Figure 2).
2.2. Software of the Robotic System
2.2.1. Stem Detection Using Deep Learning Technique (Faster R-CNN)
In our previous study [
20], an image processing-based algorithm was developed to detect the stem in the image. However, this method had limited success with tilted stems (see
Supplementary Figure S1). Therefore, deep learning technique was used to overcome this issue in this research. For this purpose, sixty grey-scale TOF images (Z direction/depth images) from the previous study [
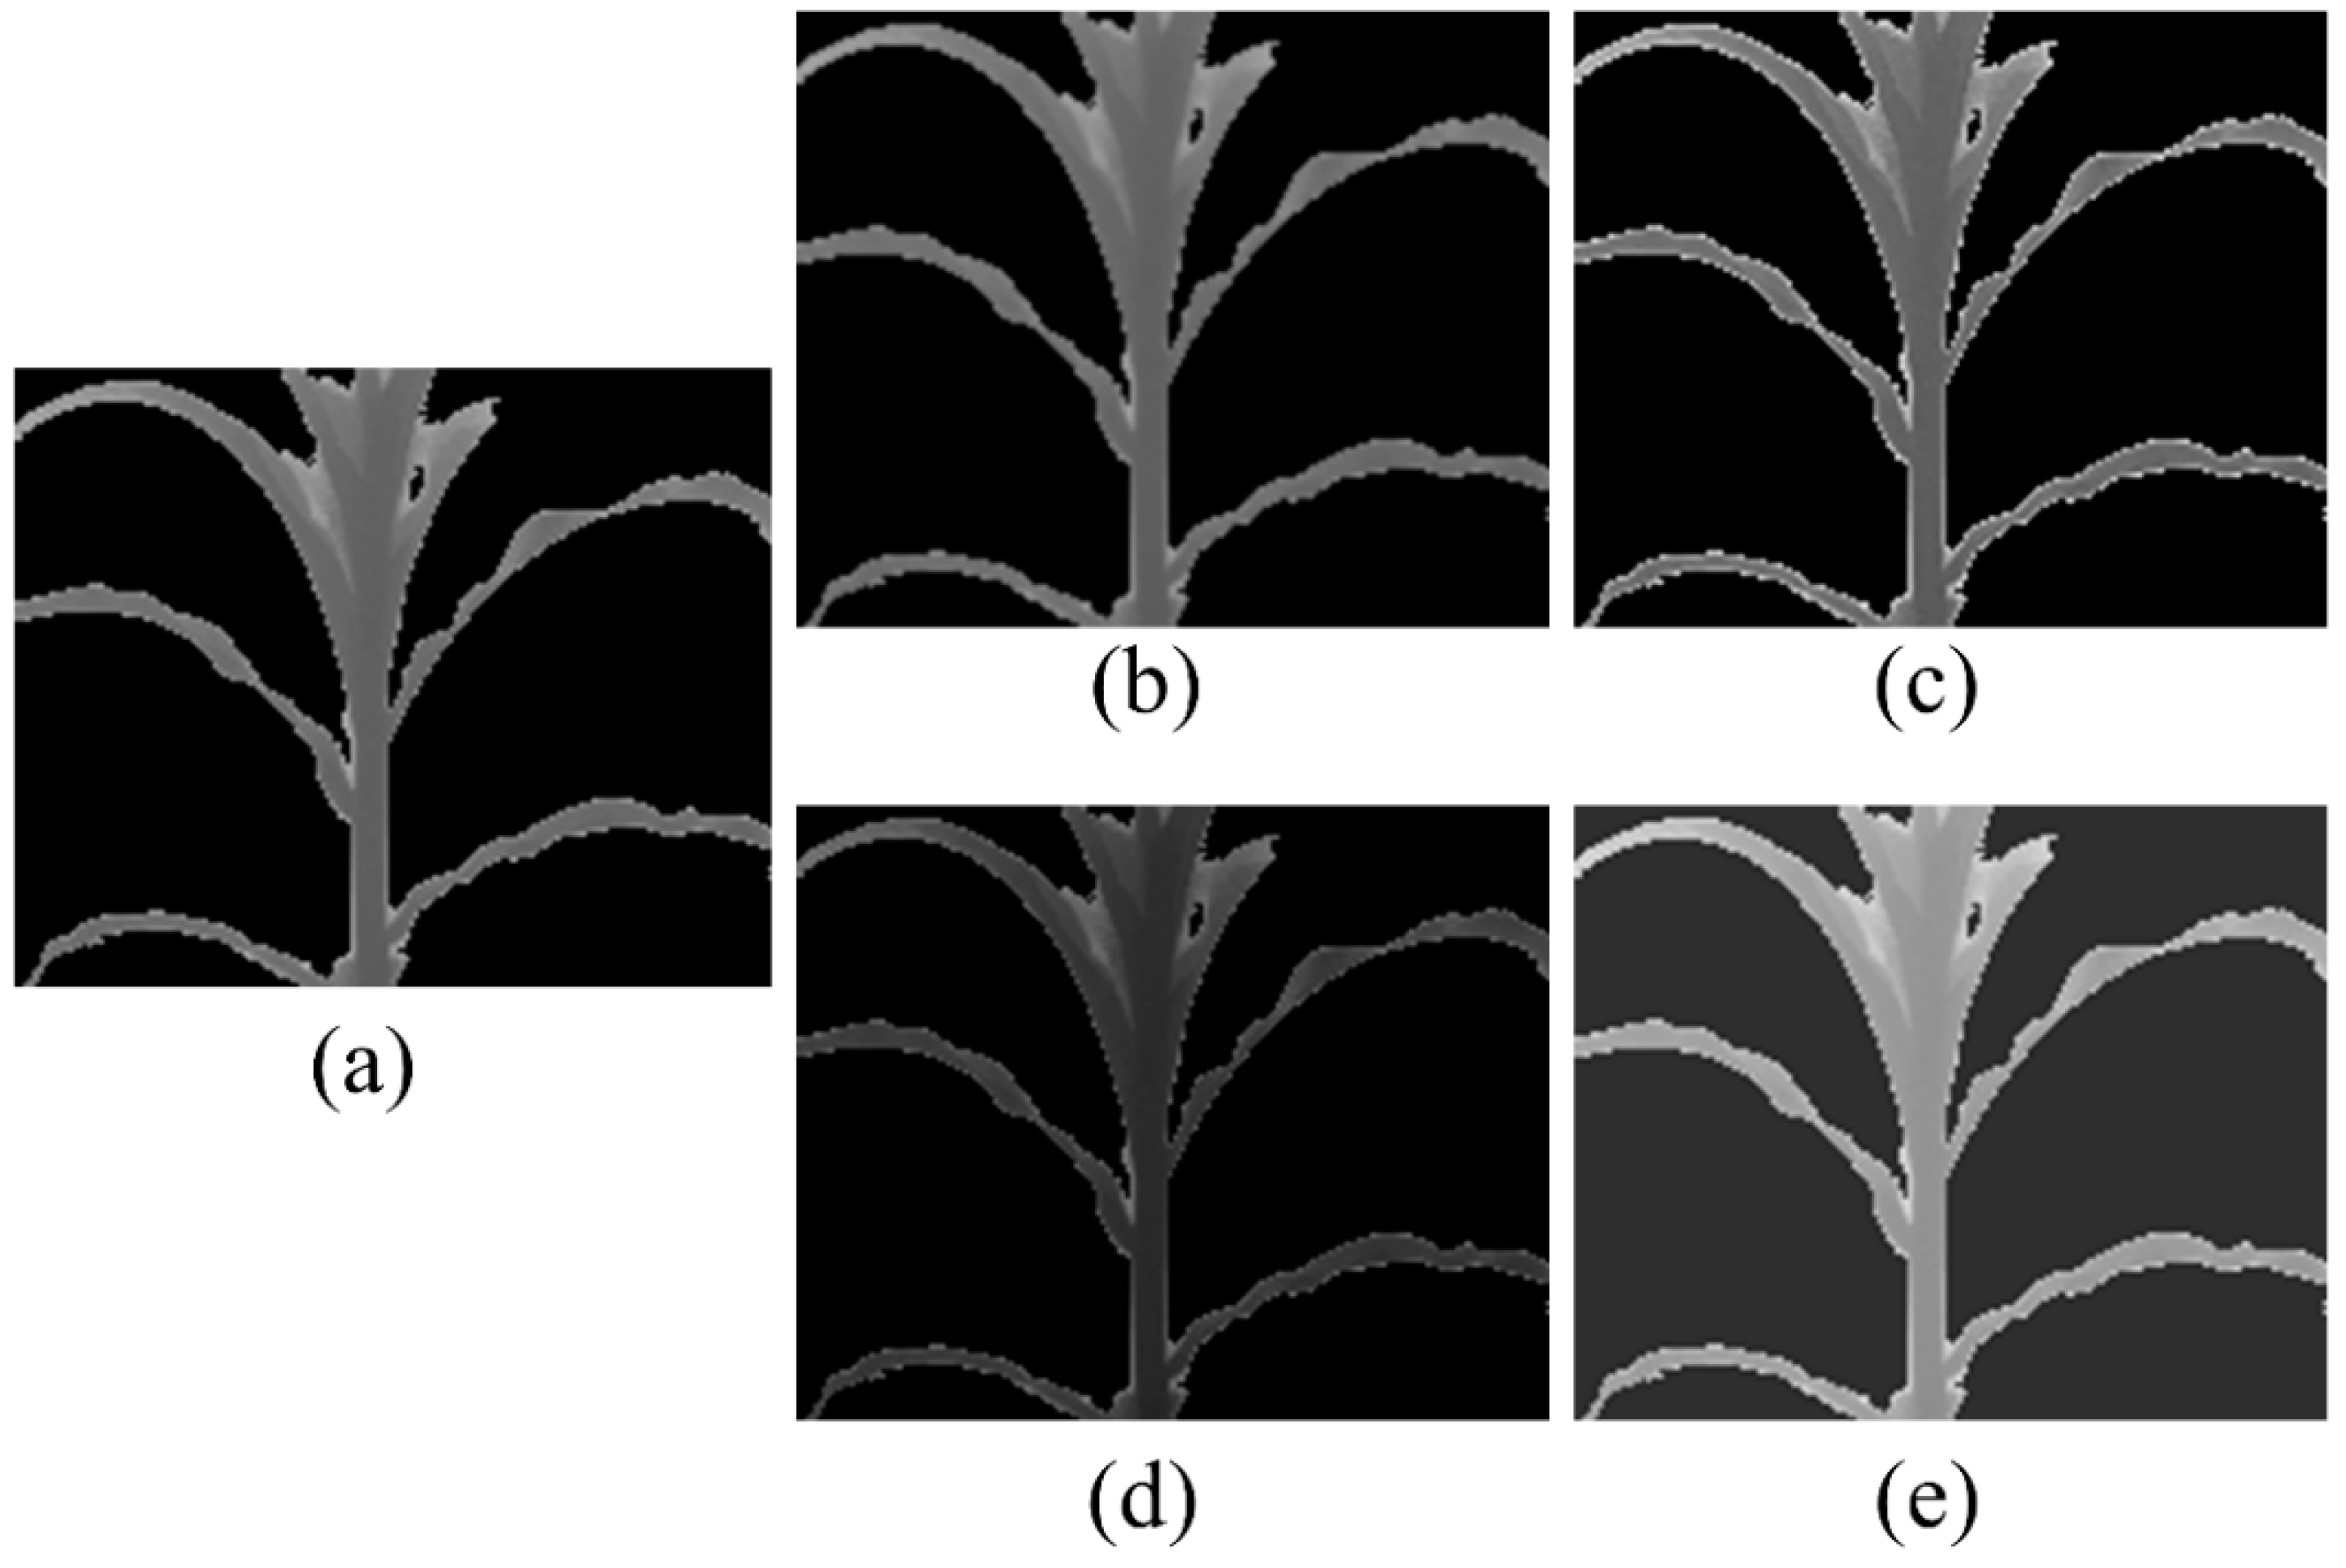
20] were used. It was speculated that they have more information (8-bit images) which can help in stem detection model calibrated by deep learning compared to binary images. Then, the gray-scale images were labelled by drawing a bounding box for stem as ground-truth using “ImageLabeler” toolbox in MATLAB (version 2018, MathWorks, Natick, MA, USA). Image augmentation techniques were used to produce more images for training the network. Specifically, the images were sharpened, blurred, darkened, and brightened (
Figure 3) to create 240 additional images resulting in a total of 300 labelled images. The dataset was split into two subsets: 80% (240 images) as the training set and 20% (60 images) as the testing set. The training set was used to train the Faster R-CNN model and find the weights and biases of the network, and the testing set was used to evaluate the performance of the network.
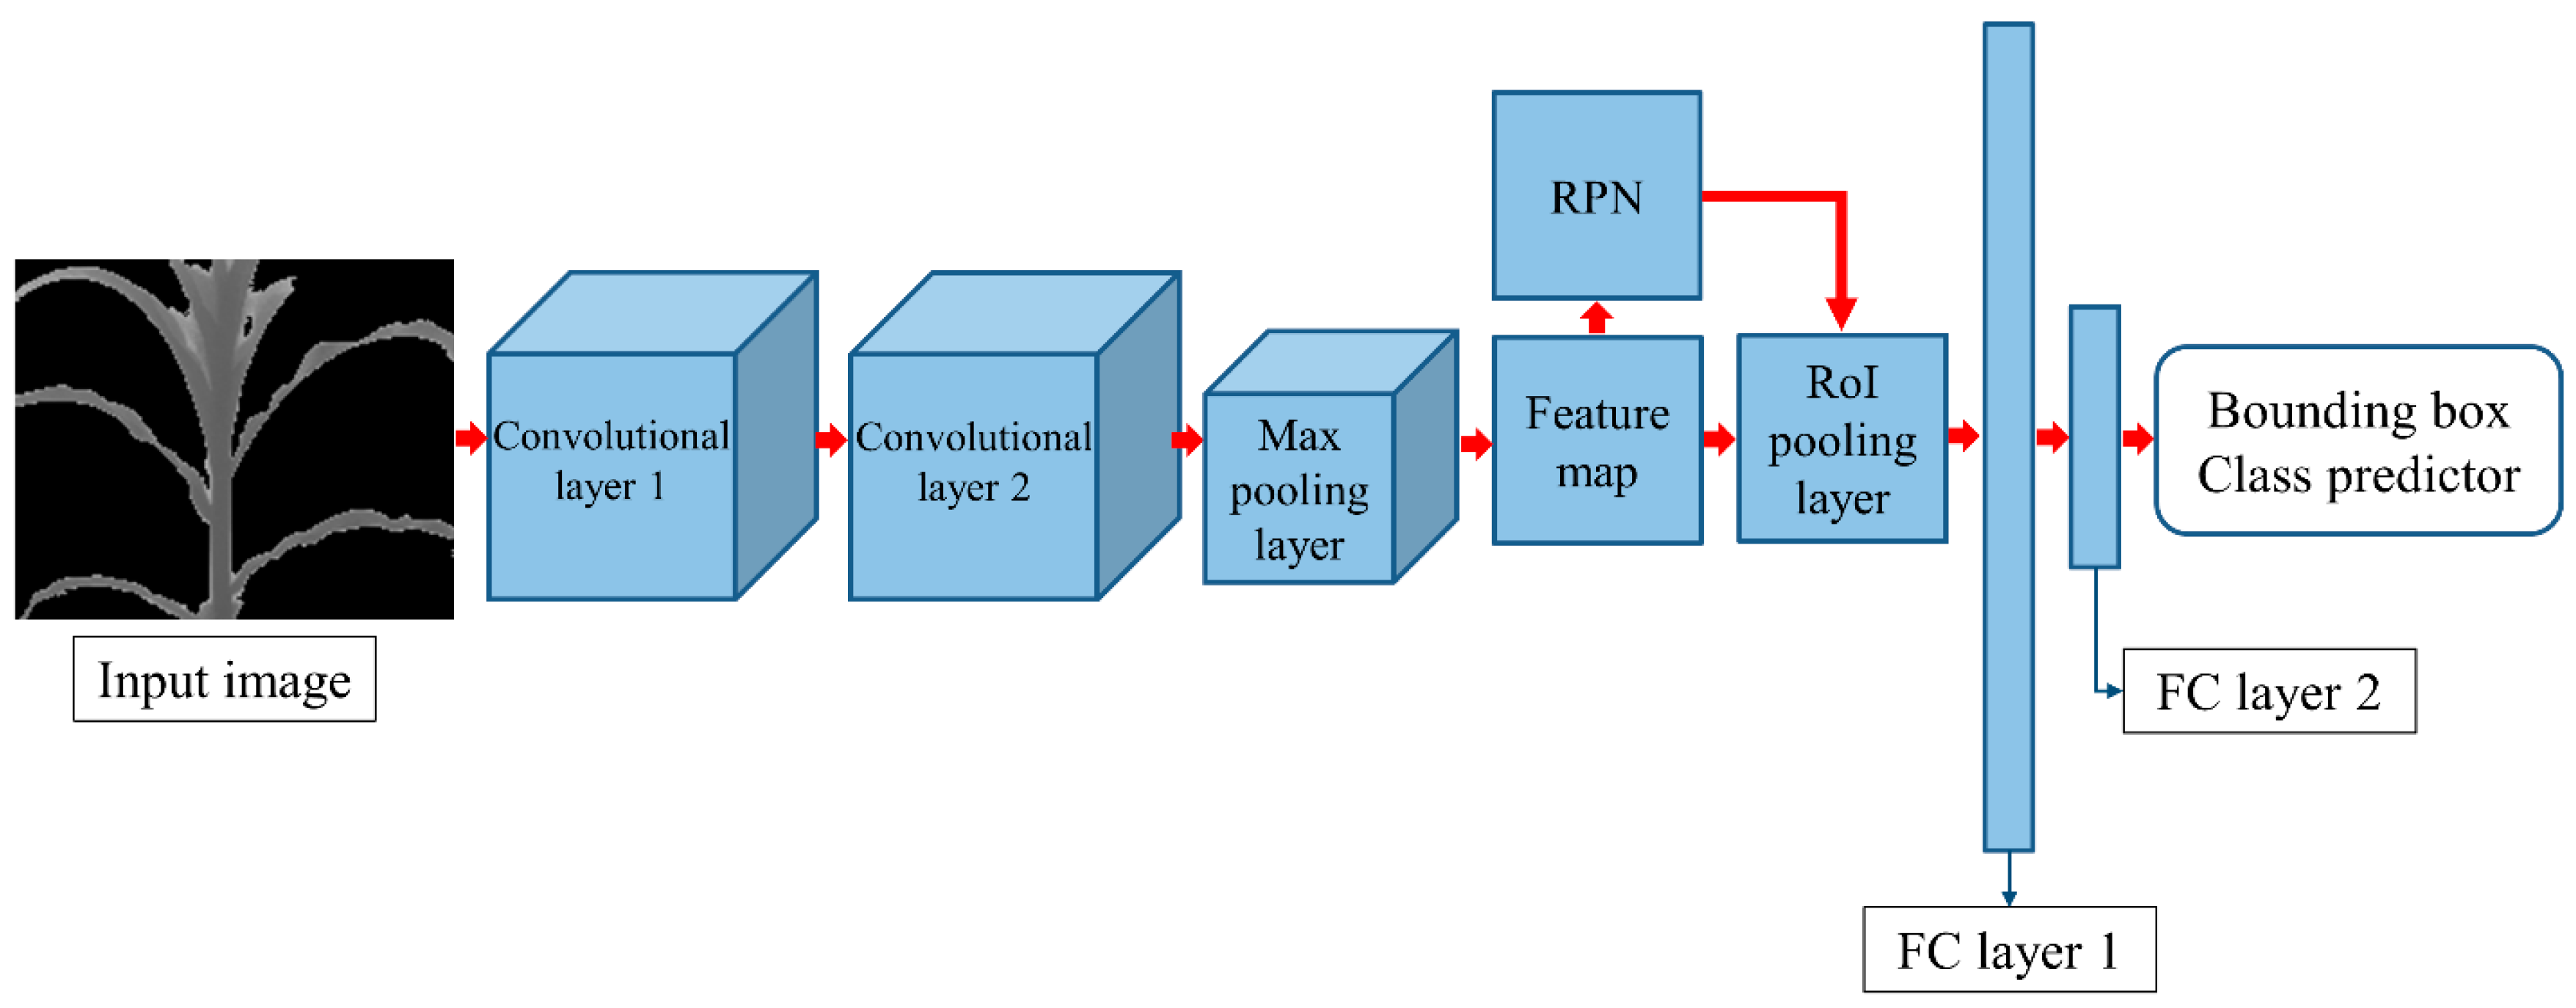
Faster R-CNN technique was used for stem detection in the images. In this method, the input image is passed through a convolutional network which returns a convolutional feature map for the image. A small neural network called region proposal network (RPN) is applied on the convolutional feature map to predict the presence of an object and its bounding box (predicted region proposals). Then, a region of interest (RoI) pooling layer is used to bring down all the predicted region proposals to the same size. Finally, the reshaped proposals are provided as inputs to fully connected (FC) layers to classify any predicted bounding boxes. Each bounding box has a confidence-score that shows the likelihood of box containing the object. The confidence-score is computed by “intersection over union” (IoU or overlap) between the predicted and ground-truth. The performance of the Faster R-CNN model for object detection on the testing set is measured by evaluation metrics such as precision, recall, and F1-score. Precision and recall are defined as the ratio of correctly positive predictions to the total positive predictions, and the ratio of correctly positive predictions to the total actual positives, respectively. F1-score measures the model’s accuracy which is calculated by precision and recall (Equation (2)).
In this study, the model consisted of two convolutional layers, a max pooling layer, a RPN, a RoI pooling layer, and two FC layers. The convolutional layers had 32 filters with size of 3 × 3, padding of 1, and rectifier linear unit (ReLu) activation function. The output of the convolutional layers was fed to the max pooling layer with the size of 3 and stride of 2, then to RPN, and RoI pooling layer. The first FC layer had 64 neurons with ReLu, and the second (last) layer had 2 classes (background and stem) with Softmax as loss layer (cross-entropy). Stochastic gradient descent with momentum (SGDM) of 0.9, 100 epochs, batch size of 32, and initial learning rate of 0.001 was used as the optimizer for the network. The model was trained using 240 training images and its output was a detector that could detect the stem in the image (bounding box) and also to predict the class object (background or stem).
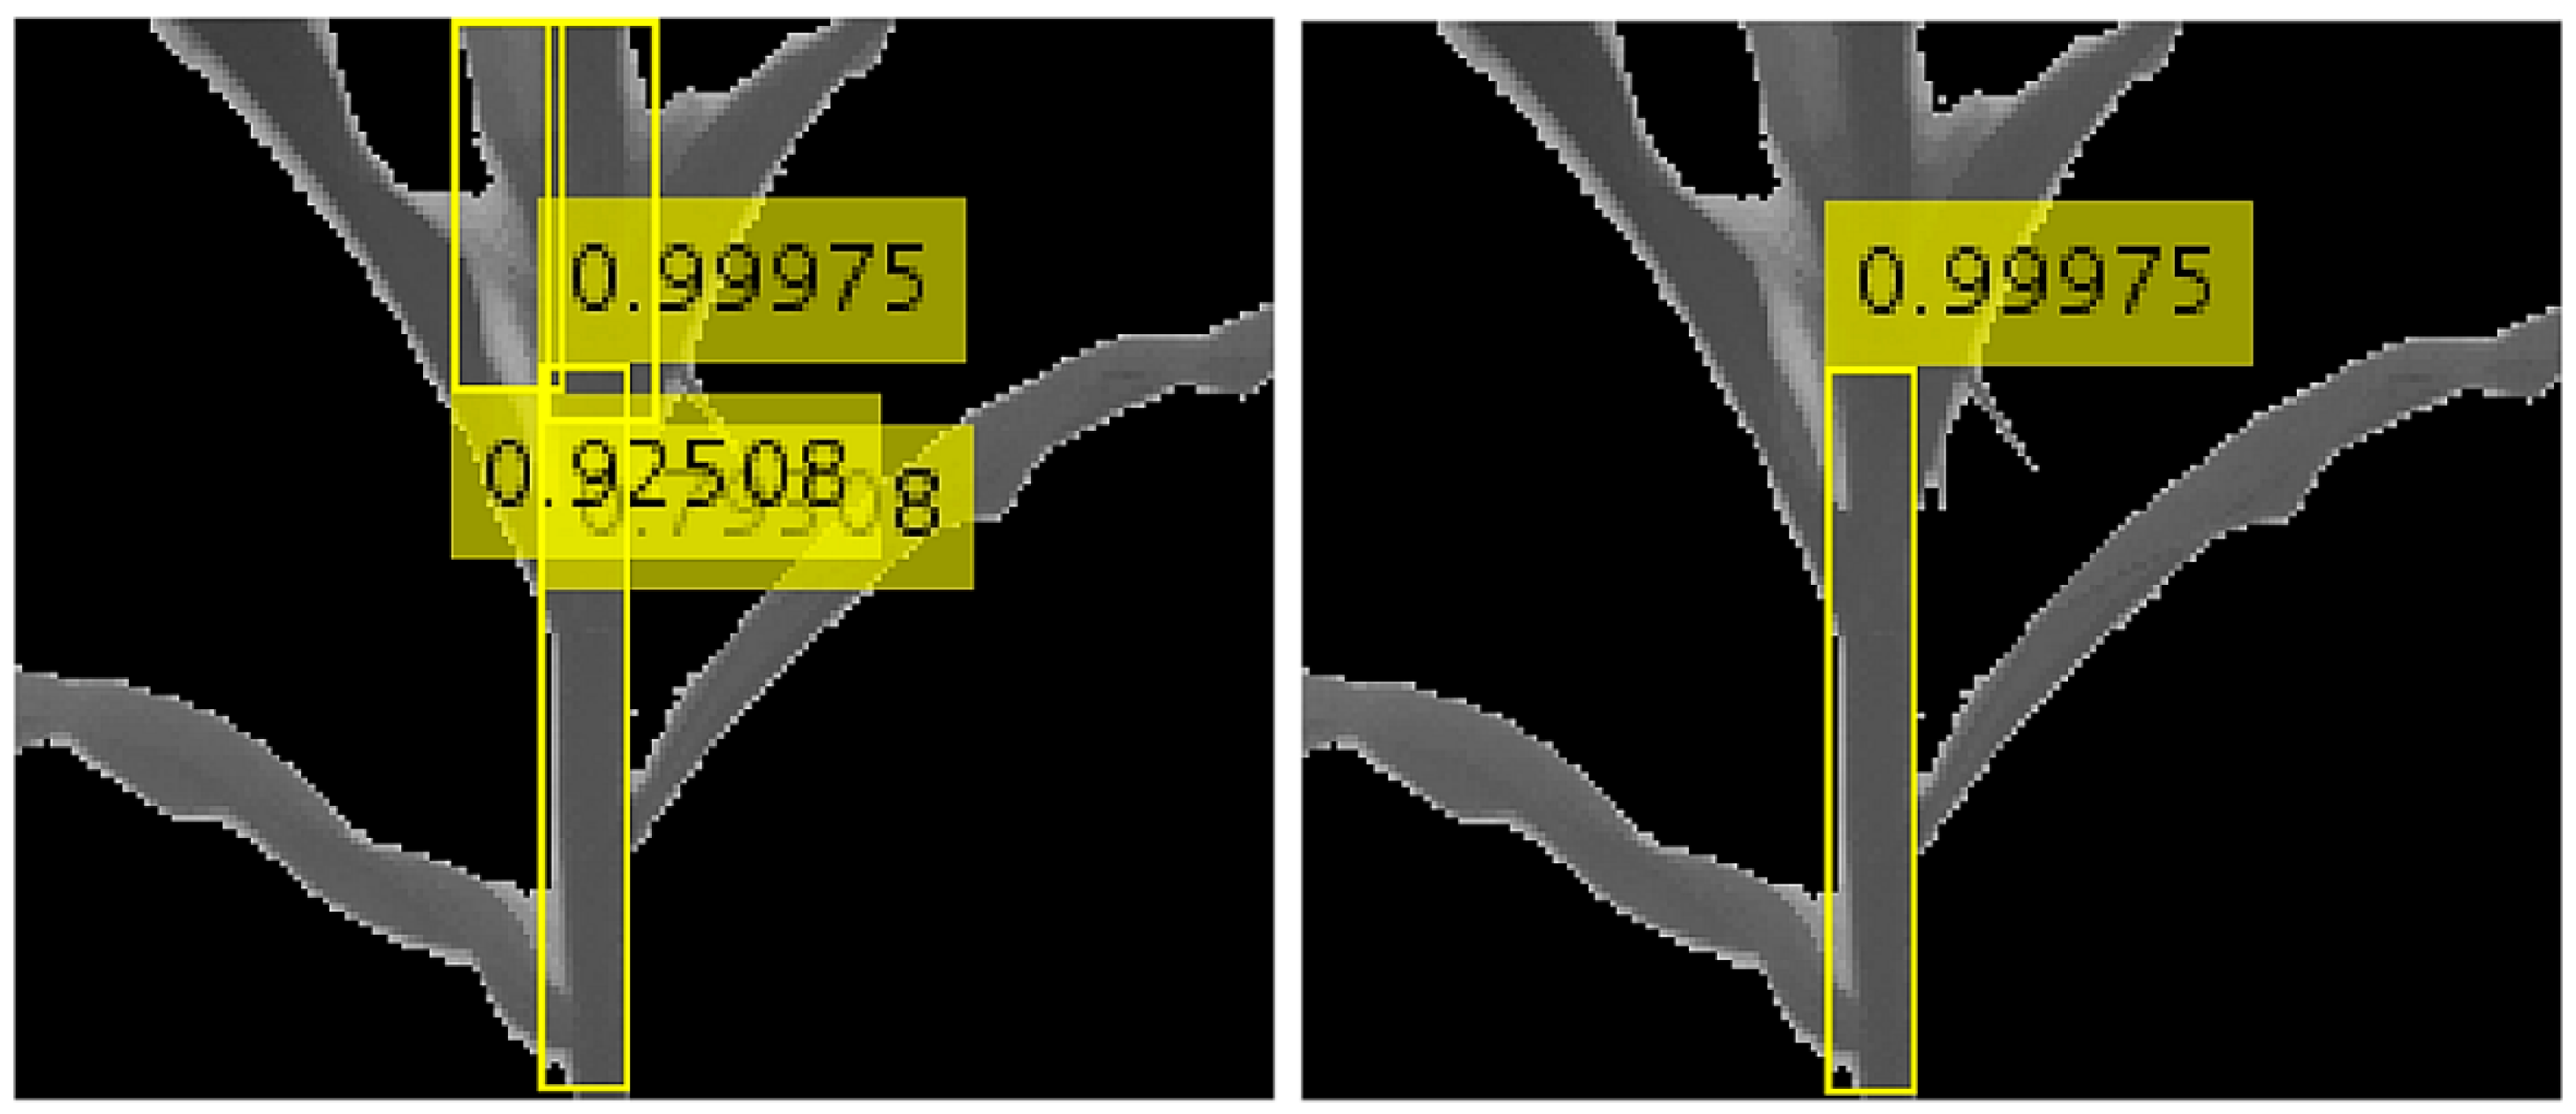
Figure 4 illustrates the architecture of the model. The detector was used to find a bounding box as stem region in a testing image. The detector generally identified several different bounding boxes as stem candidates. The bounding box that was assigned the highest confidence-score by the detector was selected as the stem (
Figure 5). Sixty testing images were used to evaluate the performance of the model. The model detected stems in fifty-six images correctly, and for other four images incorrectly. The precision, recall, and F1-score of the model on the testing set were all the same values and equal to 0.93. A laptop with Intel Core i7 Processor (2.5 GHz) and 8 GB RAM was used to implement the training process of the network.
2.2.2. Determination of the Grasping Point on the Stem
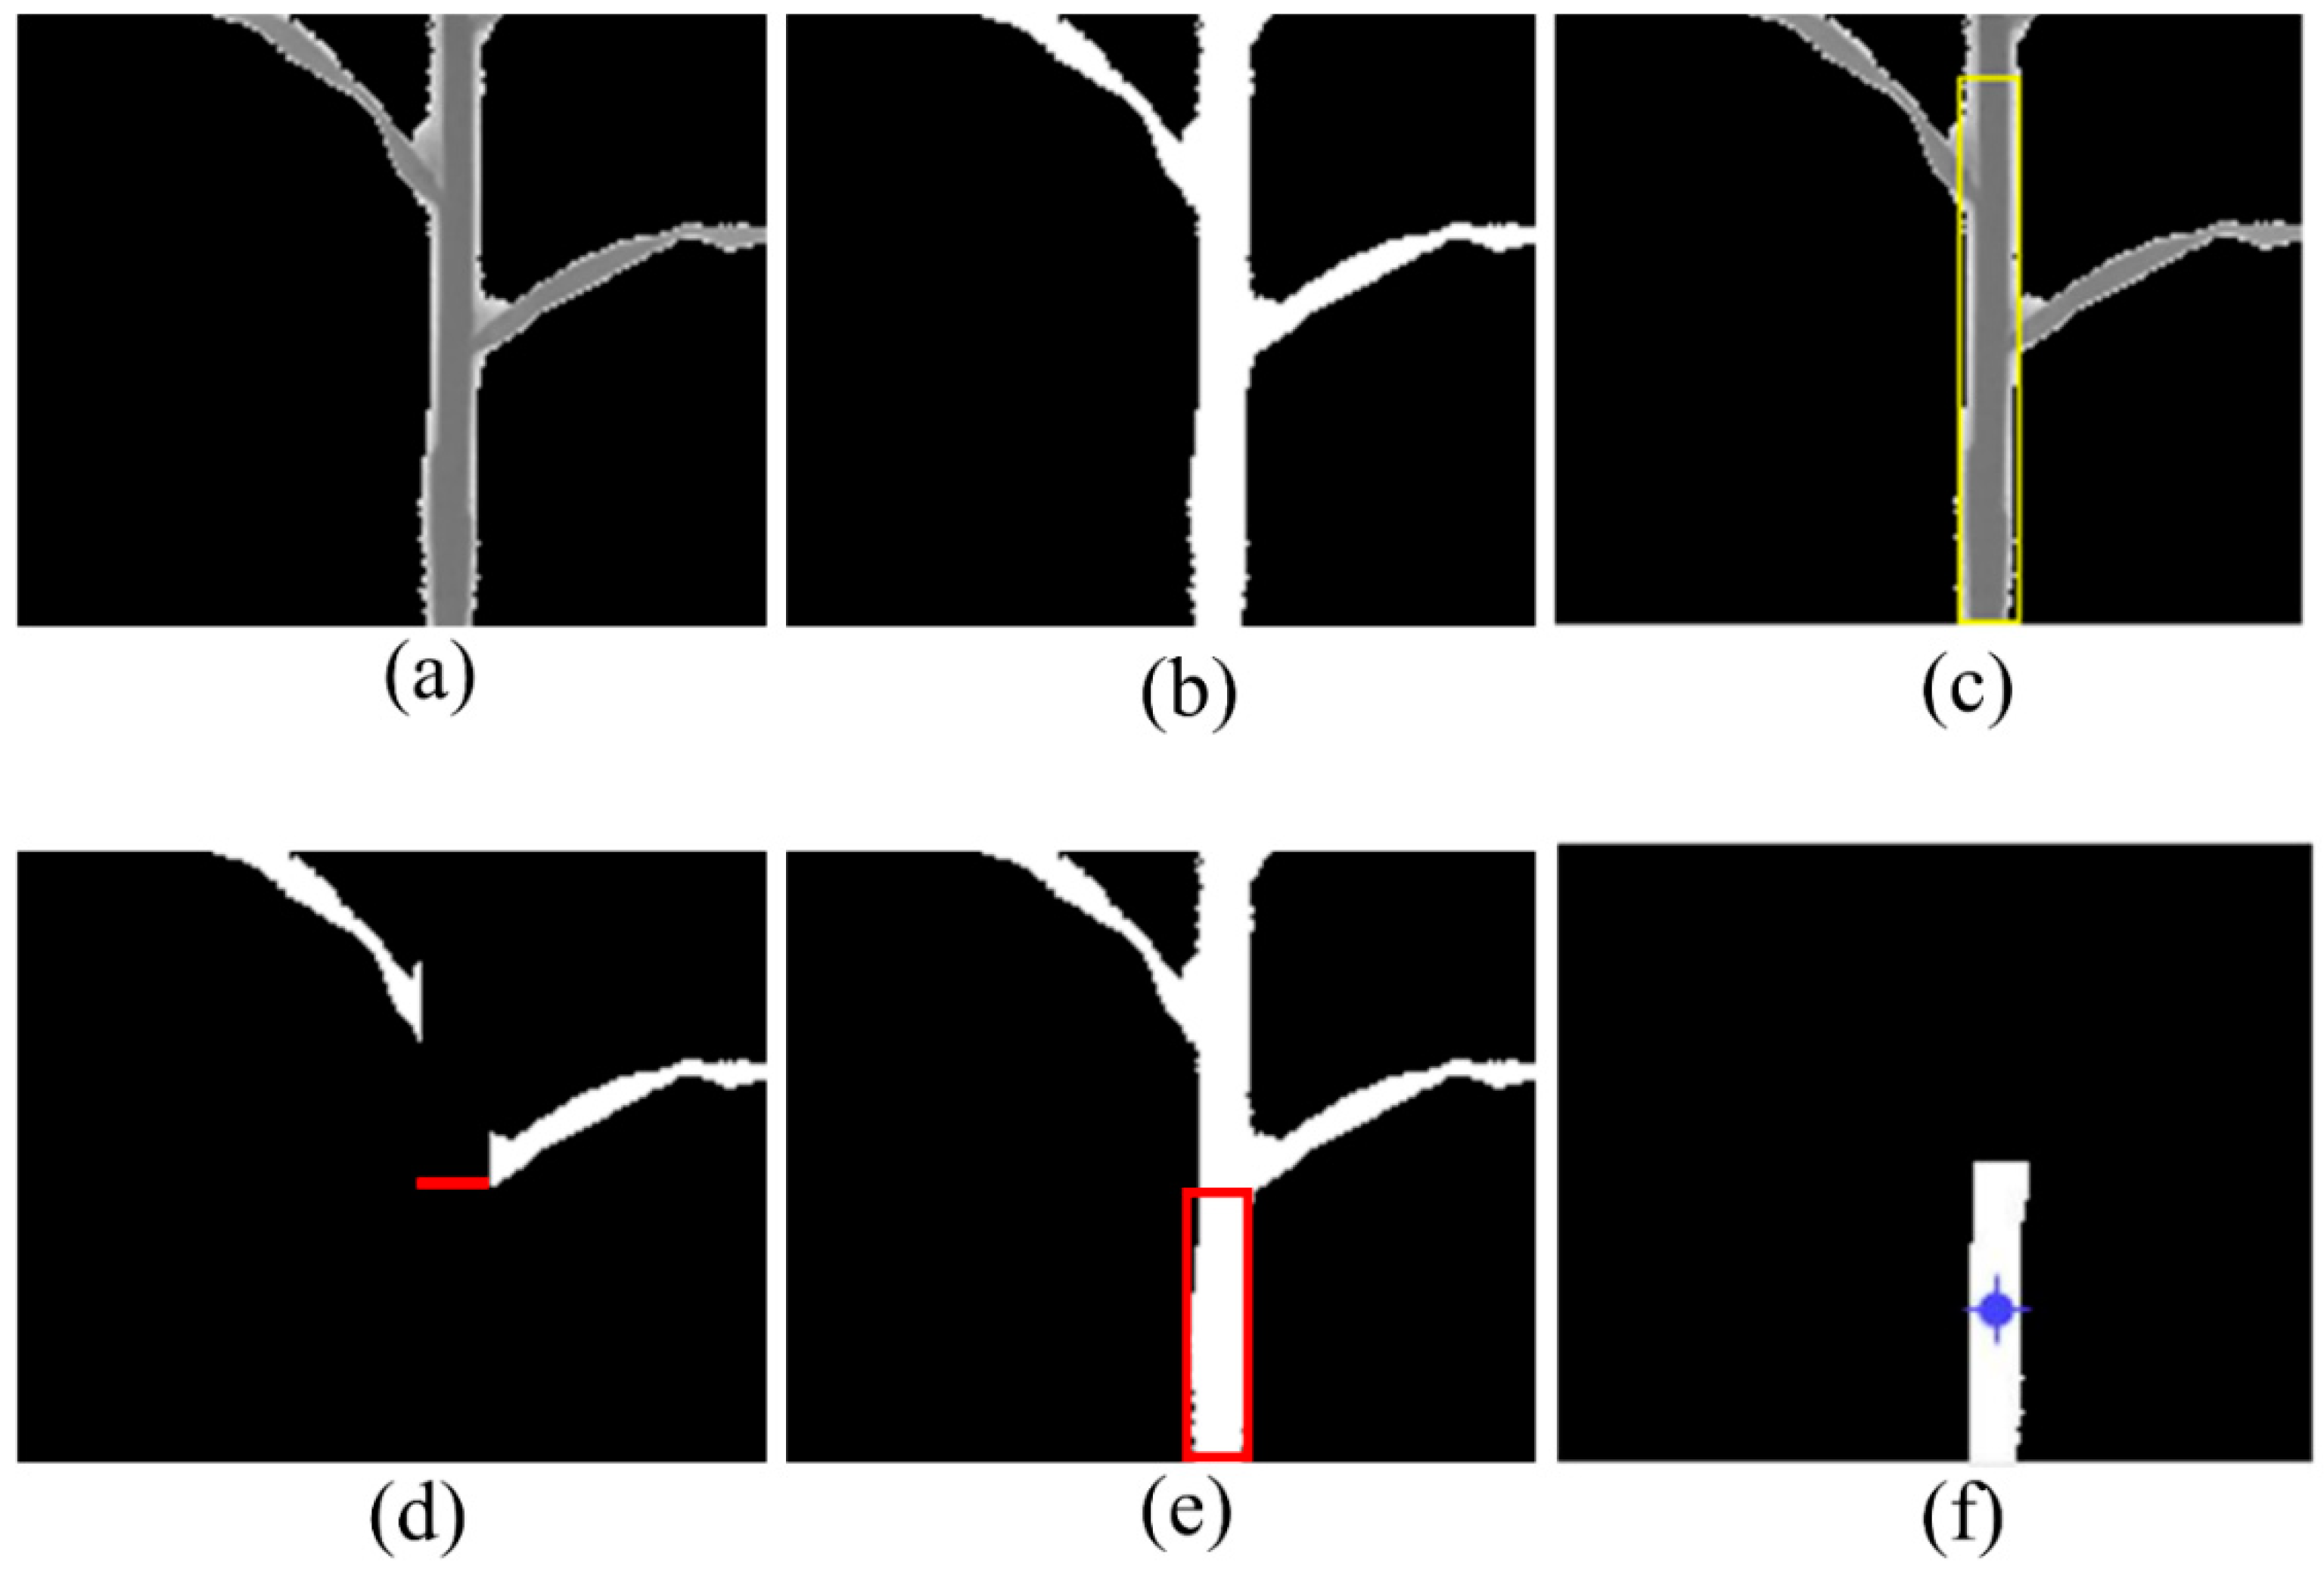
The image processing toolbox in MATLAB (version 2018, MathWorks) was used to segment the plant from the background in the image and to determine the grasping point on the stem. The plant was segmented from the background using a threshold in Z channel (the distance of the plant to the camera in Z direction) of the scene and accordingly a grey-scale image was created (
Figure 6a). In this method all objects in the image behind the plant (simple or complicated background) were removed beyond the threshold. The grey-scale image was then converted into a binary image (
Figure 6b). Deep learning technique (Faster R-CNN) was applied to detect the stem in the image. The vertical lines of the bounding box were determined as stem’s vertical edges (
Figure 6c).
The stem was removed from the binary image (after finding the vertical edges of the stem) and the most bottom leaf was labelled as the first leaf. The most bottom pixel of the first leaf that was connected to the stem was found. A horizontal line was drawn from the bottom pixel that was used to find the candidate grasping region of the stem to avoid hitting the leaves during the movement of the robotic arm (
Figure 6d). Thus, to detect the stem grasping area, all pixels in the binary image of the plant were removed except the pixels located between the stem’s vertical edges and under the horizontal line (
Figure 6e). The coordinates of the center point of the stem grasping area in the image was determined as the grasping point (
Figure 6f). Then, the XYZ coordinates (3D coordinates) of the grasping point relative to the center of the camera’s coordinate system were found using XYZ channels of the scene, which was provided by the TOF camera.
2.2.3. Inverse Kinematics of the Robotic Manipulator
A transformation matrix was created based on the translation (
) and rotation (
) of the camera’s coordinate system and robotic manipulator’s coordinate system to find the 3D coordinates of the grasping point relative to the robotics manipulator’s coordinate system (Equation (3)).
where:
then:
RP,
, and
CP are the 3D coordinates of the grasping point relative to the center of robotic manipulator’s coordinate system, the transformation matrix, and the 3D coordinates of the grasping point relative to the center of camera’s coordinate system.
= 10.5 cm,
= −4 cm, and
= 41.2 cm are the distances between the coordinate system of the camera and robotic manipulator in X, Y, and Z directions (
Figure 7).
The geometric approach in inverse kinematics was used to calculate the angle of the first three joints of the robotic manipulator for grasping process of the stem. The angle of the fourth joint was a constant value such that the end-effector of the robotic manipulator was parallel to the horizontal plane at the beginning of its movement to grasp the stem and the roll angle was not changed during grasping process.
Gripper fingers control: An Arduino program was developed to control (open and close) the fingers of the gripper. The output of the DC motor’s encoder shows the position of the motor. The encoder output was used to stop the linear movement of the fingers at the end of the opening process when they are fully opened, and also at the end of the closing (grasping) process to avoid excessive squeeze to the stem. For this purpose, the program compares two consecutive readings of the encoder. If the readings are equal, then it can be deemed that the motor is stalling due to the resistance force induced when the grippers are in contact with the stem or it is fully opened. To open and close the fingers using MATLAB, “MATLAB Support Package for Arduino” was used for MATLAB-Arduino serial communication.
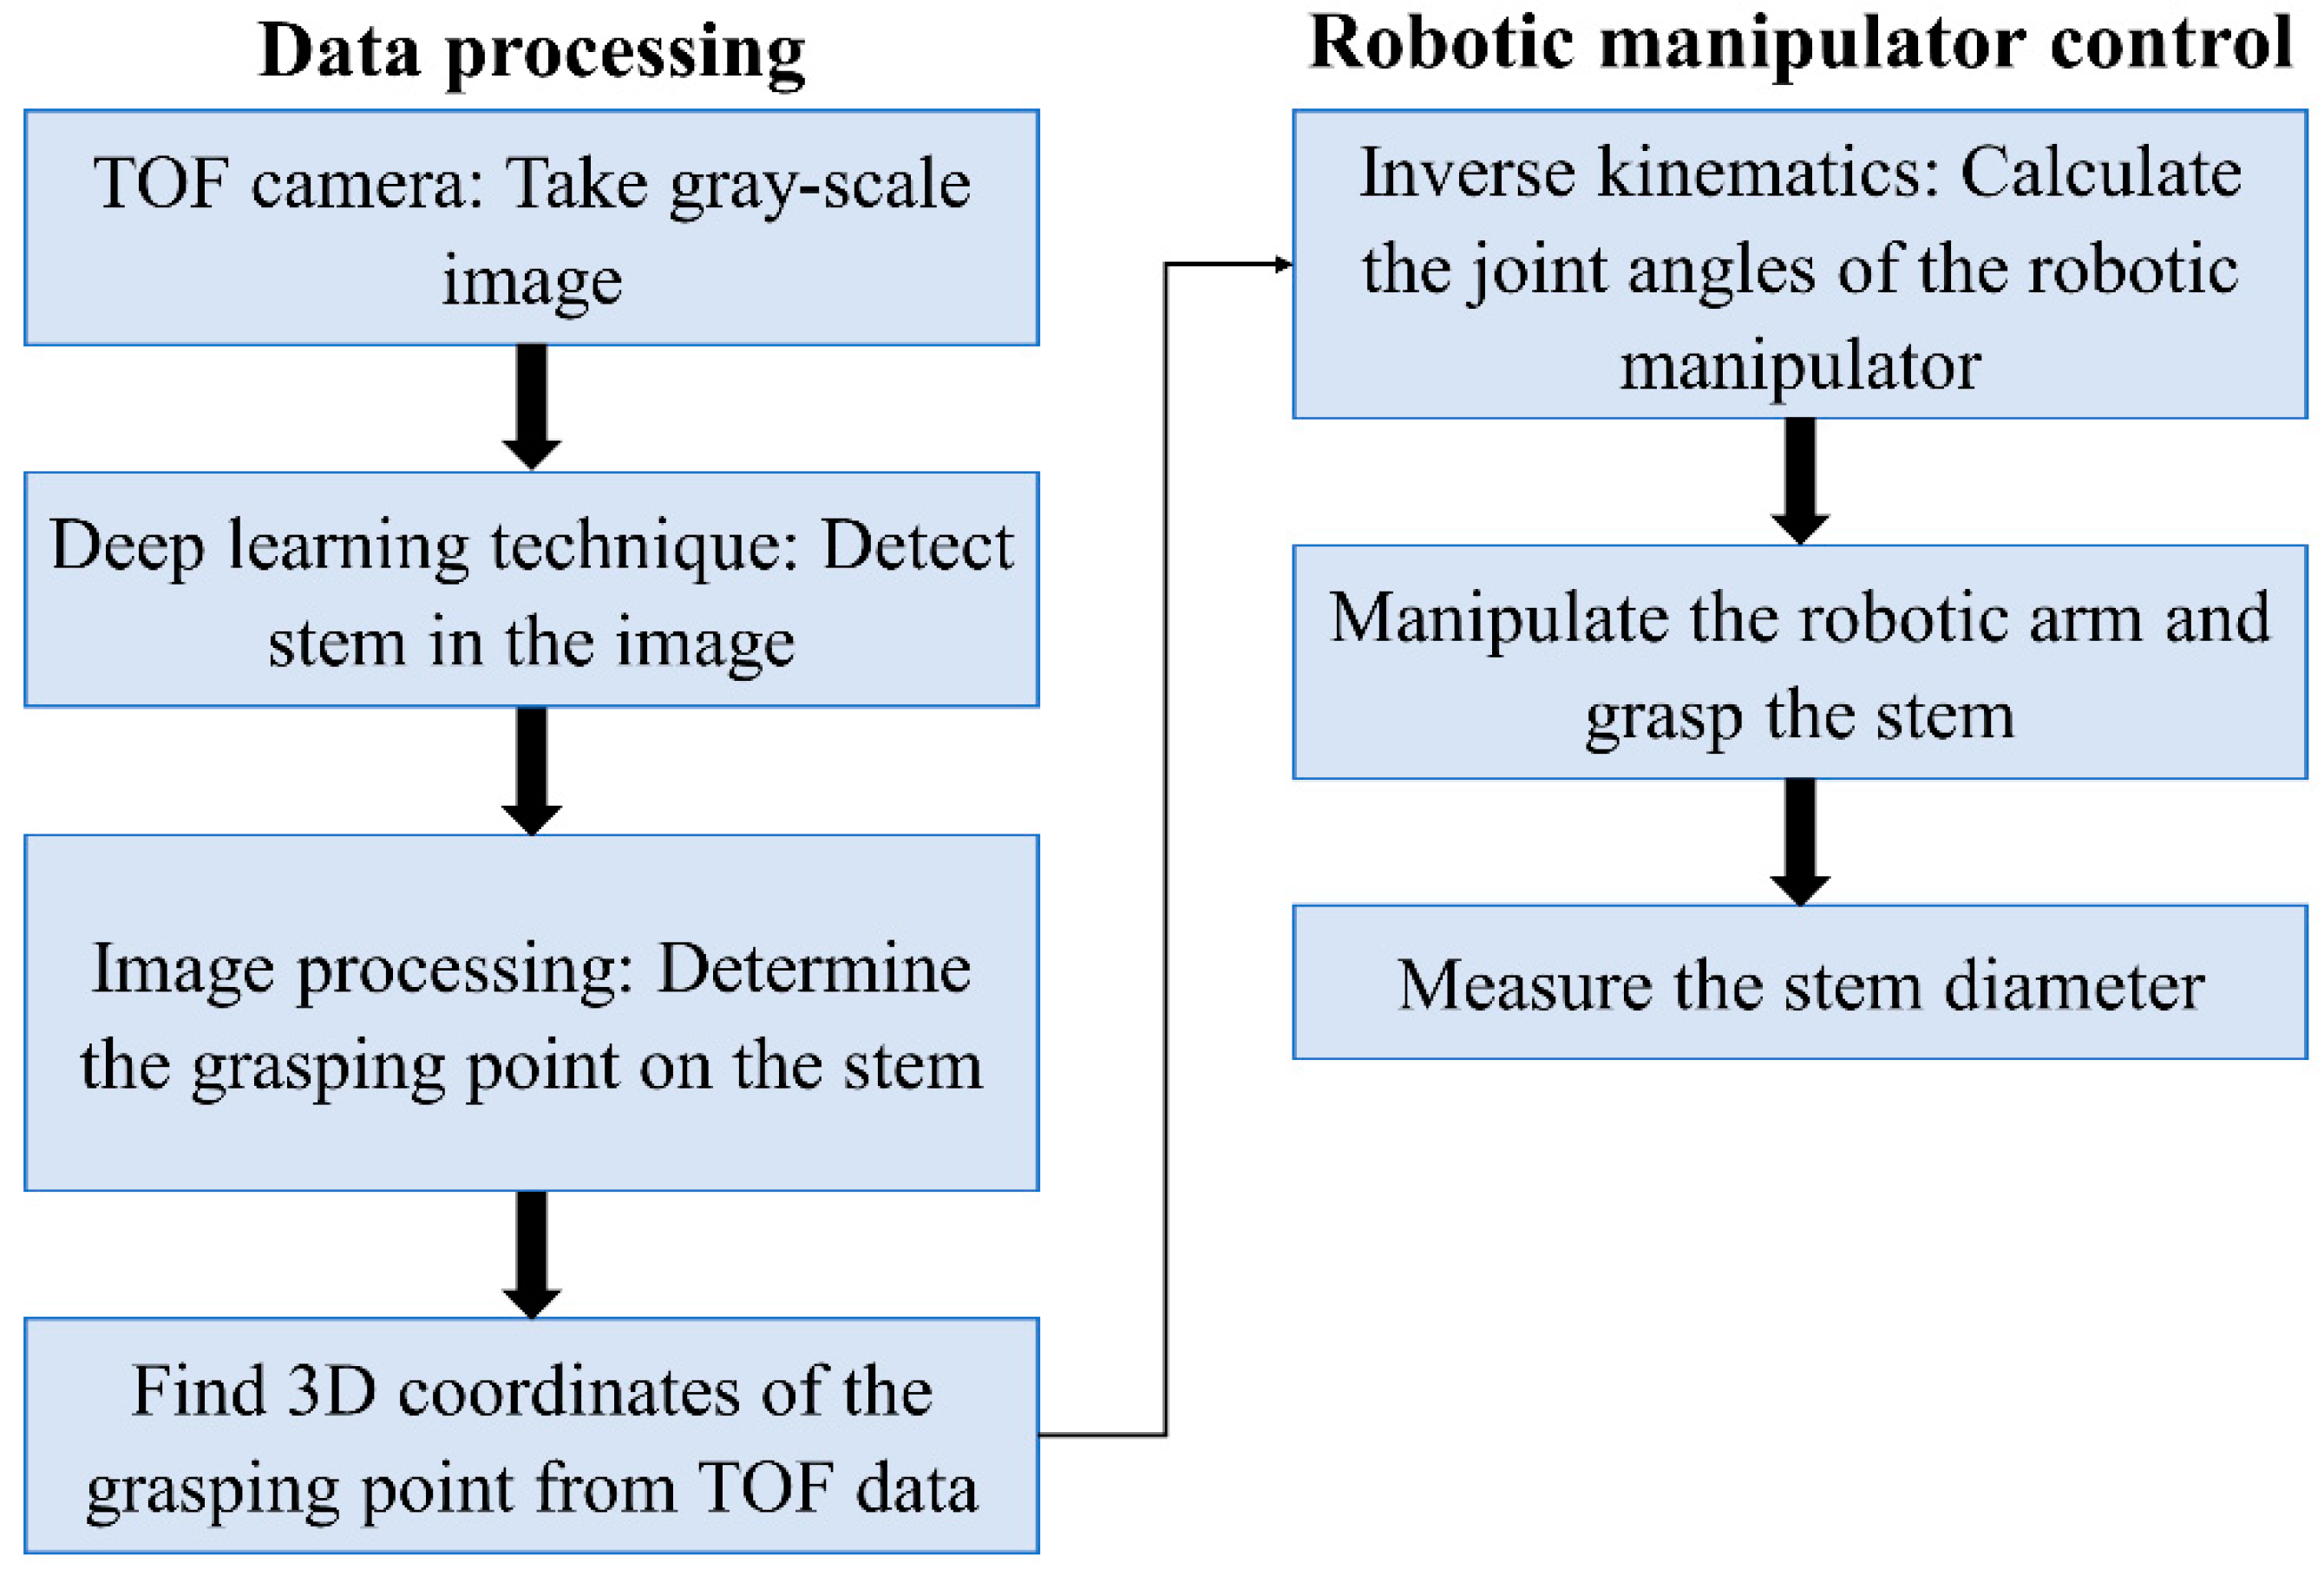
The architecture diagram of the robotic system is depicted in
Figure 8 which illustrates the aspects of data processing and robotic manipulator control.
2.3. Greenhouse Experiment and Data Collection
An experiment was conducted in the Greenhouse Innovation Centre of University of Nebraska-Lincoln to assess the robotic system. For this purpose, two different lines of maize (B73 and Oh47) and two different lines of sorghum (Simon and Grassl) were selected. Eight plants for each line of maize and sorghum were grown and 32 plants in total were used for the experiment.
The experiment was conducted over a period of six weeks (first three weeks for maize and second three weeks for sorghum) to create more variability for stem diameter measurements. The plants had ten leaves (V10) and tassel (VT) at the start and the end of the measuring period for maize and then for sorghum. One day per week was chosen to measure the stem diameter of sixteen plants. In total, the stem diameter of 96 samples were measured during the experiment. To take the automated measurements, the plant was placed in front of the camera. Since the robotic system was not equipped with an obstacle avoidance algorithm such as collision-free path planning or deep reinforcement learning, two considerations were taken for stem grasping process. First, the distance between the stem and the center of the camera’s coordinate system in Z direction was about 40 cm. This distance ensured the secure movement of the robotic manipulator without any harmful contact with plant leaves. Second, one or two leaves of the plant close to the soil were removed to enable free movement of the robotic manipulator without hitting the pot. This measure had to be implemented to avoid detection of the stem grasping point in the clearance area between soil and top edge of the pot which otherwise would have led to a collision of gripper with the pot edge. However, this is not an issue if one needs to adapt this technique for field application, since there is always enough vertical distance between the bottom leaf and soil surface for the movement of the robot. Ground-truth (manual) measurements of stem diameter were collected from each plant, subsequent to the robotic measurement, at the same grasping point using a digital caliper (Model: Brown & Sharpe 00590091, Hexagon Manufacturing Intelligence, North Kingstown, RI, USA).
3. Results and Discussion
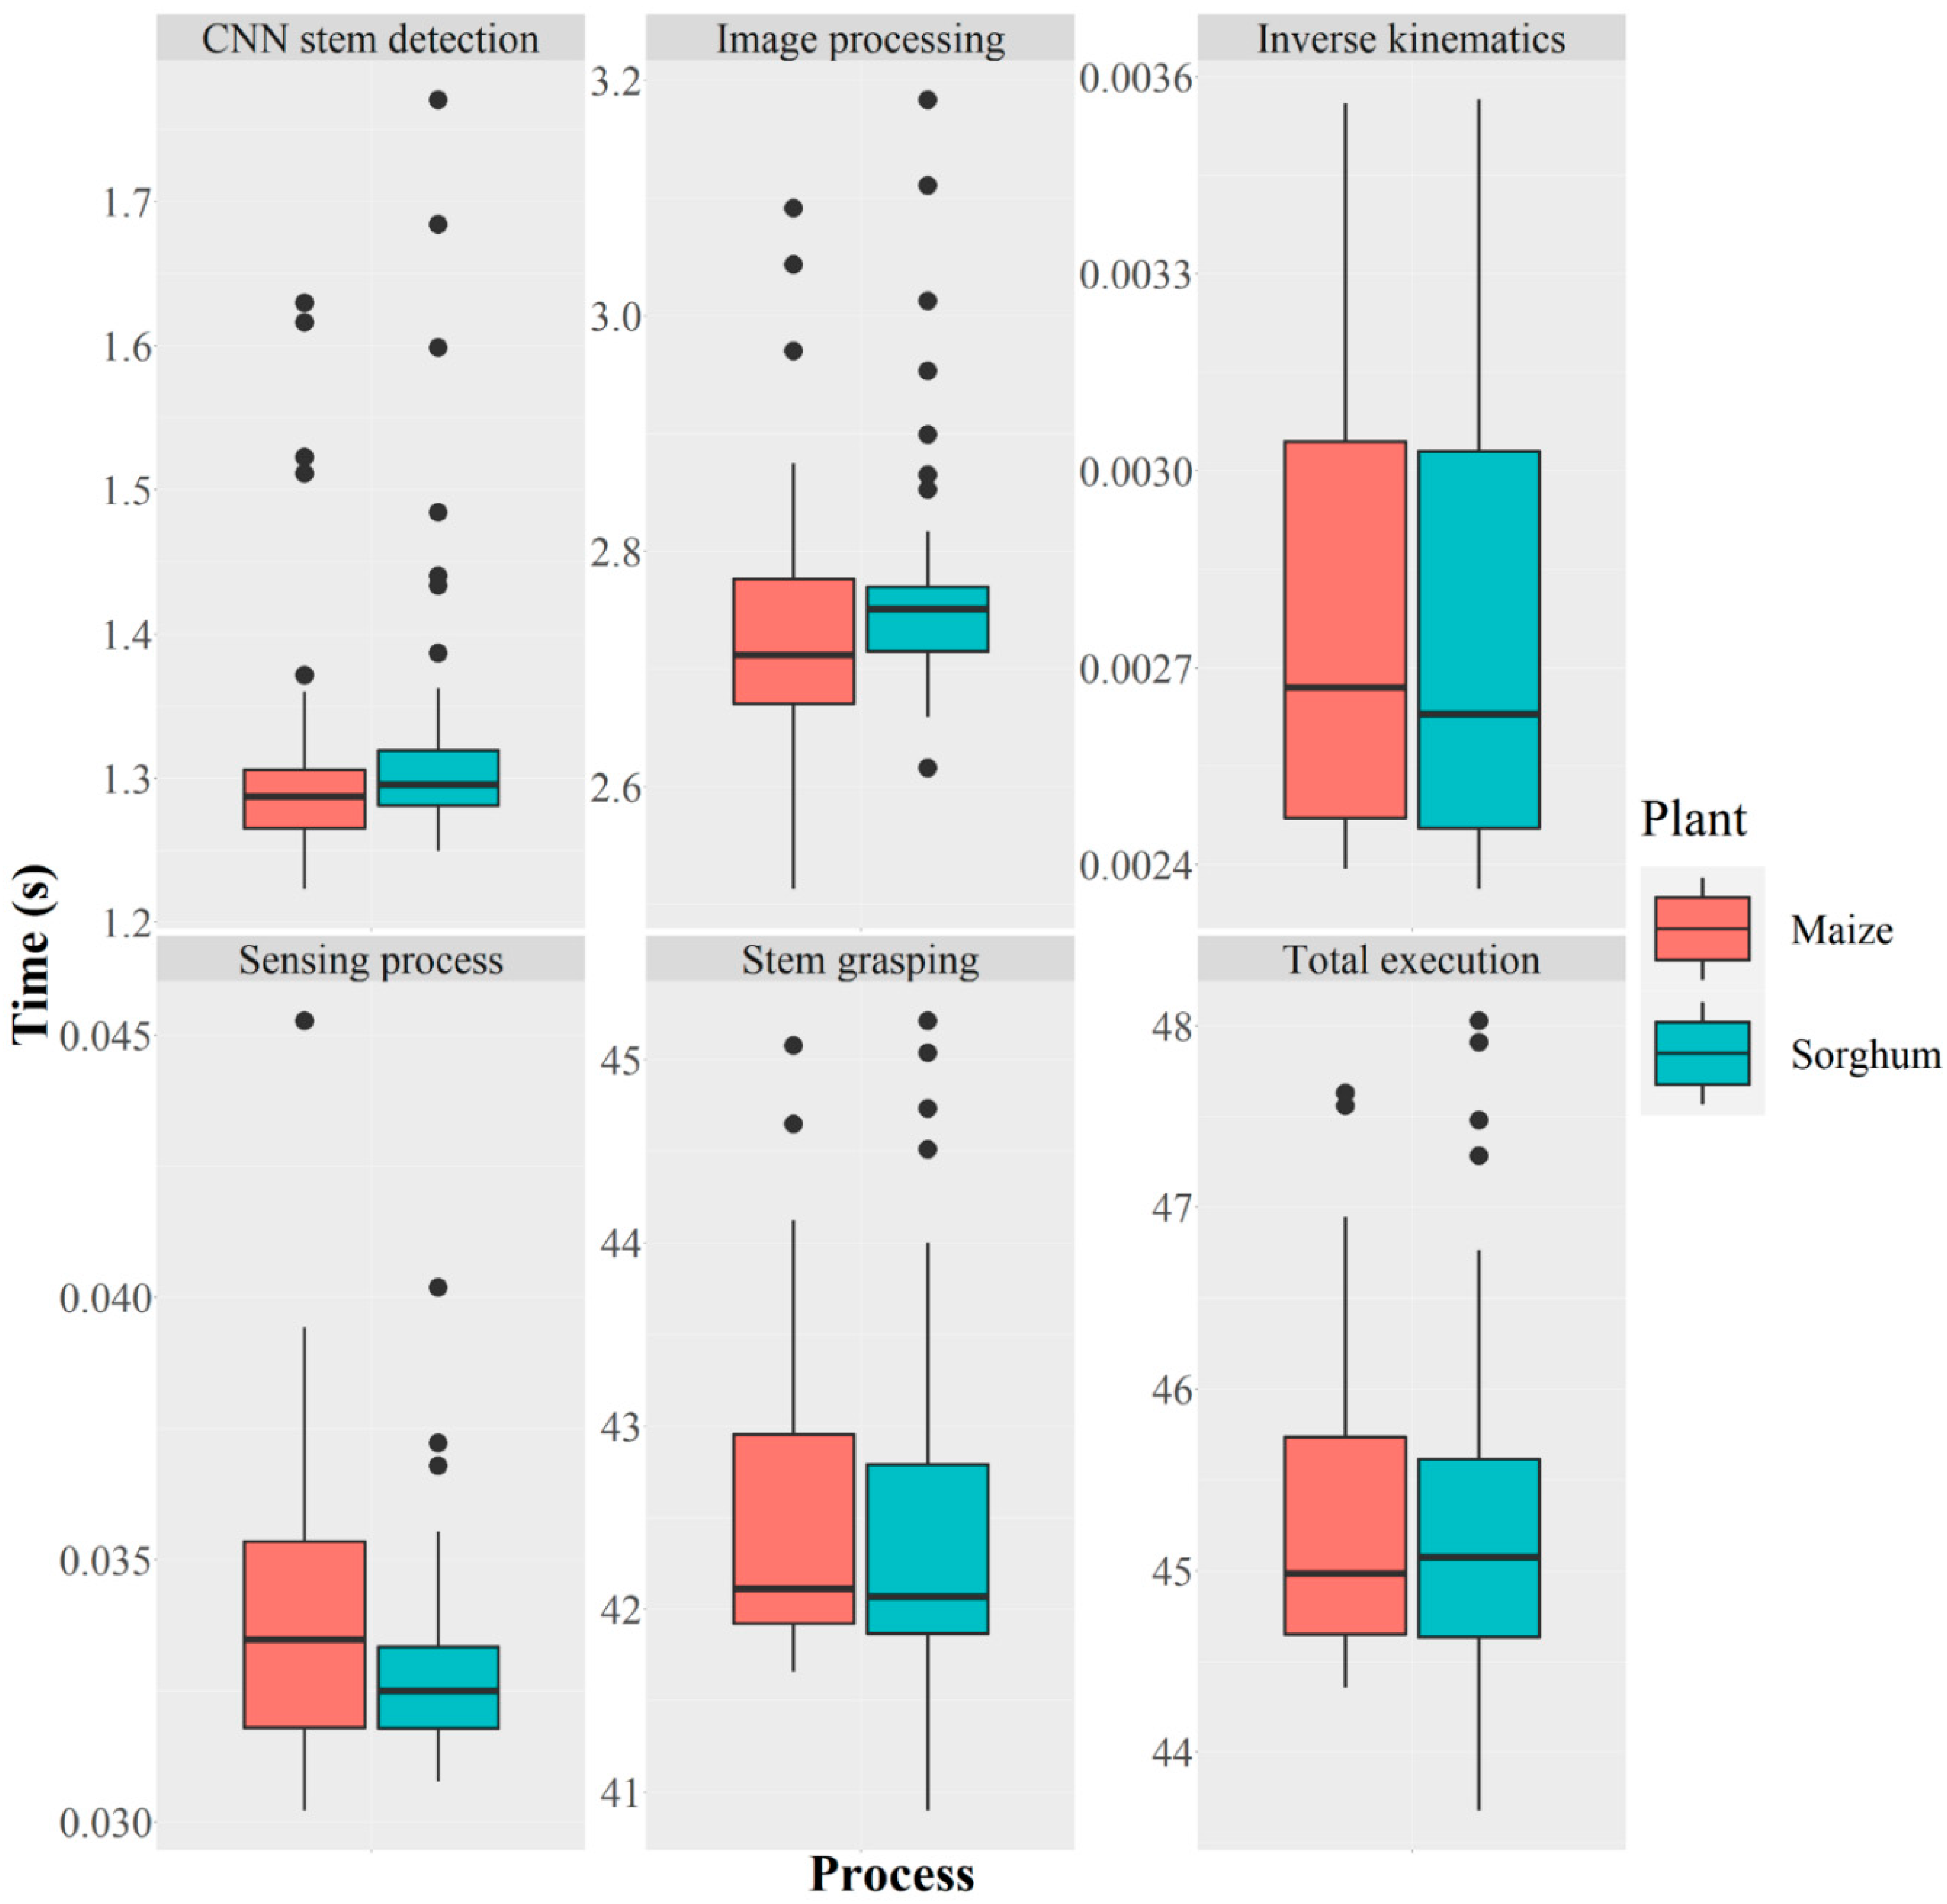
Figure 9 shows the range of time taken for each step in the stem grasping and measuring process: stem detection using the trained CNN, image processing to determine the grasping point on the stem, inverse kinematics to calculate the joint angles of the robotic manipulator, stem grasping, and sensing process to measure stem diameter using LP sensor, as well as the range of total execution times for maize and sorghum.
Automated measurement took more time (total execution time of approx. 45 s) than manual measurement (less than 10 s). The physical stem grasping process, in which the robotic manipulator was actuated to grasp the stem and back to its initial position after taking the measurement, took the majority of the total time. The velocity of the robotic manipulator for the grasping process was reduced in order to avoid damage to the plant caused by an unintended hit of the robotic manipulator. The performance of the robotic system can be improved using an obstacle avoidance algorithm such as collision-free path planning or deep reinforcement learning. These techniques can find the optimal grasping path without hitting the plant and therefore the time for stem grasping process will be minimized. Moreover, the aforementioned consideration regarding plant-robot distance to have a secure movement of the robotic manipulator will not be required. The stem detection, determining grasping point on the stem, and sensing process took shorter times, illustrating the potential of the system for real-time stem detection and localization, as well as the stem diameter measurement.
The Faster R-CNN-based method and image processing techniques successfully detected and localized the stem (either vertical or tilted stem) and its grasping point for all plants in the experiment, and the robotic system successfully grasped each stem. Although in this research, deep learning technique was successful for stem detection using the images just contained plant without other objects, for other research the deep learning model could be trained even in the presence of other objects in the image such as pot.
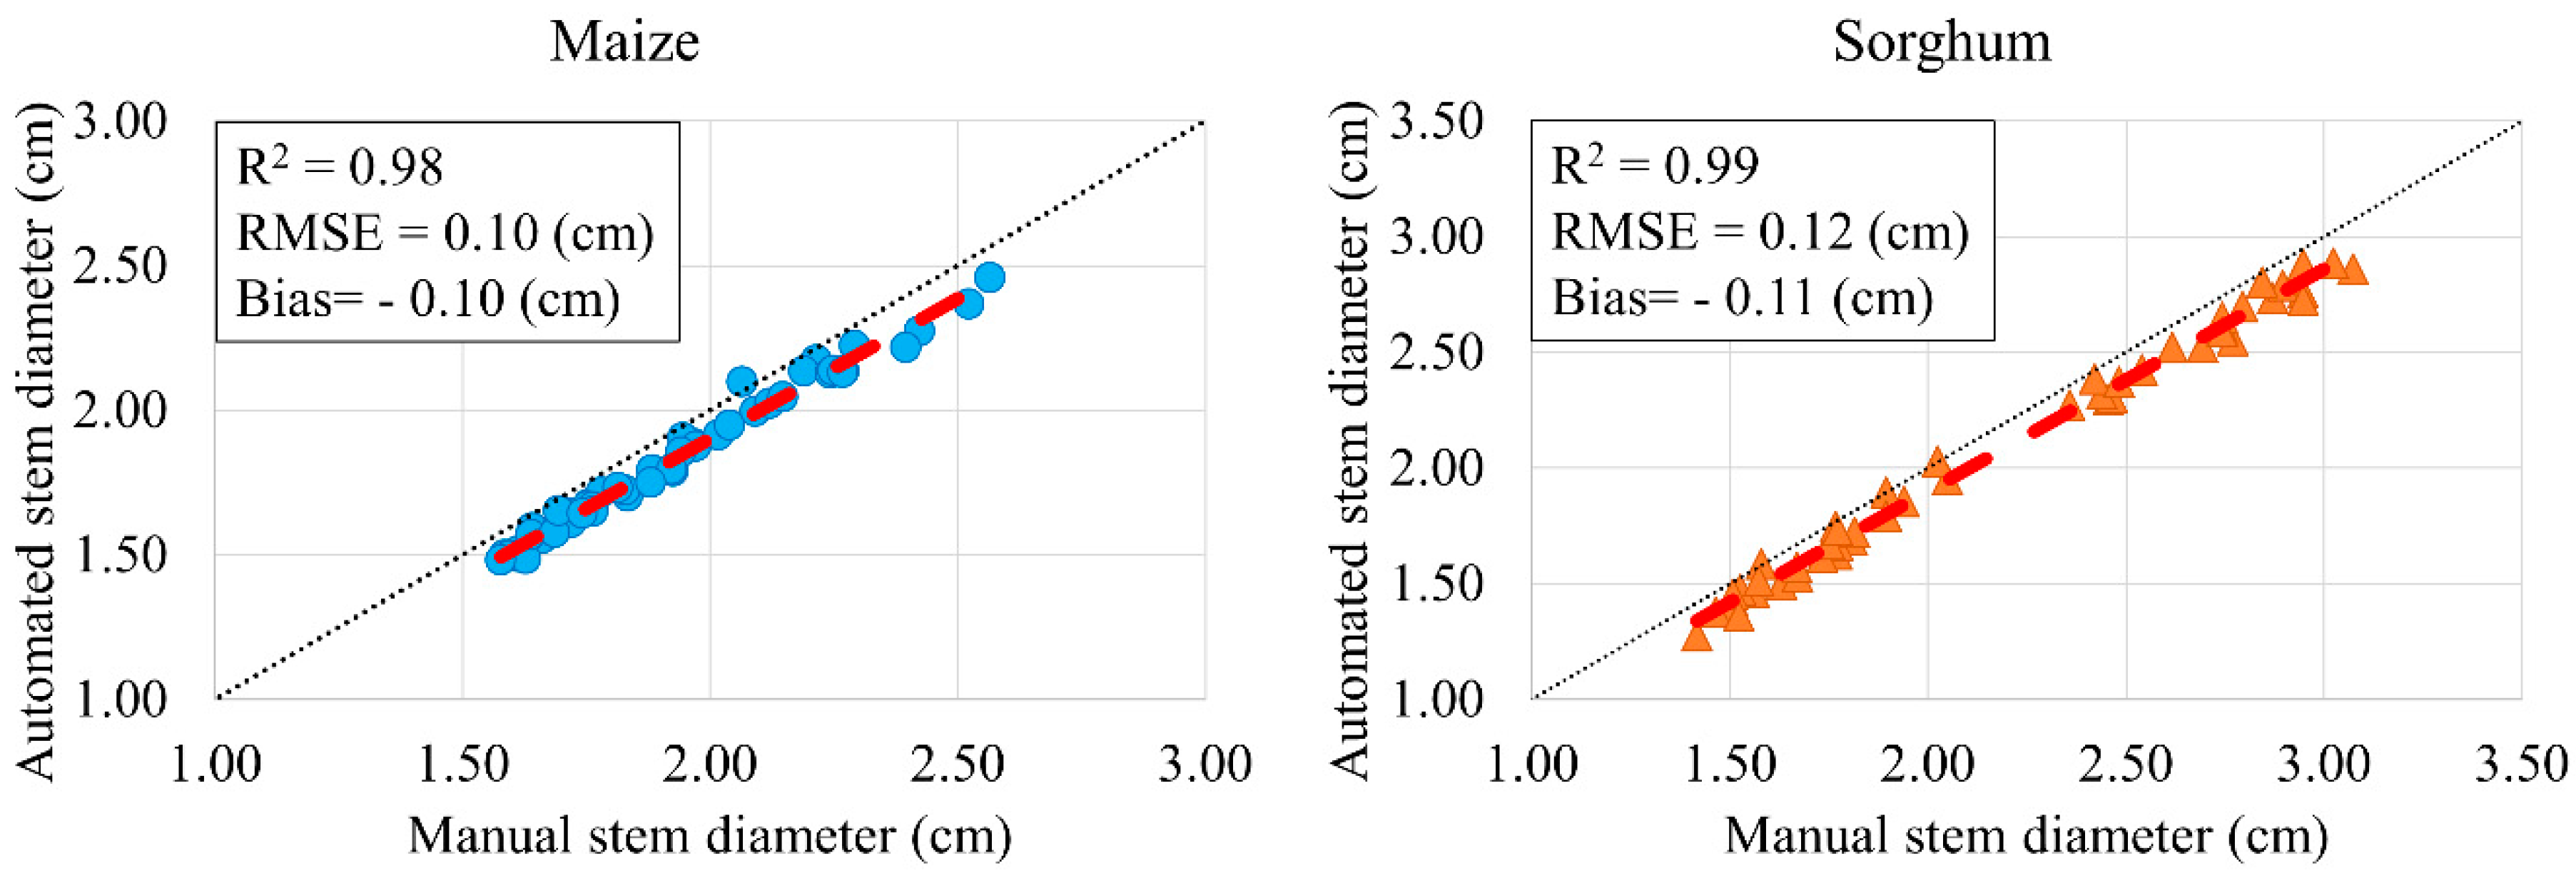
The automated and manual measurements are highly linearly correlated (R
2 = 0.98 for maize, and R
2 = 0.99 for sorghum) (
Figure 10). There was a modest bias toward bigger measurements reported by manual measurement than by automated measurement (−0.10, and −0.11 cm for maize, and sorghum). This negative bias is likely a calibration error that could be addressed by recalibrating the sensor. The relative errors to measure stem diameter were small (4.97% for maize, and 4.88% for sorghum). It can be concluded that the robotic system could accurately measure the stem diameter for all plants during the experiment. Apart from physical measurement, literature reports other vision-based methods of stem diameter estimation.
Choudhuri et al. [
17] could estimate the stem diameter for sorghum plants with 92.5% and 98.2% compared to manual measurements using vision and vision+LIDAR methods. Our robotic system could measure the diameter with 95% for both maize and sorghum. Jin et al. [
7] reported the diameter estimation with R
2 of 0.62 using MNVG algorithm. In comparison, a R
2 ≥ 0.98 for stem diameter measurement was observed in this study. The absolute error using deep learning in [
4] and relative error using image processing in [
15] was 2.77 mm and 13%, respectively. The results of the tested robotic system showed stem diameter measurement with absolute error about 1 mm and relative error less than 5%. Bao et al. [
16] could not get satisfactory results regarding diameter estimation because of the low resolution of TOF camera. However, our robotic system could successfully detect the stem using deep learning and measure stem diameter with high accuracy.
In general, robotic system tested in this study outperformed other vision-based systems reported in literature except for one. However, our system was designed for indoor application with controlled environment. On the other hand, the aforementioned vision-based systems were used for outdoor application that require addressing several additional challenges. For example, it is difficult to identify occluded stem by leaves. In addition, the color and texture similarities between stem and leaf may cause issues for stem detection. Furthermore, the sunlight can have negative effect on the performance of stem detection algorithm.
Some characteristics of stem such as reflectance, sap flow, and lodging resistance cannot be measured using vision-based methods and the stem should physically be grasped by a robotic arm. The main purpose of designing such a robotic system was to grasp the stem and show its ability to integrate other contact-based sensors for different measurements. The stem diameter measurement was a case study to show this system is useful for this purpose.
The current system has two limitations that should be addressed to improve its design for future applications. First, for the plants with elliptical morphology of stem, it is possible for the robotic manipulator to grasp the stem from its minor diameter. A robotic arm with more degree of freedom can be used to accommodate more flexibility for dexterous grasping such that the stem diameter is always measured from its major axis. Second, since this work was presented as a stationary system, the plants were moved by a human and placed in front of the system. The robotic system can be integrated to an automated greenhouse where a conveyor belt brings the plants to the system for the measurements.
In the future, the same system could be equipped with different sensors to measure different phenotypes of plant stems. For example, a bifurcated fiber can be attached to the end-effector of the robotic manipulator and the spectral data of stem can be acquired. Then, the chemical properties of stem such as chlorophyll, water content, and nitrogen content can be predicted by analyzing the resulting spectral data [
21,
22]. Stem strength and sap flow are other plant attributes that can be measured by implementing contact-based sensors in the robotic system. A force sensor and a sap flow sensor can be installed to the gripper of the robotic arm and the lodging resistance of stem and fluid movement in the stem could be sensed. The robotic system also can be mounted on a ground-based vehicle and collect data in the field. However, several challenges should be expected in this regard. First, it is challenging to accurately navigate and control the mobile robot between plant rows. For this purpose, global positioning system (GPS) and proximity sensors can be implemented. Second, varying lighting condition and occluded stem by leaves can be problematic for stem detection. To address this issue, the deep learning model should be trained and calibrated using the plant images in the field to detect the stem of all plants in rows. Third, it might be a difficult task for the robotic manipulator to reach the stem because of obstructions from the adjacent plants. Therefore, an optimized and sophisticated obstacle avoidance algorithm should be used to grasp the stem.


