Abstract
Simultaneous Localization And Mapping (SLAM) usually assumes the robot starts without knowledge of the environment. While prior information, such as emergency maps or layout maps, is often available, integration is not trivial since such maps are often out of date and have uncertainty in local scale. Integration of prior map information is further complicated by sensor noise, drift in the measurements, and incorrect scan registrations in the sensor map. We present the Auto-Complete Graph (ACG), a graph-based SLAM method merging elements of sensor and prior maps into one consistent representation. After optimizing the ACG, the sensor map’s errors are corrected thanks to the prior map, while the sensor map corrects the local scale inaccuracies in the prior map. We provide three datasets with associated prior maps: two recorded in campus environments, and one from a fireman training facility. Our method handled up to 40% of noise in odometry, was robust to varying levels of details between the prior and the sensor map, and could correct local scale errors of the prior. In field tests with ACG, users indicated points of interest directly on the prior before exploration. We did not record failures in reaching them.
Keywords:
SLAM; prior map; emergency map; layout map; graph-based SLAM; navigation; search and rescue 1. Introduction
We aim at reducing the time and efforts necessary to deploy a robot in an emergency scenario or an industrial environment by integrating prior information into Simultaneous Localization And Mapping (SLAM). Using prior information can avoid the need to initially explore an unknown environment before starting the actual operation and decrease the risk of map errors since the map prior can be used to constrain the robot-built sensor map. Prior information that could be used in SLAM is present in most indoor environments: emergency maps are often displayed on the walls, and plans of the building may be available to help visitors navigate the environment. While this information tends to be outdated or have some local scale inaccuracies, prior maps of the environment are usually topologically accurate since they are made to help human navigation. Hence, by using prior information, the robot could potentially produce more accurate maps and correct errors due to drift in the measurements.
However, using prior information can do more than simply support building more accurate maps. Having a prior map before exploration gives the robot access to a rough plan of the environment beforehand. This knowledge can be used to speed up exploration by reasoning about the environment before or while actual exploration takes place. Since it was typically designed to be easy to interpret for humans, the prior map can also be used as an interface for quick operation commands such as navigation goals or trajectory following.
An emergency response scenario could benefit from integrating a prior map into SLAM and using the prior map as an interface. Since first responders often work under high stress with tightly organized operational plans, anything that breaks their workflow is seen as a hindrance. Thus, to be efficient in actual operation, a robot needs to be able to work in a way that fits the responders workflow and tools. In collaboration with Dortmund’s firemen, we identified that a familiar interface that fits their workflow can be based on emergency maps, and in the present work we take a step toward enabling robots to be part of a first responders team by using the emergency map as prior information for SLAM.
In our experiments, we manually converted the emergency map to a layout map in which only the walls in the emergency map are kept. Similar layout maps can also be acquired from other sources. These layout maps usually suffers from local scale errors due to the nature of emergency maps, from errors in perspective if it is a picture of a map, or even from errors introduced by the wall extraction method itself. In our work, we try to answer the question of how to use a rough layout map in SLAM while correcting errors in both the robot-built sensor map and the layout map.
2. Contributions
In our previous work [1], we developed a graph-based SLAM formulation that used the robot’s sensor map to correct errors in a prior map representing the environment. Our method was able to correct local scale errors, e.g., if a corridor or room in the prior map is represented smaller or larger than its actual size. It was also able to add missing elements to the prior map, such as missing rooms or walls. The method matched corners from the prior map, in the form of a rough layout map, to a corners in the sensor map using a user chosen distance threshold. Since the distance threshold had a fixed value, we typically had more than 50% of wrong correspondences between corners. The graph was optimized and the errors in the layout map were corrected by sequentially applying first a robust Huber kernel and then dynamic covariance scaling [2,3]. However, due to the amount of incorrect correspondences, correcting errors in both the layout and sensor maps was impossible and our previous work limited the correction and optimization to only the layout map, considering the sensor map rigid. Furthermore, multiple parameters had to be chosen by the user: apart from the maximum distance between corresponding corners of the layout and sensor maps, the user had to choose on a per map basis the covariance associated with each correspondence, the minimum distance between successive pose nodes, and the amount of deformation that could be applied to the layout map.
On the other hand, in the present work, the robot is able to find correspondences between corners without the need for a user chosen threshold by localizing itself in the layout map. Using the localization’s covariance to decide when two corners correspond to each other drastically reduces the number of wrong correspondences and removes the need for a user chosen threshold. Hence, our method enables robots to correct both the sensor and the layout maps during exploration and only depends on two user chosen parameters: the amount of deformation that can be applied to the layout map and the distance between each pose node. The general process employed is shown in Figure 1. Our method starts by localizing the robot in the layout map. The localization poses and their associated covariances are then used together with corners and walls, to create a graph-based SLAM formulation taking into account both sensor and layout map information. Finally, the resulting graph is optimized, merging information from the layout and sensor maps in one representation.
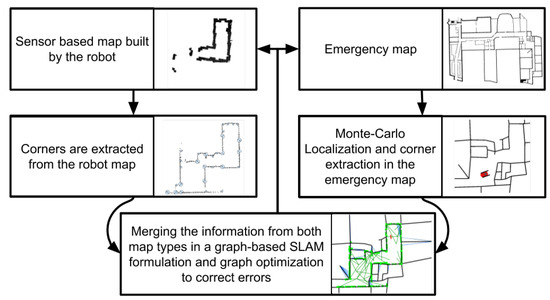
Figure 1.
Flowchart detailing the steps of our method. Information from both map types is extracted either during SLAM or by localizing in the emergency map. We build a graph-based SLAM formulation using the information extracted from the sensor and the emergency maps, and use graph optimization methods to correct errors in both the emergency and sensor maps.
Concretely, the novel technical developments presented in this paper, are:
- We adapt Monte-Carlo localization (MCL) in normal distribution transform occupancy maps (NDT-OM) to be able to localize the robot in a layout map with uncertainty in scale and detail level. Our version of the MCL filter localizes the robot in the emergency map while handling the layout map uncertainty, adapting the MCL sensor model to use the Euclidean distance instead of the -norm. It also uses a larger neighborhood of cells than a classic MCL implementation [4] when looking at how a laser scan fits the model map, hence adapting to the local scaling errors and missing information.
- A matching method for corners and walls from a layout map and a robot-built map, based on the -norm, and the MCL pose estimate in the emergency map. The matches found are used in the graph-based SLAM representation to merge information from both the sensor and layout maps into one consistent representation.
- A method to determine the orientation and angle of corners in NDT-OM. Those attributes are used to decrease the number of incorrect corner matches used in the SLAM-based graph representation.
To the best of our knowledge, the ACG method is the first method to exploit rough layout map information in SLAM while mutually correcting both the layout and the sensor-based maps.
3. Related Work
While most SLAM works assume that no prior information is available beforehand, this assumption is not always true. Indeed, getting prior information is easy in certain situations, thanks to emergency maps present in buildings, or online indoor maps. It can even be as simple as asking people to draw a map of an environment they are familiar with (see, Mielle et al. [5]). Hence, leveraging prior information for SLAM has been researched before and, when looking at previous research on the topic, one can observe that most works view the problem from one of two angles: either as a map matching problem, or as a localization task in the prior map given the sensor measurements.
3.1. Map Matching Approaches
Since the prior map and the sensor map are two representations of the same environment, viewing the problem as a map matching task is an intuitive idea. All works presented below assume a prior without errors and use the prior map to either introduce a correcting factor for SLAM, or directly complete the sensor map with new information.
For example, Freksa et al. [6] used schematic maps for robot navigation. Correspondences between the schematic map and the environment are found by matching corresponding corners. They tested their method on a simulated environment with three rooms. However, they assumed that the prior map has no defects and that data associations are correct, making the method too simple for emergency maps.
Gholami Shahbandi and Magnusson [7] aimed at aligning a prior map and a sensor map. They interpreted the prior map as a set of regions representing open spaces arranged together in a graph. A descriptor is created for each region and similar regions are associated with a corresponding transformation from one map to the other. A matching score based on the area of each region, and their common surface, is used to find the best transformation. Their method outperforms the state of the art and can correct errors in global scale. However, the prior is considered rigid and local scaling errors are not corrected. A more recent result by Shahbandi et al. [8] is able to use non-rigid registration for the sensor map using an objective function measuring the alignment quality during optimization. However, they correct local error in alignment of the sensor map by assuming that the prior is rigid, which does not work with emergency maps.
Other works integrate prior information while mapping the environment. Parsley and Julier [9] integrated planes extracted from Ordnance Survey MasterMap (https://www.ordnancesurvey.co.uk/business-and-government/products/mastermap-products.html) as constraints in a graph representation. To remove planes not corresponding to a plane found in the sensor map, they used gating, and then, matched corresponding prior and SLAM planes using RANSAC. The gating is done using a distance metric, assuming uniform scale and correct correspondences between planes from the prior and the sensor map. By contrast, we allow for the possibility that correspondences between the emergency and sensor maps are not always correct and can introduce errors in the graph.
Vysotska and Stachniss [10] matched maps from OpenStreetMap onto the robot scans to enhance SLAM. They use the robot position and ICP [11] to introduce a correcting factor in the error function used in the graph-based SLAM. While the method allows up to of error in orientation between the map and the robot’s heading for outdoor maps, it cannot correct an emergency map since its local scale may not correspond to the robot scans and ICP cannot deform the map.
Henein et al. [12] introduced meta-structural information represented by geometric primitives into the estimation problem of SLAM. They also analyzed their effects on the global structural consistency of the resulting map. Their formulation is limited to planar and orthogonal information and only considers priors without inaccuracies. Those assumptions do not hold with real maps.
Javanmardi et al. [13] presented a novel framework for automatic georeferencing of mobile mapping systems data in urban areas. Road markings are extracted from both an aerial image and the mapping system. Registration is done by overlapping sliding windows and representing road markings as normal distribution transform grids. They reported better results than using landmark updates. However, the method uses road markings for registration which is not applicable indoors.
3.2. Localization in Prior Maps
While the prior map can be used as a correcting factor for SLAM, it is also possible to perform localization in it. Indeed, prior maps are often very practical for such tasks: features are more salient than in sensor maps, they are less noisy since there is no sensor noise, and the topology of the map is typically accurate. On the other hand, depending on the type of prior used, the information represented might be out of date or might have scale errors.
Kümmerle et al. [14] used aerial maps as prior in a graph-based SLAM. They used edges in both map types and Monte Carlo localization to find correspondences between stereo and three-dimensional range data, and the aerial images. However, they assumed a constant scale in the aerial image, which we cannot do with emergency maps.
Biswas and Veloso [15] introduced a localization algorithm using down-projected planes of filtered points on to 2D. They assigned correspondences from each point to lines in a 2D prior map. Localization is done by creating for each particle an image of the scene visible to the robot, calculating the observation likelihood, and using corrective gradient refinement. Their algorithm outperforms three other approaches using simulated laser range measurements. However, no correction is applied to either the prior or sensor map, and a perfect prior is assumed, which does not hold for emergency maps.
Hanten et al. [16] proposed a localization method for indoor navigation using vector-based CAD floor plans and adaptive Monte-Carlo localization (AMCL). For fast operation, they used a line visibility look-up table. They compared their method to AMCL using occupancy grid maps generated from discretized floor plans. They showed better accuracy, lower memory usage, and less computation than when using occupancy grid maps for large-scale environments. However, their method cannot take in account uncertainty in scale or details of the CAD maps.
Boniardi et al. [17] presented a localization that uses CAD floor plans as prior for SLAM. They used localization alone if enough associations between the scans and the floor plan can be obtained in the vicinity of the robot, otherwise, they used full pose-graph optimization. They reported better localization results than with Monte-Carlo localization (MCL) on seven datasets. Although they could handle some clutter in the environment, the paper states that “significant or even full occlusion due to clutter or large installations has a substantial effect on the method”. On the other hand, our method is able to handle large inaccuracies in the prior map. While their method uses the prior for localization and completes the sensor map by adding scan information as an overlay, our method is able to correct both the robot and prior map.
Salehi et al. [18] used deep learning to find walls and other semantic information about the environment. They injected the result into a bundle adjustment process, constraining a 3D point cloud to texture-less 3D building models. The deep learning model is based on features extracted from 3D structures that one cannot find in emergency maps.
Kim et al. [19] performed localization in a map representing the outline of buildings. They used image processing to extract the outline and performed localization using mutual information between the point cloud and the outline map, and an extended Kalman filter. While the final robot trajectory was closer to the ground truth than dead reckoning, their method needs an accurate prior map and does not correct errors in the mapping.
4. Graph Based SLAM with a Layout Map as Prior
Most previous works use prior information to enhance SLAM by assuming metrically accurate priors [6,9,10,12,14], e.g., aerial images or CAD drawings, or are able to handle some inaccuracies in the prior map [7,17]. However, they do not correct both the prior and the sensor map, even though both map types can suffer from inaccuracies. Correcting the prior is useful for the user as they are often easier to interpret than the sensor map. On the other hand, having a more accurate sensor map may lead to faster and safer navigation of the robot in its environment.
The two goals of our work are: to implicitly use the alignment of walls in the layout map to correct errors due to drift or bad registrations in the sensor map, and to correct local scale inaccuracies and missing information in the layout map. We build a graph-based SLAM representation, where sensor information is associated with the prior map via joint features in the two maps. Then, through optimization of the graph, errors in the sensor map and inaccuracies in scale or information in the layout map are corrected to create one coherent world representation. Those errors can be due to drift or incorrect loop closures in the sensor map or missing information in the layout map, such as newly added walls or rooms. Since the graph enables the robot to automatically complete and correct errors in its map, we will refer to it as the Auto-Complete Graph (ACG). The ACG formulation with elements from the sensor map, the layout map, and the data association can be seen in Figure 2. Each pose node corresponds to a robot pose in the environment and stores a local metric submap of the environment. They are represented by orange triangles in Figure 2 and Figure 3. The landmarks found in the submaps are represented by the green squares and the prior map is shows in black. A more detailed description of the graph, and how to build it, is provided below.
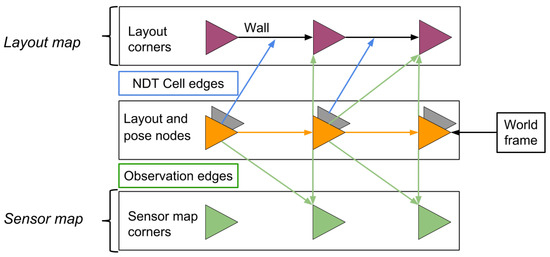
Figure 2.
The Auto-Complete Graph formulation developed in our work. The sensor map and the layout map are merged into one graph representation. Pose nodes are given by the SLAM done using the robot’s sensors (see Section 4.1) and corresponding layout poses are given by the localization (MCL filter) in the layout map (see Section 4.2). Corner nodes in the layout map are connected together by edges along the walls of the map and the corresponding layout and pose nodes are used to find correspondences between layout corners and sensor map corners (see Section 4.3). For each pair of corresponding layout and sensor map corners, the observation edge between the pose node and the sensor map corner is copied between the pose node and the layout corner. Furthermore, an NDT cell edge is added between each wall in the layout map and NDT cells in the sensor map that might correspond to the wall according to the localization. Corner nodes in the sensor map are connected with pose nodes as in a standard pose-graph framework.
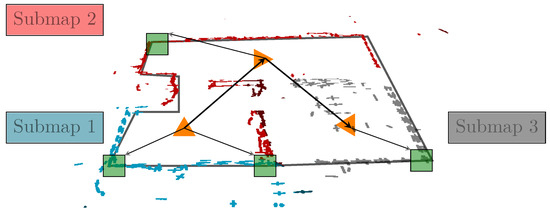
Figure 3.
Three sensor built submaps with their associated robot pose in orange and corners in green. The layout map is shown in black under the submaps.
In the following section, the ACG creation process and optimization is described in four steps: mapping and extraction of the sensor map’s information in Section 4.1, extraction of the information given by the layout map in Section 4.2, matching of the information from both maps in Section 4.3, and, finally, optimization of the ACG in Section 4.4.
4.1. Mapping and Corner Extraction in NDT Maps
We use normal distribution transform occupancy maps (NDT-OM) [20] to represent the environment explored by the robot. NDT is a cell based representation where the local surface in each cell is represented by a Gaussian. NDT allows for efficient scan registration [21,22], planning [23] and localization in both 2D and 3D, and makes it easy to extract salient corners [1]. NDT-OM additionally represents free-space information and allows for dynamic map updates. For each new scan, we iteratively construct an NDT-OM by registration of the scans onto the previously built map.
Each pose node in the ACG stores an NDT-OM submap of the environment. While it would technically be possible to use the robot poses from each incoming scan in the ACG, this is computationally too expensive to do for long exploration times. Hence, the number of poses in the ACG is maintained sparse during exploration by using a user-chosen distance threshold to decide when to save a robot pose in the ACG. Every time a robot pose is added in the ACG, the current NDT-OM submap is associated with it, and we start building a new NDT-OM. Between successive robot poses, virtual odometry edges are added to the ACG by registering the NDT-OM submap to the previous one using the method described by Stoyanov et al. [24]. In Figure 3, one can see three submaps in blue, red, and gray, with their associated robot poses for one dataset (see Section 5). It should be noted that the user-chosen distance threshold depends on the application of the robot. Indeed, using a small distance threshold creates small submaps and a graph with many robot poses. The corresponding graph will need more optimization cycles, but, keeping in mind that each submap is considered intrinsically rigid, errors in the sensor map can be corrected on a small scale, depending on the size of the submaps. On the other hand, a large distance threshold will create larger submaps and a sparser graph that will be easier to optimize. However, the ACG will only be able to correct large errors in alignment between submaps. In the experiments of Section 5, we use a distance threshold of m between each submap.
To find correspondences between the layout map and the sensor map, we need features common to both map types. Since the layout map represents the walls in the environment, we extract walls and corners as common landmarks: corners in the layout map are salient and easy to extract since walls are typically drawn clearly. In NDT-OM, we find corners by identifying neighboring Gaussians with a collision angle between and , as described in our previous work [1]. The main eigenvectors of each Gaussian are used to find the corner position. However, as seen in our previous work, only having the position of corners is not enough to obtain good correspondences: using a fixed (user-defined) radius for corner association yields many false associations in the graph. While using the Huber kernel and DCS in tandem was robust enough to deal with up to 70% false matches [1], the radius parameter had to be manually chosen on a per-map basis. In our work, we reduce the number of wrong associations by using corners’ orientations and widths, as illustrated in Figure 4. We also remove the distance threshold for creating correspondences in Section 4.3. The algorithm to find corners and their attributes is described in detail in Algorithm 1.
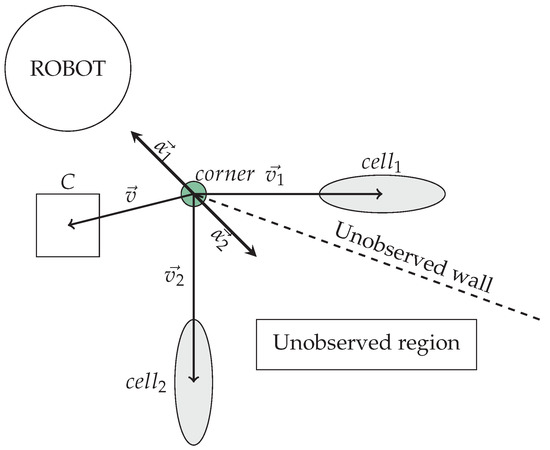
Figure 4.
Illustration showing the two possible orientations and of a corner given by two Gaussians. Since a wall is hidden behind the corner, the robot must consider the position from which it observed the robot. Hence, using observed free cells facing the corner, such as C, the correct orientation can be extracted.
| Algorithm 1: Algorithm to find corners and their attributes around a cell in an NDT-OM map. |
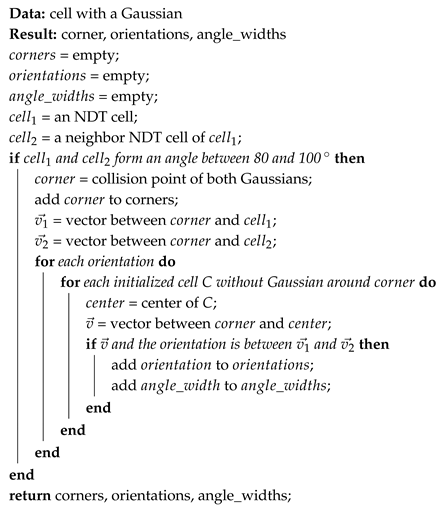 |
For each corner, we compute its orientation as the mean of the vectors and going from the corner’s position to the center of each Gaussian from which the corner was extracted. The associated angle width is the angle between and . However, as shown in Figure 4, each corner has a minimum of two possible orientations, and , with R the rotation matrix corresponding to a rotation of , and two possible widths, and . When looking at Figure 4, one can see that the robot has not observed . However, a wall is hidden behind the corner and is an incorrect orientation for the corner. Thus, only and were observed and should be saved as attributes. Hence, the orientation and width of a corner can only be known with certainty if the region facing the corner was observed by the robot. In NDT-OM, free observed space is represented by free cells in the map; hence, the sides from which the robot has observed a corner should face free cells in its direct neighborhood in the NDT-OM map. Concretely, if the vector between the corner and a free cell C and an orientation are both between and (or and , respectively), then is a valid orientation. See Figure 4, where using the free cell C, is valid but is not.
An example of an NDT-OM map and all extracted corners, orientations, and angle’s widths is shown in Figure 5. One can see that some corners were extracted on what seems to be straight walls. However, it should be noted that if the map’s resolution allows it, corners will be extracted for small details in the environment, such as door frames.
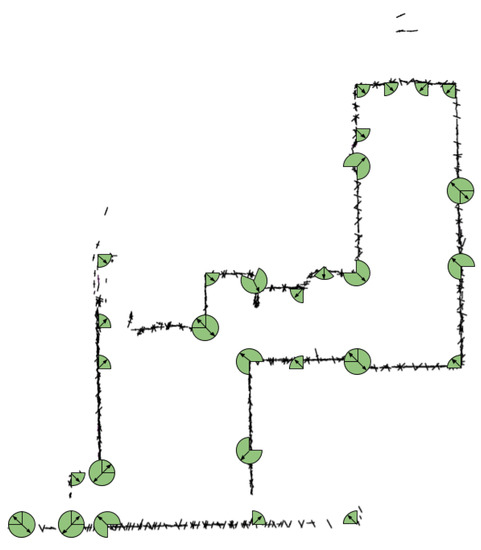
Figure 5.
NDT map with all corners, and their orientations and widths. Some corners are detected along walls either due to noise in the measurements or details on the walls such as door frames.
Every corner is added in the ACG as an NDT corner node. Since the submaps are considered rigid, the covariances of observation edges (connecting submap nodes and corners from the NDT-OM) are assigned a small standard deviation, hence allowing only for small movements of landmark nodes around their respective pose node and strongly preserving the rigidity of the submaps. We used m along the and axis.
All elements from the sensor map added to the ACG are visible in Figure 3, where the corners in the environment with their observation edges are represented in green.
4.2. Feature Extraction and Robot Localization in the Layout Map
We aim at merging the information seen by the robot and its sensors with the information given by a rough layout map, and focus on using emergency maps. Interpreting emergency map symbols is outside the scope of this work (one should mention the work of de las Heras et al. [25] and Ahmed et al. [26], who interpreted the different elements of a layout map and whose work could be used to solve that preprocessing step). In our work, we converted the emergency maps by hand to a layout map representing only the walls in the environment. Since corners and walls are common features, we extracted them in the layout map using a line follower algorithm [1]; each wall is approximated by a straight line between its two corners. The covariance associated to each wall is determined as in our previous work [1]: we use as the main eigenvector for the covariance of the main axis of the wall and we assign a small length of m to the second perpendicular eigenvector. Hence, the walls in the layout map will easily extend or shrink but will be hard to rotate. The amount of deformation allowed on the layout map depends on the user chosen parameter n. In our work, we use .
We estimate the position of the robot relative to the layout map by performing Monte-Carlo localization (MCL) on each incoming scan. The MCL algorithm is based on the method presented by Saarinen et al. [4]. However, we extend it to take into account local uncertainties of the layout map, such as local scaling errors, missing elements of the environment, or errors in representation or perspective. The MCL filter populates the space with a certain number of possible poses, or particles. For each particle, incoming laser scans are scored against the layout map, and, as more laser scans are received, particles that fit the incoming data better are given a higher probability, and consequently have a higher chance of being resampled for the next iteration. In time, the particles for which the incoming data fits the layout map best will have the highest probability. Hence, the population of particles will tend to focus around the true robot pose.
The algorithm presented by Saarinen et al. [4] assumes a correct model map. Thus, for each cell of the input scan seen from a given particle, the score is the likelihood that two NDT cells are the same, calculated using the norm only if a cell with a Gaussian is present at the same place in the model map. Cells further away are ignored and the norm is used to reduce the effect of outliers in otherwise correctly matching scans and model maps. On the other hand, the norm is not adapted for maps with large uncertainties: it is a function of the distance between the mean of the NDT cells and the product of their Gaussians:
with and the covariances of both NDT cells, and the vector between their centers. Hence, if the product of the Gaussians is small, a very small distance between the NDT cells’ means is enough to get a large norm value. In rough model maps, uncertainty in the representation would be enough to get very high norm, lowering the score of correct particles. Hence, the pose and covariance returned by the MCL filter would ignore all scale or detail inaccuracies in the layout map.
However, the sensor model used by the MCL filter needs to take into consideration the uncertainties in representation of the layout map. Instead of the standard NDT-MCL sensor model, we use the Euclidean distance between the means of two NDT cells, and calculate the final score as:
where s is scaling the likelihood that both cells are the same so that every distance from 0 up to the neighbor size is returning a score between and 1. Hence, s is expressed such as:
with n a user chosen parameter determining the size of the neighborhood considered given in meters and r the resolution of the map. For every Gaussian in the input scan, if no cell with a Gaussian is present at the same position in the layout map, we consider a neighborhood of cells of size n in the layout map. In that case, the final score is the mean score of all neighboring cells. Since cells further away have a lower score than a cell nearby, one close cell in the layout map will have more influence than the mean score of a neighborhood of cells.
To initialize the MCL filter, we assume that the robot has an approximation of the scale of the emergency map and knows its approximate starting point in the layout map. Those are not strong assumptions as, in operation, the first responders are usually aware of the position from which the robot starts its exploration in the layout map. Furthermore, emergency maps are semi-metric maps and thus provide a scale between the map and the environment. The space around the robot start pose is populated with particles using a Gaussian probabilistic distribution for the position, while the angle of each particle is kept the same as that of the starting pose. Hence, the first robot pose added in the ACG corresponds to the approximate starting pose of the robot in the layout map. The accuracy of the starting pose should be good enough for the MCL filter to converge to the correct pose in the layout map, i.e. the population of particles should focus around the true robot pose after a couple of particle resamplings. Hence, the accuracy of the starting point in the layout map depends on both the initial covariance of the MCL filter and on the layout map’s ambiguity in representation. In our work, the robot pose in the emergency map was given by the user through a graphical interface displaying the emergency map (see Figure 15). Furthermore, the user could use the interface to approximate the scale of the layout map by clicking on a point in the layout map coordinate frame and then clicking on its equivalent point in the sensor map coordinate frame. In the experiments described in Section 5, the initial pose was set with an initial pose covariance estimate of 0.5 m, which was sufficient for convergence of the filter.
4.3. Map and Corner Association
Now, the robot has a representation of the environment given by its sensors and it knows an estimate of its position in the layout map. It needs to merge both types of information into one representation to obtain a meaningful model of the environment.
In the ACG, each pose node obtained from SLAM in the sensor map has an associated layout node, and for each of those pairs, there is one associated submap. The pose node is the reference pose of the submap, relative to the world frame, while the layout node is the equivalent pose estimate in the layout map given by the MCL filter. Since the pose node and layout node represent the same pose in space, we can position the submap relative to the layout map. We associate corners depending on their similarity and a distance measure based on the MCL covariance, as illustrated in Figure 6. We only consider matching corners with a difference in angle width and orientation of less than . Then, we calculate the Mahalanobis distance between both corner’s positions:
with the vector between both corners and the MCL covariance. Since Equation (4) expresses the Mahalanobis distance between two corners observed from the MCL pose estimate in the layout map with covariance , we assume that each corner is associated with a covariance . Hence, the MCL covariance in Equation (4) is doubled. To account for noise, we only want to create a correspondence between corners if the likelihood is inside the probability contour. The solid ellipsoid that satisfies
provides the confidence region containing of the probability mass, where is the chi square distribution with p degrees of freedom. Since we want the probability contour and the upper point of the chi-square distribution with 2 degrees of freedom is , we only need to have:
to create a correspondence edge between a robot pose and a corner from the layout map. This correspondence edge is the same as the observation edge between the robot pose and the NDT corner so that, during optimization, the ACG minimizes the distance between both corners compared to the robot pose.
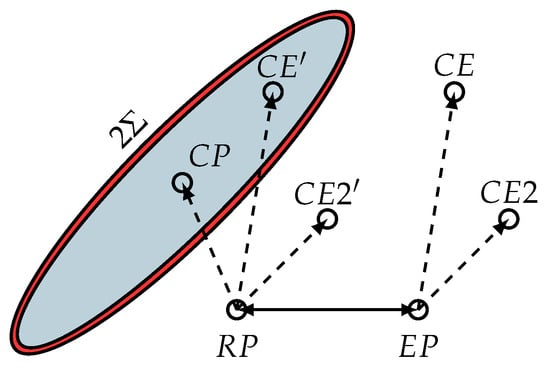
Figure 6.
is the robot pose, is the equivalent pose in the emergency map, is a corner in the submap, and are corners in the emergency map, and and are equivalent to and if they were observed from with . The blue part of the covariance corresponds to of the probabilities while the red part corresponds to the remaining . In the example above, would be associated with , while and would not be associated.
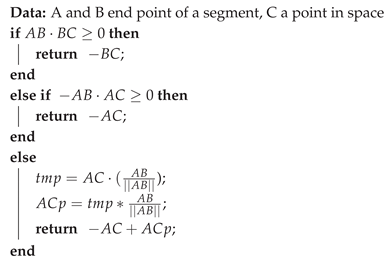
However, the above method depends on the presence of corners in the environment. The assumption that there are corners may not hold in cluttered environments, for example, in emergency scenarios where walls might have collapsed and corners may have vanished. On the other hand, the localization in the layout map still enables us to infer the position of the robot without necessitating corners. Since the input laser scans are used to estimate the position of the robot in the layout map, our assumption is that at least sufficiently many NDT cells of the submap fit the layout map walls, when centered on the layout-map pose estimation. To find the NDT cells corresponding to walls in the layout map, for each NDT cell in a submap and each wall in the layout map, we calculate the closest point on the layout map wall to the NDT cell’s mean. Then, we create an NDT-cell edge between the robot pose and the wall if the Mahalanobis distance, expressed as in Equation (4) with the vector between the NDT corner’s center and the closest point on the wall and the MCL covariance, is less than , as in Equation (6). The error function associated to those edges corresponds to the shortest vector from the NDT cell’s mean to the layout map wall segment (see Algorithm 2). Hence, NDT-cell edges correct the prior map by constraining NDT cells to close-by wall segments, without imposing anything about their position on the segment.
| Algorithm 2: Algorithm returning the shortest vector from a point to a segment. |
 |
4.4. Graph SLAM Optimization
Once a new robot pose, with its associated submap, and all associations between corners of the layout and sensor maps have been added to the ACG, the ACG is optimized to reduce errors in the graph. As presented by Mielle et al. [1], we use a combination of robust kernels: first, a Huber kernel followed by Dynamic Covariance Scaling [2,3]. However, instead of using a fixed number of optimization iterations for each kernel, we optimize the ACG using each kernel until either the error in the graph is under m or we have reached 500 iterations. Once the ACG has been optimized using both kernels, the current optimized layout map is converted to an NDT map and used as the model map of the MCL filter for subsequent localization in the layout map.
5. Experiments
Since emergency maps are not available with any standard SLAM dataset, we recorded three datasets from three different locations, with available emergency maps, and evaluated our method on those datasets. The first dataset we used was recorded at Örebro University and is available online [27]. The second dataset [28] was recorded at the University of Hannover. The third dataset [29] is a short run at the fire house of Dortmund, recorded as part of the Smokebot project (http://smokebot.eu/). Each dataset was recorded using a Taurob tracker robot (http://taurob.com/produkte/ugv-taurob-tracker/). Emergency maps of all environments are available with the public implementation of our code (https://github.com/MalcolmMielle/Auto-Complete-Graph).
The ACG method can be run either online, optimizing the graph every time a submap is added, or offline, optimizing the graph after exploration. Those two situations represent two different use cases: a user might want to build the best possible map using the prior during operations, or they might want to integrate the prior map in an already existing sensor map. It should be noted that optimization after exploration is more robust than running the optimization online, since the ACG method can take into consideration the whole environment. Indeed, when running the ACG method online, optimization can happen when only a partial view of some elements of the environment is available. Since a partial view is often not a good description of the environment it may lead to wrong optimization results. This is especially true around the ends of walls since limited noisy measurements can lead the ACG method to believe a prior wall should be bent to fit the partial data, as illustrated in Figure 7. A possible solution to this problem would be to use an algorithm to interpret the environment and its regions, as presented in our previous work [30], and add in the ACG information about a region only when the region has been fully explored. We leave this for future work.
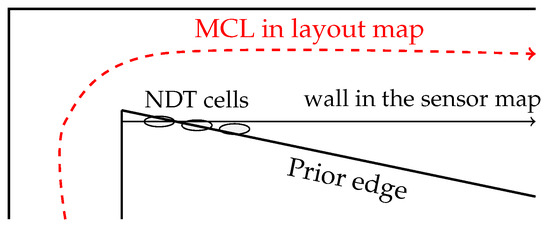
Figure 7.
Illustration of a situation where optimization will increase the error due to partial observations. The prior edge is moved to fit the partial data, moving it away from the actual wall in the sensor map. It is unlikely that the ACG will recover from this error since the prior edge is now too far away from the sensor map and the localization will probably follow the other prior edges since they fit more the sensor scans.
A qualitative look at the final maps showed the emergency maps to be correctly merged with the sensor maps for all datasets, apart from failures due to wrong matching of partial data as described above. One can see in Figure 8, for each dataset we recorded, the initial emergency map and the final ACG representation where the information from the emergency map and the sensor map are merged together. After optimization, inaccuracies in scale or representation of the emergency map were corrected. This is especially visible in Figure 8d where the emergency and sensor maps are very closely matched: the top left corridor was elongated and straightened to match the data provided by the sensor map, correcting errors in local scale. At the same time, the ACG method proved to be robust to differences in the level of information between both map types. In Figure 8e, even though the right corridor mapped by the robot has a lot of details, the ACG correctly matched it on the simpler layout map. Thus, by being able to correct most inaccuracies in local scale and being able to handle different levels of information between both map types, the ACG method smoothly completed the layout map with the more complex information of the sensor map. When looking at the green ellipse in Figure 8f, one can see that a part of the environment, which is not represented in the prior map, was added at the correct position while the walls on the room were scaled to fit the new information. Finally, errors due to bad registration of submaps were reduced and sometimes even entirely corrected, as visible in Figure 9.
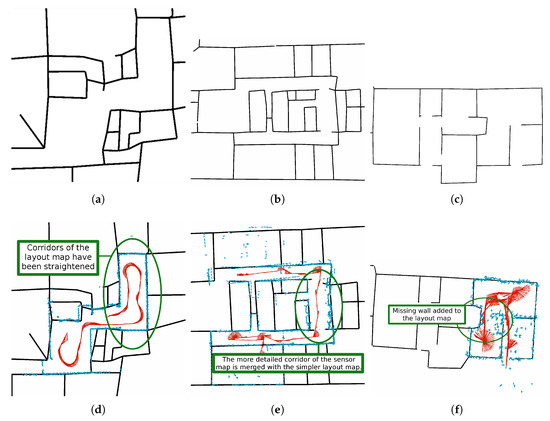
Figure 8.
On the top row are the processed emergency map used a priori. The bottom row shows results after online optimization: the sensor map is in blue and the emergency map is in black. In red is the MCL trajectory in the emergency map. (a) Örebro university emergency map. (b) Hannover university emergency map. (c) Dortmund firehouse emergency map. (d) Errors in the emergency map have been corrected during the optimization. It is especially visible for the walls in the green ellipse. (e) While the submaps in the top corridor suffer from drift in the registration, the emergency map is correctly matched onto the robot build map. Furthermore, the ACG correctly matched the detailed right corridor on the simpler layout map. (f) The emergency map of the Dortmund dataset is incomplete with a wall missing (visible in the green ellipse). It was taken into account and added in the final representation given by the ACG.
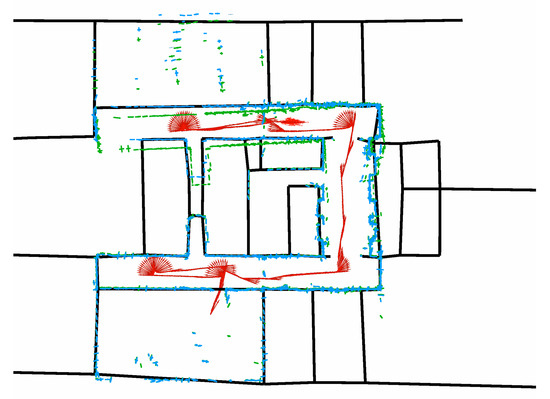
Figure 9.
Result of offline optimization of the Hannover dataset. In green is the map built without prior knowledge, while in blue is the sensor map after optimization against the prior map. In red is the mean of the MCL filter in the prior map during the exploration. One can see that error of orientation in the top corridor due to bad odometry has been corrected by the prior map.
The Hannover dataset was particularly challenging. Due to the long corridors of the environment, submaps with only partial information about a corridor would often be created and added in the ACG. In those conditions, the optimization of the ACG would frequently result in deformations of the layout map, such as bent walls that would not correspond to the environment. Furthermore, the odometry in rotation of the robot was very inaccurate. The ACG method had to be either run offline after exploration of the whole environment or had to be restricted so that optimization would occur only when all explored corridors were at least partially explored. When looking at Figure 9, one can see that the top corridor of the sensor map, in green, is bent due to errors introduced by the bad odometry of the robot. However, the bending in the sensor map of the ACG optimized offline after exploration (in blue) was corrected by the prior map. On the other hand, this correction was only partially done when using the ACG method online, as shown in Figure 8e. Indeed, since the submaps do not cover much of the corridor at optimization time, the prior corridor was gradually bent during exploration to fit the sensor map, the ACG considering the error in drift to be a local scale error of the prior instead.
5.1. Robustness
To show that using a prior emergency map can correct drift and registration errors in the sensor map, we also ran the ACG method on the Örebro University and Dortmund datasets with different amount of noise added to the odometry.
We aimed at showing that the ACG method is robust to large errors in odometry propagated in the graph. Hence, we built an ACG over a full robot run without optimizing the graph. We then added of noise in position and rotation to each odometry edge, with n ranging from 10 to 90. To do so, we calculated the length and angle of each odometry edge, and applied Equations (7) and (8) to it, with f randomly equal to either or . With t the translation vector of the odometry and its angle:
We increased the covariances associated with each odometry edge to reflect the uncertainty added by the noise applied between the robot poses.
Once the full noisy graph has been built, we run the optimization and calculate the difference of both the ACG pose nodes before and after optimization, to the equivalent SLAM poses without noise. We ran the test over the Örebro and Dortmund datasets and the results are summarized in Figure 10. After optimization, the sensor map was corrected by the emergency map compensating the influence of the odometry noise. As one can see, even with up to of noise added on the odometry edges, having the prior enabled the ACG method to correct most of the odometry noise. Indeed, the maximum error in translation over all submaps is m at of noise in the Örebro dataset, while the maximum error in rotation is rad at of noise in the Dortmund dataset. As an example with of noise, one can see in Figure 11a the noisy submaps overlaid on the prior before optimization and the resulting map after optimization in Figure 11b. It should be noted that, when the noise in the odometry was above , the prior was not always correctly fitted and some walls would be incorrectly matched or bent. However, the errors in the odometry edge were still corrected up to of noise, as visible in Figure 12 on both the Örebro and Dortmund datasets.
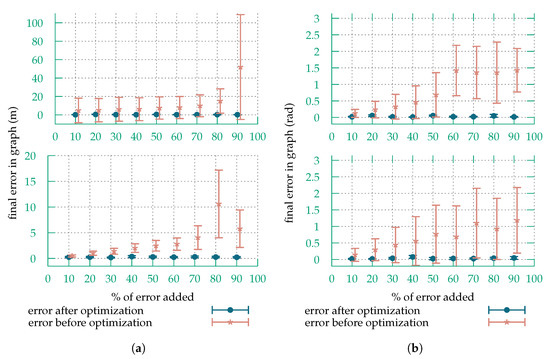
Figure 10.
Error in translation and rotation with different noise percentages added on the odometry edges. One can see that, for all tested measures, the ACG was able to correct the errors. However, at of noise, while the errors in odometry were corrected, the prior map was not correctly merged with the sensor map. (a) Error in translation for the Örebro dataset (top) and the Dortmund dataset (bottom). (b) Error in rotation for the Örebro dataset (top) and the Dortmund dataset (bottom).
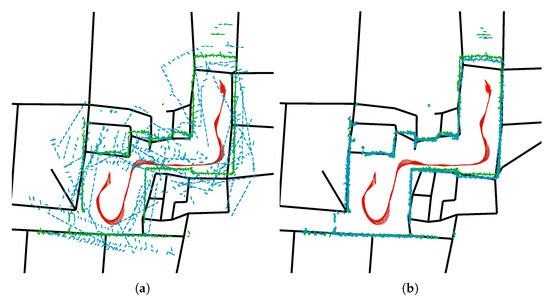
Figure 11.
The ACG with noise added to odometry edges before and after optimization, on the left and right images, respectively. The NDT-OM submaps associated with each SLAM poses without noise are in green, the noisy NDT-OM submaps before and after optimization are blue, and the layout map is black. One can see that both the layout and the NDT-OM submaps are optimized in one globally consistent representation. (a) Before optimization, there is 40% of noise in the odometry edges between the NDT-OM submaps. The NDT-OM submaps are distorted in translation and rotation. (b) After optimization, the environment is recognizable and the noise in the odometry edges was greatly reduced. The layout map was also fitted on the corrected sensor map.
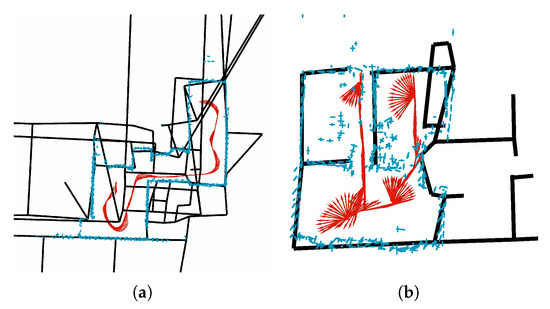
Figure 12.
Even with of noise in the odometry measurements between the submaps, in blue, the noise has been almost entirely corrected after optimization. However, the prior map has been distorted by the high amount of noise. (a) Örebro. (b) Dortmund.
5.2. Runtime Performance
The experiments were run on an Intel i7-4712HQ at 2.30 GHz with 16 GB of RAM. The average feature extraction and optimization times depending on the number of nodes, for all datasets, are shown in Figure 13. One can see that the optimization time stays under 7 s at all times, and with most cycles under 3 s.

Figure 13.
Times needed to extract all features, add them in the ACG, and optimize, depending on the number of nodes in the graph. Times are all under s and most are under s. This allows for online use of the algorithm. Indeed, the optimization is only run for every new NDT-OM and SLAM pose added in the ACG, and during exploration, the robot usually takes more than s before returning a new SLAM pose and NDT-OM.
As presented in Section 4.4, the ACG is optimized using a combination of two robust kernels: the Huber kernel and DCS. In Figure 14, one can see the number of iterations needed by each kernels before reaching stability depending on the number of nodes in the graph for the Örebro and Dortmund dataset while running the ACG method online. The number of iterations always stayed under 9, while being most often under 4. Indeed, since the graph is optimized online, it does not always need to correct many errors since the maps might already be aligned. For example, a corridor of the layout map might already have been aligned and new corners will not need much optimization since they will already be at the correct place.
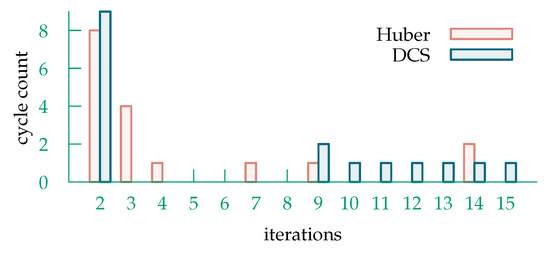
Figure 14.
Number of iterations of each kernel, over the datasets on which the algorithm was run online: the Örebro and Dortmund datasets. One can see that the number of iterations stays low, always under 9.
5.3. Field Tests
The dataset recorded in Dortmund was part of a larger set of field tests in Dortmund as part of the EU project Smokebot. The Dortmund fire house is a place were firemen train to work in situations of smoke or fire. A picture of the robot and the control interface is visible in Figure 15. To make the situation similar to an emergency scenario, smoke was at times present in the environment, resulting in corrupted measurements from the laser range scanner. To take in account corrupted measurements, we used the sensor fusion algorithm developed by Fritsche. et al. [31] to fuse scans of the laser range scanner and the radar sensor presented by Nowok et al. [32]. Using the fused scans, the robot was able to map the environment in smoke even with noisy sensor measurements. The noise in the measurements was mainly due to the multiple reflections of the radar created by the metal walls (see Figure 16).
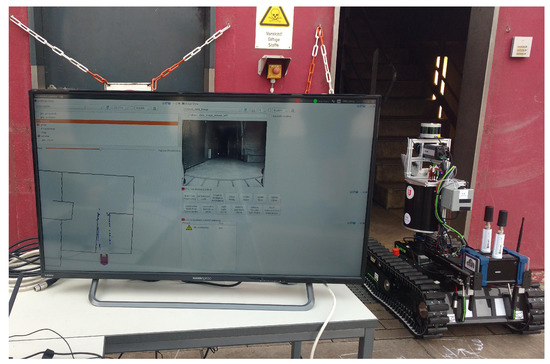
Figure 15.
Taurob tracker during the field tests in Dortmund. The interface used to control the robot is visible in the center of the image. One can see the prior map used to give the position points of interest to the robot.
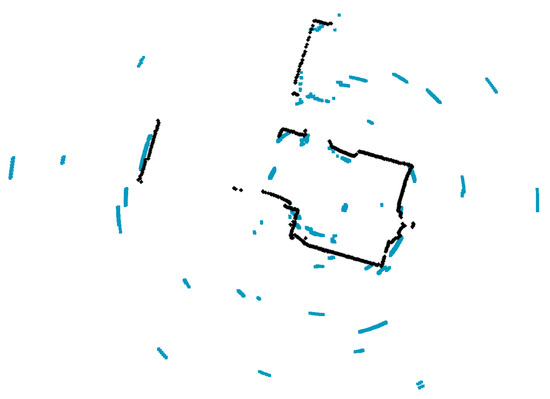
Figure 16.
A laser scan from the laser range scanner in black with the corresponding radar scan in blue. The multiple reflections from the radar are due to the metal walls of the environment. In the case of smoke, since laser scanner measurements are not available, the noisy radar measurements were used instead.
The map representation provided by the ACG to the user showed the optimized emergency map and the sensor map as an overlay. ACG optimization was carried out online and used for teleoperation and autonomous navigation of the robot. Users were able to send the robot to a particular position of interest before any exploration from the robot took place. The robot would then complete and correct the emergency map, correcting errors in scale and adding missing information, while navigating to the point of interest: in Figure 8f, a missing wall in the emergency map was added by the mapping. No failure in reaching the goals was observed but it should be noted that the environment explored was quite small.
Having a prior layout map helped speeding up operations. There was no need to have any expert or person familiar with the environment to start the exploration: the layout map was enough for the user to give commands to the robot before the SLAM took place.
6. Summary
This article presents the Auto-Complete Graph (ACG) method, which is a formulation of graph-based SLAM that enables a robot to merge a sensor map and a layout map into one consistent representation of the environment, while correcting errors in both map types. To the best of our knowledge, this is the first method exploiting prior map information in SLAM while mutually correcting both the prior and the sensor-based maps. A modified sensor model for Monte-Carlo localization (MCL) in uncertain maps enables the robot to localize in the rough layout map. Thanks to the pose estimate in the layout map, the robot can find accurate associations between corners and walls of the layout and sensor maps: the number of incorrect associations is reduced compared to our previous work, by using both the localization estimate and a novel way to extract corner orientations and widths in NDT maps. The correspondences are used to build a SLAM graph incorporating elements from each map type. Finally, the layout and sensor maps are merged while correcting errors in both maps by optimizing the graph built using those associations.
We tested our method on three datasets: two recorded in indoor campus environments and one on a field test session at a firemen training facility. We found that the sensor and layout maps were correctly merged together in all cases: missing information in the layout map was added, while errors due to drift in the measurement were corrected. We also tested the robustness of our method by adding noise between robot poses. The ACG method corrected the errors in odometry and merged the maps with up to of noise.
We further tested the ACG method in a field test where the layout map was used as a navigation and exploration interface. It was possible to send the robot to points of interest with nothing other than the prior knowledge given by the emergency map and running SLAM from there.
Author Contributions
Conceptualization, M.M. (Malcolm Mielle) and M.M. (Martin Magnusson); methodology, M.M. (Malcolm Mielle) and M.M. (Martin Magnusson); software, M.M. (Malcolm Mielle); validation, M.M. (Malcolm Mielle); writing—original draft preparation, M.M. (Malcolm Mielle); formal analysis, M.M. (Malcolm Mielle); investigation, M.M. (Malcolm Mielle); resources, M.M. (Malcolm Mielle); data curation, M.M. (Malcolm Mielle); writing—review and editing, M.M. (Malcolm Mielle), M.M. (Martin Magnusson) and A.J.L.; supervision, M.M. (Malcolm Mielle), M.M. (Martin Magnusson) and A.J.L.; project administration, M.M. (Malcolm Mielle); and funding acquisition, M.M. (Martin Magnusson) and A.J.L.
Funding
This work was funded in part by the EU H2020 project SmokeBot (ICT-23-2014 645101), the EU H2020 project ILIAD (ICT-26-2016 732737), and by the Swedish Knowledge Foundation under contract number 20140220 (AIR).
Conflicts of Interest
The authors declare no conflict of interest.
References
- Mielle, M.; Magnusson, M.; Andreasson, H.; Lilienthal, A.J. SLAM auto-complete: Completing a robot map using an emergency map. In Proceedings of the 2017 IEEE International Symposium on Safety, Security and Rescue Robotics (SSRR), Shanghai, China, 11–13 October 2017; pp. 35–40. [Google Scholar] [CrossRef]
- Agarwal, P.; Tipaldi, G.D.; Spinello, L.; Stachniss, C.; Burgard, W. Robust map optimization using dynamic covariance scaling. In Proceedings of the 2013 IEEE International Conference on Robotics and Automation, Karlsruhe, Germany, 6–10 May 2013; pp. 62–69. [Google Scholar] [CrossRef]
- Agarwal, P. Robust Graph-Based Localization and Mapping. Ph.D. Thesis, University of Freiburg, Freiburg, Germany, 2015. [Google Scholar]
- Saarinen, J.; Andreasson, H.; Stoyanov, T.; Lilienthal, A.J. Normal distributions transform Monte-Carlo localization (NDT-MCL). In Proceedings of the IEEE/RSJ International Conference on Intelligent Robots and Systems, Tokyo, Japan, 3–7 November 2013; pp. 382–389. [Google Scholar] [CrossRef]
- Mielle, M.; Magnusson, M.; Lilienthal, A.J. Using sketch-maps for robot navigation: Interpretation and matching. In Proceedings of the IEEE International Symposium on Safety, Security, and Rescue Robotics (SSRR), Lausanne, Switzerland, 23–27 October 2016; pp. 252–257. [Google Scholar] [CrossRef]
- Freksa, C.; Moratz, R.; Barkowsky, T. Schematic Maps for Robot Navigation. In Spatial Cognition II; Springer: Berlin/Heidelberg, Germany, 2000; pp. 100–114. [Google Scholar] [CrossRef]
- Gholami Shahbandi, S.; Magnusson, M. 2D map alignment with region decomposition. Auton. Robots 2018. [Google Scholar] [CrossRef]
- Shahbandi, S.G.; Magnusson, M.; Iagnemma, K. Nonlinear Optimization of Multimodal Two-Dimensional Map Alignment With Application to Prior Knowledge Transfer. IEEE Robot. Autom. Lett. 2018, 3, 2040–2047. [Google Scholar] [CrossRef]
- Parsley, M.P.; Julier, S.J. Exploiting prior information in GraphSLAM. In Proceedings of the IEEE International Conference on Robotics and Automation, Shanghai, China, 9–13 May 2011; pp. 2638–2643. [Google Scholar] [CrossRef]
- Vysotska, O.; Stachniss, C. Exploiting building information from publicly available maps in graph-based SLAM. In Proceedings of the IEEE/RSJ International Conference on Intelligent Robots and Systems (IROS), Daejeon, South Korea, 9–14 October 2016; pp. 4511–4516. [Google Scholar] [CrossRef]
- Besl, P.J.; McKay, N.D. Method for registration of 3-D shapes. In Sensor Fusion IV: Control Paradigms and Data Structures; International Society for Optics and Photonics: Bellingham, WA, USA, 1992; Volume 1611, pp. 586–607. [Google Scholar] [CrossRef]
- Henein, M.; Abello, M.; Ila, V.; Mahony, R. Exploring the effect of meta-structural information on the global consistency of SLAM. In Proceedings of the IEEE/RSJ International Conference on Intelligent Robots and Systems (IROS), Vancouver, BC, Canada, 24–28 September 2017; pp. 1616–1623. [Google Scholar] [CrossRef]
- Javanmardi, M.; Javanmardi, E.; Gu, Y.; Kamijo, S. Towards High-Definition 3D Urban Mapping: Road Feature-Based Registration of Mobile Mapping Systems and Aerial Imagery. Remote Sens. 2017, 9, 975. [Google Scholar] [CrossRef]
- Kümmerle, R.; Steder, B.; Dornhege, C.; Kleiner, A.; Grisetti, G.; Burgard, W. Large scale graph-based SLAM using aerial images as prior information. Auton. Robots 2011, 30, 25–39. [Google Scholar] [CrossRef]
- Biswas, J.; Veloso, M. Depth camera based indoor mobile robot localization and navigation. In Proceedings of the IEEE International Conference on Robotics and Automation, Saint Paul, MN, USA, 14–18 May 2012; pp. 1697–1702. [Google Scholar] [CrossRef]
- Hanten, R.; Buck, S.; Otte, S.; Zell, A. Vector-AMCL: Vector based Adaptive Monte Carlo Localization for Indoor Maps. In Advances in Intelligent Systems and Computing; Springer: Berlin, Germany, 2016; Volume 531. [Google Scholar] [CrossRef]
- Boniardi, F.; Caselitz, T.; Kümmerle, R.; Burgard, W. Robust LiDAR-based localization in architectural floor plans. In Proceedings of the IEEE/RSJ International Conference on Intelligent Robots and Systems (IROS), Vancouver, BC, Canada, 24–28 September 2017; pp. 3318–3324. [Google Scholar] [CrossRef]
- Salehi, A.; Gay-bellile, V.; Bourgeois, S.; Allezard, N.; Chausse, F. Large-scale, drift-free SLAM using highly robustified building model constraints. In Proceedings of the IEEE/RSJ International Conference on Intelligent Robots and Systems (IROS), Vancouver, BC, Canada, 24–28 September 2017; pp. 1586–1593. [Google Scholar] [CrossRef]
- Kim, J.; Cho, Y.; Kim, J. Vehicle Localization in Urban Environment Using a 2D Online Map with Building Outlines. In Proceedings of the 15th International Conference on Ubiquitous Robots (UR), Honolulu, HI, USA, 26–30 June 2018; pp. 586–590. [Google Scholar] [CrossRef]
- Stoyanov, T.; Saarinen, J.; Andreasson, H.; Lilienthal, A.J. Normal Distributions Transform Occupancy Map fusion: Simultaneous mapping and tracking in large scale dynamic environments. In Proceedings of the IEEE/RSJ International Conference on Intelligent Robots and Systems, Tokyo, Japan, 3–7 November 2013; pp. 4702–4708. [Google Scholar] [CrossRef]
- Magnusson, M.; Lilienthal, A.; Duckett, T. Scan Registration for Autonomous Mining Vehicles Using 3D-NDT: Research Articles. J. Field Robot. 2007, 24, 803–827. [Google Scholar] [CrossRef]
- Magnusson, M.; Vaskevicius, N.; Stoyanov, T.; Pathak, K.; Birk, A. Beyond points: Evaluating recent 3D scan-matching algorithms. In Proceedings of the IEEE International Conference on Robotics and Automation (ICRA), Seattle, WA, USA, 26–30 May 2015; pp. 3631–3637. [Google Scholar] [CrossRef]
- Stoyanov, T.; Magnusson, M.; Andreasson, H.; Lilienthal, A.J. Path planning in 3D environments using the Normal Distributions Transform. In Proceedings of the IEEE/RSJ International Conference on Intelligent Robots and Systems, Taipei, Taiwan, 18–22 October 2010; pp. 3263–3268. [Google Scholar] [CrossRef]
- Stoyanov, T.; Magnusson, M.; Lilienthal, A.J. Point set registration through minimization of the L2 distance between 3D-NDT models. In Proceedings of the IEEE International Conference on Robotics and Automation, Saint Paul, MN, USA, 14–18 May 2012; pp. 5196–5201. [Google Scholar] [CrossRef]
- De las Heras, L.P.; Ahmed, S.; Liwicki, M.; Valveny, E.; Sánchez, G. Statistical segmentation and structural recognition for floor plan interpretation: Notation invariant structural element recognition. Int. J. Doc. Anal. Recogn. (IJDAR) 2014, 17, 221–237. [Google Scholar] [CrossRef]
- Ahmed, S.; Liwicki, M.; Weber, M.; Dengel, A. Automatic Room Detection and Room Labeling from Architectural Floor Plans. In Proceedings of the 10th IAPR International Workshop on Document Analysis Systems, Gold Cost, QLD, Australia, 27–29 March 2012; pp. 339–343. [Google Scholar] [CrossRef]
- Mielle, M.; Magnusson, M.; Lilienthal, A.J. Örebro University Basement SLAM Dataset—Radar; Velodyne: San Jose, CA, USA, 2018. [Google Scholar] [CrossRef]
- Mielle, M.; Magnusson, M.; Lilienthal, A.J. Hannover University SLAM Dataset—Radar; Velodyne: San Jose, CA, USA, 2018. [Google Scholar] [CrossRef]
- Mielle, M.; Magnusson, M.; Lilienthal, A.J. Dortmund SLAM Dataset—Radar; Velodyne: San Jose, CA, USA, 2018. [Google Scholar] [CrossRef]
- Mielle, M.; Magnusson, M.; Lilienthal, A.J. A Method to Segment Maps from Different Modalities Using Free Space Layout MAORIS: Map of Ripples Segmentation. In Proceedings of the IEEE International Conference on Robotics and Automation (ICRA), Brisbane, QLD, Australia, 21–25 May 2018; pp. 4993–4999. [Google Scholar] [CrossRef]
- Fritsche, P.; Kueppers, S.; Briese, G.; Wagner, B. Radar and LiDAR Sensorfusion in Low Visibility Environments. In Proceedings of the 13th International Conference on Informatics in Control, Automation and Robotics—Volume 2: ICINCO; SciTePress: Setubal, Portugal, 2016; pp. 30–36. [Google Scholar] [CrossRef]
- Nowok, S.; Kueppers, S.; Cetinkaya, H.; Schroeder, M.; Herschel, R. Millimeter wave radar for high resolution 3D near field imaging for robotics and security scans. In Proceedings of the 18th International Radar Symposium (IRS), Prague, Czech Republic, 28–30 June 2017; pp. 1–10. [Google Scholar] [CrossRef]
© 2019 by the authors. Licensee MDPI, Basel, Switzerland. This article is an open access article distributed under the terms and conditions of the Creative Commons Attribution (CC BY) license (http://creativecommons.org/licenses/by/4.0/).