1. Introduction
Chronic wounds heal slowly, and ineffective treatment can further delay the healing process. To ensure appropriate care, clinicians require an objective method of assessing wounds to determine whether the current treatment plan is effective or needs to be adjusted. Accurate wound measurement and analysis is a critical aspect of managing chronic wounds, as changes in a wound’s physical dimensions or tissue composition indicate progress in healing. Wound analysis primarily involves contact and non-contact methods. Traditional contact methods, such as the use of alginate molds, transparency tracing, manual planimetry using rulers, and injecting color dyes, were once widely used but are often impractical for medical professionals and highly uncomfortable for patients. These techniques are also prone to inaccuracies, as they struggle to account for the complex shapes of wounds. Advances in computational power have significantly expanded the use of non-contact wound analysis. Additionally, progress in data analysis has driven the growing adoption of digital imaging for wound assessment for some time now.
Assessing wounds can be particularly challenging because wounds can theoretically appear anywhere on the body and can vary greatly in size and shape. Chronic wounds often exhibit a dynamic surface geometry due to their expansion or contraction during treatment. Consequently, certain areas of the wound may obscure others when viewed from specific angles. Capturing accurate 3D models of such wounds can be complex, requiring multiple phases and poses during the recording process. Using handheld 3D cameras or sensors for this task can be exhausting and imprecise, leading to incomplete or flawed 3D reconstructions. For this reason, an automated system that accurately reconstructs the wound as a 3D model, which can then be further analyzed and appropriate data extracted, could be very beneficial for monitoring the wound healing process.
This article describes a fully automated system for analyzing chronic wounds based on the use of a robotic arm and a precise industrial-grade 3D scanner and associated algorithm support for extracting and analyzing wound data. Parts of the system have been previously described and analyzed individually [
1,
2,
3], but since the publication of these studies, there have been numerous additions that extend the functionality and improve the robustness of the system for different types of wounds. The result is that the full interconnected system pipeline is now operational, and its positive or negative characteristics can be observed and discussed. Therefore, the contribution of this article includes the working pipeline of the fully autonomous robotic system for analyzing chronic wounds.
The rest of the paper is structured as follows. In
Section 2, a brief survey of related research is provided. In
Section 3, a system overview is presented.
Section 4 describes the wound detection and tissue classification subsystem, while
Section 5 describes the 3D reconstruction subsystem. The 3D segmentation and analysis of wounds is described in
Section 6, while the paper concludes with a discussion in
Section 7 and a conclusion in
Section 8.
2. Related Research
Although there is abundant research on the analysis of non-contact chronic wounds, most of these studies are based on 2D image analysis, where the aim is to segment and typically, to analyze, the composition of the segmented wound. A systematic review of 115 papers dealing with image-based AI in wound assessment was performed by Anisuzzaman et al. [
4]. They concluded that each of the approaches mentioned had some limitations and hence, no one method could be said to be preferable to the others. By far, the most popular methods implement deep neural networks. Since the wounds are often found on curved parts of the body, analyzing only single photos of them can incur errors in measurement [
5] and is therefore not viable if precise measurement is required and can only be used in the case of very flat wounds. Therefore, only the papers that employ the 3D wound model will be considered in the section on related research. Similarly, the focus will be on systems that provide some form of analysis or measurement of the reconstructed wound models.
In Ref. [
6], the authors use a pair of wound images taken from different viewpoints to create a 3D mesh model using multiple view geometry. Due to the technology and algorithms used at the time, the resulting 3D mesh had a low resolution, but modern approaches and photogrammetry can result in more realistic reconstructions of this type of approach. The research presented also includes an automatic wound segmentation using the JSEG algorithm and tissue classification using a support vector machine classifier. Lasers are frequently utilized in medical research for 3D reconstruction, where a laser line projection sensor combined with a calibrated RGB camera enables the creation of accurate, colorized 3D models. One of the first studies employing this approach was conducted by Derma [
7], in which researchers used the Minolta VI910 scanner to reconstruct wounds and applied semi-automated segmentation for wound segmentation and tissue classification. Similar studies [
8,
9] have also incorporated laser and RGB camera systems to reconstruct wounds and perform semi-automatic segmentation, allowing for the determination of geometric wound parameters. While these systems are highly precise, they are cumbersome and require manual operation, making them less user-friendly. Furthermore, they are limited to a 3D reconstruction from a single viewpoint, making them less viable for curved parts of the body.
The authors in Ref. [
10] utilized a U-Net model to perform an initial segmentation of the wound on 2D images and applied a structure-from-motion algorithm to reconstruct the 3D wound surface from a sequence of images. Reprojections of the 3D model were then used to refine the wound segmentation on both the 2D input images and the 3D model. Although this approach allowed them to measure the wound area, the accuracy of these measurements remains uncertain, as the ground truth was derived from models created using the same technique.
Automated robots for scanning and analyzing medical wounds are rarely utilized, and their adoption for this purpose has only recently emerged. Therefore, there are no developed systems for wound analysis that are entirely robot-driven, although a significant amount of robotic research is being developed in the health sector as a whole.
The authors in Ref. [
11] utilized a gantry-mounted 2-DoF (degree of freedom) robot equipped with a 2D camera and a laser range finder to generate a 3D point cloud for reconstructing the wound edge and topology. The ultimate goal was to develop a wound closure system. The system itself is largely agnostic to the object being scanned and performs a comprehensive scan of the entire region or model, without automatically detecting or focusing on specific areas. The researchers in Ref. [
12] designed a semi-autonomous robotic system aimed at improving trauma assessment. This innovative system incorporates a 7-DoF robotic arm paired with an RGB-D camera to construct detailed 3D reconstructions of medical models. Data collection is carried out through a preprogrammed sequence, where the robot-mounted camera moves in a semi-circular path 30 cm above the skin, capturing point clouds and 2D images at 21 specified positions. To enhance precision, the system employs an R-CNN model for identifying and localizing key anatomical landmarks, such as the umbilicus, as well as traumatic injuries like gunshot wounds. This enables more accurate targeting of FAST (focused assessment with sonography for trauma) scanning locations, ensuring optimal use of the integrated ultrasound probe. In Ref. [
13], the authors developed a method of robot wound suturing using a UR3 robot with an EndoWrist clamp, in which the wound is first detected using a deep neural network, which facilitates the determination of needle insertion points.
Recent studies involving robots for scanning procedures rely solely on pre-programmed behaviors for data collection. This approach may lead to inefficient use of resources and patient interaction time, as it lacks the flexibility to adapt to unique conditions or variations in the patient’s wound surface area. The developed system presented in this paper is fully autonomous, from wound detection and 3D reconstruction to segmentation and measurement at the end of the wound analysis process.
3. System Overview
In this section, a global overview of the system’s software and hardware components will be described, and the system flowchart can be seen in
Figure 1.
The wound analysis process consists of four main stages:
Wound detection and initial recording pose estimation;
Wound recording and 3D reconstruction;
Visual data (RGB images, detection masks, and tissue classification masks) projection estimation and 3D wound segmentation;
Wound measurement and analysis.
Prior to the initial stage and the start of the system, the user must perform the only manual action, which is to orientate the robot’s end effector in the general direction of the wound. Afterwards, and at the start of the process, the system takes an initial recording using the Kinova Gen3 vision module integrated into the robot arm, which provides RGB and depth images of the space in front of the end effector. The RGB image is then used by the wound detection and tissue classification subsystem to detect the wound, employing the associated depth image to determine position of the detected wound center. From the wound center position, an initial recording pose is determined perpendicular to the wound’s surface and at a given distance from the wound in order to facilitate an optimal recording distance for the used 3D scanner. In the second stage, the robot moves to the initial recording pose, and the wound recording and 3D reconstruction stage begins. In this stage, the system uses the 3D reconstruction subsystem to determine and acquire the minimum recording needed to fully reconstruct the wound area by utilizing a novel NBV (next best view) algorithm for determining the recording poses. The second stage concludes by providing a point cloud consisting of the recorded wound and its surrounding area, as well as all recorded RGB and depth images, with associated recording poses and detection/classification masks. The third stage begins with recoloring the input point cloud by reprojecting 3D points onto the acquired images and masks and estimating an appropriate recording sample for each individual 3D point. After the projection estimation is completed, a 3D mesh is created, and a wound segmentation is performed by the 3D implementation of the ACM (active contour model) algorithm, which finally cuts out the exact wound area from the surrounding healthy tissue. In the final stage, the required measurements are captured by calculating the perimeter of the cutout wound and its area using the summation of the areas of individual mesh triangles. The volume is calculated by creating a watertight mesh, while the percentages of tissue types is obtained by counting the number of individual tissue labels represented on a classification texture of the cutout wound.
The system uses a Kinova Gen3 arm, 7 DoF version, with an integrated vision module and an attached Photoneo Phoxi M 3D scanner, as can be seen in
Figure 2b.
Figure 2c depicts a 3D model of the used arm with a 3D scanner, as seen within the system’s software.
The software is run on a mid-range laptop with the Windows 10 operating system. The robot is controlled by MoveIt in an ROS Noetic distribution on a WSL2 Ubuntu 20.04 virtual machine. Data analysis and algorithm support are run in Windows, while communicating with ROS via an ROSBridge. The system was primarily developed in Python version 3.13.2, while some of the algorithms were implemented in C++ to obtain a better runtime.
In addition to testing the system several times in the outpatient clinic for vascular surgery of the clinical hospital center (
Figure 2a), the majority of testing was performed using two wound care medical models, the Seymour II wound care model and the Vinnie venous inefficiency leg model, as seen in
Figure 3. Both models are made by Vata Inc. (Canby, OR, USA) [
14].
4. Wound Detection and Tissue Classification
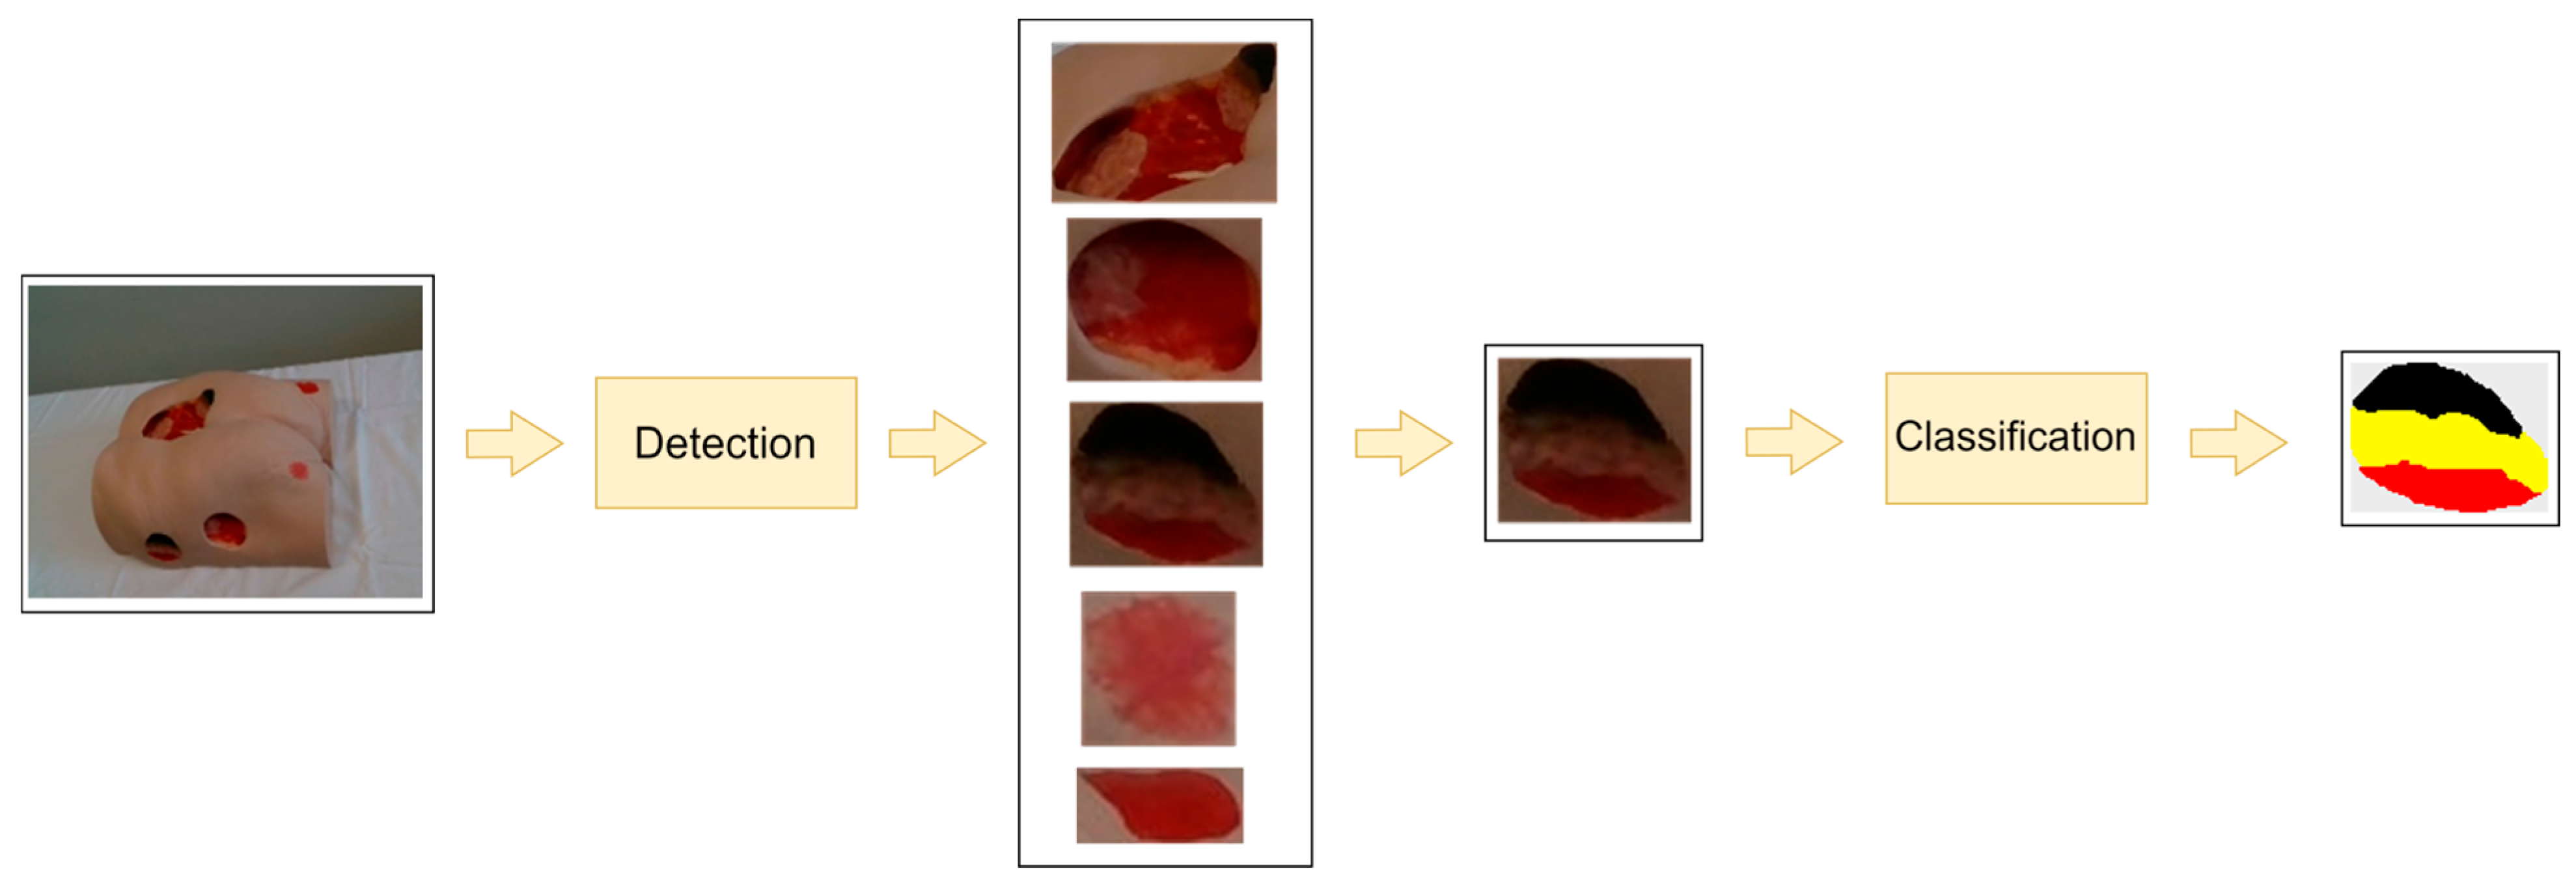
An overview of our current subsystem for wound detection and tissue classification can be found in
Figure 4. An RGB image containing one or more wounds serves as the input for the wound detection subsystem. Depending on the number of wounds in the input image, the output of the wound detection module consists of one or more sub-images of the original image, with each sub-image representing a detected wound defined by a bounding rectangle. If multiple wounds are detected, the subsystem chooses the largest one as the wound to be further analyzed. The selected wound, i.e., the closely cropped image of the wound, serves as input for the next stage—tissue classification.
Our current system consists of two separately trained deep neural networks—one for wound detection and the other for tissue classification. Both neural network models are based on a transformer architecture, more specifically SegFormer [
15]. SegFormer is a novel transformer-based architecture for semantic segmentation that adapts the transformer paradigm originally developed for natural language processing to computer vision tasks. The architecture is characterized by a hierarchical transformer encoder that generates multiscale features without the need for position encoding. This design facilitates the simultaneous extraction of high-resolution coarse features and low-resolution fine-grained features, resulting in a significant improvement in semantic segmentation performance. The architecture uses an optimized MLP (multilayer perceptron) decoder that aggregates information across multiple layers, effectively combining local and global attention mechanisms. This approach produces robust representations while eliminating the need for computationally intensive, hand-crafted components common to conventional methods.
In the initial versions of the detection subsystem, wound detection was performed using a standard feedforward neural network classifier [
16], which was then upgraded to a classifier based on a deep convolutional neural network, MobileNetV2, with connected component labeling [
17], as this proved to be more efficient. However, the current version of this subsystem uses an appropriately trained SegFormer as a classifier, as it has been shown to be more robust than the MobileNetV2 classifier.
The research conducted by Ref. [
3] investigated the effectiveness of different neural network architectures associated with different loss functions for the classification of wound tissue. Their comprehensive analysis included eight different neural network architectures: the conventional U-Net, MobileNet U-Net, attention U-Net, recurrent residual convolutional neural network based on U-Net (R2U-Net), attention recurrent residual U-Net (R2AU-Net), residual network (ResNet-50), EfficientNet, and SegFormer. Each architecture was subjected to separate training using four different loss functions: categorical cross entropy, weighted categorical cross entropy, focal loss, and soft dice loss. The comparative evaluation showed that the SegFormer architecture, in combination with the soft dice loss function, demonstrated superior performance across all classification metrics. Consequently, our wound detection and tissue classification system implements a SegFormer classifier trained with the soft-dice loss function. Both SegFormer classifiers (for wound detection and tissue classification) were trained using a database of images from the two used medical models under different angles and lighting conditions. To improve variability, this dataset was further augmented using various techniques, such as brightness adjustments, random contrast, horizontal or vertical flipping, random cropping, and salt and Gaussian noise [
3].
5. Wound Recording and 3D Reconstruction
The wound reconstruction subsystem has the goal to reconstruct the 3D surface of the wound considered for reconstruction in as few recordings as possible in order to reduce the amount of duplicate data, as well as to speed up the process of patient analysis. The reason for speeding up the recording process is because some of the wounds can be found in specific locations, and the patient must provide and maintain visible access to the wound, remaining still during the whole recording and reconstruction process, which can be awkward and uncomfortable for the patient if it has to be maintained for too long. A visual overview of the reconstruction subsystem can be seen in
Figure 5.
The input of the substage for wound recording and 3D reconstruction is the initial recording pose, which determines the first recording pose out of a series that will be used for reconstructing the surface of the wound. The reconstruction subsystem itself is composed of five substages:
Moving to pose and recording;
Point cloud alignment and pose optimization;
Point cloud analysis;
Hypothesis generation and evaluation;
Recording pose estimation.
The first substage of the reconstruction subsystem instructs the robot arm to move to a requested recording position. As previously mentioned, robot control is implemented using the MoveIt package and ROS Noetic distribution. In the case of the first recording, the recording pose comes from the wound detection subsystem, as mentioned previously. In the case of subsequent recordings, the pose comes from the recording pose estimation substage, which evaluates the hypothesis and finds the best pose that is reachable by the robot. Upon arriving at the requested pose, the robot makes an RGB recording using the integrated Kinova Gen3 vision module and a 3D scan via the Photoneo Phoxi M 3D scanner. The RGB image is then used by the detection subsystem to generate detection and tissue classification masks. The RGB image and the generated masks are then registered to the depth image recorded by the 3D scanner to be used in the later stages of the system. Prior to registration, the detection mask is inflated in order to assure that the mask encompasses the entire wound and a small amount of the surrounding tissue in order to better facilitate 3D wound segmentation. A registered detection mask in this substage is also used to generate a bounding box, which roughly designates a 3D region of interest where the wound is located. The bounding box is also slightly inflated to include more of the surrounding area instead of just the wound points, which enables growth of the reconstructed model when adding points recorded from a different viewpoints. In this substage two additional, subsampled point clouds, which are used in the alignment substage, are created using voxel filtering. One is finer, with a voxel size of 2 mm, while the other is coarser, using a 20 mm voxel size. FPFH descriptors are also generated for the coarse point cloud. At the end of this substage, a point cloud provided by the 3D scanner is sent to the next stage.
The second substage differs, depending on the sequence number of current recording. If it is the first, then the input point cloud is proclaimed a currently reconstructed surface and sent to be analyzed in the next substage. If it is the second recording in a sequence, then a coarse-to-fine alignment sequence is performed between the two recordings before merging the point clouds and sending it to the next substage. The coarse-to-fine alignment sequence consists of three steps. First, coarse RANSAC registration is performed using coarsely subsampled point clouds and FPFH descriptors used for matching. Second, a coarse point-to-plane ICP registration using finely subsampled point clouds with weak constraints is conducted, allowing a larger maximum corresponding distance of 10 mm between point pairs. This is followed by a fine point-to-plane ICP registration using the same finely subsampled point clouds but with tighter constraints, reducing the maximum corresponding distance to 5 mm. In the case of the third and all the later recordings, apart from a coarse-to-fine alignment sequence, a PGO (pose graph optimization) is performed between the available recordings of the aligned point cloud. The goal of pose graph optimization is to determine the global transformation that aligns all recorded point clouds to a common reference frame, while minimizing the overall registration error. An Open3D [
18] implementation of RANSAC with an FPFH descriptor, ICP, and PGO is used.
Point cloud analysis is performed in the third substage, in which the points of the aligned point cloud located within the bounding box generated by the first recording is considered for analysis. The analysis focuses primarily on finding parts of the wound that are underrepresented by the measurements, i.e., the surface areas that are sparsely populated by points. This is done by labeling each point according to the number of points in its vicinity, which is defined by a radius (
Figure 6a). Points can be labeled as core, frontier, outlier, or edge points. The point cloud analysis algorithm is somewhat similar to that used in Ref. [
19], but has been simplified to make it easily parallelizable in order to increase performance. In addition, a new type of edge points was introduced to detect occluded areas.
The first point type to be labeled is the edge point; these points are initially detected on a depth image as points with sufficient depth difference within the 3 × 3 image neighborhood, which can be regarded as a surface discontinuity. The edge points exist in order to detect self-occluded parts of the wound surface, or the parts with higher surface reflectivity combined with low angle recording pose. In both cases, a more dramatic change in recording position would be needed to fully reconstruct the wound in the area where the edge points are defined. Core points are points not labeled as edge points. They have sufficient point density in the vicinity defined by a radius, while the outlier points are the ones with insufficient point density in the vicinity. Frontier point are the last points to be labeled, and they are found on the boundary between the core and the outlier points. Such points need to have both core and outlier labeled points in their neighborhoods.
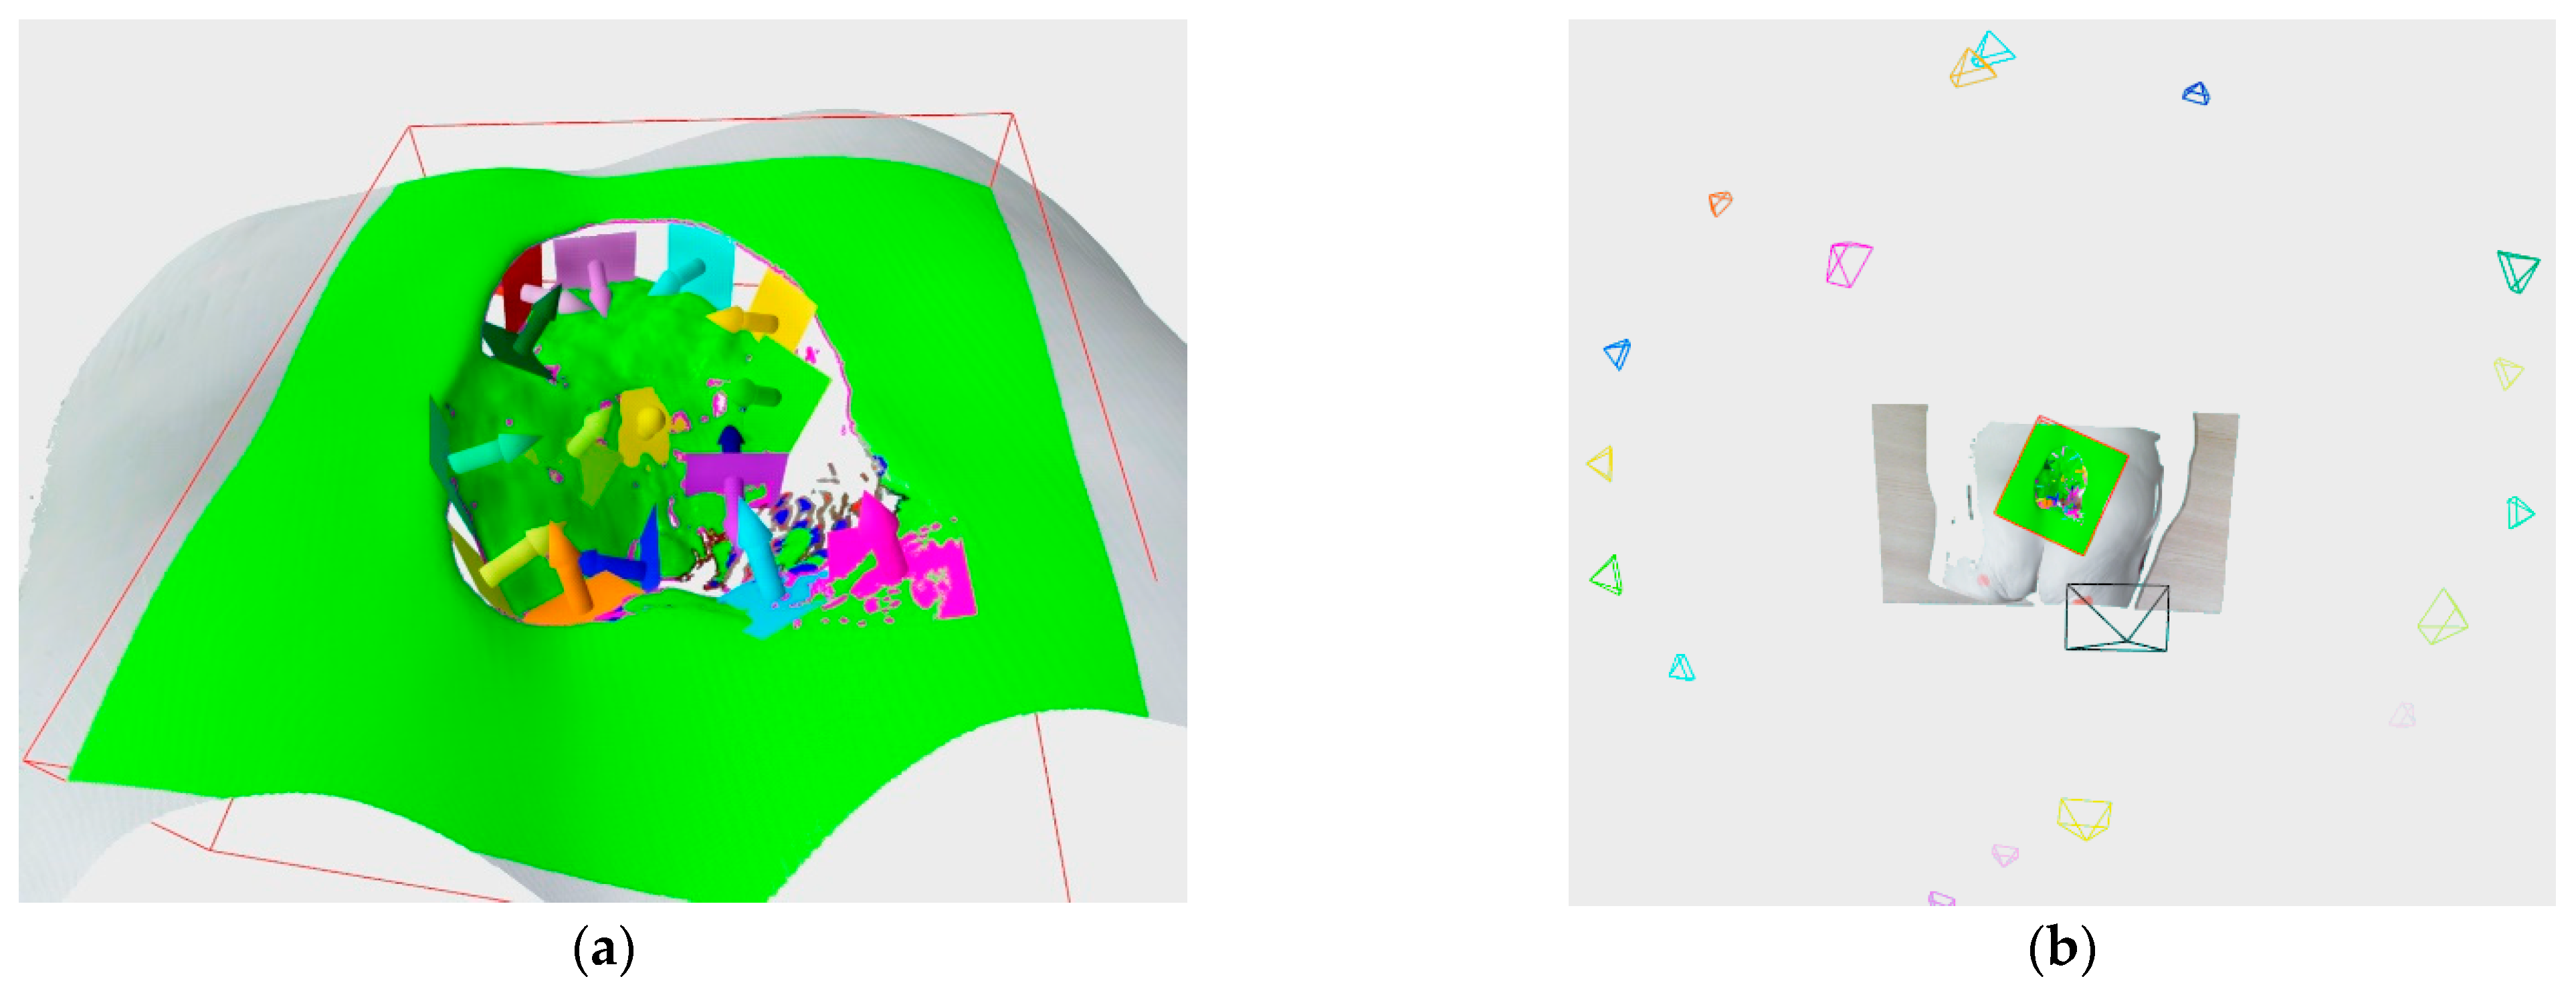
Once the points within a defined bounding box have been assigned a label, the fourth substage can begin, in which the potentially next best view hypotheses for 3D wound reconstruction are generated and evaluated. The hypotheses are generated from frontier and edge points. The edge points are first clustered with a standard K-means using 2D depth image coordinates associated with the edge points. Those edge point clusters are then used to generate planes using the RANSAC algorithm (
Figure 7a). The obtained planes are called DPlanes, i.e., discontinuity planes, because they are typically generated over a surface discontinuity. The surface normal from each of these DPlanes is then used to generate a recording hypothesis, which is oriented at the center of the edge point cluster used to generate a DPlane and located along the normal at a predefined distance considered optimal for the 3D scanner used, as can be seen in
Figure 7b.
Frontier point hypotheses are created by generating a pose for each frontier point by placing it along a frontier point surface normal at an optimal recording distance and orienting it toward the frontier point (
Figure 6b). These poses are defined as quaternions and are then clustered using K-means (
Figure 6c). The number of frontier point clusters is not predefined; instead, it is inferred by the total number of frontier points. The centers of these clusters are then used as recording hypotheses from the frontier points (
Figure 6d).
Point labels, as well as DPlanes, are persistent between recording cycles; however, point labels are updated with the inclusion of new measured points, since adding new measurements increases surface point density. DPlanes are also updated with the inclusion of new points. Updating DPlanes is necessary in order to determine whether the previously unscanned areas of surfaces, bounded by discontinuity planes, have been fully scanned. If so, these planes and their associated hypotheses become redundant.
Recording hypotheses generated by edge or frontier points and are evaluated by the following expression:
where
α,
β, and
γ are contribution weights to define the impact of the number of visible points, the distance from the previous recording position, and hypothesis size. Weights
α,
β, and
γ were experimentally determined to have values of 0.8, 100, and 0.2, respectively.
Nv defines the number of points that are visible from the considered hypothesis; visible points include the number of frontier points and the DPlane’s edge points visible from the hypothesis pose using the view frustum of the used 3D scanner. The distance to the previous recording position is represented by
d, while
Nh defines the hypothesis size, which represents the number of frontier points in a cluster or the number of edge points in the DPlane which spawned the hypothesis. After evaluation, the hypotheses are sorted by
hscore in a descending manner.
The fifth and last substage of the 3D reconstruction process is to further evaluate the generated hypotheses by checking whether they are actually reachable by the robot arm. The reachability check is performed using the Bullet library [
20], for physics simulation of the robot arm, and the Robotics Toolbox for Python [
21], for inverse kinematics calculations. Every hypothesis evaluated in this way is first checked to determine whether it is near a position and orientation of some previous recording pose. If not, then a reachability check is performed. If it is too near to the previous recording position, then that hypothesis is omitted. If the hypothesis is not reachable, then the system generates a set of nearby hypotheses in a spherical pattern (
Figure 8a) and checks to see if any of these are reachable (
Figure 8b). The closest spherical hypothesis that is reachable is then chosen instead of the main hypothesis. The sorted hypotheses are evaluated in this manner in a sequence from best scored to worst, and either the first hypothesis or the spherically generated type that is reachable within its vicinity is chosen (
Figure 8c), and the reconstruction process starts the next iteration. The recording process concludes if no recording hypotheses are generated because there are no edge or frontier points, if every hypothesis (including the spherical hypothesis) is unreachable, or they are too similar to previous recording poses.
The output of the 3D reconstruction process is the point cloud included within the bounding box generated by wound detection in the first iteration of the 3D reconstruction process, along with all RGB and depth images, detection and tissue classification masks, as well as recording poses. The output point cloud is also subsampled using voxel filtering and 1mm voxel size in order to reduce the number of the accumulated points incorporated from all the scans and to make the reconstructed wound surface more uniform.
6. Segmentation and Measurement
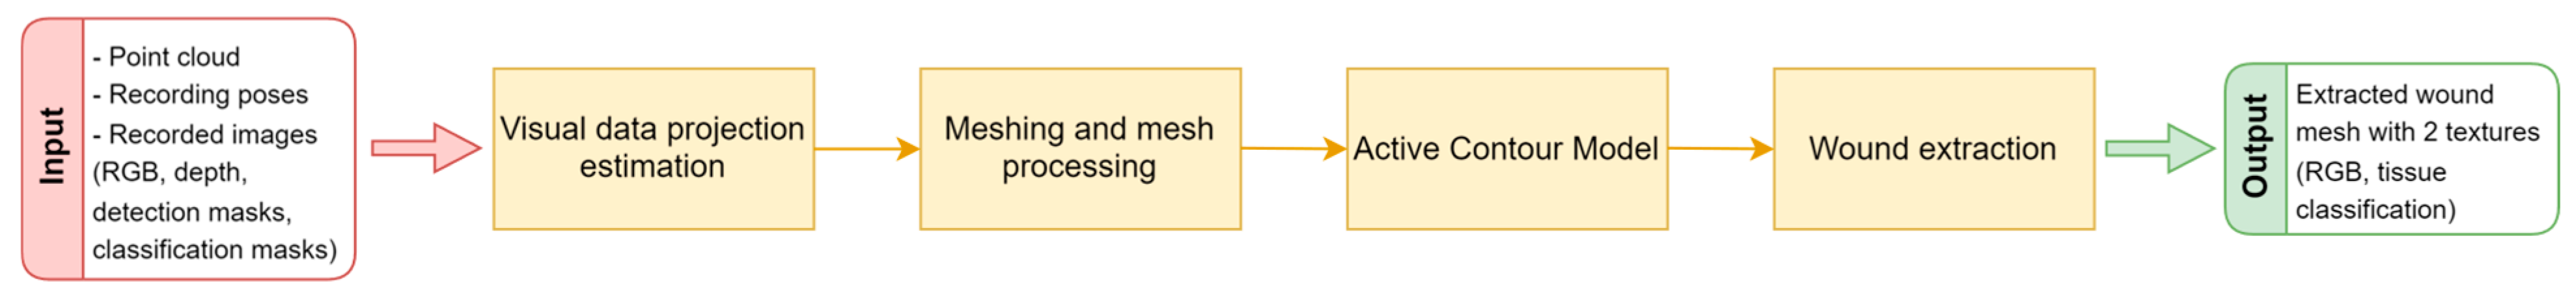
The segmentation substage serves the purpose of extracting the actual wound surface from the 3D reconstruction, which can then be used for the analysis and measurement of requested wound parameters. The segmentation stage is split into several substages, as can be seen in
Figure 9.
The voxel filtering at the end of the 3D reconstruction process resulted in 3D points that are not actually part of any measurement made by the 3D scanner; instead, they are the average of points (and their colors) located within a particular voxel. Therefore, before the wound surface is actually extracted from the surrounding healthy tissue, point cloud color, as well as detection and tissue classification masks, need to be reprojected to the recorded images in order to ascertain their actual visual measurements.
The reprojection process, which in this case is called the visual data projection estimation, aims at choosing an appropriate recording pose for each 3D point in the cloud. An appropriate recording pose is chosen based on the distance between the point and recording pose, how parallel the recording pose orientation is to the surface normal at that point, and of course, whether the point is visible from the recording pose, taking into account self-occlusion of the surface geometry. Based on the chosen recording pose, the 3D points are assigned a color, as well as detection and tissue classification label. Some of those assigned colors and labels might not be valid because of imperfect RGB to depth image registration, and thus, some post processing will be required to homogenize the detection texture.
After the visual data projection has been estimated, a triangle mesh is created using the greedy point triangulation algorithm [
22], which is further refined using a loop subdivision [
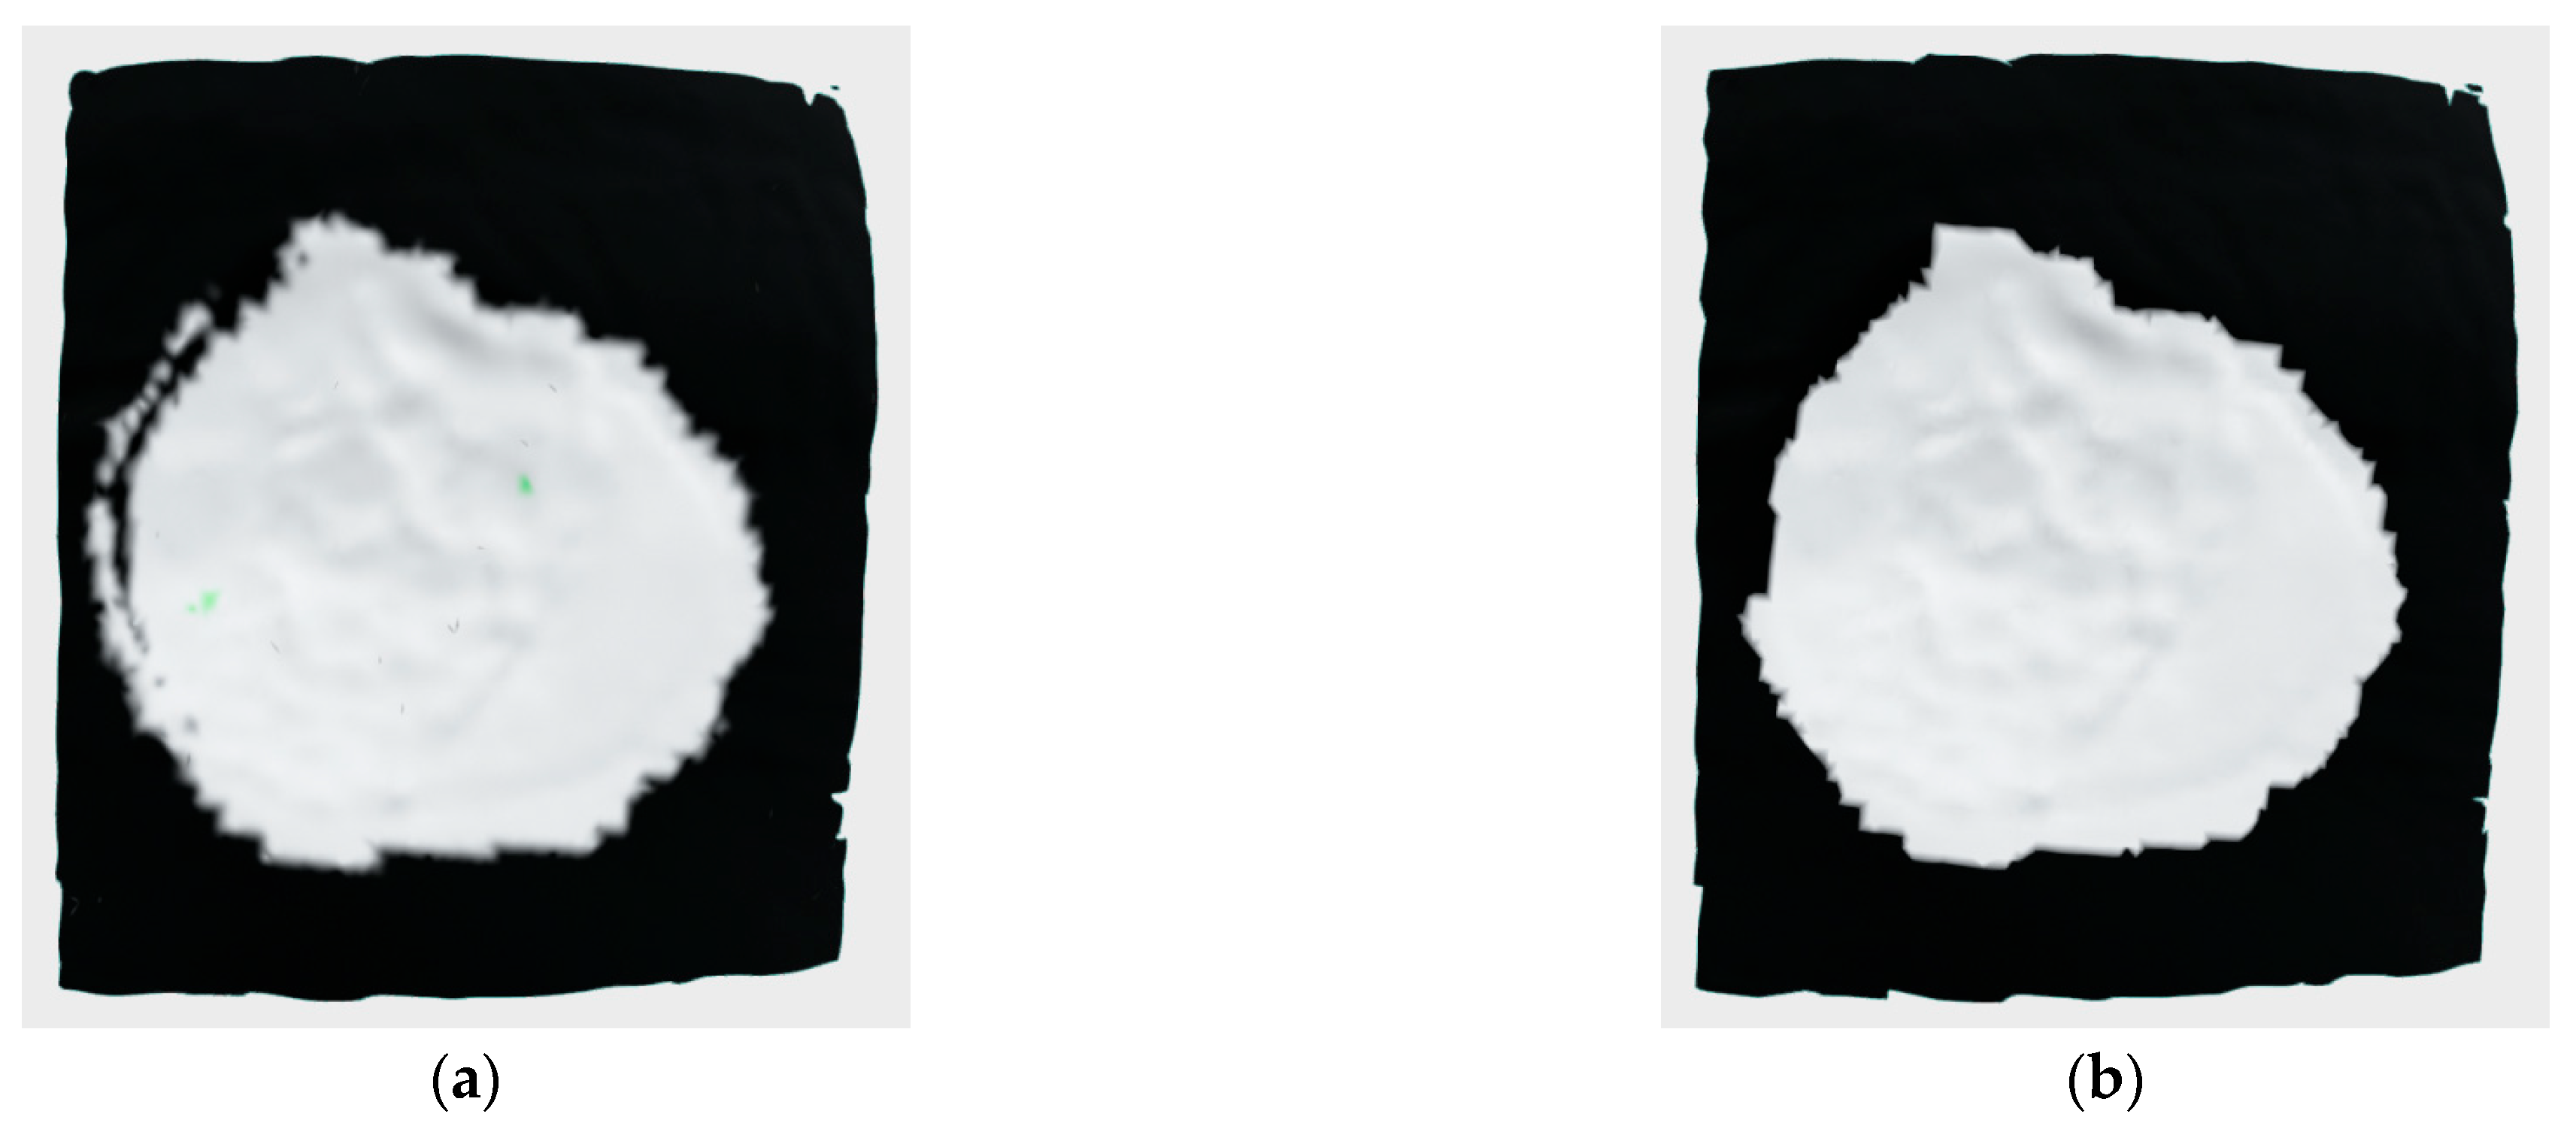
23]. Subdivision is necessary because it allows for a finer segmentation in terms of surface geometry and visual data. The subdivision results in newly interpolated 3D points being created between the original examples. Besides the geometric interpolation that created these points, their color and labels have also been interpolated. Since the labels are particularly important for the definition of the initial contour for the active contour model (ACM), their values need to be rounded before proceeding with the segmentation. In order to better designate the initial contour for the ACM, the wound region on the mesh defined by its label is homogenized by eliminating edge cases in which the wound or non-wound labeled points are mostly surrounded by the oppositely labeled points. In that case, the point is assumed to have the same label as that in the neighborhood with opposite label. It has been experimentally determined that the label switch should occur if there are 20% more differing as compared to similar labels in the neighborhood. Once the point label has been changed, it cannot be changed again. The homogenization occurs iteratively until no more edge cases are detected. As can be seen in
Figure 10, the resulting mesh is more natural after homogenization (
Figure 10b), with no artefacts resulting from imprecise RGB to depth image registration.
The processed mesh with a homogenized detection mask texture is then used in the ACM algorithm for determining the precise border between the wound and healthy surrounding tissue. The homogenized detection mask texture is only used for determining the initial contour, which the ACM algorithm will modify during the optimization procedure in order to fit the wound border more precisely. The ACM algorithm is based on minimizing the energy function, which is composed of mesh energy (
Emesh) and contour energy (
Econtour) as follows:
Mesh energy is obtained by calculating the principal component analysis (PCA) using the surface normal and color data for the point neighborhood of a specific mesh vertex. It represents the maximum value between the largest eigenvalue of the covariance matrix
Cn calculated using the surface normal in the neighborhood of a particular point
p and the largest eigenvalue of the covariance matrix
Cc, calculated using color data in the RGB color space of the point neighborhood. This is a distinction compared to the methods of the original research [
2], in which only surface normals were used. The contour energy is a combination of elastic energy
Eelastic, which controls contraction (or expansion), and smoothing energy
Esmooth, that controls the deformability of the contour. The symbols
α and
β scale the influence of elastic and smoothing energies. The elastic energy is the sum of the Euclidean distance between the neighboring nodes of the contour, while the smoothing energy is the sum of the 3D gradient between the neighboring nodes of the contour.
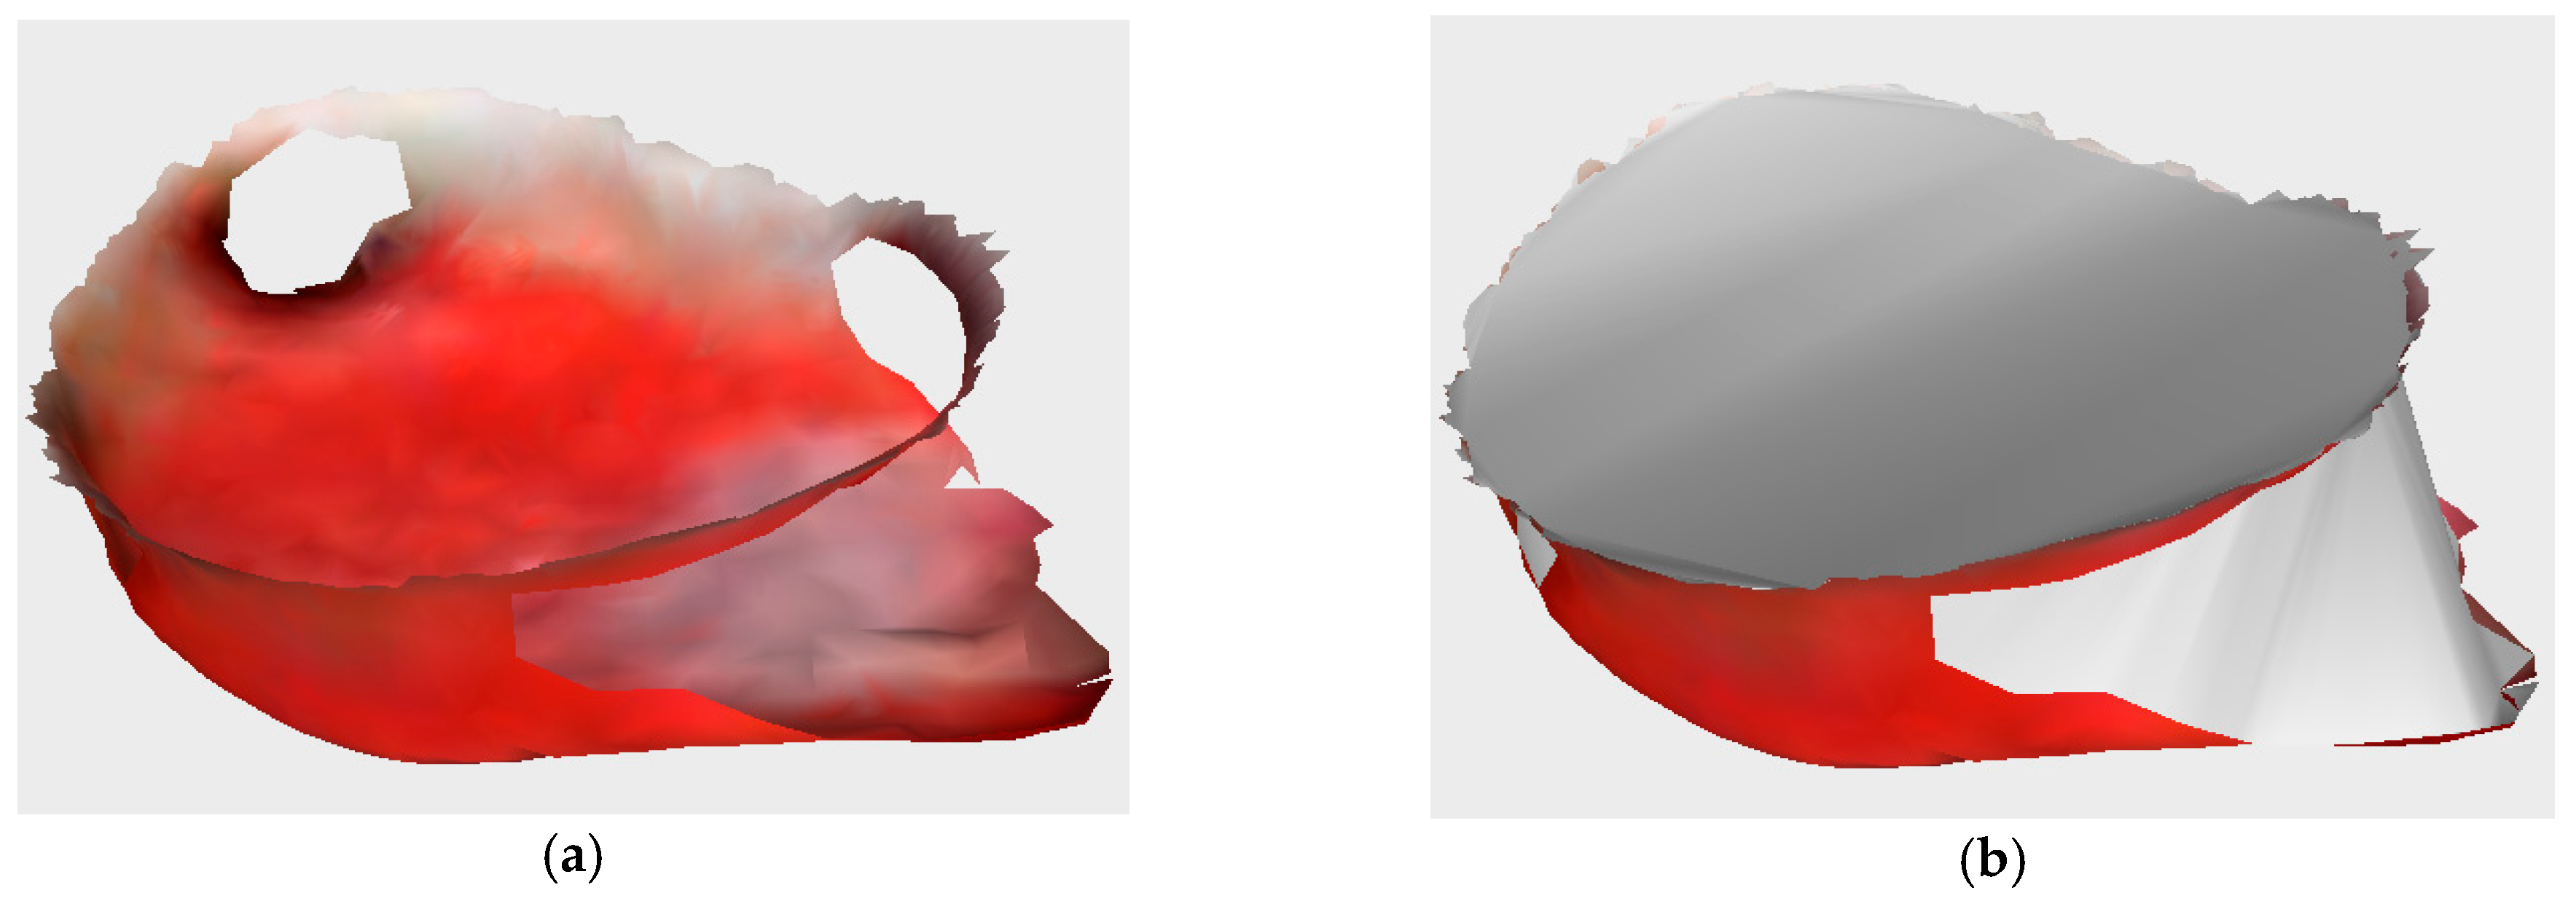
Figure 11 shows the results of PCA calculation when just the normals or a combination of normal and RGB data are used. The contour results of the ACM after 100 iterations is also shown.
Once the exact boundary between the wound and the surrounding tissue has been found, the wound mesh is extracted from the reconstructed model. Depending on the wound type, it is possible that the wound could include subsurface tunneling, which results in holes on surface of the wound, as can be seen in
Figure 12a.
In order to measure the wound’s volume, all holes, as well as the wound top, need to be closed, and a watertight model is created (
Figure 12b). The holes and wound top are closed using the iterative constrained Delaunay algorithm, while the watertight model is then used for volume calculation via the maximum unit normal component algorithm. The wound perimeter is calculated as the sum of edge lengths of the extracted wound surface, while the wound area is calculated as the sum of the area of the triangles of the extracted wound surface.
Besides the wound’s physical parameters, the developed system also provides the analysis of the wound surface in the form of the percentage of specific tissue representation (granulation, fibrin, necrosis). These percentages can then be used as a concrete indicator of the wound healing process, along with the wound’s physical parameters. An example of the classified surface texture tissue types can be seen in the
Figure 13a. The final wound mesh model consists of extremely small triangles (
Figure 13b), with an average area of 0.0211 mm
2 and a standard deviation of 0.0072 mm
2. The statistical distribution of the triangle areas for a typical wound surface can be seen in
Figure 13c. Therefore, the relative area of the particular tissue type is approximated by the number of vertices with a specific wound tissue label.
7. Discussion
Older versions of the developed subsystems described here have undergone testing in which their efficiency and precision has been proven individually [
1,
2,
3]. Since the published of these works, these subsystems have been connected into a single pipeline and further improved by additional features and algorithms in order to expand their possibilities, as well as to allow for transitioning to ROS for robot control in order to improve robot reachability and trajectory management. Even though the testing of the full pipeline of the system was successful, each subsystem has its advantages and disadvantages.
The subsystem for detection and tissue classification works very well for the wounds modeled via the two wound care medical models predominantly used during research and development and can therefore be represented as a proof of a real-world applicability. However, developing such a subsystem for use on actual wounds in real-world conditions would be very challenging because of the need for the very large database of high-quality annotated wound images for various types of wounds. Such a comprehensive annotated database with annotations for wound area, as well as tissue types, for various types of chronic wounds does not currently exist. Therefore, a significant amount of research in this area focuses on only one type of wound, such as diabetic foot ulcers [
24]. The reason for this is that there are many different causes of wound development, and all these different types of wounds could have different characteristics, shapes, and sizes, which leads to a very large learning database. Therefore, in this research, a conscious decision was made to focus on synthetic wounds (
Figure 14b) due to their availability and measurability, which has led to the limitation that the learned models for detection and tissue classification are not typically applicable to real-world wounds (
Figure 14a). If an appropriate annotated database is created, it is certainly within the subsystem’s capabilities to be applicable to these real-world wounds.
The recording and 3D reconstruction subsystem is very efficient for the reconstruction of small- to medium-sized wounds with some surface complexity of wound geometry. Nonetheless, because the system hardware is in a fixed position beside the patient’s examination bed, and due to a combination of used technologies for recording, i.e., robot arm and 3D scanner based on structured light, there are limitations regarding the recording capabilities of complex wounds. Namely, if the wound is very large and situated on a curved part of the body, such as the leg, or due to the wound self-occlusion, part of the wound surface could be placed outside the visible viewing range achievable by the system, and therefore, it would not be possible to reconstruct the whole wound surface. Furthermore, if the wound contains crevices or tunnels, as can be seen in
Figure 15, then due to the limitations of robot arm reachability and the projection-based 3D scanner, those parts of the wound cannot be reconstructed. Also, the projection-based 3D scanner capabilities are strained by the reflective properties of the recording surfaces. Some of the limitations, such as the large wound constraint, could be diminished by supporting multi-session recording, which would facilitate the repositioning of the robot and/or patient for better robot reachability and achieving viewing positions for recording previously unseeable wound surfaces. However, the 3D reconstruction of crevices and highly reflective areas would require a different set of recording technologies. For crevices, a camera that could approach at a closer distance to the actual crevice could be used, while for the reflective areas, a different type of 3D sensor that is less sensitive to reflection would need to be used, since applying a dulling agent on the wound surface is, for the most part, not feasible.
The wound segmentation subsystem is mostly generic in its objective and can be used for any segmentation tasks on 3D surfaces, if appropriate visual or geometric data are considered. For the purpose of wound segmentation, the developed subsystem works very well. Its only limitations are that the input point cloud and subsequently, the mesh, must be properly preprocessed in order to generate an appropriate initial contour and that the considered mesh must display sufficient density so that the curves generated by chosen vertices can easily be approximated by a spline. If the mesh is of insufficient density, then the generated curves have many cusps, and the energy functions do not converge well under such conditions. The meshing and mesh processing stages, due to their specific requirements and functionalities, can take upwards of one minute to complete, with no option to parallelize the considered algorithms. Active contour modeling can also require a significant amount of time to complete, based on the wound size, mesh density, and chosen number of iterations. However, some parts of the ACM algorithm can easily be parallelized, which could significantly improve the performance of the 3D segmentation.
8. Conclusions
In this paper, a novel robot-driven system for 3D wound reconstruction and analysis is described. Beside the initial manual orientation toward the general direction of the wound, the rest of the system is fully automatic, and it includes subsystems for wound detection and tissue classification; recording and 3D reconstruction; and wound 3D segmentation, measurement, and analysis. The system operation results in an extracted 3D model of the reconstructed wound with color and classification visual data, as well as the physical characteristics of the wound, such as perimeter, area, and volume, along with percentage representations of specific wound tissue (granulation, fibrin, necrosis). The provided data could be used for tracking the wound healing process over a certain interval of time (with follow-up checkups), as well as to provide vital information needed for determining the correct therapy for individual chronic wounds.
Every developed subsystem has its advantages and disadvantages. The current advantage of the system is that it works for the majority of wounds included on the two wound care medical models which were predominantly used during the development of this system. The only limitation was the existence of crevices and tunneling on certain wounds, which results in less than complete reconstructions but effective 3D models, nonetheless. The functionalities of the system were tested in several sessions in the outpatient clinic for vascular surgery of the clinical hospital center. Unfortunately, while these assessments achieved their purpose of testing in real world conditions for applicability, they were not rigorous or lengthy enough to determine the efficiency, precision, and reliability of the developed system for the purpose of monitoring the wound-healing process over a longer period of time.
Future work would include multisession recording, with the possibility of robot repositioning, which would enable the 3D reconstruction of wound surfaces from more viewpoints. Also, a mounting of the robot arm on a robot mobile base or positioning the robot arm above the patient in an upside-down position are also options to consider. Mounting the system on a robot mobile base would make multisession work occur autonomously, while positioning the robot arm above the patient would make more efficient use of the robot’s effective workspace. In addition to using deep learning for wound detection and tissue classification, deep learning could also be used for NBV, which would enable a more efficient and less complex 3D reconstruction algorithm.


