1. Introduction
Among the various daily activities, walking is important to maintain quality of life and to realize good physical and mental health [
1]. Therefore, many wearable walking assisting devices have been developed to enable users with impaired gait function (due to aging or diseases) to walk as desired in their daily lives [
2]. Human walking is achieved by the joints of the entire body working together. In particular, the ankle joint plays an important role in human gait by generating propulsive force, landing impact absorption, and ensuring stability [
3].
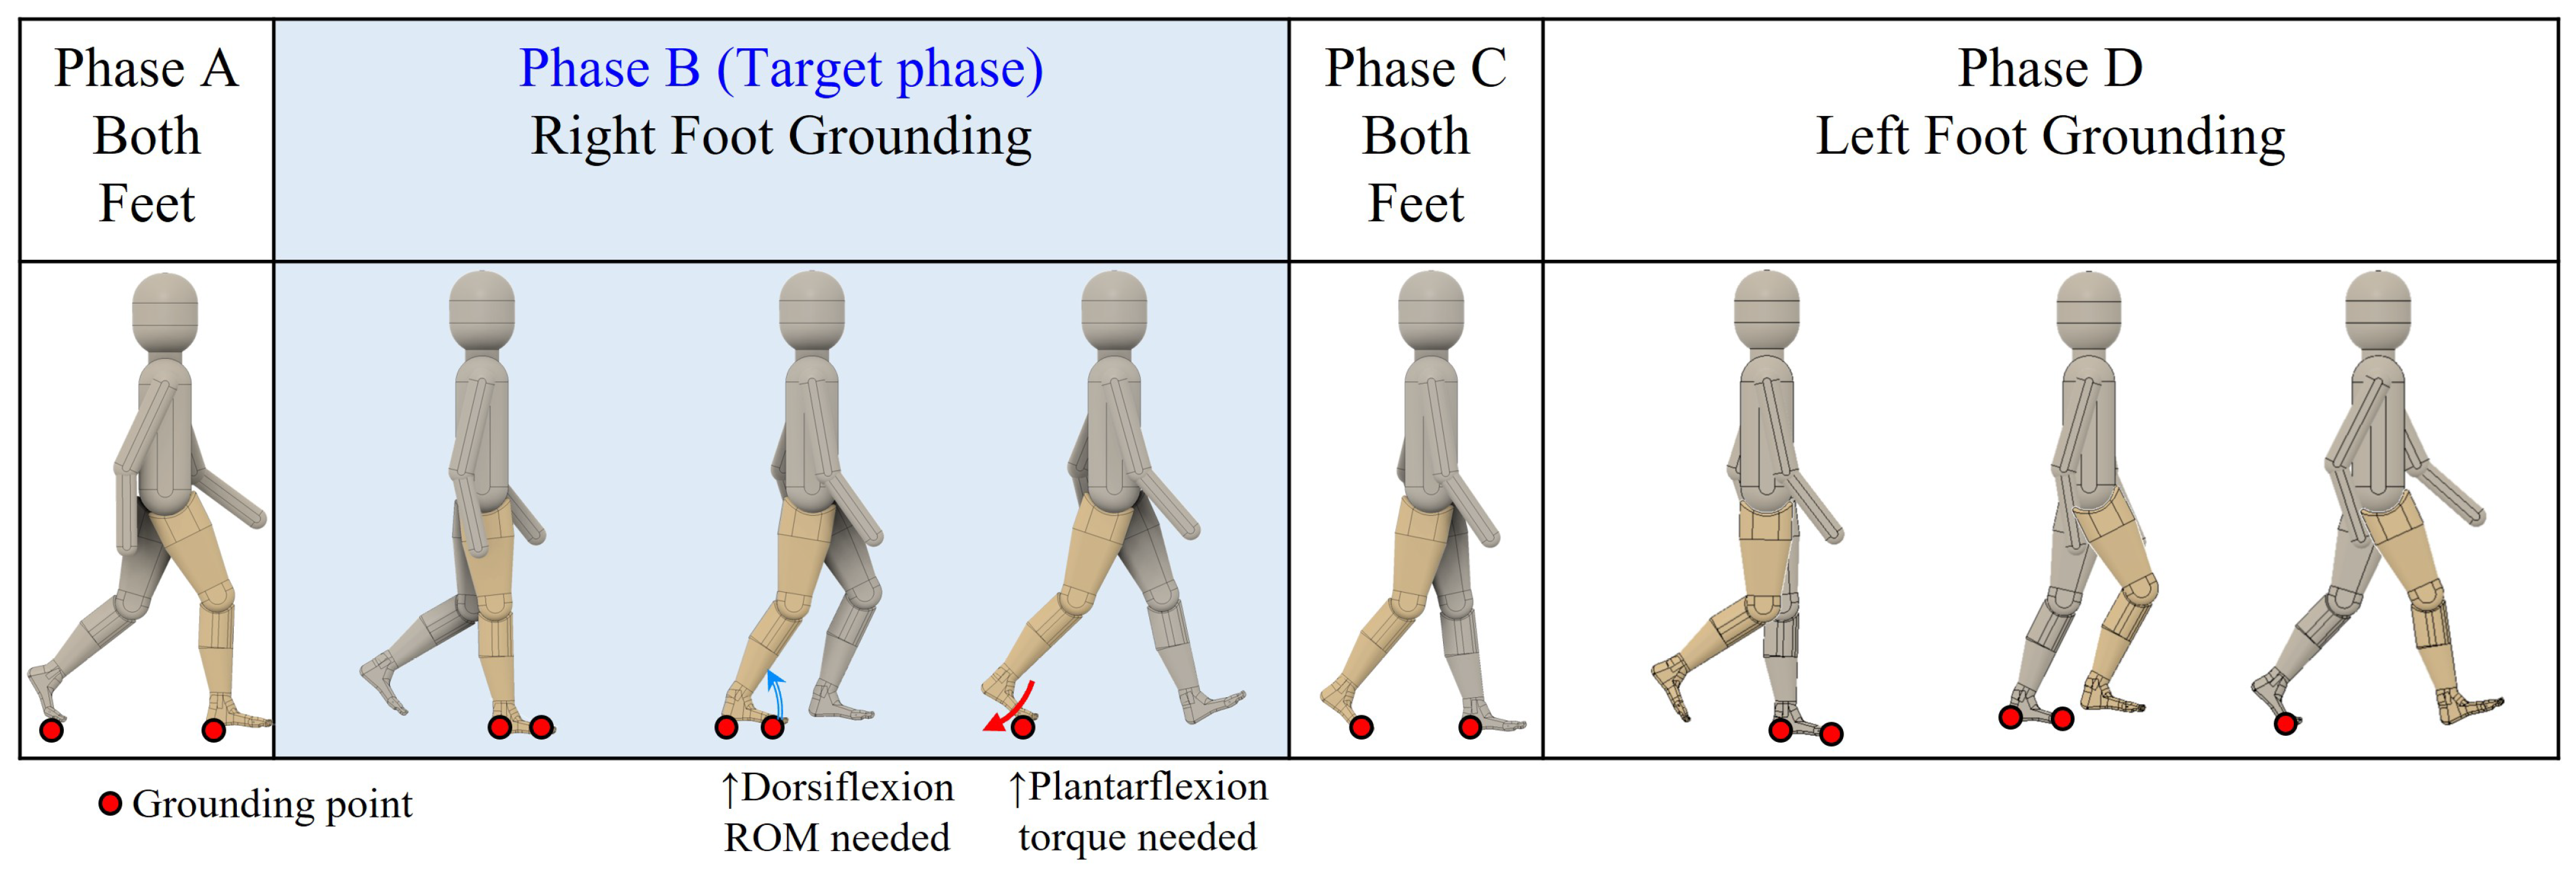
The following four characteristics are repeated in human gait. Phase A with both feet on the ground, Phase B with only the right foot on the ground, Phase C with both feet on the ground, and Phase D with only the left foot on the ground.
When focusing on the ankle joint in Phases B and D, where only one foot is on the ground, the ankle joint must be able to generate a large plantarflexion torque (plantarflexion is the ankle motion to lower the toe from standing position) to push off strongly against the ground. For a person weighing 60 kg, a slow gait requires approximately 60 N
m while a fast gait requires approximately 90 N
m as pointed out in [
4]. However, this function can be impaired by aging or diseases such as diabetes [
5] and stroke [
6]. Therefore, exoskeletal-type walking assisting devices have been developed to compensate for the loss of ankle plantarflexion muscle strength [
7,
8].
In phases B and D, the range of motion (ROM) of the ankle joint should be large along the direction of the dorsiflexion (dorsiflexion is the ankle motion to lift up the toe from a standing position). According to a study that measured ankle joint angles at different gait speeds, the ankle joint dorsiflexion angle required is at least 10° [
9]. Moreover, an angle of 15° is required in the case of a slow gait speed. However, the dorsiflexion ROM of the ankle joint sometimes becomes smaller owing to aging, diseases such as stroke and diabetes, fractures, and sprains. For example, the ankle joint dorsiflexion ROM of a stroke patient in the knee extended position is approximately 0°. This value increases by approximately 2.4° after 6 weeks of rehabilitation [
10]. However, it is clearly less than the 15° required for low-speed walking. A symptom of limited ankle dorsiflexion is toe walking [
11], which results in a shorter step length and slower gait motion [
12]. In addition, limited ankle dorsiflexion ROM can cause problems in joints aside from the ankle joint. For example, limited ankle dorsiflexion ROM increases the strain on the knee and hip joints [
13,
14]. In diabetes, limited ankle dorsiflexion ROM increases the toe ground reaction force and consequently causes toe ulceration [
15]. The application of forces around the ankle joint to assist dorsiflexion motion is possible using an exoskeletal walking assisting device. However, this requires a large torque and limited ankle dorsiflexion can result in pain in the joint if it is forced [
16].
This work considered that a patient with limited ankle dorsiflexion ROM would walk in a posture different from that in the case of normal gait. The concept of allowing a patient with limited ankle dorsiflexion to achieve a suitable gait posture was inspired by a treatment method referred to as “heel lifts”, wherein shoes with a thick heel portion of the sole are used [
11]. Heel lifts are a common method used in clinical practice when soles of an appropriate height should be used. This is because excessively high soles place stress on the knee joint [
17]. In heel lift therapy using shoe soles, the heel is lifted passively even during the gait when there is no effect of limited ankle dorsiflexion ROM. However, it is possible that heel lifts with less burden could be realized if an appropriate amount of heel lifting is performed actively at the required instant using robotics assistance. In addition, heel lifts cannot provide assistance for the ankle plantarflexion muscles that push off the ground after heel release. Moreover, plantarflexion muscle assistance is often required in patients with limited ankle dorsiflexion, such as in stroke patients who require plantarflexion muscle to increase their walking speed [
18]. Therefore, there is a need for a walking assisting device that compensates for the loss of gait function owing to reduced ankle plantarflexion torque and limited ankle dorsiflexion simultaneously. For this need, a new walking assisting device is proposed by using an independent link attached to the lower legs. The purpose of this work is to investigate the effect of the independent link on ankle joint torque and ROM analytically and to obtain knowledge useful for the realization of ankle assisting devices from a mechanism point of view.
2. Existing Device and the Proposed Assisting Device
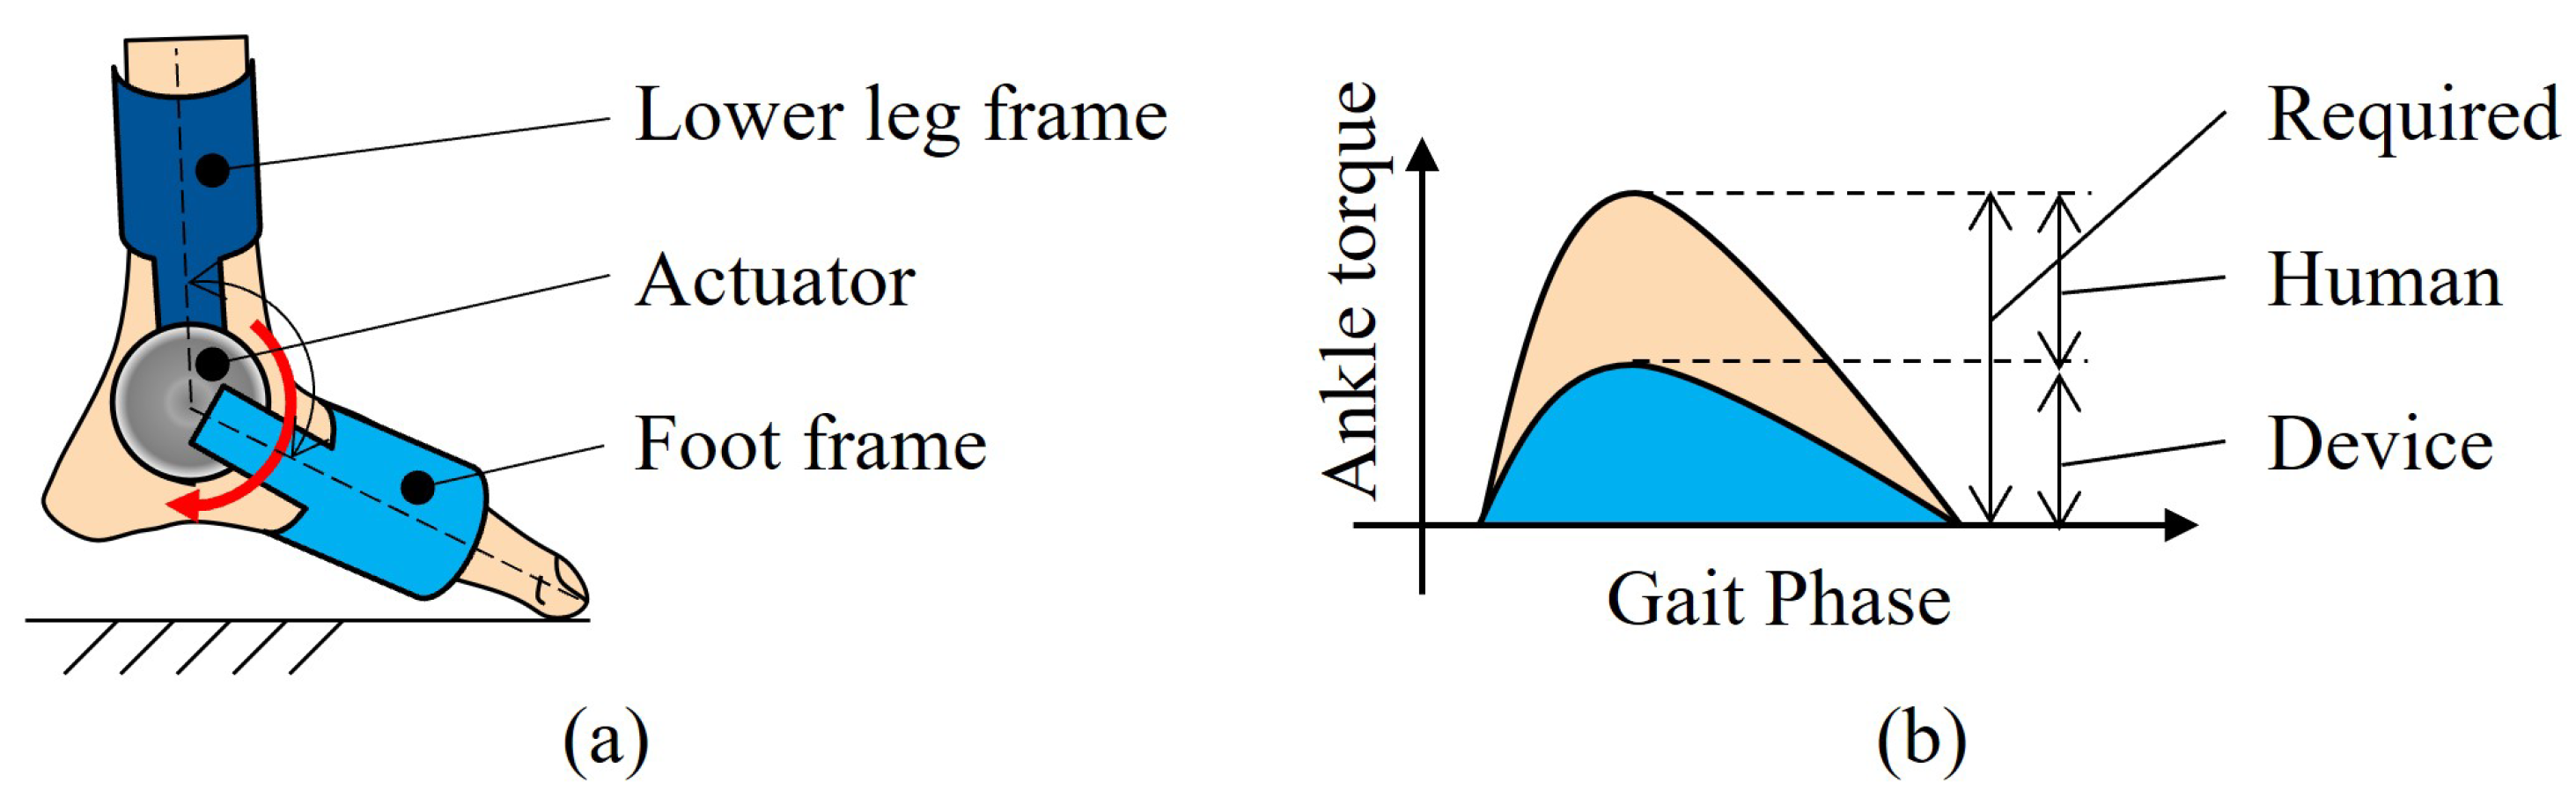
An exoskeleton-type walking assisting device and the support method of “heel lifts” were considered from a mechanical perspective, together with the functions required for a walking assisting device in order to design a new ankle assisting device. The proposed exoskeletal walking assisting device uses an actuator to drive the link between the frame attached to the lower leg and the foot frame, as shown in
Figure 1a. This may realize the required goal torque through the sum of the human ankle and actuator torque, as shown in
Figure 1b.
In this paper, such an assistance method is referred to as “torque assistance”. Assistance torque increases the force with which the toes push off the ground, and this ground reaction force becomes the force that lifts the lower leg. This results in both the force and torque acting on the lower leg. Although the ratio of the force and torque that an assisting device should generate may vary depending on the walking posture to be realized, assisting devices must be designed considering both the force and torque acting on the lower leg.
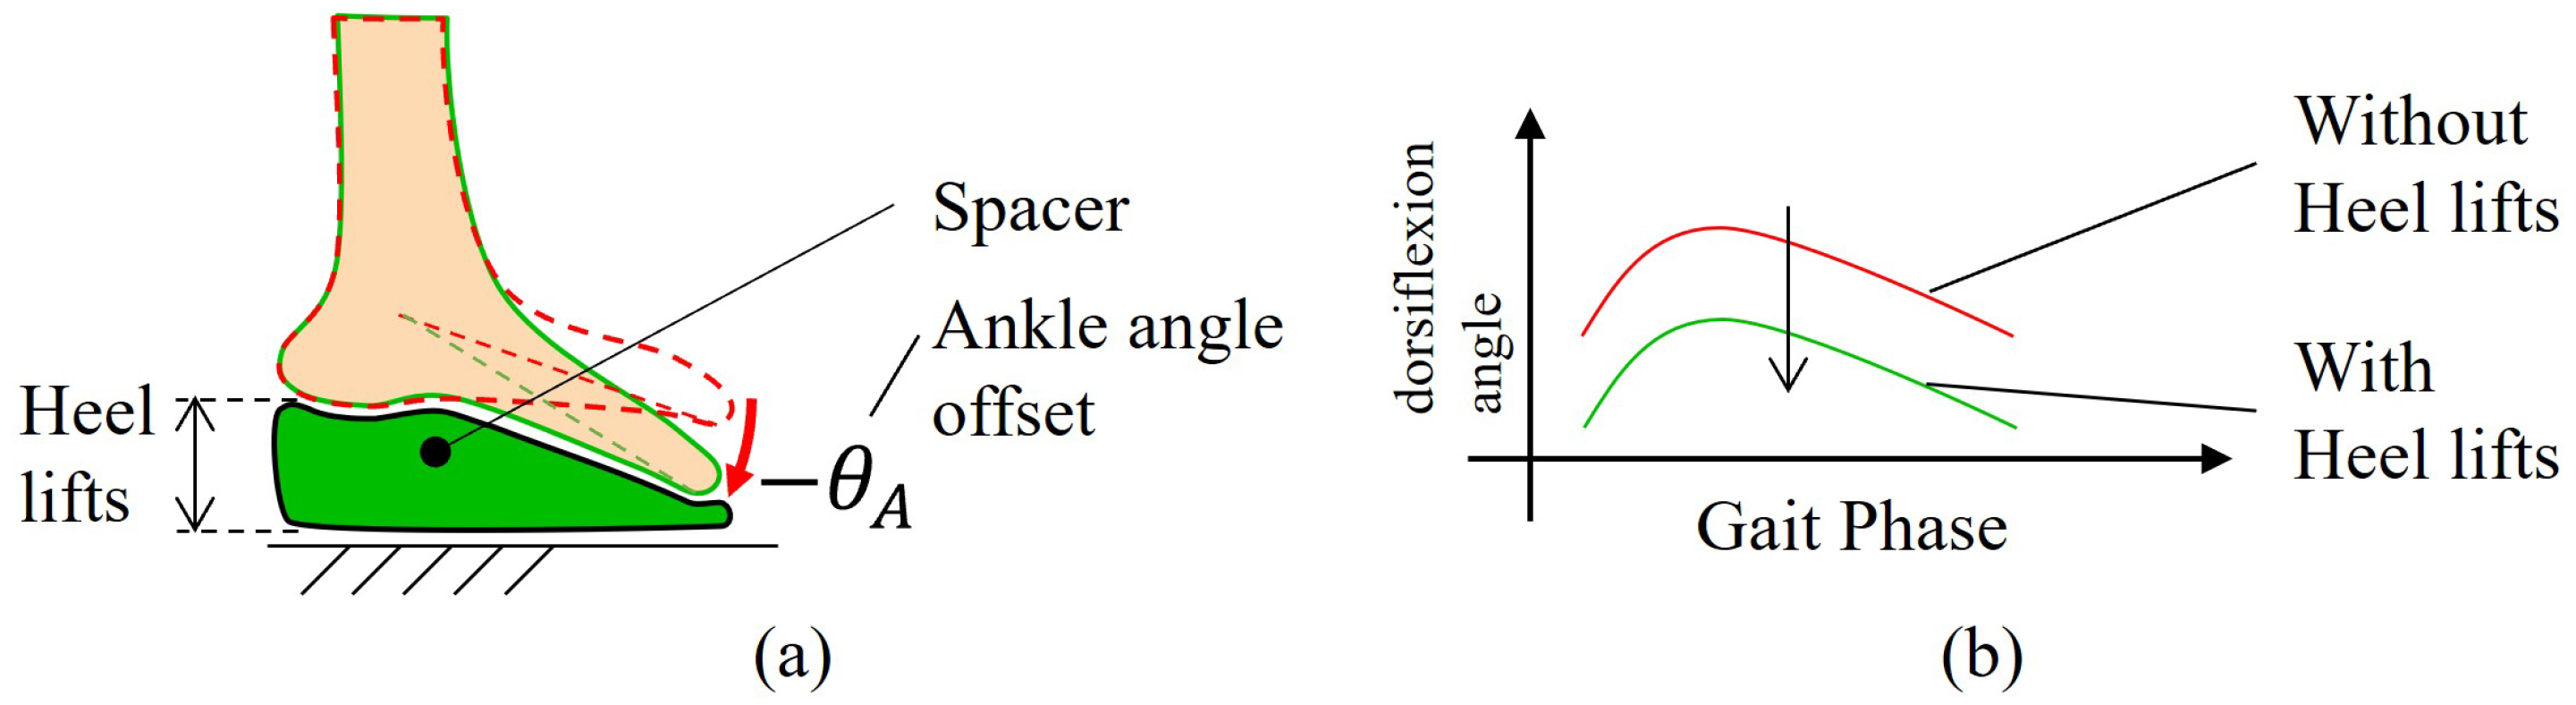
The use of heel lifts reduces the maximum ankle dorsiflexion angle and allows the user to walk using only the available ROM of the ankle joint. In this method, shoes with a thick heel portion of the sole are used, as shown in
Figure 2a. The thickness of the heel portion of the shoe sole varies depending on the symptoms. However, it is approximately 20 mm [
17]. Consequently, the ankle joint angle is offset along the plantarflexion direction, as shown in
Figure 2b.
In this paper, such assistance in changing the used ROM is referred to as “ROM assistance”. However, it is not necessary to offset the ankle joint by the same amount always, as is the case with the heel lifts, to decrease the maximum ankle dorsiflexion angle. Offsetting the ankle joint angle only when necessary may decrease the difficulty of walking. Certain exoskeletons that assist with the plantarflexion torque of the ankle joint also assist dorsiflexion [
19]. The concept of such dorsiflexion assistance involves dorsiflexing the ankle joint of patients who cannot dorsiflex owing to muscle weakness. However, the concept of ROM assistance in this work is used to achieve gait posture without dorsiflexing the ankle joint with limited dorsiflexion by joint stiffness. Currently, there is no gait assisting device that can assist both reduced ankle plantarflexion torque and limited ankle dorsiflexion ROM simultaneously.
Based on the problem to realize both torque assistance and ROM assistance simultaneously, this work proposes a walking assisting device with an independent link. As shown in
Figure 3, this assisting device consists of an actuator fixed to a frame attached on the lower leg, and the independent link that the actuator directly pushes on the ground for assistance. To maintain left-right balance, the independent link is attached to each side of the ankle joint. There are two types of link attachment directions: front assistance as shown in
Figure 3a and rear assistance as shown in
Figure 3b.
In both cases, the independent link pushes on the ground, exerting a force and torque on the lower leg. Torque assistance can be realized by using the independent link to take over the force and torque that the human ankle joint exerts on the lower leg. In addition, as the independent link moves independently of the ankle joint, it can push up the ankle joint without being affected by the ROM of the ankle joint. If the ankle joint height is larger than normal, the ankle joint angle will be offset along the plantarflexion direction through the same effect as heel lifts, and ROM assistance can be realized.
The effect of the independent link on the ankle joint torque and angle may vary depending on the independent link length, whether the link is placed forward or backward, and the magnitude of the actuator torque. However, it is unknown what parameters can be used to change human gait posture and joint torque, and consequently, whether there are parameters that can simultaneously realize torque and ROM assistance. This work aims to investigate how the structure and control of the assisting device affect human walking posture and joint torque, and to investigate the possibility of walking assistance using an independent link attached on the lower leg.
3. Analysis Model
Because of the numerous parameters considered in the analysis of this work, the analysis time was expected to be excessively long. Therefore, a analysis model that handles only one step of one foot was made to reduce the computational cost in each walking analysis. In this section, the following aspects are explained:
3.1. Target Phase for One Step Analysis
In general, the movement immediately after the beginning of walking is not normal. This is because the walking speed is accelerated. Thus, it is only possible to determine the feasibility of the gait motion after several simulated steps following the steady gait motion. However, in this work, we analyze the walking by only a single step by setting an appropriate initial speed as the boundary condition of the analysis.
In this work, gait was divided into four phases, as shown in
Figure 4:
Phase A with both feet on the ground.
Phase B with the right foot on the ground.
Phase C with both feet on the ground.
Phase D with the left foot on the ground.
The lack of ankle plantarflexion torque and limited dorsiflexion ROM of ankle mainly affects two phases. These are right ankle during Phase B and left ankle during phase D. Therefore, the right ankle of phase B is set as the target of the analysis, since phase B and phase D will be the same motion, only changing right and left. During phase B, the left lower limb is in the swing configuration. Since the contribution of the swing lower limb to gait is small, only the stance lower limb was included in the analysis. Then, the weight of the full body without stance lower limb can be considered as modeled with concentrated mass at hip point.
However, if the walking analysis was conducted only in phase B, it would be a problem whether the analysis result would be continuous cyclic motion or not. For this concern, this analysis was conducted based on the hypothesis that “cyclic walking analysis will be achieved by the configuration that each four parameters of each analysis are same with those of normal walking”. The four parameters are hip joint height and hip joint forward velocity at the time of the initial and final single support phase.
The reason for this hypothesis is as follows. At the time of the initial single support phases B and D, it is possible for patients with limited ankle dorsiflexion ROM to walk in the same walking posture as those of normal walking because the ankle dorsiflexion angle of this phase is small normally. However, at the time of the final single support phase, it will be difficult for patients with limited ankle dorsiflexion ROM to walk in the same walking posture as that of normal walking because the ankle dorsiflexion angle of this phase is large normally. Around the period of the final single support phase, if the pose change in the stance side lower limb does not influence the motion of the swing side lower leg, the swing side lower limb can contact the ground in the same pose as normal walking. If this condition is met, both lower limbs can start from the same pose as each other at every step. This means continuous cyclic walking motion will be possible. Mechanically, the left and right lower limbs were connected with a hip joint. So, the influence of stance on the lower limb is transmitted to the swing lower limb via the hip. So, this paper focused on the motion of the hip joint.
Therefore, if the hip motion was equal to normal walking only at the initial and final points of phase B, phase D would be unaffected by phase B and the gait would be cyclic. The detailed analysis configuration will be explained in
Section 3.3.
3.2. Human Body Model for One Ankle Analysis
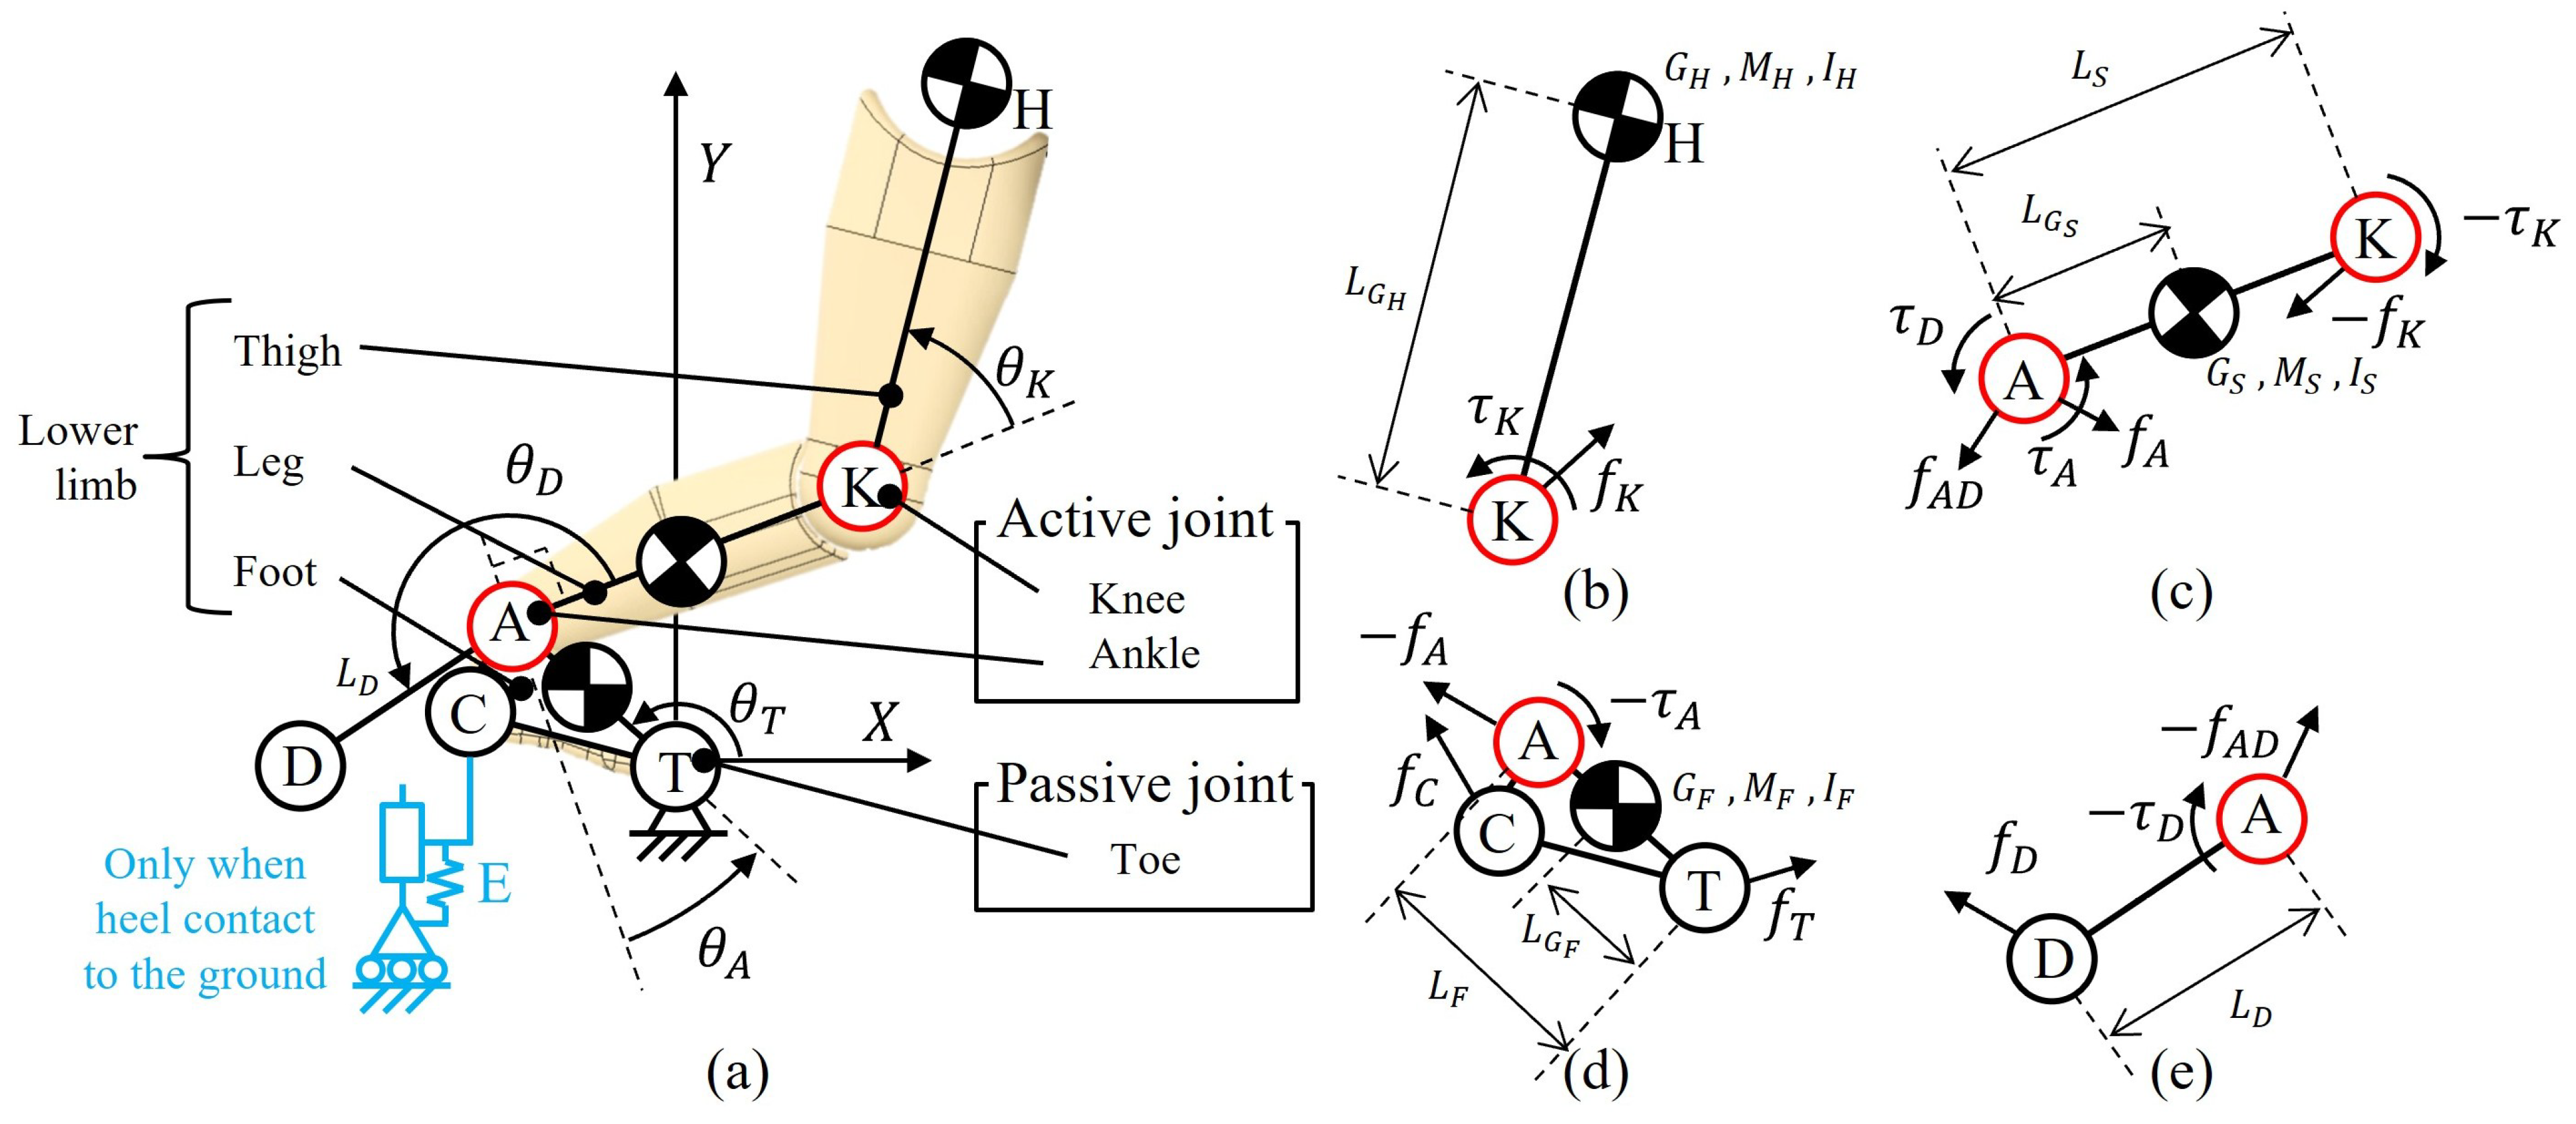
In this work, it was assumed that at the stance leg phase B would exert a larger impact on the analysis results than the leg in the swing phase. Thus, the analysis was limited to the stance leg. The human body was modeled with a serial planar three-link mechanism comprising the foot, leg, and thigh. The upper end of the thigh link gave the hip position. The mass of the left leg and upper body was concentrated at the hip point as a point mass. The ankle and knee joints were modeled as active joints, and the toe joint was modeled as a passive joint. The mechanism showed three degrees of freedom (DOF) in the sagittal plane. However, only two joints (ankle and knee) were controlled, with the toe joint being uncontrollable giving the feature of the underactuated model. In this model, the posture of the mechanism was not fixed in one posture even if the position of the hips was determined. However, it was necessary to use the two DOF active joints to move the passive toe joint to generate a desired motion. The definitions of joint angles and torques for the analysis model are presented in
Figure 5. The assumed values are listed in
Table 1.
The detailed explanation of these parameters is as follows:
About point: A, C, D, H, K, and T represent the ankle joint, heel contact point to the ground, assistance link tip contact point to the ground, hip position, knee joint, and toe contact point to the ground, respectively.
Link length: Link TCA, AK, KH, and AD represent the foot link, leg link, thigh link, and assisting device link, respectively. Links foot, leg, and thigh are called lower limb. represent the link length of the foot, leg and assisting link. is the position of COM of foot thigh leg link. is the same point with H. is the length from T to . is the length from K to . is the length from A to .
Mass and Inertia: represent the mass of the foot, hip, and thigh, respectively. represent the moment of inertia of the foot, thigh, and leg, around the center of mass of each link, respectively.
Force and moment: is the force acting on the leg from the foot at point A; is the force acting on the leg from the foot at point A; is the force acting on the thigh from the leg at point K; is the force acting on the toe from the ground; is the force acting on the heel from the ground; is the force acting on the assisting link from the ground at point D.
is the torque acting on the leg from the foot at point A; is the force acting on the leg from the foot at point A; is the force acting on the thigh from the leg at point K,
Angle: is the angle between Y axis and line TA. is the angle between line AT and the line perpendicular to line AK. is the angle between line AK and line KH.
Coordinate system: A fixed coordinate system T-XY is defined so that the X and Y axes represent the horizontal and vertical axes, respectively. The point of origin is T. So the component of point H is represented as ().
The mass, moment of inertia and center of gravity of each body segment such as the foot and lower leg were obtained from statistical data [
20]. These are the statistical data of the ratio of each link to full body mass. The full body mass is 58 kg in this analysis based on the walking database [
21].
The positive direction of the ankle joint was defined as the dorsiflexion displacement from the perpendicular line of the lower leg link according to the standards of the Japanese Society for Fracture Therapy [
22] to facilitate the visualization of the maximum dorsiflexion angle.
The active joint torques (ankle:
, knee
) were formulated by PD control that is based on the angular deviation between the target joint angle (
) and the present joint angle (
). First,
, knee
were given by these equations.
with
as the position gain of the ankle joint,
as the position gain of the knee joint,
as the deviation gain of the ankle joint and
as the deviation gain of the knee joint. The magnitude of the P-gain was defined based on the literature [
23], and the magnitude of the D-gain was set to 10% of the P-gain set by trial and error to decrease oscillation like PD parameter tuning of robot. When the difference between the joint angle and ROM limitation came within
6°, the following values were substituted for
in the equation of motion, assuming that the torque due to the stiffness of the joint works.
The reaction force when the heel was in contact with the ground was modeled by a spring model
E, as shown in
Figure 5a drawn with a blue line. The spring constant
as shown in
Table 1 was obtained from the gait data [
21]. The slope was determined by the least-squares method from the relationship between the force acting on the heel and the heel height, and was set as
. In these gait data, the heel
C is already on the ground at the initial phase B, and the ground reaction force is already active, and the size of the force is
from the gait data [
21]. So
can be as follows.
3.3. Constraints for One Foot Analysis
Using this model, the new walking posture for patients with ankle problems was considered. The shape of walking postures was almost free but some constraints were given using human walking data [
21].
First, the initial posture and motion of the right lower limb of phase B were fixed to normal human walking data as shown in
Figure 6a. The location and velocity of each link were fixed. There are two reasons.
- −
One is that the normal walking posture will be possible at the initial phase B because ankle torque and ankle dorsiflexion angle at this phase are small values in normal walking.
- −
The other is that the normal walking posture at the initial phase B is suitable to absorb the shock of ground contact impact force because the heel is contacting the ground and the knee joint is straightened.
So the location and velocity of each link of the right lower limb were fixed to the normal walking data of the initial phase B. This means the shape of the left lower limb at the initial phase D should be equal to the shape of the right lower limb at the initial phase B as shown in
Figure 6b because phase D is a copy of phase B.
Second, the hip position and velocity of the final phase B were fixed to normal human walking data as shown in
Figure 6c. This is because the hip position and velocity were set as constraints by the initial phase D. Phase C is a very short time and the hip position cannot change by a lot. By these constraints, at connecting phases B and D, the analysis result would be cyclic walking. However, only the hip velocity perpendicular to the ground was not set as a constraint in this work, because such a velocity can be canceled easily by heel contacting shock.
3.4. Normal Walking Analysis
The data from file 0094_01_M_72_157_58_BL from the AIST gait database 2019 [
21] were used in the analysis as gait data for healthy subjects. These data represented the gait of a 72-year-old, healthy male with a height of 157 cm and a weight of 58 kg. The data included motion capture data sampled at 200 Hz, from which the position data of the toe, ankle, knee, and hip joints were used. From the ground reaction force data of the left foot, the section where the floor reaction force becomes zero, the time when only the right foot is grounded was identified. Consequently, the initial and final of the motion capture data were identified. The duration of the analysis was determined by the
x position of the hip joint
. The analysis was performed from the time when the
x-coordinate of the hip joint
is at
until it reached
. From Reference [
21], a set of data of time and joint position of human walking
were obtained. From these data, the angular displacement of each joint
was calculated. And the dataset of
was obtained. These data were used to approximate the relationship between
and
, or between
and
by fifth-power polynomials according to the least square method to obtain Equations (
6) and (
7).
The order of the polynomial was set to the fifth order because it is sometimes used for analyzing walking [
24]. The initial velocities at the toe, ankle, and knee joints at the initial of phase B were provided to the analysis model by human walking data [
21], and PD control was applied during time
when the hip position moved from the initial position of Phase B to final position of Phase B in the gait data.
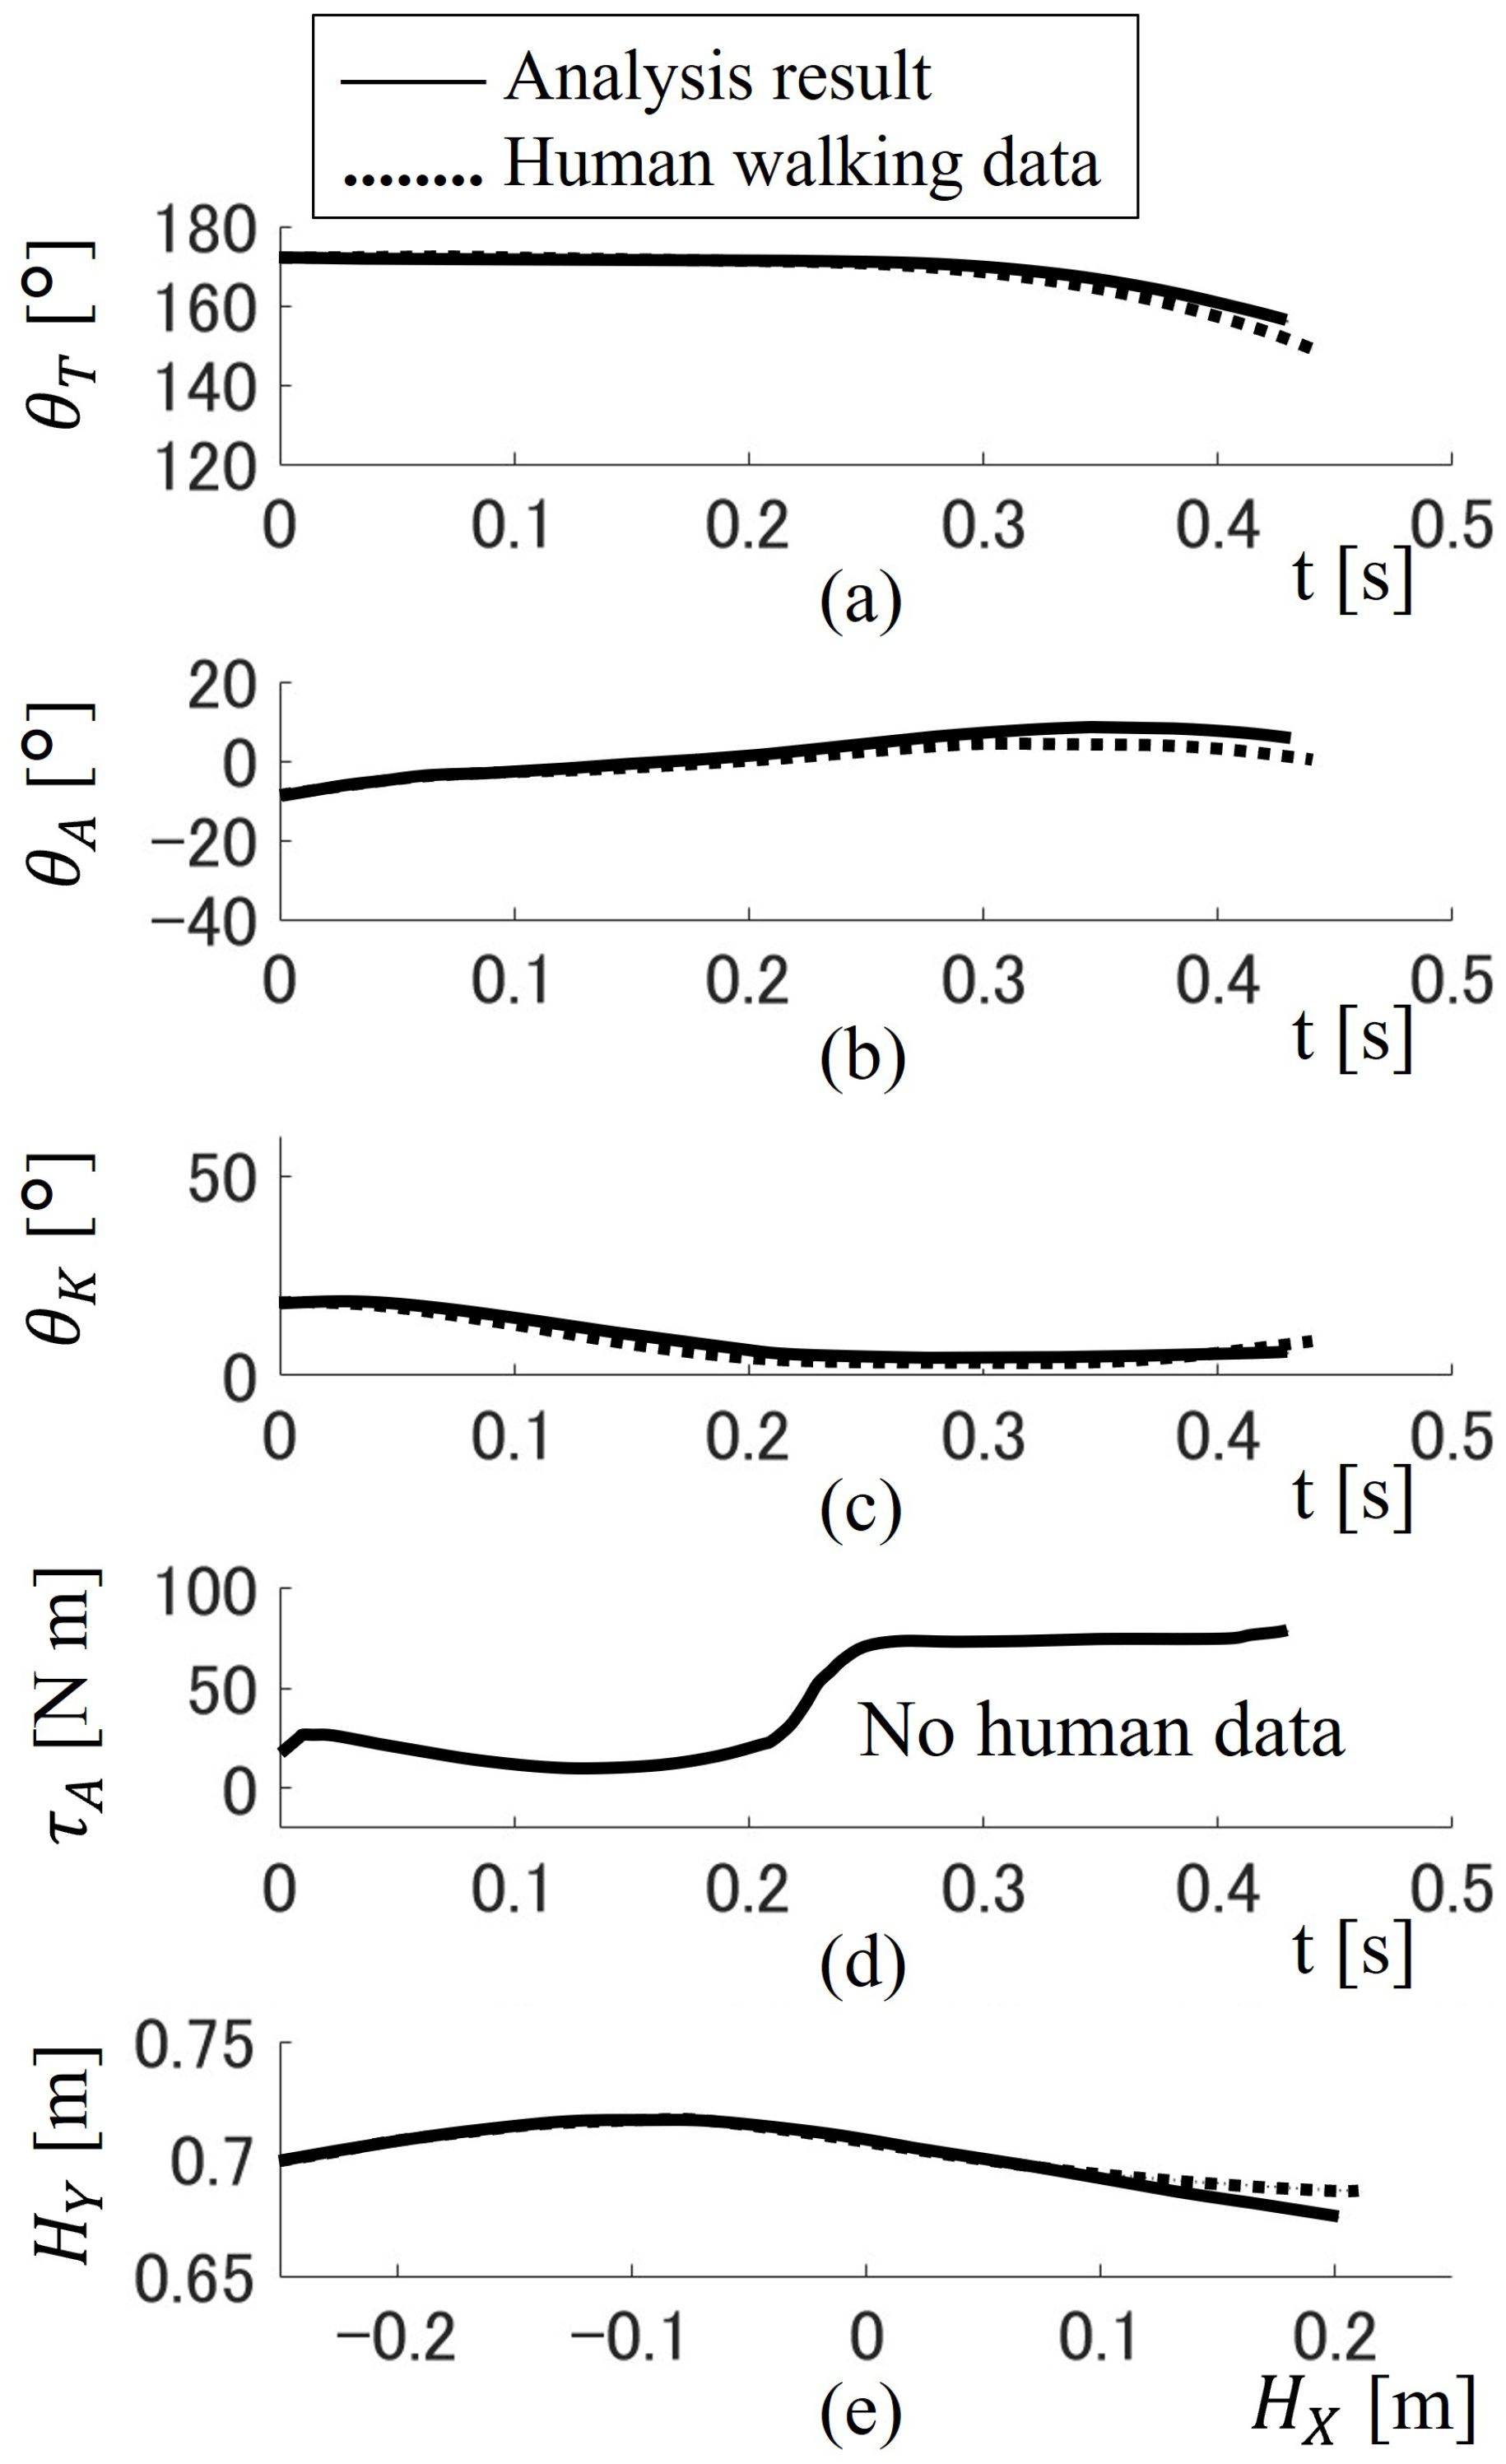
The results of the analysis are shown in
Figure 7 as a function of time. For (a) through (d), the horizontal axes are time
t. The vertical axes represent the toe angle
, ankle joint angle
, knee joint angle
, and ankle torque
for a gait. As for (e), the horizontal axis is the
x position of the hip joint
. The vertical axis represents the hip
y-position
for a gait. The results of the walking analysis without assistance are indicated by the black line. The real human walking data from reference [
21] used as control targets are indicated by the black dotted line. The maximum angle data error of
,
,
is around 5°. The maximum hip point H error is around 0.01 m. Analysis results almost follow the human walking data. After this result, all analysis data will be compared to the analysis result (not actual human data) of
Figure 7 to increase the reliability of the analysis result. The analysis results generally agreed with the gait data, suggesting that the analysis was performed appropriately.
The representative values from the analysis results are listed in
Table 2. The main consideration from the analysis of the results can be found in the table.
Although the analysis is generally adequate, some modeling errors can be seen in the position and velocity of the hip joint at point F. For the sake of proper comparison, only the analysis results will be discussed hereafter.
It was confirmed that the joint angles of the analysis results were within the range of motion of a healthy subject.
The force acting on the toes was always positive, confirming that the toes never left the ground.
The analysis model represents the functionality of human gait since the analysis results could be appreciated well in agreement with natural walking as in [
21].
3.5. Walking Analysis with Assisting Device
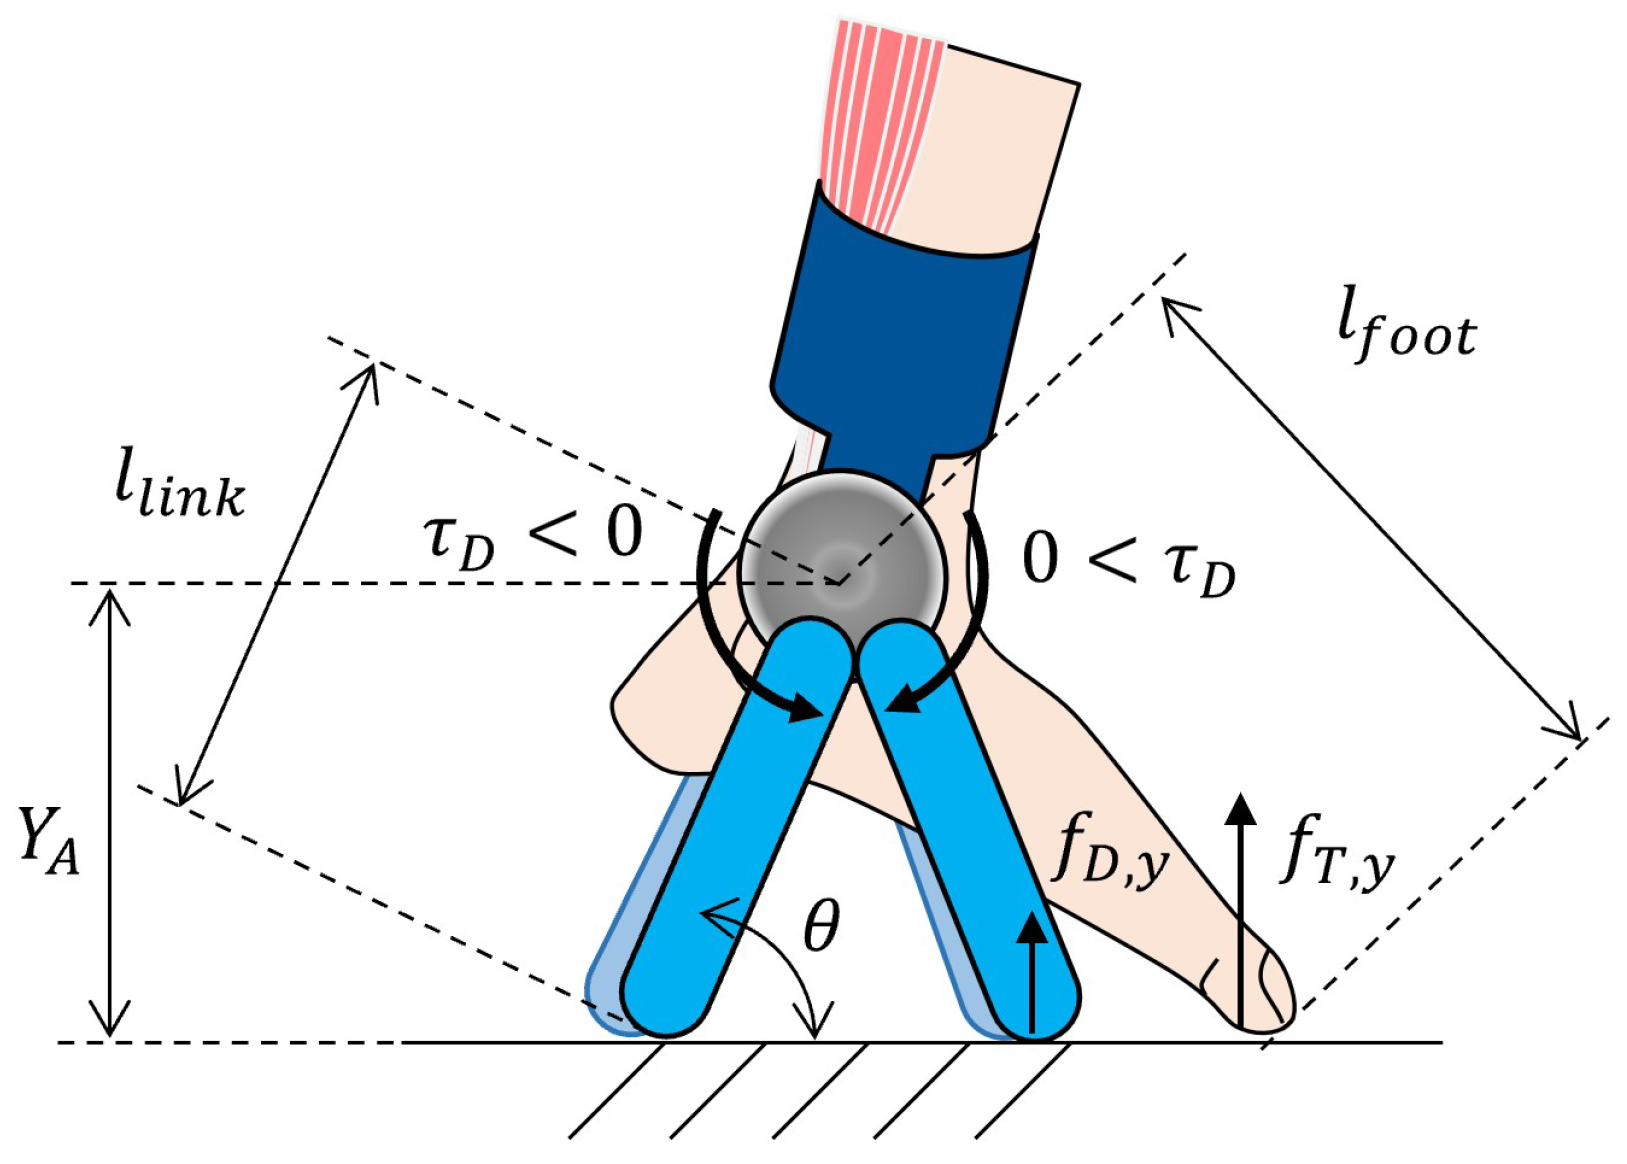
The assistance torque was generated in two ways: when the tip of the independent link was grounded forward from the ankle joint and when the tip of the link was grounded backward from the ankle joint as in the scheme in
Figure 8.
As the contact force at the tip of the independent link must be positive, the assistance torque acting on the leg was positive when the independent link was on the forward side. When the independent link was on the backward side, the assistance torque was negative. The ratio of the pushing ground force of the independent link
to that of the toe
gave the assistance ratio
. The assistance ratio was ranged from −1 to 1; a positive assistance ratio indicated a forward side assistance and a negative assistance ratio indicated a backward side assistance. Thus, the ground reaction force of the link can be expressed as
where
is the height of ankle joint in
Figure 8. Then, the assistance torque can be expressed using the angle
of the link to the ground as
in which
is the length of the independent link; the length was set in the range of from 0.05 m to 0.2 m.
The assistance conditions in the case of forward assistance are listed in
Table 3.
The assistance ratio and independent link length m.
The results of the analysis are shown in
Figure 9. For (a) through (d), the horizontal axes are time
t. The vertical axes represent the toe angle
, ankle joint angle
, knee joint angle
, and ankle torque
for a gait. As for (e), the horizontal axis is the
x position of the hip joint
. The vertical axis represents the hip
y-position
for a gait. The results of the walking analysis with assistance are indicated by the red line. For comparison, the analysis results without assistance are indicated by the black solid line. Since the control target of the human joint angle remains the same and is described by Equations (
6) and (
7), the shape of the graphs of ankle
and knee
are almost unchanged from that without assistance. However, the toe angle
is changed by the assistance. This is because the toe was modeled as free rotational joint. By this change in
, the hip trajectory will be changed. The result should be checked for if it is appropriate as human walking or not.
The representative values of the analysis results are listed in
Table 4. The
results became 0.54 m/s. This value differs significantly from the analysis result of without assistance, 0.74 m/s. Since the difference in
is undesirable for ensuring the periodicity of gait, this assist result is classified as inappropriate for walking.
Like this, the appropriate analysis results were chosen from all analysis results. The appropriateness of the assist as a gait is evaluated by the five items shown in
Table 4. First, the height of the hip position
should be almost the same as the normal walking simulation results (the error should be below 1 mm in this work). Second, the hip velocity in the horizontal direction
should be almost the same as the walking simulation result (the error should be below 1 mm/s in this work). Third and fourth were the requirements for the angles of the ankle and knee joint angles. These should not be out of ROM. Fifth was the requirement to contact the toe to the ground in phase B. It means the vertical component of the force should be a positive value.
3.6. Analysis Considering Human Adaptation to Assist
Since humans become accustomed to the motion of assistance, their gait trajectory can be expected to be different from that before the assistance. As an example, the target gait trajectory was changed to Equations (
10) and (
11).
Equations (
10) and (
11) are calculated by changing the shape of Equations (
6) and (
7). The detail is explained in Equations (
14) to (
25).
The results of the analysis were shown in
Figure 10. It could be noted that the target trajectory has changed, resulting in a significantly different gait trajectory when compared to the unassisted trajectory.
The representative values of the analysis results are shown in
Table 5. In many studies, when the target walking posture is not unknown, walking analysis was optimized by minimizing the objective function. Many kinds of objective functions were used like deviation from target walking speed [
25], muscle tension roughness [
25], joint ROM [
26], and specific resistance [
25,
26,
27,
28]. Specific resistance is the walking energy divided by walking length. In this work, the target posture was approximated by a polynomial, so the ankle torque roughness is small. The hip joint location and velocity and joint ROM were checked in this table. Also, toe force was checked to analyze only the contacting phase. Also, minimizing walking energy should be considered but this is discussed in
Section 4. In this paper, the condition that all the tables become pass and minimize ankle torque was thought of as a good adaptation by humans. In
Table 5, humans adapted to the assistance well and were able to pass all the evaluation items. The generation method of human-adapted gait motion will be explained in
Section 4.
4. Method
In this work, the human walking analysis described in the previous section was conducted several times by changing parameters. This section examines evaluation indexes, analysis workflow, and the analysis conditions.
4.1. Evaluation Indexes
The analysis results for feasible assisted gait were evaluated based on the following two evaluation indexes:
Based on the ankle angle
analysis results, the maximum ankle joint angle
was obtained as a representative value of ankle joint angle as
The time-integrated ankle plantarflexion torque
was calculated as a representative value of ankle joint torque as
where
is the time of initial of phase B, and
is the final of phase B. If
is sufficiently small, it implies that the patient can walk within his/her ankle joint ROM by assistance; thus, ROM assistance is achieved. If
is sufficiently small, the patient can reduce his/her ankle joint torque by assistance; thus, torque assistance is achieved. Evaluation indexes were compared in
Table 6 for the analysis of normal walking, with assistance and after human adaptation in
Figure 10. In these two examples, after assistance,
became smaller and it reached 2.93°. It means the patient whose ankle joint dorsiflexion ROM is 2.93° and more can walk with this assistance, also
become smaller. It means that the required patient’s ankle torque will be smaller.
4.2. Analysis Work Flow
Analysis was conducted for various walking postures of a human for each assistance condition
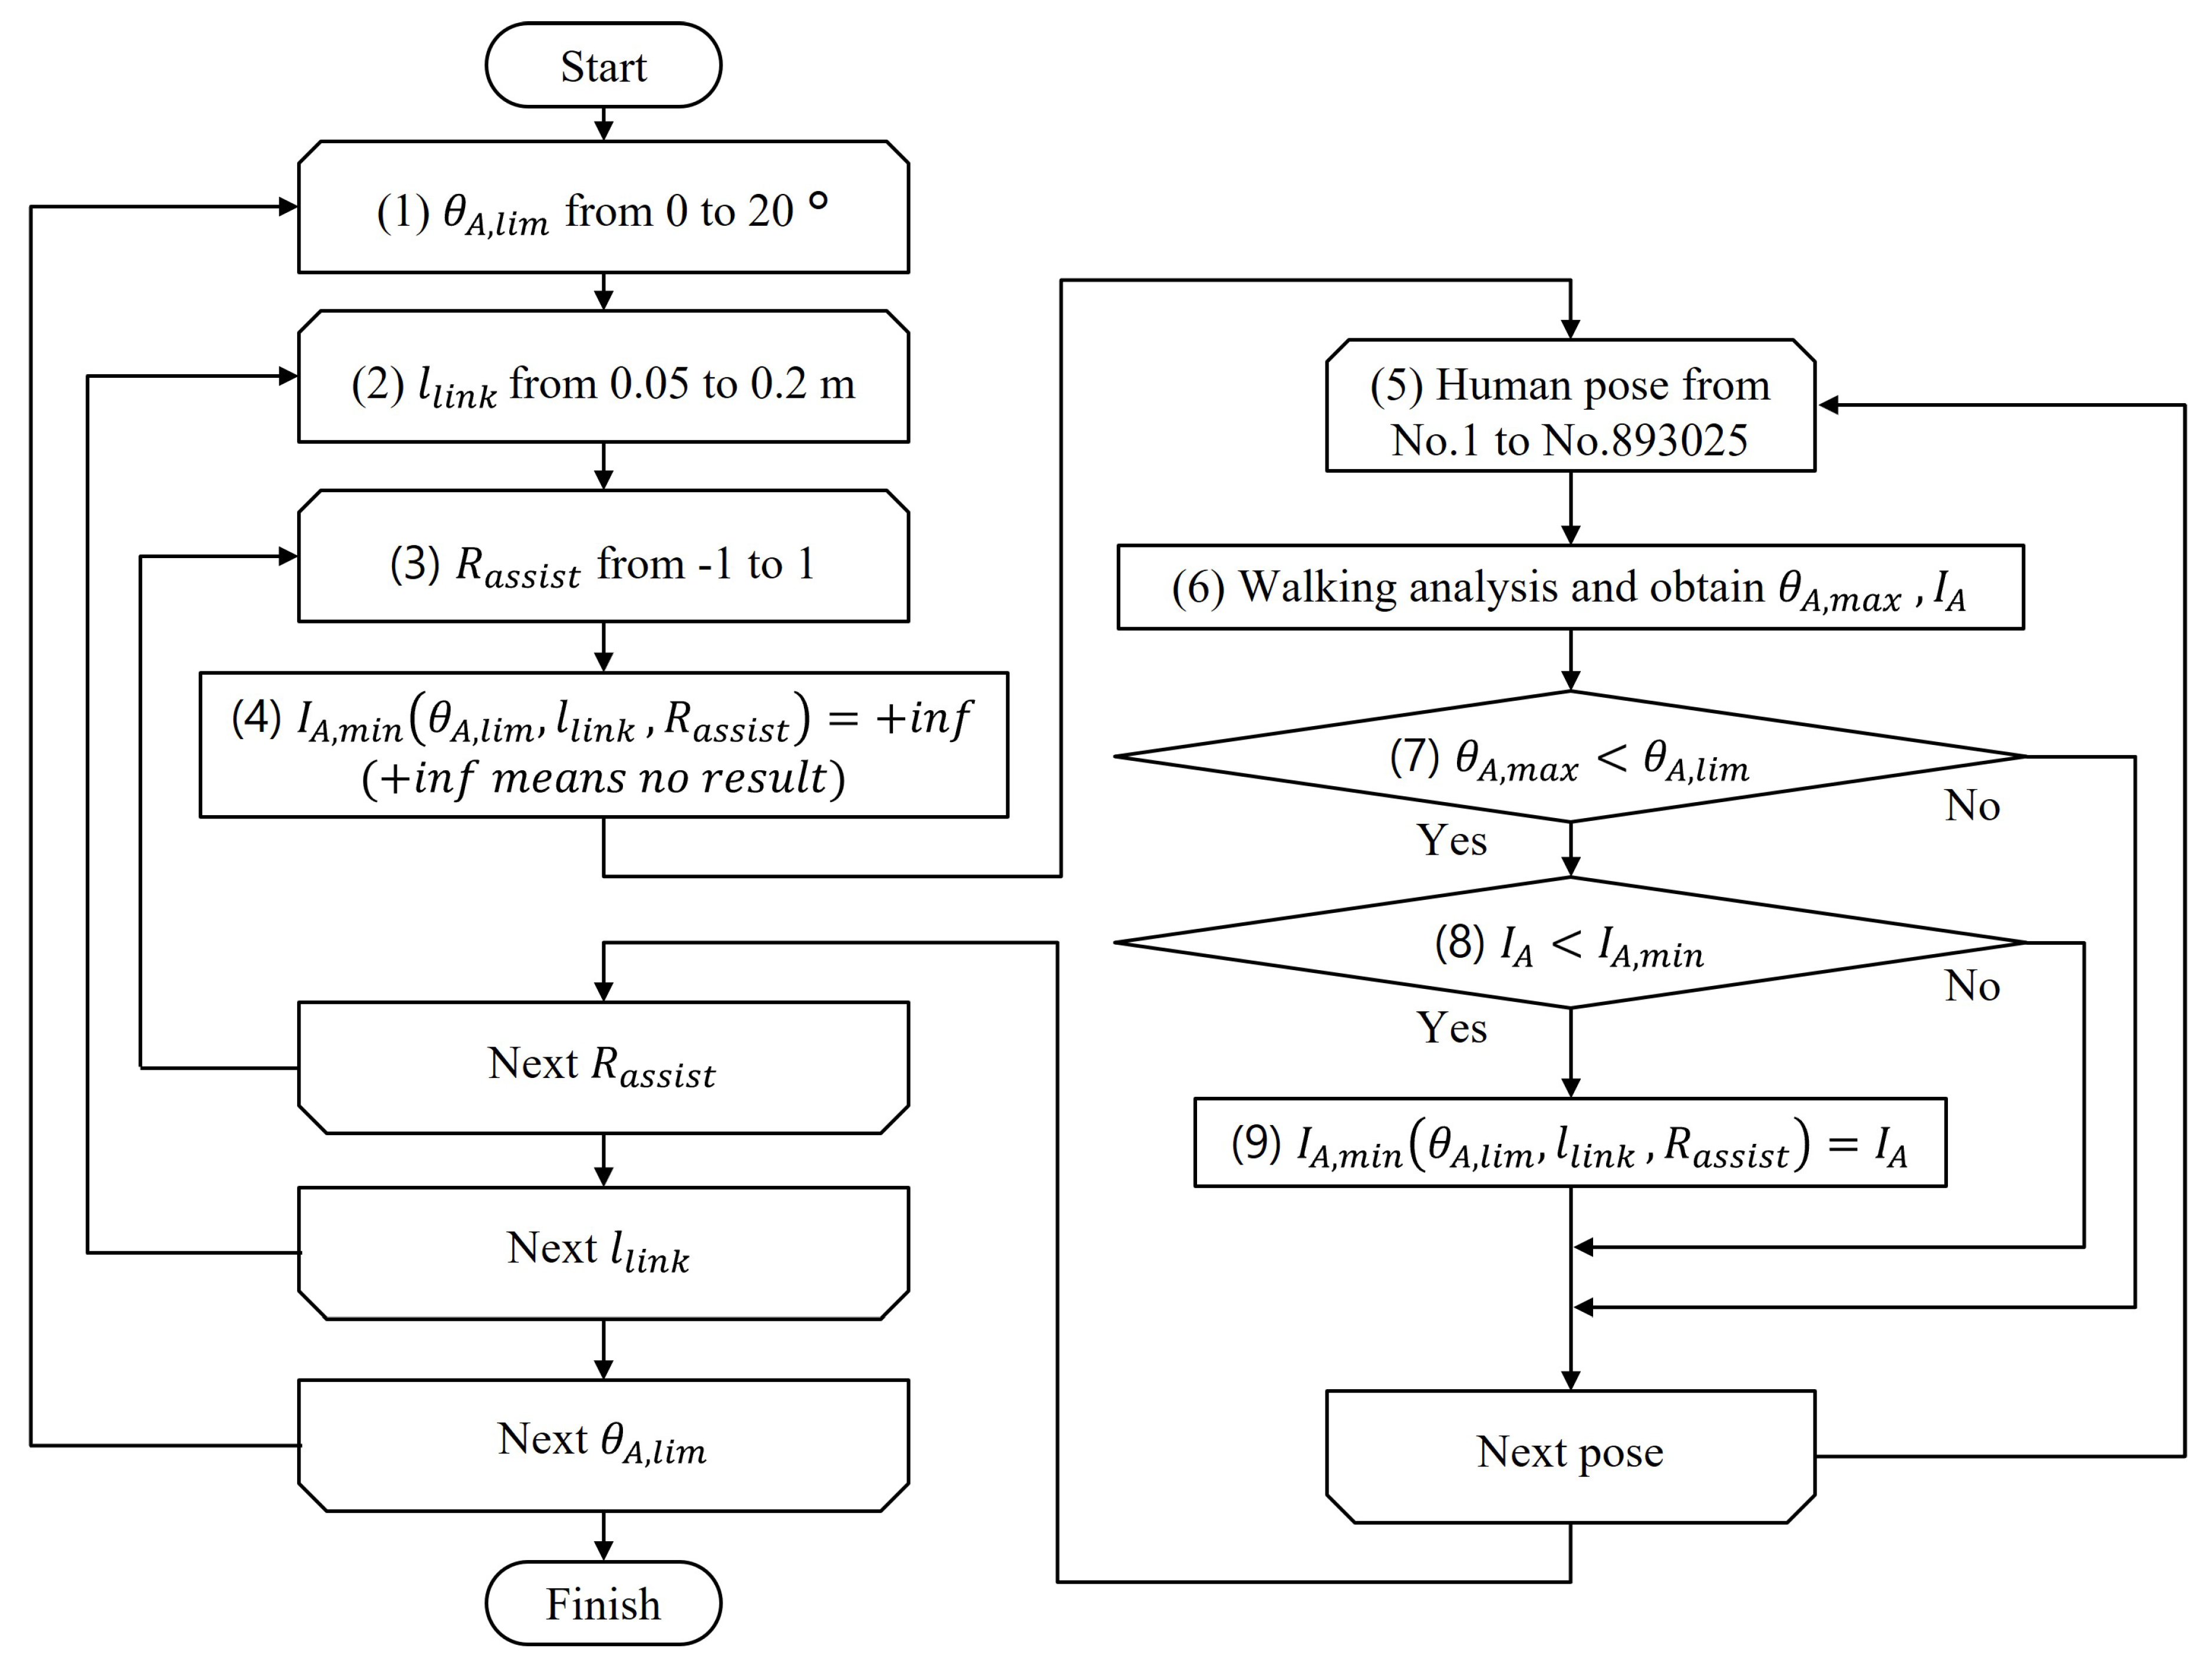
in each given ankle dorsiflexion ROM. The work flow of the analysis is summarized in
Figure 11, with the specific procedure as follows:
Human ankle dorsiflexion ROM limitation was determined.
Assistance conditions were determined.
Assistance conditions were determined.
(which is the function of ) was set to +inf means “no result”.
One human posture was generated.
Walking analysis was conducted and the evaluation indexes are obtained.
Human can not walk using ankle joint out of ROM. So, if the obtained was less than the patient’s dorsiflexion limitation , go to the next step.
if obtained was less than , go to next step.
Of the postures that satisfy these requirements, Humans are considered to walk in the most comfortable walking posture. should be as small as possible. So, was recorded to .
4.3. Analysis Conditions of Human Joint Control Target
Based on the workflow in
Figure 11, the way to determine the value of these four parameters below is explained: human ankle dorsiflexion ROM limitation
, assistance condition
, human walking target pose.
was analyzed with 20 types ranging from 1 to 20°.
was analyzed with 16 types of theta ranging from 0.05 to 0.2 m.
was analyzed with 21 types ranging from −1 to 1.
The target joint angle for PD control was generated as follows.
In the analysis, the hip position moved from point
to point
. Thus, the target joint angles were generated as a function of the
x-coordinate of the hip position
.
moved from
to
. The motion of the ankle and knee joints were PD-controlled to follow that function in each hip
x position. To select a good posture among the various walking postures, it was necessary to generate many target paths for the ankle and knee joints. First, the joint angle during walking of a normal subject was assigned as a function of the
x-coordinate of the hip joint, as shown in function F1 in
Figure 12.
The conditions required for the target joint trajectory to be generated by F1 were as follows;
The target joint trajectory must be a function of the x-coordinate of the hip joint .
The initial angles and angular velocities must match function F1 to satisfy the continuity of the gait.
The shape of the function should be close to that of the function F1 to generate the functions efficiently.
To satisfy these conditions, the function F2, which was a polynomial approximation of F1 considering the need to satisfy the initial conditions for the function F1 was generated. Further, the function F3, which is a perturbation of F2, was generated by shifting the coefficients of the function F2. When the degree of the polynomial approximation was
n,
(
) is expressed as follows.
The coefficients of each term,
∼
were found. Equation (
14) should satisfy the following initial conditions:
The initial condition is substituted into Equation (
14) and
are eliminated to obtain
Data
, which are from
to
, are substituted into Equation (
17) to obtain
This is written in the matrix form as follows:
When
,
does not exist. Then, the pseudo-inverse matrix can be used to determine the parameters from
to
of function F2.
where
X matrix is as follows:
Next, a perturbation
is applied from
to
as follows:
Finally, by substituting Equation (
23) into the initial conditions Equations (
15) and (
16), all coefficients of the function F3 are obtained as follows
The order of the polynomial approximation
n was set to the fifth order, because it is sometimes used for analyzing walking [
24]. The parameters to be perturbed were four parameters from
to
for the ankle and knee joints, respectively. Thus, we obtained a total of eight parameters.
The conditions of the analysis are summarized in
Table 7. The appropriate walking posture involved
combinations of perturbations. Including human ankle joint ROM and assistance conditions, a total of 6 billion walking analysis were worked out. As this number is excessive, the candidates should be narrowed down to approximately one-tenth before calculating the dynamics. The
y-coordinate of the hip joint at point F was calculated based on the ankle and knee joint target angles. The values that deviated significantly from that of a normal gait were eliminated.
Finally, the rate of reduction in the ankle load
was calculated by Equation (
26).
is
of normal walking in
Table 6 and the value is 19.4 [N m s].
5. Analysis Results
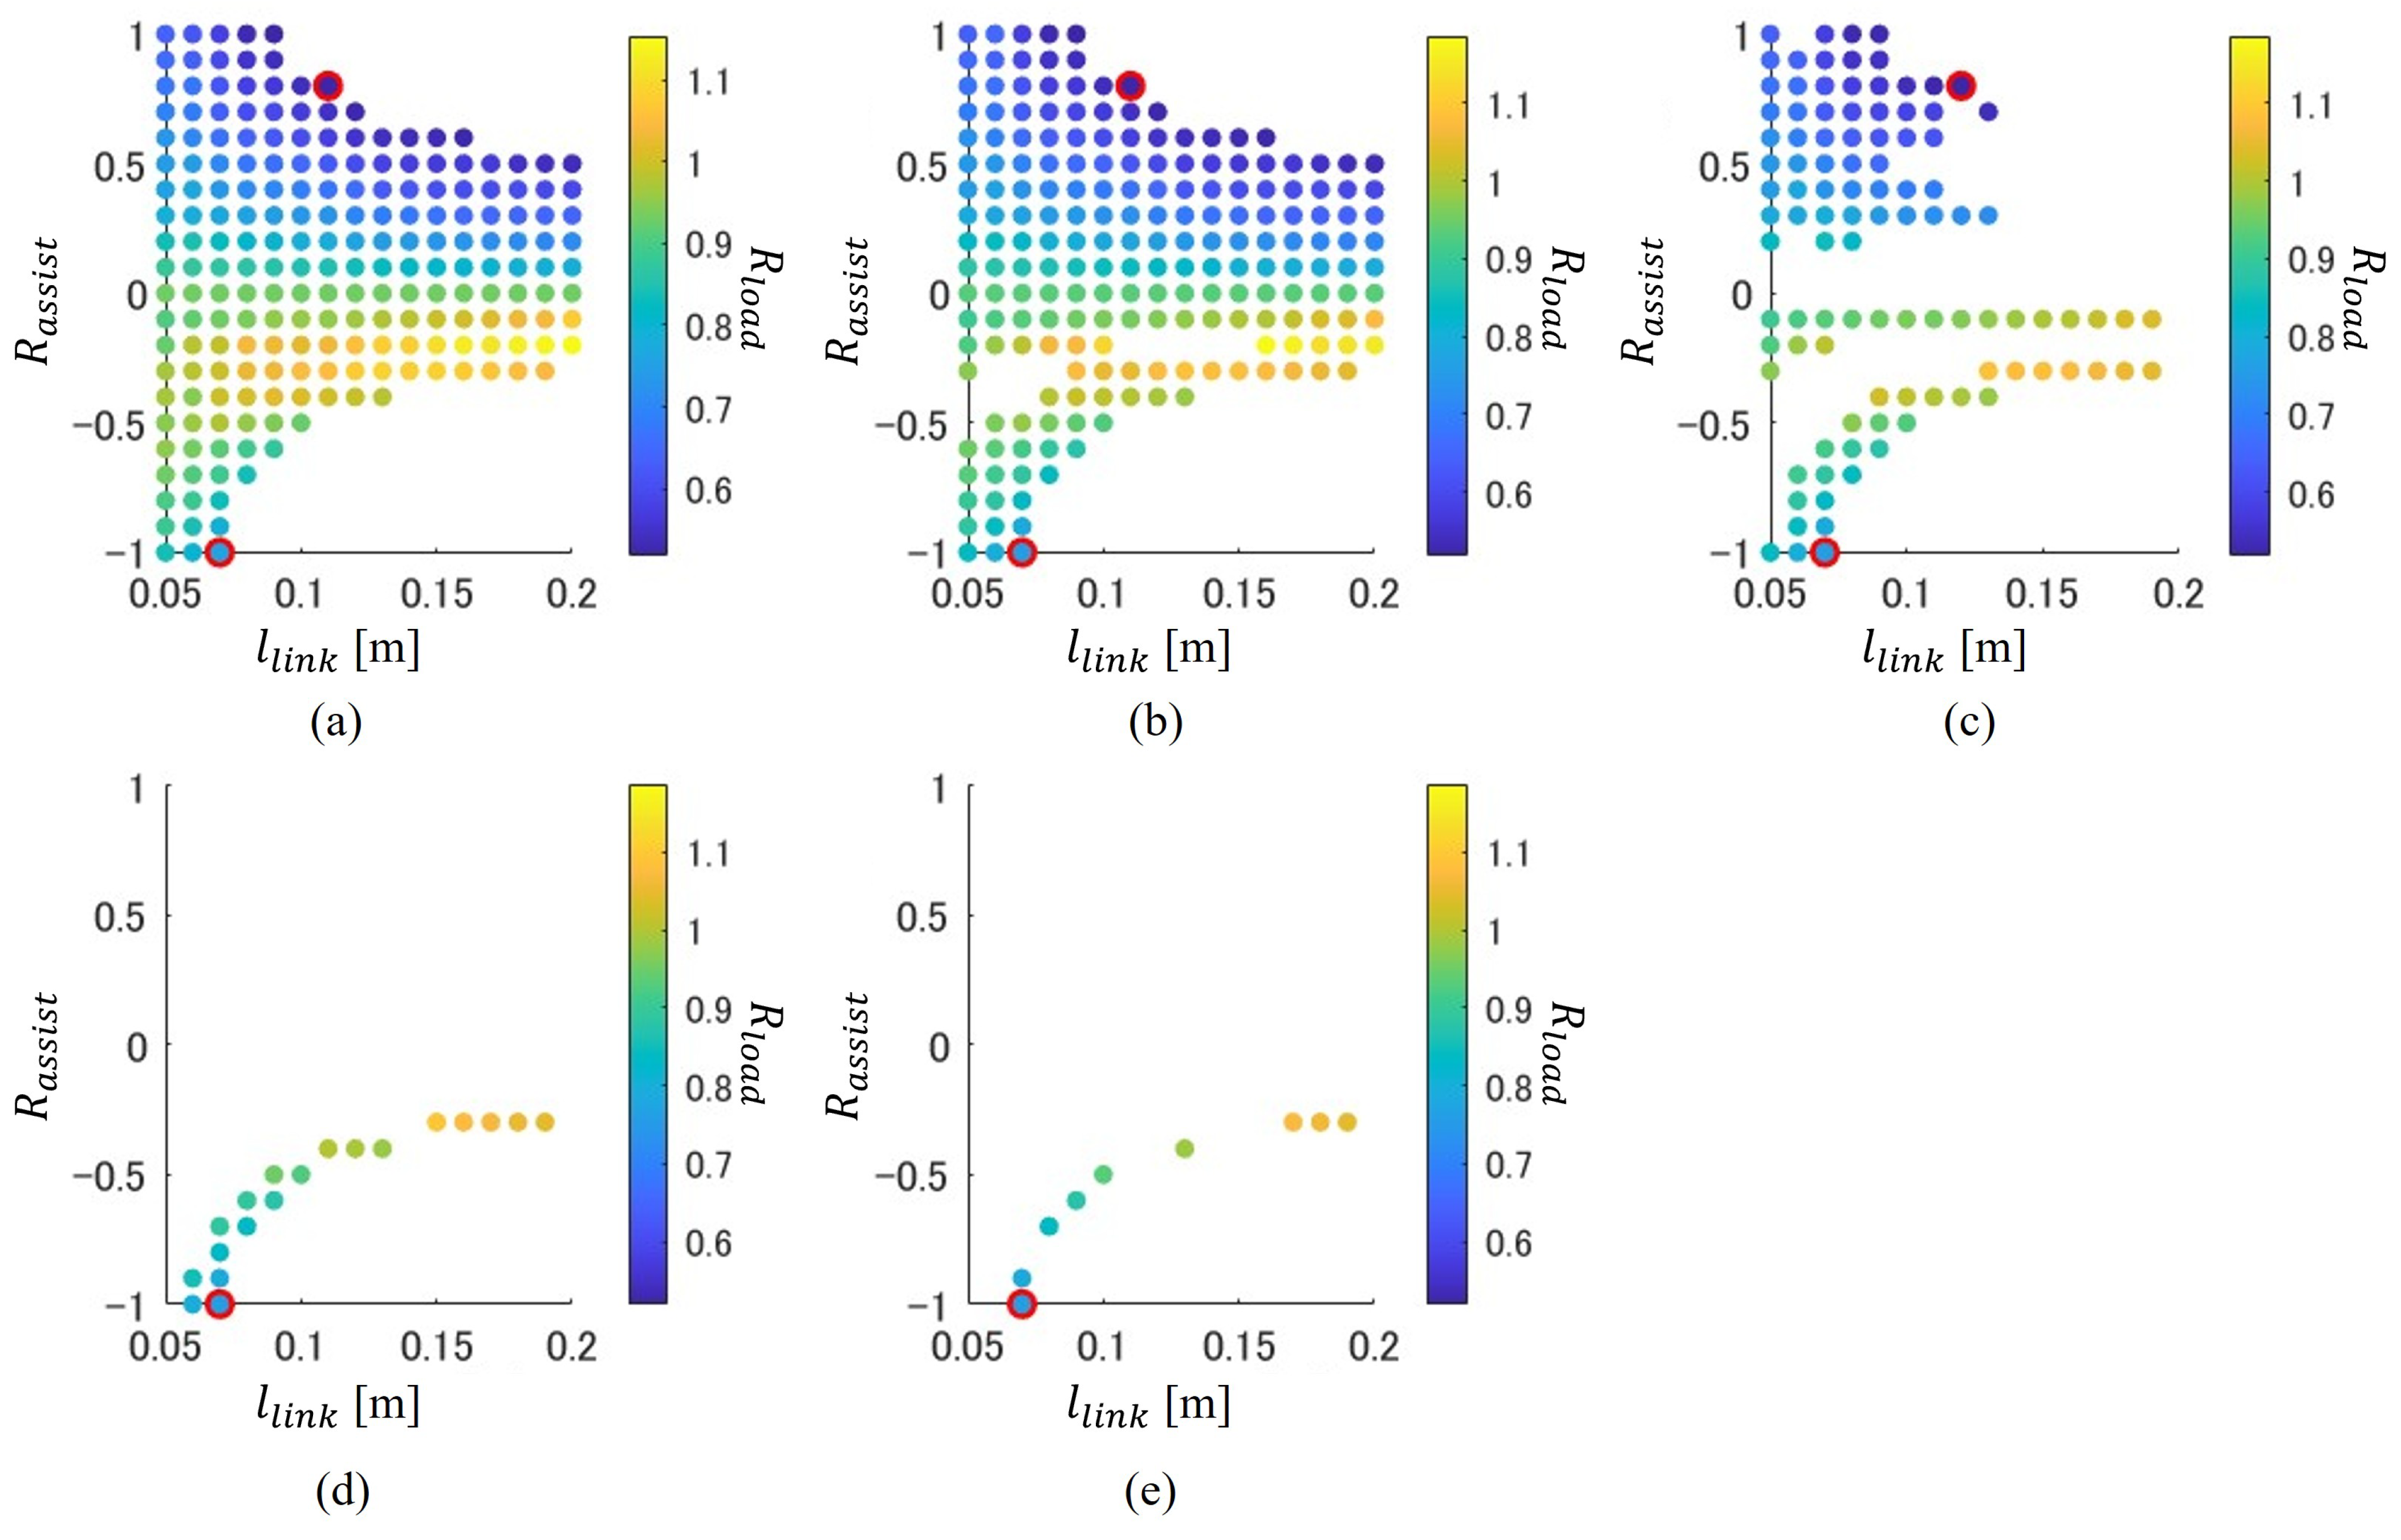
is plotted for each assisting condition, as shown in
Figure 13. For each figure, the horizontal axis represents one assisting condition: link length
and, the vertical axis represents another assisting condition: assisting ratio
. Each (a) to (e) represents the difference in the ankle angle condition. (a) shows the analysis results that the maximum ankle angle
is 11° and below. It means that patients whose ankle dorsiflexion limitation
is 11° and more can use the assistance condition shown in (a). The patients whose ankle dorsiflexion limitation
is below 11° can only use some assisting conditions of (a). In the same way, the patients whose ankle dorsiflexion limitation
is 9° can only use the assisting condition of (b); 7° can use only the assisting condition of (c); 5° can use only the assisting condition of (d); 3° can use only the assisting condition of (e). These figures are as follows:
By changing the assistance condition , the value of was changed, which means that the intensity of the assistance can be controllable.
As the patient’s ankle dorsiflexion ROM limitation angle becomes smaller from (a) to (e), the number of dots decreases.
Focusing on front side assistance () for patients with mild symptoms of limited dorsiflexion ROM (large like (a), (b), (c)) it is possible to be assisted by strong torque (small ). However, the patients with severe symptoms of limited dorsiflexion ROM (small like (d), (e)) cannot assisted.
Focusing on back side assistance (), all patients from (a) to (e) can be assisted. However, the torque assistance effect is not strong compared with front-side assistance (the minimum of back side assistance is larger than that of front side assistance).
The red marker represents the best performance data, which represents minimum value, frontal assistance and rear assistance separately. The best assisting parameter of each patient is not affected by the dorsiflexion limitation of each patient.
The best performance assisting condition is summarized in
Table 8. From each graph of
Figure 13, the point of the minimum ankle torque load reduction ratio
is picked up; front assistance and back assistance are separate. For front assistance, the best performance decreases 48% of the ankle load. This is when
= 0.11 or 0.12 m, and
= 0.8. For back assistance, the best performance decreases 24% of the ankle load. This is when
= 0.07 m, and
= −1.0. Also, using
Figure 13, sensitivity is discussed below.
First, the sensitivity of the different ankle dorsiflexion limitation angle is discussed. From Figure (a) to (c), the best parameter of front assistance is almost not changed. From Figure (a) to (e), the best parameter of back assistance is almost not changed. This is a good point as the device parameter does not need to change. However, it also means that the patients who can dorsiflex large will walk not dorsiflex large with assistance. It may become over-assisting.
Next, the sensitivity of different assistance parameters is discussed. As shown in the figure, the red-circled best assistance point is located on the edge of the assistable area. For example, as for the red circled point of of (a), continuous assistance is possible when or changes to become small. However, assistance is not possible when or changes to become too large. It should be considered to not use the edge parameter in the actual device control. The red circled assistance of of (e), assistance is not possible if or changed to any direction. Human walking condition detection and feedback should be considered in actual device control.
Patient groups who can be assisted in this work are shown in
Figure 14. The horizontal axis is the patient’s ankle dorsiflexion ROM angle
and the vertical axis is ankle joint torque load ratio
. In this figure, the assistance conditions
were ignored and evaluation indexes
were emphasized. For example, all plots of
Figure 13a are plotted in the red squared area (a) in
Figure 14. The analysis result of unassisted is indicated by a blue circle marker. The area to the left and below the unassisted blue marker point is the parameter for which the assistance improves in both evaluation indexes
.
The existence of a dot in this region indicated that both torque assistance and ROM assistance could be realized simultaneously.
For patients with large (7° or more), the ankle torque load was able to be reduced by 60%.
For patients with small (2° or more, 6° or less), the ankle joint torque load was able to be reduced by 30%.
Under the assistance condition of this analysis, the assistance can be realized up to .
To achieve the performance plotted in
Figure 13 and
Figure 14 required 70 N m and 12 rad/s for actuator of independent link.
6. Discussion
For front assistance, large torque assistance was achieved at about 48%, decreasing without assistance. However, almost no ROM assistance was achieved. The maximum ankle angle of the analysis result without assistance was 8.4° but it only decreased to 7° after the analysis of assistance. This is thought to be due to the link tip contact point. The link tip contact point of front assistance is almost similar to the toe of a human. This means that the dynamic effects of the independent links are similar to a human foot. This mechanism results in the main effect of front assistance sharing torque with the human foot and an independent link. It is thought that the effect of front assistance will be similar to an exoskeleton-type walking assisting device. These two types should be compared with another point. For example, the independent link type does not restrain the human ankle. This means that the ankle joint is basically safe against actuator control error, and the ankle joint can perform its ability, such as balancing well. On the other hand, the exoskeleton-type can assist the dorsiflexion motion of the swinging lower limb. This is good for defending against stumbling. More consideration is needed to compare independent link types and exoskeleton types in the future.
For back assistance, small torque assistance was achieved with about 24% ankle torque decreasing without assistance. Also, large ROM assistance was achieved. The maximum ankle angle of the analysis result without assistance was 8.4° and it decreased to 2° after analysis of assistance. The link tip contact point of the front assistance is different from the toe of a human. This means that the dynamic effects of the independent links are different from a human foot. This mechanism results in a large ROM assistance effect. The ankle joint dorsiflexion angle of 10° is required [
9]. However, the dorsiflexion ROM of a stroke patient is approximately 0° and it increases by approximately 2.4° after 6 weeks of rehabilitation [
10]. Two degrees after assistance means that an independent link-type walking assisting device can assist patients with stroke after rehabilitation.
Both the front and back assistance require a large assisting force at the contact point. When it assists the best performance parameter in this paper, the required assisting force at the assisting link tip is very large. This is 0.8 times the force of the toe at the front assistance, and 1.0 times the force of the toe at the rear assistance. It means that there is a large force acting on the human leg. So connecting part of the assisting device to the human leg should be designed to protect human skin. The assisting force is the cyclic force, the device should be designed to bear the cyclic force. Also, power consumption should be considered because a large torque is needed to rotate the independent link.
Also, the difference between analysis and device development will be discussed. In this paper, assistance effects were evaluated by ankle joint torque, calculated using the human body dynamic model. However, real human ankle torque cannot be measured directly, because ankle torque is a joint internal torque. Ankle joint torque should be estimated by other measured values. There are two candidates for the measurement value to estimate ankle torque. One is an EMG sensor to measure the muscle activity of the ankle joint plantar flexion muscle. The other is a force sensor to measure the ground contact force of the toe.
7. Conclusions
The potential of motion assistance in walking using an independent link attached to the lower leg was evaluated through analysis using a suitable dynamic model. The human body modeled with the right leg three links and the time when only the right leg was on the ground was analyzed. The dynamics analysis was varied by changing the proposed assist ratio for the toe force, link length, and target walking posture. The analysis was performed to examine changes in the maximum dorsiflexion angle of the ankle joint and the time integration of ankle joint plantar flexion torque. The main results of the work can be summarized in the following:
The effect of the independent link on ankle joint torque and the ROM of the analysis model was investigated with results of the analysis that confirm that the proposed device analysis model can assist the patient analysis model with limited ankle dorsiflexion ROM and low plantarflexion strength simultaneously.
For the patients analysis model with a mild dorsiflexion ROM limitation of the ankle joint (7° or more), it was found that walking within the ROM was possible and that a large torque assistance was possible by front side link assistance. The ankle torque load of the analysis model can be reduced by 60% using the proposed device.
For the patients analysis model with severe ankle dorsiflexion ROM limitation (2° or more, 6° or less), it was found that walking within the ROM was possible and that torque assistance was possible by back side link assistance. The ankle joint torque load of analysis model can be reduced by 30% using the proposed device.
This work is limited to walking in the human model analysis. The effect of real human walking should be considered by experiments in the future, based on the authors’ research plan below.
The authors are trying to develop an assisting device that helps patients with both ankle problems, i.e., ankle plantarflexion torque shortage, and ankle dorsiflexion angle limitation. An independent link-type ankle assisting device was proposed. To develop this device, the design method and control method of the device should be developed. This paper is the first step of device design. With this work, the feasibility of a device that can assist both ankle joint plantarflexion torque and dorsiflexion angle in the same assistance is proposed. However, this paper’s model uses the hypothesis that patients with ankle problems want to walk with a walking pose that minimizes ankle torque. This is the limitation of this work. In our future work, human subject experiments will be conducted related to this work. With this experiment, the hypothesis will be discussed and the model will be renewed. The plan is to develop efficient and effective devices through the interaction of analysis and experimentation. Also, other assistance effects like fall prevention or assistance on uneven roads will be considered in the future.
Author Contributions
Conceptualization, T.S., M.J., M.C. and Y.T.; methodology, T.S., M.J., M.C. and Y.T.; software, T.S.; validation, T.S.; formal analysis, T.S.; investigation, T.S.; resources, Y.T.; data curation, T.S.; writing—original draft preparation, T.S.; writing—review and editing, T.S., M.J., M.C. and Y.T.; visualization, T.S.; supervision, Y.T.; project administration, Y.T.; funding acquisition, T.S. and Y.T. All authors have read and agreed to the published version of the manuscript.
Funding
This work was founded by JST SPRING, Japan (Grant Number JPMJSP2106) and Grant-in-Aid for JSPS Fellows, Japan (Grant Number 24KJ1072) and JSPS KAKENHI, Japan (Grant Number 23H0 1326).
Data Availability Statement
The raw data supporting the conclusions of this article will be made available by the authors on request.
Conflicts of Interest
The authors declare no conflicts of interest.
References
- Morris, J.N.; Hardman, A.E. Walking to Health. Sports Med. 1997, 23, 306–332. [Google Scholar] [CrossRef]
- Vigen, A.; Zhang, Y.; Jean, P.; Le, B. Design concepts and functional particularities of wearable walking assist devices and power-assist suits—A review. In Proceedings of the 58th International Conference of Machine Design Departmants, Prague, Czech Republic, 6–8 September 2017; Volume 9, pp. 436–441. [Google Scholar]
- Fukumoto, T. Biomechanics of the ankle joint. Jpn. J. Rehabil. Med. 2016, 53, 779–784. [Google Scholar] [CrossRef]
- Grimmer, M.; Eslamy, M.; Seyfarth, A. Energetic and Peak Power Advantages of Series Elastic Actuators in an Actuated Prosthetic Leg for Walking and Running. Actuators 2014, 3, 1–19. [Google Scholar] [CrossRef]
- Salsich, G.B.; Mueller, M.J.; Sahrmann, S.A. Passive Ankle Stiffness in Subjects With Diabetes and Peripheral Neuropathy Versus an Age-Matched Comparison Group. Phys. Ther. 2000, 80, 352–362. [Google Scholar] [CrossRef]
- Lamontagne, A.; Malouin, F.; Richards, C.L.; Dumas, F. Mechanisms of disturbed motor control in ankle weakness during gait after stroke. Gait Posture 2002, 15, 244–255. [Google Scholar] [CrossRef] [PubMed]
- Takahashi, K.Z.; Lewek, M.D.; Sawicki, G.S. A neuromechanics-based powered ankle exoskeleton to assist walking post-stroke: A feasibility study. J. Neuroeng. Rehabil. 2015, 12, 1–13. [Google Scholar] [CrossRef]
- Zhang, J.; Cheah, C.C.; Collins, S.H. Experimental comparison of torque control methods on an ankle exoskeleton during human walking. In Proceedings of the 2015 IEEE International Conference on Robotics and Automation, Seattle, WA, USA, 26–30 May 2015; pp. 5584–5589. [Google Scholar]
- Mentiplay, B.F.; Banky, M.; Clark, R.A.; Kahn, M.B.; Williams, G. Lower limb angular velocity during walking at various speeds. Gait Posture 2018, 65, 190–196. [Google Scholar] [CrossRef]
- Cho, K.H.; Park, S.J. Effects of joint mobilization and stretching on the range of motion for ankle joint and spatiotemporal gait variables in stroke patients. J. Stroke Cerebrovasc. Dis. 2020, 29, 104933. [Google Scholar] [CrossRef] [PubMed]
- Johanson, M.A.; Cooksey, A.; Hillier, C.; Kobbeman, H.; Stambaugh, A. Heel lifts and the stance phase of gait in subjects with limited ankle dorsiflexion. J. Athl. Train. 2006, 41, 159–165. [Google Scholar] [PubMed] [PubMed Central]
- Norris, E.S.; Hubbuch, E.; Ford, A.; Allen, W. The relationship of weight-bearing and non-weight bearing ankle dorsiflexion to balance and gait performance in young and older adults. Phys. Ther. Rehabil. 2016, 3, 6. [Google Scholar] [CrossRef]
- Aquino, M.R.C.; Resende, R.A.; Kirkwood, R.N.; Souza, T.R.; Fonseca, S.T.; Ocarino, J.M. Spatial-temporal parameters, pelvic and lower limb movements during gait in individuals with reduced passive ankle dorsiflexion. Gait Posture 2022, 93, 32–38. [Google Scholar] [CrossRef]
- Attias, M.; Chevalley, O.; Bonnefoy, M.A.; De, C.G.; Cheze, L.; Armand, S. Effects of contracture on gait kinematics: A systematic review. Clin. Biomech. 2016, 33, 103–110. [Google Scholar] [CrossRef] [PubMed]
- Pham, H.; Armstrong, D.G.; Harvey, C.; Harkless, L.B.; Giurini, J.M.; Veves, A. Screening techniques to identify people at high risk for diabetic foot ulceration: A prospective multicenter trial. Diabetes Care 2000, 23, 606–611. [Google Scholar] [CrossRef]
- Hickey, B.; Pastor, M.D.; Karlsson, J.; Calder, J. Hindfoot endoscopic release of the posterior ankle capsuloligamentous structures improves ankle dorsiflexion range, function and pain in patients with painful limitation of ankle dorsiflexion. J. ISAKOS 2020, 5, 21–25. [Google Scholar] [CrossRef]
- Matsuo, H.; Kubota, M.; Sasaki, S.; Shimada, S.; Kitaide, K.; Kamei, K.; Kitano, M.; Nonoyama, T.; Koie, Y.; Naruse, H.; et al. Influence of Different Heel Complement Height on Gait for Lameness Due to Ankle Dorsiflexion Restriction. Phys. Ther. Fukui 2010, 14, 54–58. [Google Scholar]
- Miyano, K.; Nakamura, J.; Hujii, S.; Tsujimoto, N.; Ikuno, K.; Shoumoto, K. Immediate effects of combined functional electrical stimulation and task-oriented exercises on ankle plantar flexors in hemiplegic stroke patients: A preliminary study with one case. J. Kinki Phys. Ther. Conf. 2019, 48, 2–6. [Google Scholar]
- Schubert, T.; Wollesen, B.; Weidner, R. Development and Preliminary Evaluation of a Lower Body Exosuit to Support Ankle Dorsiflexion. Appl. Sci. 2021, 11, 5007. [Google Scholar] [CrossRef]
- Okada, H.; Ae, M.; Hujii, N.; Morioka, Y. Inertial characteristics of body parts in elderly Japanese. Biomechanics 1996, 13, 125–139. [Google Scholar]
- Kobayashi, Y.; Hida, N.; Nakajima, K.; Fujimoto, M.; Mochimaru, M. AIST Gait Database (2019). Available online: https://unit.aist.go.jp/harc/ExPART/GDB2019.html (accessed on 6 July 2020).
- Japanese Society for Fracture Repair. Available online: https://www.jsfr.jp/download/info/2021/20211129_03.pdf (accessed on 8 July 2024).
- Ishida, M.; Sagawa, K. Quantitative evaluation for standing stability during anterior-posterior body tilt movement using inverted pendulum model. Jpn. Soc. Mech. Eng. 2009, 75, 1047–1055. [Google Scholar]
- Takeda, S.; Yamazaki, H.; Tashiro, H.; Nakamura, K.; Hoshi, H. Fundamental study for predicting the center-of-gravity trajectory of walking motion using the jerk minimum model. Phys. Ther. 2017, 24, 62–67. [Google Scholar]
- Naito, N.; Hase, K.; Inoue, T.; Aikawa, T.; Yamazaki, S.; Suwa, M.; Obinata, G. Development of a 3D Hip Prosthesis Gait Simulation Model with Neuromusculoskeletal System. J. Biomech. Soc. Jpn. 2005, 29, 160–169. [Google Scholar]
- Frank, C.A.; Marcus, G.P. Individual muscle contributions to support in normal walking. Gait Posture 2003, 17, 159–169. [Google Scholar]
- Anderson, F.C.; Pandy, M.G. Dynamic Optimization of Human Walking. ASME. J. Biomech. Eng. 2001, 123, 381–390. [Google Scholar] [CrossRef] [PubMed]
- Felix, E.Z.; Richard, R.N.; Steven, A.K. Biomechanics and muscle coordination of human walking: Part I: Introduction to concepts, power transfer, dynamics and simulations. Gait Posture 2002, 16, 215–232. [Google Scholar]
Figure 1.
Torque assistance for ankle joint: (a) Exoskeletal assisting device; (b) expected result torque.
Figure 1.
Torque assistance for ankle joint: (a) Exoskeletal assisting device; (b) expected result torque.
Figure 2.
Ankle ROM assistance by heel lifts: (a) Heel lifts and (b) ROM assistance definition.
Figure 2.
Ankle ROM assistance by heel lifts: (a) Heel lifts and (b) ROM assistance definition.
Figure 3.
Ankle assistance by independent link of walking assisting device: (a) Front assistance and (b) Rear assistance.
Figure 3.
Ankle assistance by independent link of walking assisting device: (a) Front assistance and (b) Rear assistance.
Figure 4.
Target assisted phase and ankle function of human walking.
Figure 4.
Target assisted phase and ankle function of human walking.
Figure 5.
Analytical model of human with an assisting link and its free-body diagram: (a) Human body and assisting link model; (b) upper leg link; (c) lower leg link; (d) foot link; (e) assisting link.
Figure 5.
Analytical model of human with an assisting link and its free-body diagram: (a) Human body and assisting link model; (b) upper leg link; (c) lower leg link; (d) foot link; (e) assisting link.
Figure 6.
Model of analysis boundary conditions with points that should be the same as those in normal walking. (a) Configuration of right lower limb at the initial instance of phase B. (b) Configuration of right lower limb at the final instance of phase B. (c) Configuration of left lower limb at the initial instance of phase D.
Figure 7.
Data of the walking from database [
21] and referring to models in
Figure 5 (
a) toe angle; (
b) ankle angle; (
c) knee angle; (
d) ankle torque; (
e) hip height.
Figure 7.
Data of the walking from database [
21] and referring to models in
Figure 5 (
a) toe angle; (
b) ankle angle; (
c) knee angle; (
d) ankle torque; (
e) hip height.
Figure 8.
Parameter definition of assisting torque generation.
Figure 8.
Parameter definition of assisting torque generation.
Figure 9.
Data of the walking from referring to models in
Figure 5 with assistance and without assistance. (
a) toe angle; (
b) ankle angle; (
c) knee angle; (
d) ankle torque; (
e) hip height.
Figure 9.
Data of the walking from referring to models in
Figure 5 with assistance and without assistance. (
a) toe angle; (
b) ankle angle; (
c) knee angle; (
d) ankle torque; (
e) hip height.
Figure 10.
Data of the walking from referring to models in
Figure 5 with assistance and with assistance after training. (
a) toe angle; (
b) ankle angle; (
c) knee angle; (
d) ankle torque; (
e) hip height.
Figure 10.
Data of the walking from referring to models in
Figure 5 with assistance and with assistance after training. (
a) toe angle; (
b) ankle angle; (
c) knee angle; (
d) ankle torque; (
e) hip height.
Figure 11.
Flow chart of Analysis Procedure.
Figure 11.
Flow chart of Analysis Procedure.
Figure 12.
Functions to generate the joint angle target: F1 joint angles for normal gait; F2 polynomial approximation satisfying initial conditions; F3 function perturbed by F2.
Figure 12.
Functions to generate the joint angle target: F1 joint angles for normal gait; F2 polynomial approximation satisfying initial conditions; F3 function perturbed by F2.
Figure 13.
Analysis result of ankle joint torque load ratio in assistance condition space for each dorsiflexion ROM limitation . (a) °, (b) °, (c) °, (d) °, (e) °.
Figure 13.
Analysis result of ankle joint torque load ratio in assistance condition space for each dorsiflexion ROM limitation . (a) °, (b) °, (c) °, (d) °, (e) °.
Figure 14.
Assist able area in the evaluation index space. Blue triangle is normal walking. All points of
Figure 13a are constrainted on the (a) area of
Figure 14. The same applies to (b) through (e).
Figure 14.
Assist able area in the evaluation index space. Blue triangle is normal walking. All points of
Figure 13a are constrainted on the (a) area of
Figure 14. The same applies to (b) through (e).
Table 1.
Static Condition of Walking Analysis.
Table 1.
Static Condition of Walking Analysis.
| Parameter | Value | Parameter | Value |
|---|
| [°] normal dorsiflexion (positive) limitation | 20 | [°] normal plantarflexion (negative) limitation | −45 |
| [°] normal bending (positive) limitation | 130 | [°] normal extension (negative) limitation | 0 |
| [kg] | 0.99 | [kg] | 2.73 |
| [kg] | 54.3 | [kg m2] | |
| [kg m2] | | [kg m2] | |
| [m] | 0.131 | [m] | 0.348 |
| [m] | 0.352 | [m] | 0.067 |
| [m] | 0.174 | [N m/rad] | 800 |
| [N m s/rad] | 80 | [N m/rad] | 300 |
| [N m s/rad] | 30 | [N/m] | |
| [N] | 591 | [m] | |
Table 2.
Normal walking analysis result data.
Table 2.
Normal walking analysis result data.
| Parameter | Walking Data | Analysis Result |
|---|
| [m] | 1.32 | 1.3358 |
| [m/s] | 0.686 | 0.7388 |
| [°] (min, max) | — | (4.15, 18.7) |
| [°] (min, max) | — | (−8.56, 8.42) |
| [N] (min) | — | 152 |
Table 3.
Assisting Device Conditions in example analysis.
Table 3.
Assisting Device Conditions in example analysis.
| Parameter | Value |
|---|
| [m] | 0.1 |
| 0.5 |
Table 4.
With Assisting Device Analysis Result Data.
Table 4.
With Assisting Device Analysis Result Data.
| Parameter | Value | Requirement | Pass/Fail |
|---|
| 1.3318 | 1.3358 ± 0.001 | Fail |
| [m/s] | 0.5423 | 0.7388 ± 0.001 | Fail |
| [°] (min, max) | (4.50, 18.8) | (0, 130) | Pass |
| [°] (min, max) | (−8.56, 7.05) | (−45, 20) | Pass |
| [N] (min) | 158 | 0 | Pass |
Table 5.
With assistance and after human adaptation data.
Table 5.
With assistance and after human adaptation data.
| Parameter | Value | Requirement | Pass/Fail |
|---|
| 1.3353 | 1.3358 ± 0.001 | Pass |
| [m/s] | 0.7378 | 0.7388 ± 0.001 | Pass |
| [°] (min, max) | (18.2, 49.7) | (0, 130) | Pass |
| [°] (min, max) | (−8.56, 2.93) | (−45, 20) | Pass |
| [N] (min) | 200 | 0 | Pass |
Table 6.
Evaluation indexes of two examples analyzed in
Figure 10.
Table 6.
Evaluation indexes of two examples analyzed in
Figure 10.
| Parameter | Normal Walking | With Assistance and After Human Adaptation |
|---|
| [°] | 8.42 | 2.93 |
| [N m s] | 19.4 | 18.1 |
Table 7.
Parameter Changing Range and Number of Divisions Candidates.
Table 7.
Parameter Changing Range and Number of Divisions Candidates.
| Parameter | Number of Candidates | Minimum Range | Maximum Range |
|---|
| [°] | 20 | 1 | 20 |
| [m] | 16 | | 2 |
| 21 | | 1 |
| 9 | | |
| 7 | | |
| 5 | | |
| 3 | | |
Table 8.
The best performance among
Figure 13.
Table 8.
The best performance among
Figure 13.
| | Front Assistance | Back Assistance |
|---|
| [°] | | [m] | | | [m] | |
|---|
| 11.0 | 0.52 | 0.11 | 0.8 | 0.76 | 0.07 | −1.0 |
| 9.0 | 0.52 | 0.11 | 0.8 | 0.76 | 0.07 | −1.0 |
| 7.0 | 0.52 | 0.12 | 0.8 | 0.76 | 0.07 | −1.0 |
| 5.0 | No Result | No Result | No Result | 0.76 | 0.07 | −1.0 |
| 3.0 | No Result | No Result | No Result | 0.76 | 0.07 | −1.0 |
| Disclaimer/Publisher’s Note: The statements, opinions and data contained in all publications are solely those of the individual author(s) and contributor(s) and not of MDPI and/or the editor(s). MDPI and/or the editor(s) disclaim responsibility for any injury to people or property resulting from any ideas, methods, instructions or products referred to in the content. |
© 2025 by the authors. Licensee MDPI, Basel, Switzerland. This article is an open access article distributed under the terms and conditions of the Creative Commons Attribution (CC BY) license (https://creativecommons.org/licenses/by/4.0/).


