Article

Automated On-Tree Detection and Size Estimation of Pomegranates by a Farmer Robot

by
Rosa Pia Devanna
1,
Francesco Vicino
2,
Simone Pietro Garofalo
2,
Gaetano Alessandro Vivaldi
2,
Simone Pascuzzi
2,
Giulio Reina
3 and
Annalisa Milella
1,*
1
Institute of Intelligent Industrial Technologies and Systems for Advanced Manufacturing (STIIMA), National Research Council of Italy (CNR), Via G. Amendola 122 D-O, 70126 Bari, Italy
2
Department of Soil, Plant and Food Science (DiSSPA), University of Bari, Via G. Amendola 165/A, 70126 Bari, Italy
3
Department of Mechanics, Mathematics and Management, Polytechnic of Bari, Via Orabona 4, 70125 Bari, Italy
*
Author to whom correspondence should be addressed.
Robotics 2025, 14(10), 131; https://doi.org/10.3390/robotics14100131
Submission received: 19 August 2025 / Revised: 16 September 2025 / Accepted: 18 September 2025 / Published: 23 September 2025
(This article belongs to the Section Agricultural and Field Robotics)

Abstract

Pomegranate (Punica granatum) fruit size estimation plays a crucial role in orchard management decision-making, especially for fruit quality assessment and yield prediction. Currently, fruit sizing for pomegranates is performed manually using calipers to measure equatorial and polar diameters. These methods rely on human judgment for sample selection, they are labor-intensive, and prone to errors. In this work, a novel framework for automated on-tree detection and sizing of pomegranate fruits by a farmer robot equipped with a consumer-grade RGB-D sensing device is presented. The proposed system features a multi-stage transfer learning approach to segment fruits in RGB images. Segmentation results from each image are projected on the co-located depth image; then, a fruit clustering and modeling algorithm using visual and depth information is implemented for fruit size estimation. Field tests carried out in a commercial orchard are presented for 96 pomegranate fruit samples, showing that the proposed approach allows for accurate fruit size estimation with an average discrepancy with respect to caliper measures of about 1.0 cm on both the polar and equatorial diameter.

Graphical Abstract

1. Introduction

Pomegranate (Punica granatum) is among the most popular fruits worldwide. Consumed either fresh or processed in the form of dried arils, juice, and seed oil, its diffusion has increased over the last few decades due to its nutritional and health benefits. This global awareness has resulted in a significant growth in commercial pomegranate farming [1]. For example, in Italy, large-scale pomegranate cultivation, almost absent until 2010, has increased significantly in recent years, with recent data (2024) reporting a production area of 1867 hectares and a total harvested production of 297,612 quintals of fruit [2]. However, pomegranate field management is particularly complex and requires constant long-term field monitoring by farmers and a lot of skilled labor, as the fruits typically mature in a quite dilated time frame. Improper cultivation systems, post-harvest losses, and a lack of maintenance and quality inspection can lead to a dramatic decrease in crop quality and yield.
In this respect, on-tree fruit detection and measurement are critical for predicting ripeness and harvest time, estimating the fruit growth rate, predicting yield, as well as informing on packing and marketing arrangements [3]. Measuring fruit dimensions is also important for the control of robotic arms in autonomous harvesting operations [4]. In addition, fruit size is recognized to play a role in the consumer’s decision to buy [5].
Fruit dimensions are traditionally measured manually using calipers or sizing rings [6]. Such measurement procedures, however, are labor-intensive and tedious. In addition, sampling is generally performed on a small number of plants, and measurements might be influenced by both sparsity and human bias, leading to incorrect estimates. As a result, there has been a growing interest in automated measurement systems. While a number of automated techniques have been developed to measure fruit dimension in the context of pack-line fruit grading mainly using machine vision systems under controlled environmental conditions [7], fruit detection and sizing directly in the field still represents an open challenge. The main issues are related to poor or excessive lighting conditions, shadows, reflections, and occlusions. Furthermore, it should be emphasized that in-field fruit detection and sizing systems typically deal with complex, unstructured, and dynamic agricultural contexts.

1.1. Related Work

The first step for automated fruit detection and counting using machine vision is accurate image segmentation to separate fruits from non-fruit regions. To handle this task, earlier works employed classic feature engineering approaches, which make use of human-designed descriptors based on color, geometric, and texture features and machine learning techniques such as Bayesian classifiers, support vector machines (SVMs), and clustering. A review of these methods in the context of robotic harvesting and crop-load estimation of specialty tree crops including apples, pears, and citrus can be found in [8]. More recently, deep learning techniques have replaced traditional machine learning approaches to increase image segmentation accuracy and robustness under variable environmental conditions. One of the first works demonstrating the use of deep learning for the automated detection and counting of fruits in large-scale orchards by a ground robotic vehicle can be found in [9]. It presents the use of Faster R-CNN in the context of fruit detection in various orchards, including mangoes, almonds, and apples. Since then, several works have been developed to segment natural images for the task of fruit detection and counting [10]. For example, in [11], four deep learning networks, namely, AlexNet, VGG16, VGG19 and GoogLeNet, are implemented and compared to segment visual images acquired by an RGB-D sensor mounted onboard a farmer robot into multiple classes and count grape bunches. A grape detection, segmentation, and tracking methodology that employs Mask R-CNN instance segmentation and three-dimensional data association is proposed in [12]. Recently, a few studies have extended the use of deep learning techniques to the in-field detection of pomegranates, reflecting the increasing interest in this type of cultivation and the need for automation in pomegranate harvesting, thinning, and yield estimation. For instance, in [13], a combination of YOLOv5s and UNet-MobileNetV2 models for selective in-field pomegranate fruit segmentation is proposed. Lightweight detection models for pomegranate detection, based on the improved YOLOv8 and YOLOv5, are presented in [14,15], respectively. All these methods achieve high detection accuracy but rely on manually labeled datasets for training, which can constrain scalability. Furthermore, most approaches use 2D RGB imagery only, which limits their ability to capture key phenotypic traits such as fruit three-dimensional structure. A method for organ classification and fruit counting on pomegranate trees using color and 3D shape information is proposed in [16]. It relies on multi-feature fusion and support vector machines to segment 3D point clouds into branches, leaves, and fruits, and agglomerative-divisive hierarchical clustering for fruit counting.
As a subsequent step after fruit detection, fruit size estimation has been investigated in a number of studies, mostly focusing on a few high-value crop types, including apples, citrus fruits, mangoes, and grapes. The proposed methods can be roughly classified into two groups, i.e., methods using 2D images and methods relying on 3D point clouds. A detailed review of both 2D and 3D fruit sizing methods can be found in [3]. Estimation of apple fruit diameters from RGB and thermal images is proposed in [17,18], respectively. The size of citrus fruit is estimated by [19] using images taken from an unmanned aerial vehicle (UAV). In [20], a near real-time method to determine both the number of fruits and fruit size in apple orchards from images taken by a low-cost smartphone is proposed. In [21], a fixed installation for continuous on-tree monitoring of pomegranates is developed, implementing a computer vision system to extract fruit color and pixel size. In all these cases, calibration targets are needed for scale estimation. Alternatively, 3D point clouds acquired by lidars [22], stereocameras, and structure-from-motion approaches (SfM) [23,24] or RGB-D sensors [25] can be used, which allow the three-dimensional reconstruction of the fruits to be performed for direct estimation of the fruit size. As a notable example, in [24], the authors use structure-from-motion (SfM) and multi-view stereo (MVS) methods for the generation of a 3D point cloud of on-tree apple fruits. Then, different techniques are evaluated for the fruit size estimation step, including the largest segment technique, least-square sphere fitting, and template matching (TM).
As machine vision-based fruit sizing technologies advance, commercial solutions are becoming more widely available to producers of high-value crops. These systems use a variety of technologies, including RGB and depth cameras, either embedded in portable mobile devices or placed on the ground or on aerial vehicles. An iPhone-based commercial solution for fruit sizing and size forecasting for a variety of fruits is proposed by Aerobotics [26]. Green Atlas [27] offers an automated system to collect and analyze data across the entire fruit life cycle, using a vehicle-mounted RGB camera and LiDAR. Tevel [28] has developed a tethered UAV based apple harvester, equipped with an RGB-D camera that is used in estimation of fruit size. Although all these systems provide a valuable source of information for crop monitoring and decision support, continued research is still needed to validate the solutions being proposed and integrate them into fully functional automated harvesting systems [29]. This is even more critical for crops such as pomegranates that require accurate selective harvesting due to non-uniform ripening and present dense canopies and less standardized orchard structures. Within this context, human–robot collaboration provides a promising strategy combining robot precision in data collection and mapping with farmer expertise and decision-making capabilities, as highlighted in recent reviews on agricultural human–robot interaction and ergonomics [30,31].

1.2. Aim of the Study

This paper presents a new framework for automatic fruit size estimation of pomegranate fruits by a farmer robot equipped with an Intel RealSense D435 stereo device (Figure 1). In previous work by the authors [32], a multi-stage transfer learning approach to segment pomegranate fruits in RGB images provided by a consumer-grade RGB-D sensor was proposed. Here, the research is further extended by integrating depth data to recover morphological information such as fruit diameters. Specifically, first, the results of the segmentation of each image are projected onto the co-located depth image. Then, a fruit modeling algorithm is implemented that merges the visual and depth information for fruit size estimation. Tests conducted in a commercial pomegranate field located in the countryside of Grottaglie (TA), Apulia, Italy, are presented showing the effectiveness of the proposed approach. To the best of our knowledge, currently, there are few studies on on-tree pomegranate sizing based on robotic systems. An example can be found in [33], using RGB-D data acquired by a Microsoft Kinect v2 and F-PointNet combined with 3D point cloud clustering and sphere fitting to obtain the position and the radius of mature pomegranates.
Compared to state-of-the-art approaches, the proposed system introduces the following contributions:
  • A novel pomegranate fruit segmentation and modeling approach that combines 2D and 3D information acquired by an Intel RealSense D435 camera. Two-dimensional segmentation relies on multi-stage transfer learning and semi-supervised image annotation, which relieve the burden of manual labeling. Three-dimensional information is directly available from the sensing device, thus avoiding the need for calibration targets. These characteristics make the overall system viable for real-world implementation;
  • An automated fruit sizing method based on an elliptical model of the pomegranate to measure polar and equatorial diameters for precise fruit shape estimation in 3D space. Polar and equatorial diameters are fundamental morphological parameters to determine the ripening and quality of pomegranates, as well as to estimate fruit mass [34];
  • An integrated robotic platform for automated in-field data gathering. The use of a robotic farmer is essential to automate image acquisition and to guarantee continuous monitoring of the growing status directly in the field.

1.3. Outline of the Paper

The remainder of the paper is structured as follows. In Section 2, first, the robotic platform and the datasets are described; then, the proposed approach to the segmentation and sizing of fruits is introduced. Section 3 and Section 4 present the experimental results and discussion, respectively. Finally, conclusions are drawn in Section 5.

2. Materials and Methods

This work presents a robotic pomegranate phenotyping system that employs an unmanned robotic platform equipped with an Intel RealSense D435 camera to survey the orchard and automatically estimate the fruit size. The workflow of the system is illustrated in Figure 2.
During operation, the robot acquires RGB and depth images of pomegranate trees while traversing the orchard rows. The RGB images are processed by a semantic segmentation network, trained through a multi-stage transfer learning approach that separates fruit from non-fruit regions. Individual fruit instances are then identified as connected components and modeled via ellipse fitting within the resulting binary segmentation mask. For each detected fruit, the corresponding point cloud is finally extracted leveraging on the co-located depth-image to enable fruit size estimation.
In the following sections, the robotic platform used for data acquisition is first introduced, followed by a detailed description of the proposed fruit detection and analysis methodology.

2.1. Robotic Platform

A custom-built research ground vehicle called Polibot (see Figure 1) from the Polytechnic of Bari is used. It provides high mobility over difficult terrain by employing an articulated suspension system that is operated purely passively but can provide a high load capacity, vibration isolation, and trafficability in rough terrain [35]. Polibot has a 1.5 × 1 m footprint and weighs around 70 kg, with a payload capacity of up to 40 kg. The control and acquisition system has been developed using ROS1 (Robot Operating System). Polibot’s standard sensor suite comprises sensors that measure the electrical currents drawn by the two drive motors, as well as an MTI 680 GNSS/INS with RTK centimeter accuracy. The metal frame attached to the top plate enables the robot to be supplied with a variety of dedicated sensors such as laser range finders and monitoring cameras, including an Intel RealSense D435 imaging system for crop visual data collection in this study. This sensor features a left–right IR stereo pair for depth information and a color camera. The color camera is a FullHD (1920 × 1080) Bayer-patterned CMOS imager. It has a nominal field of view of 69 (H) × 42 (V) degrees and operates at 30 fps for FullHD and higher frame rates for lower resolutions. The stereo imagers feature a field of view of 87 (H) × 58 (V) deg, maximum depth resolution of 1280 × 720 px, and frame rate up to 90 fps, with an ideal perception range of 0.3 m up to 3 m. The color camera’s stream is spatially calibrated and time-synchronized with the stereo pair, resulting in color-aligned depth images suitable for 3D crop characterization.

2.2. Datasets

The proposed approach was developed and validated using datasets acquired in a commercial pomegranate orchard in Apulia, southern Italy, just before harvesting (October, 2021). To collect the datasets, the vehicle traversed a row of 15 trees, located at an average distance of approximately 3 m from each other. The camera was mounted about 1 m above the ground and acquired lateral views of the tree row at a distance of about 1.5 m. Acquisitions were performed at a frame rate of 6 fps and an image resolution of 1280 × 720 px accounting for 945 frames. From the 15 trees, 96 pomegranates were randomly harvested, and their equatorial and polar diameters were measured with a caliper following a conventional measuring approach to provide ground truth against the proposed automated fruit sizing methodology. In addition, for the training of the segmentation network, laboratory acquisitions of harvested pomegranates were performed with the same camera as the one onboard the robot, using two different setups: one under controlled, uniform lighting and the other under intense and non-uniform sunlight. In both setups, the fruits were placed on a neutral-colored flat surface and spaced apart to avoid overlap.

2.3. Multi-Stage Image Segmentation

Semantic segmentation of pomegranates in trees is performed by using the multi-stage transfer learning approach, which was developed in [32] and is recalled in this section for the sake of completeness. This method’s main benefit is that it greatly reduces the amount of manual labeling that is typically required for ground truth in supervised learning.
The steps involve progressively increasing the degree of complexity of the sample pictures fed into the network and determining ground-truth labels to feed the subsequent stage based on the output of models trained in the preceding one. A schematic representation of the proposed methodology is reported in Figure 3. It involves three training stages.
  • Stage 1—Controlled environment: The initial training set consists of images of picked fruits placed against a white monochrome background, which allows straightforward mask extraction via color thresholding (see Figure 4). In this phase, lighting conditions are carefully controlled, providing diffuse and uniform illumination. This minimizes shadows and prevents dark regions from blending into the background, ensuring a clear fruit definition.
  • Stage 2—Model refinement: The network trained under controlled conditions is next applied to images of pomegranates acquired in the same environment but under intense, non-uniform lighting, which introduces shadow beams and strong contrasts. While color thresholding fails in these cases, the initial model produces coarse labels that can still capture the fruit’s shape. These labels are then refined using morphological operations and merged with the original dataset, before retraining the model (see Figure 5).
  • Stage 3—In-field adaptation: Finally, the same procedure is repeated using a limited number of in-field images, enabling the model to adapt to real-world conditions. Segmentation results from the final network are presented in Figure 6 for a representative test case. Specifically, the original image is shown in Figure 6a, while the semantic segmentation output is displayed in Figure 6b, where cyan pixels indicate the background and blue pixels denote the fruits.
In the proposed implementation, the DeepLabv3+ architecture with a pre-trained ResNet18 backbone was used. The final network demonstrated good performance, achieving precision and recall values of 93.33% and 81.49%, respectively, with an F1-score of 86.42%. This approach substantially reduced the need for extensive manual labeling of complex in-field images. The computational efficiency of the network was evaluated by segmenting the field image dataset on an Nvidia RTX 2080 Ti GPU and an Intel(R) Core(TM) i7-4790 CPU @ 3.60 GHz, yielding an average processing time of 0.15 s per frame, which is lower than the acquisition frame rate of 6 Hz. Further details on the multi-stage training procedure and performance analysis can be found in [32].
It is worth noting that, for each RGB image, the adopted sensing device also provides a time- and space-synchronized depth image [36]. Consequently, the 2D mask obtained from the segmentation algorithm can be projected into the 3D space, as illustrated in Figure 6c, where blue points correspond to pixels belonging to fruits.

2.4. Fruit Clustering and Modeling

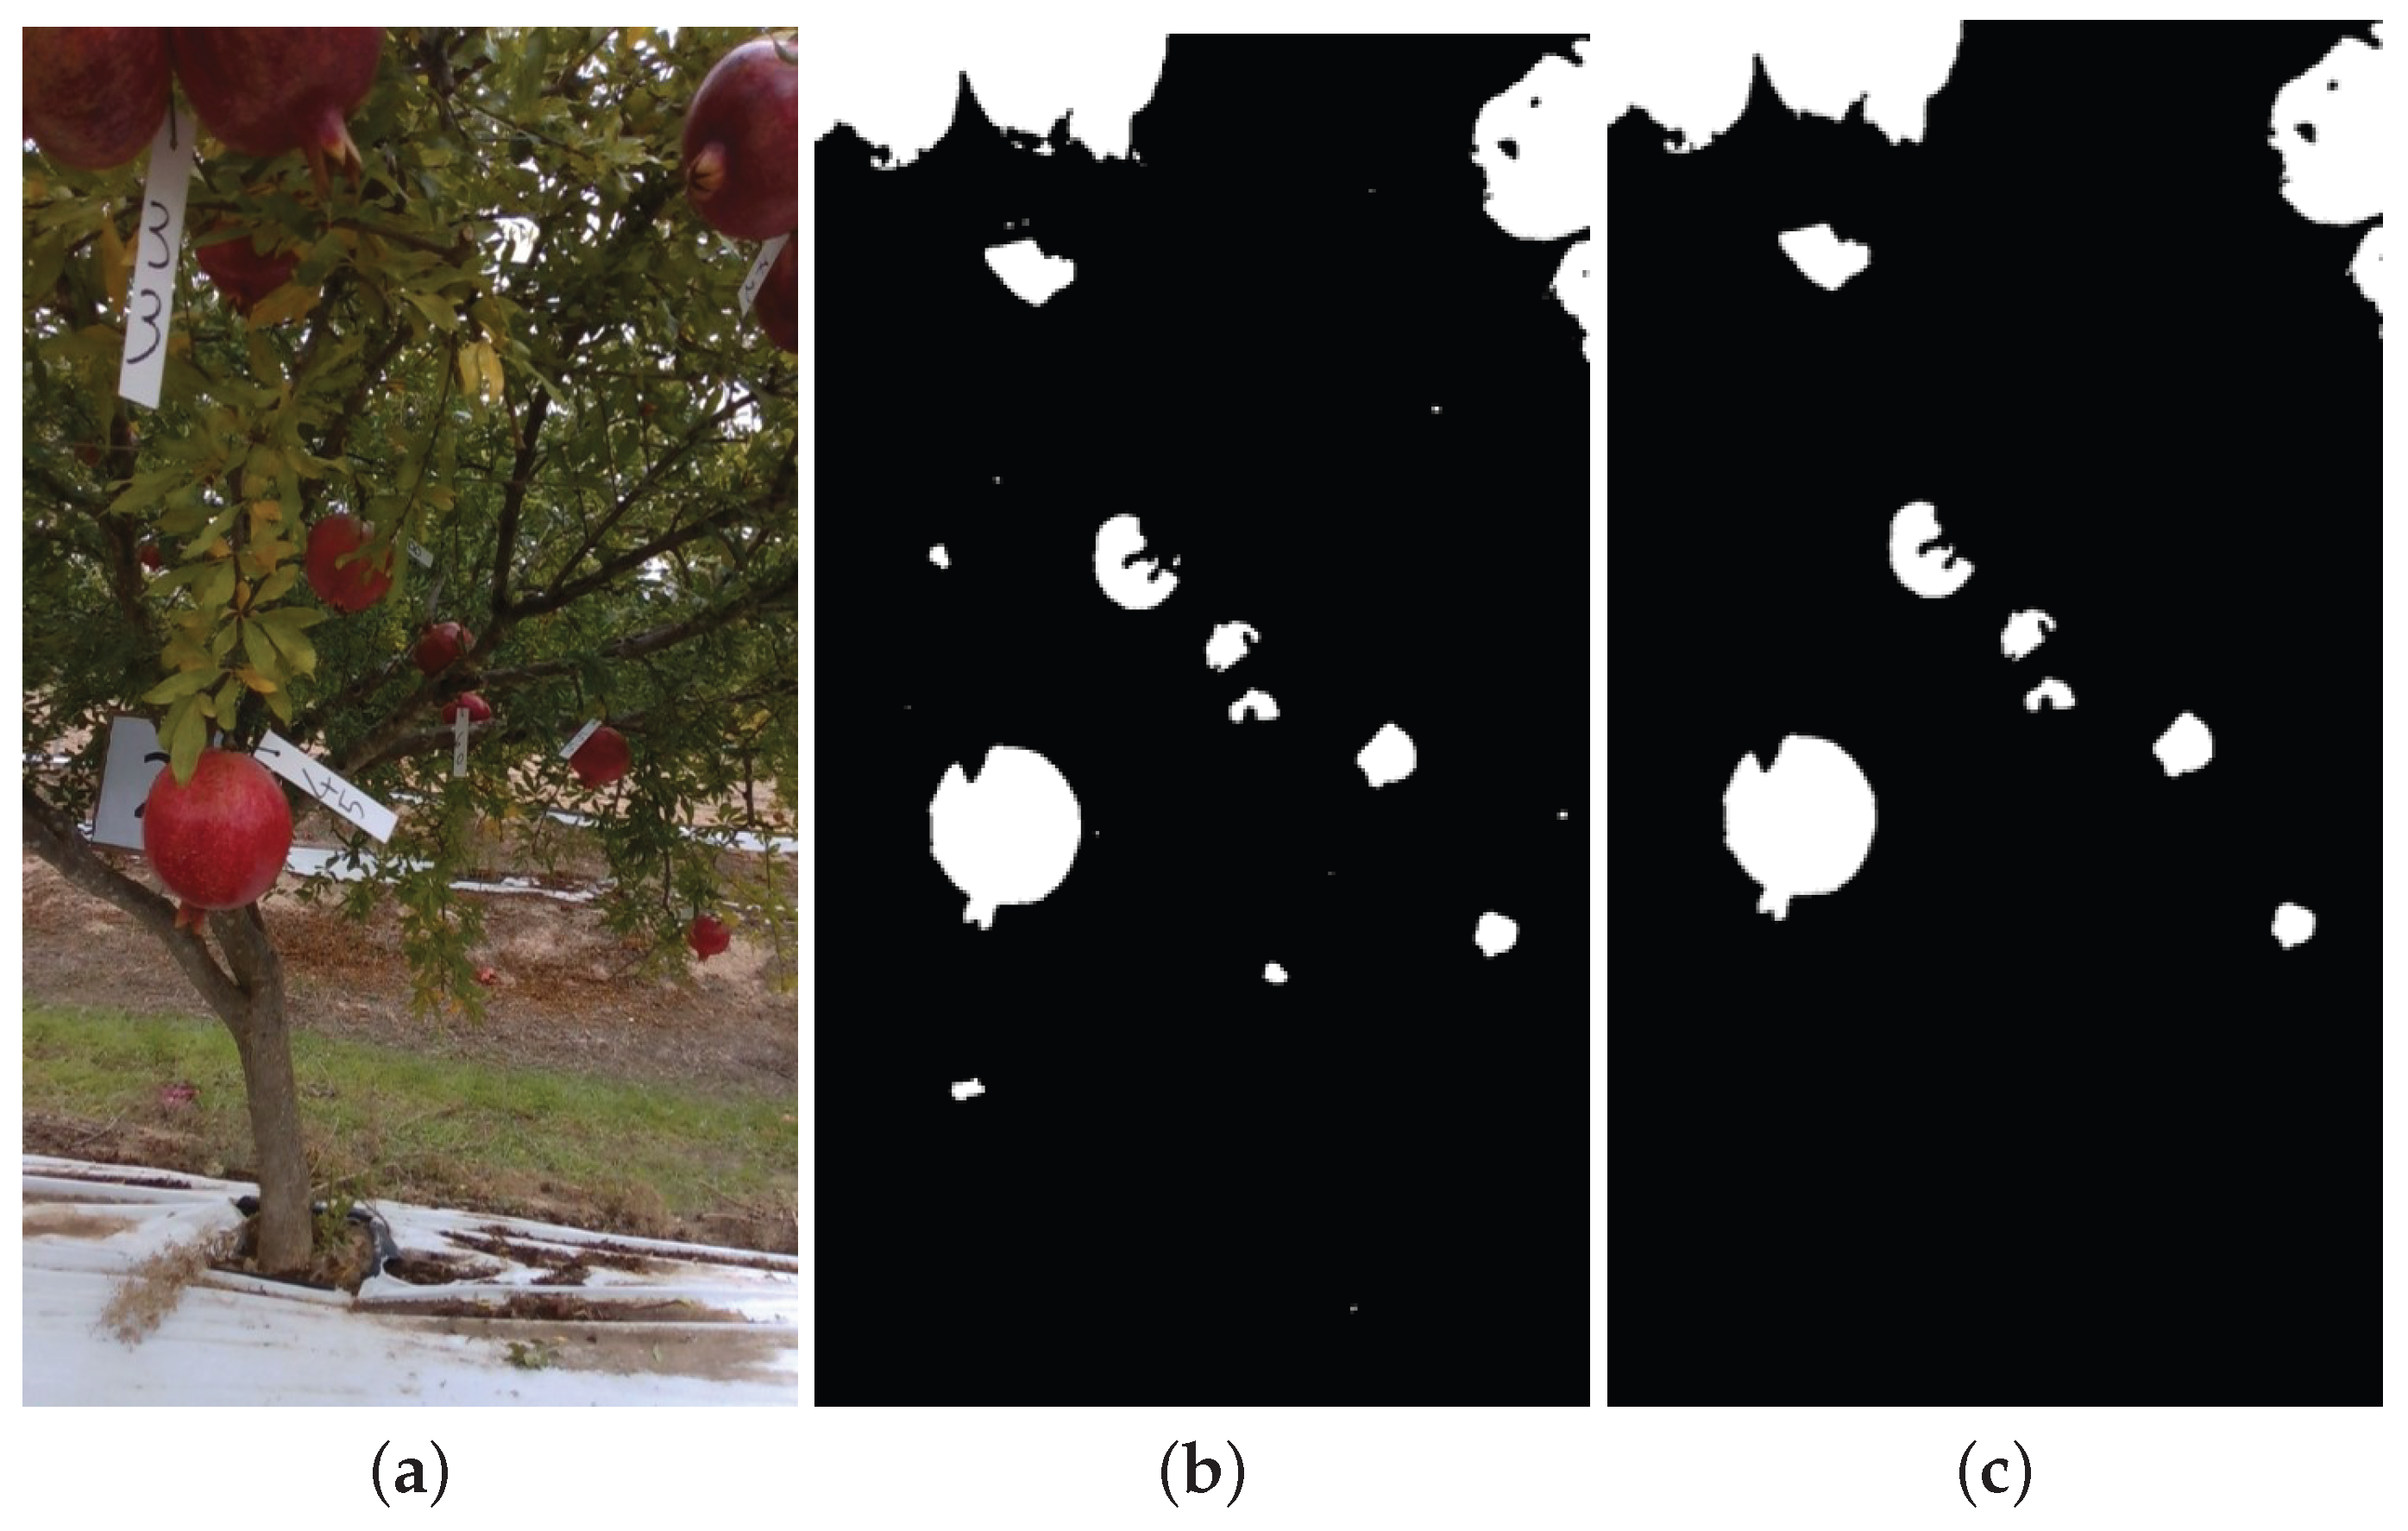
Applying semantic segmentation to the RGB image yields a binary mask, which is subsequently processed using connected component analysis for fruit clustering. Morphological operations are then applied to impose a pixel surface area threshold on each connected component, effectively cleaning the mask. Finally, the contours of each pomegranate are refined through dilation followed by erosion, ensuring clear and accurate delineation for further analysis. An example is shown in Figure 7. Specifically, Figure 7a reports the original RGB image, whereas Figure 7b,c display the corresponding segmentation mask before and after the application of morphological operations, respectively.
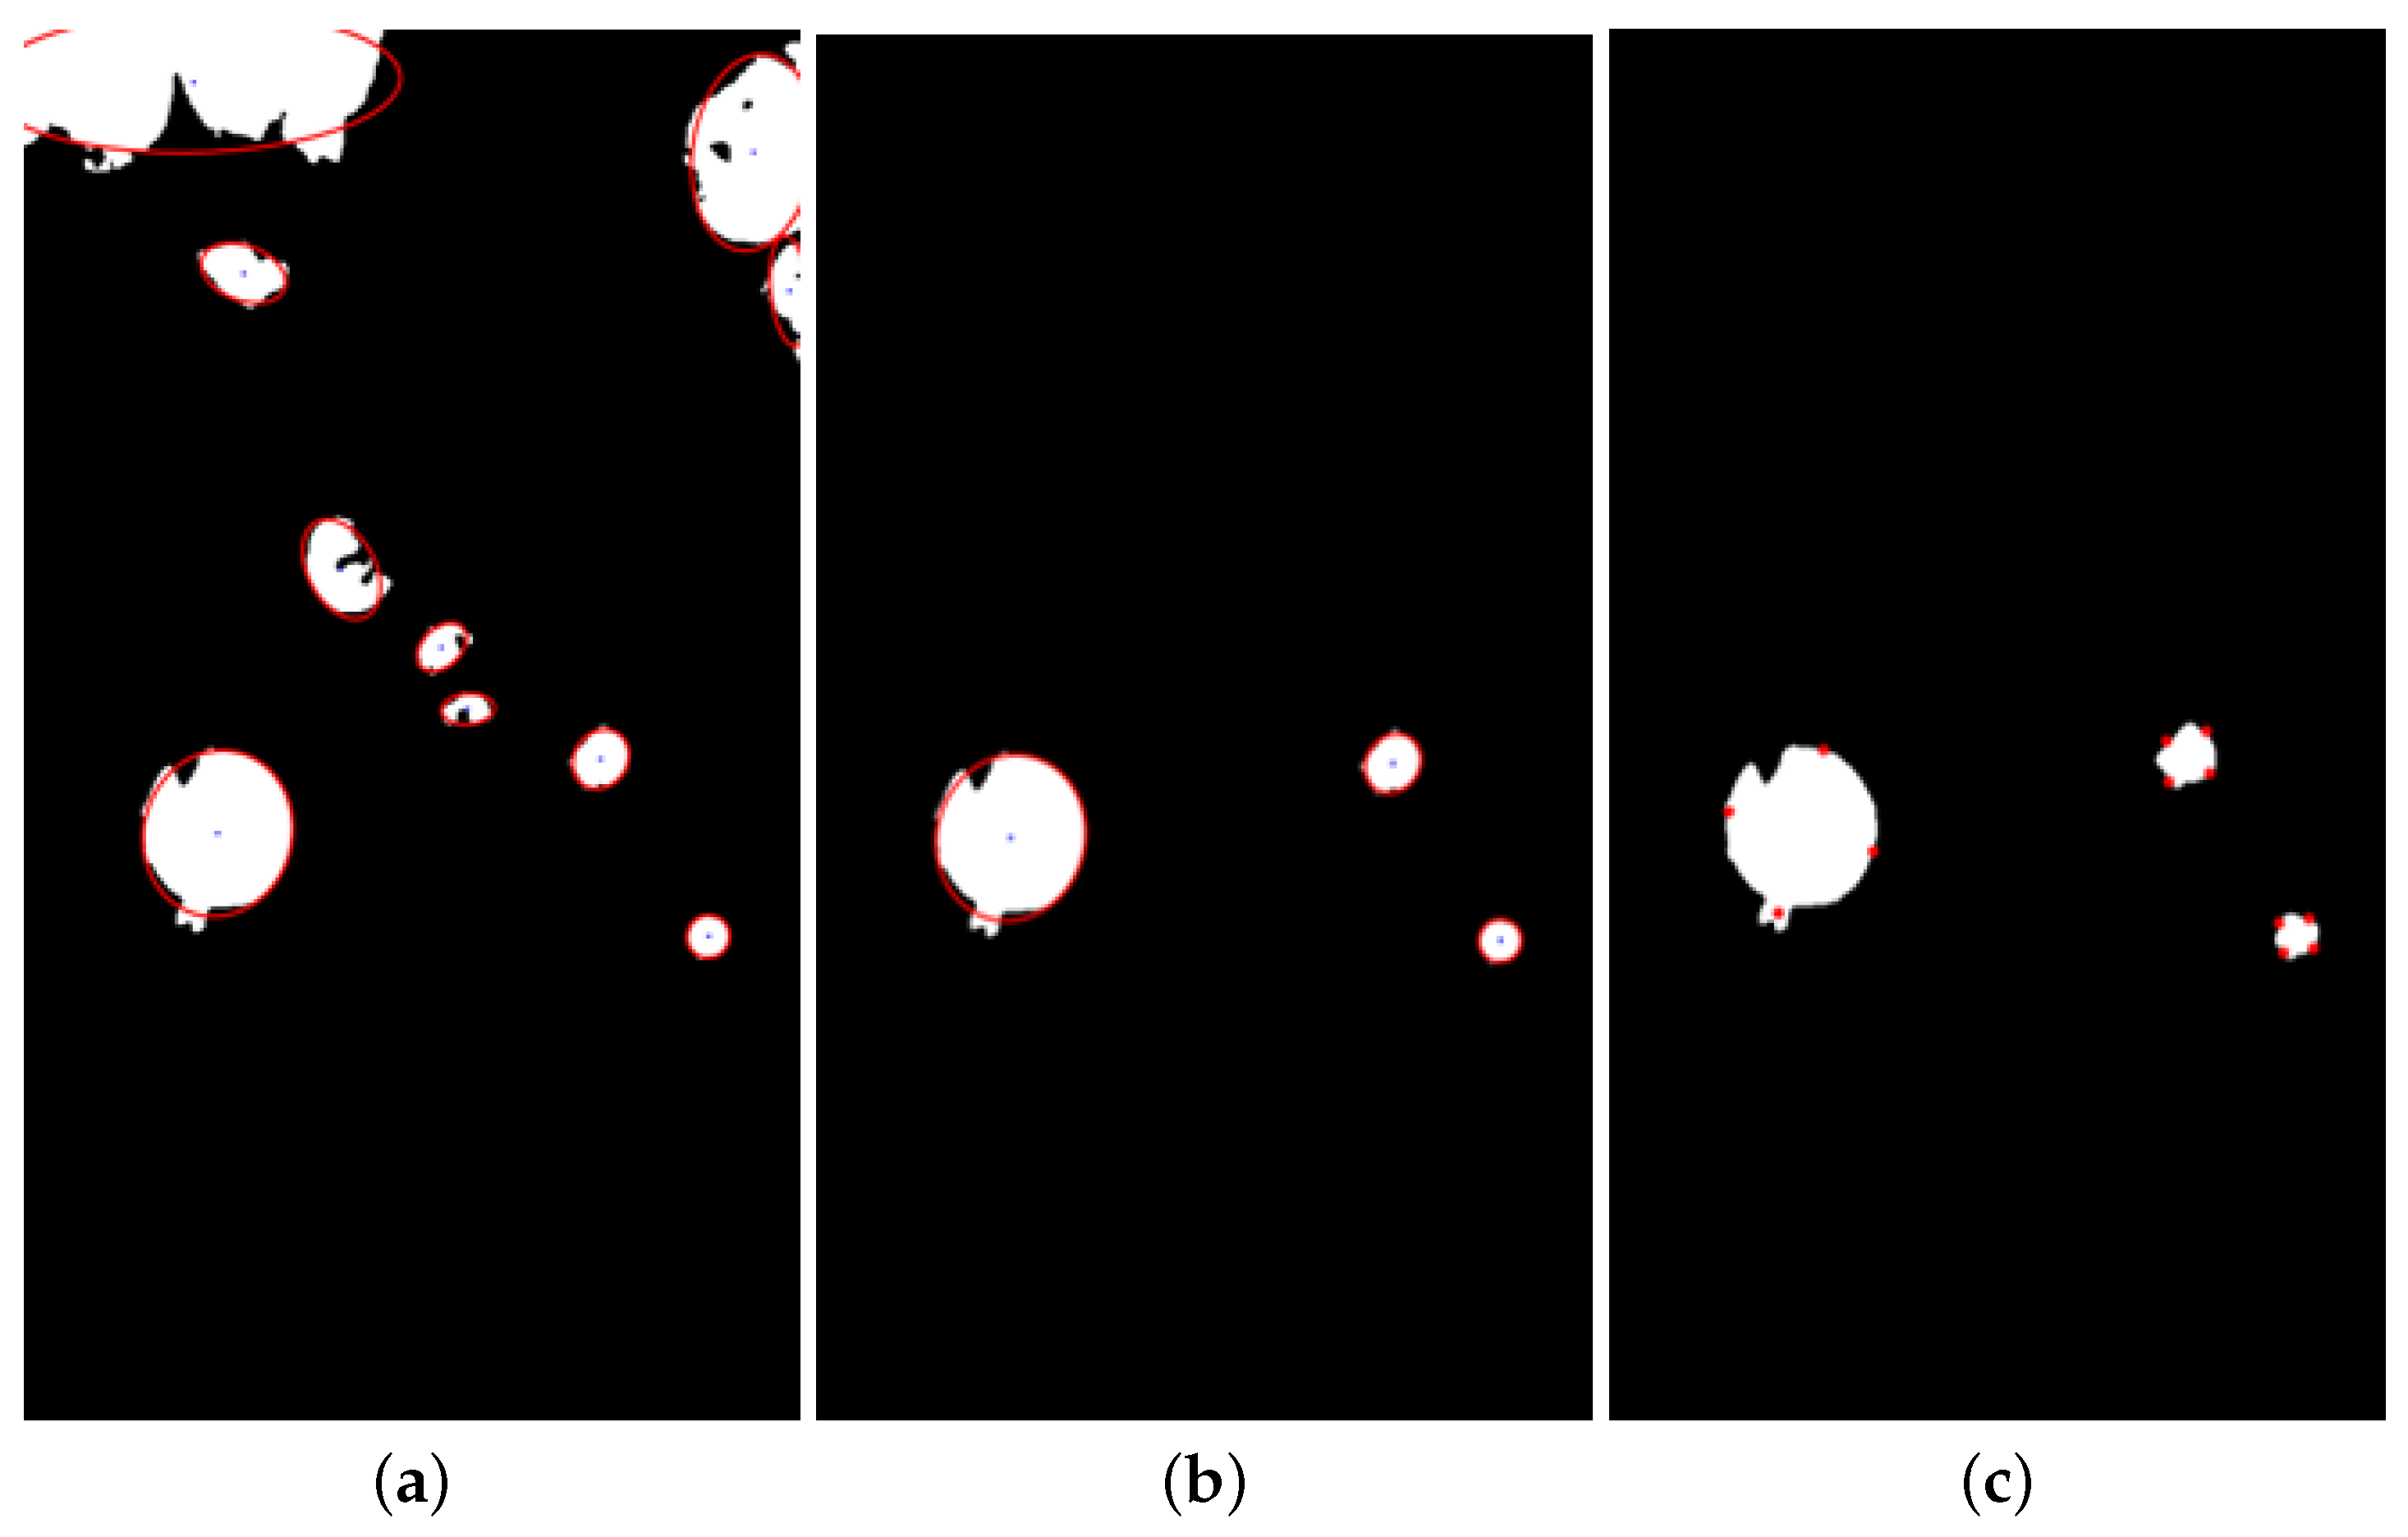
In the subsequent step, a moment-based ellipse fitting algorithm [37] is employed to enclose each blob identified in the image. Given the approximately spherical shape of pomegranates, it is assumed that blobs enveloped by highly elongated ellipses correspond to fruits that are not fully visible, most likely due to occlusion, positioning along image borders, or segmentation anomalies. An eccentricity threshold is therefore implemented to filter out ellipses that do not adhere to the expected roundness, thereby retaining only those blobs representing pomegranates that are clearly visible and completely captured within the image frame. This approach mitigates the potential measurement errors that could arise from partial fruit visibility.
Following the selection of properly visible pomegranates, the principal axes of the circumscribed ellipses are computed. These axes are associated with the polar and equatorial diameters of the pomegranates in the two-dimensional plane. The intersection points of these axes with their respective ellipses are calculated and their coordinates recorded. These coordinates are used to determine the fruit’s poles in three-dimensional space, translating the 2D data into 3D measurements, as described in the following section. Figure 8 shows the ellipse fitting process for the sample case of Figure 7.

2.5. Fruit Sizing

In the process of three-dimensional data association, ellipse vertices detected in the RGB image are projected onto the aligned disparity map. During this step, issues can occur due to missing depth information around the object’s edges. Consequently, in some cases, the projected vertices may not precisely coincide with the fruit’s actual depth profile, instead pointing to adjacent areas.
To correct these discrepancies, a standard deviation-based outlier filtering approach is used. First, the average depth of the points within the pomegranate blob is computed. Points deviating by more than N times the standard deviation from the mean are treated as outliers. For our case study, N = 1 was found to be a good compromise to retain the majority of valid points while excluding values that are likely to be noise or measurement errors. The pole position is then assigned to the closest non-zero depth point, ensuring a robust selection from reliable measurements. This case is illustrated in Figure 9, showing projected vertices before and after correction.
Upon projecting the poles into the three-dimensional space, the final step entails calculating the Euclidean distances between them. This calculation yields the polar and equatorial diameters of the pomegranates, quantified in centimeters.

3. Results

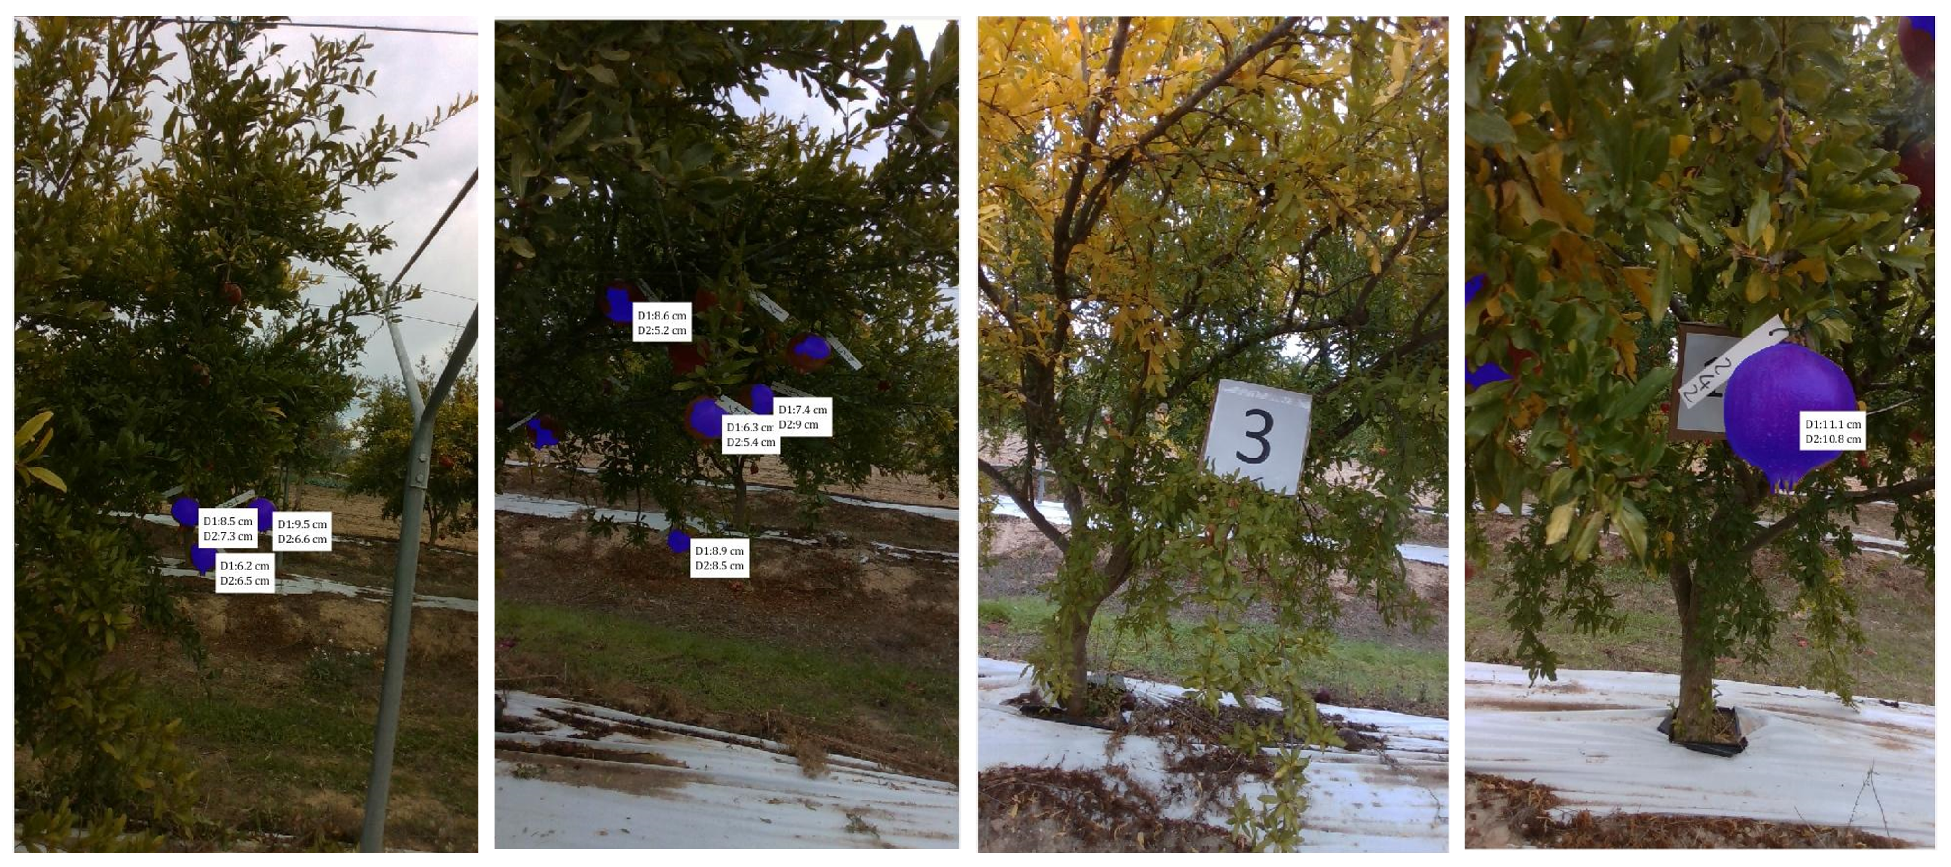
This section presents a comparison between manual caliper measures and automated on-tree estimates performed by the robotic system. Some sample images from a sequence acquired by the robot in the field are reported in Figure 10.
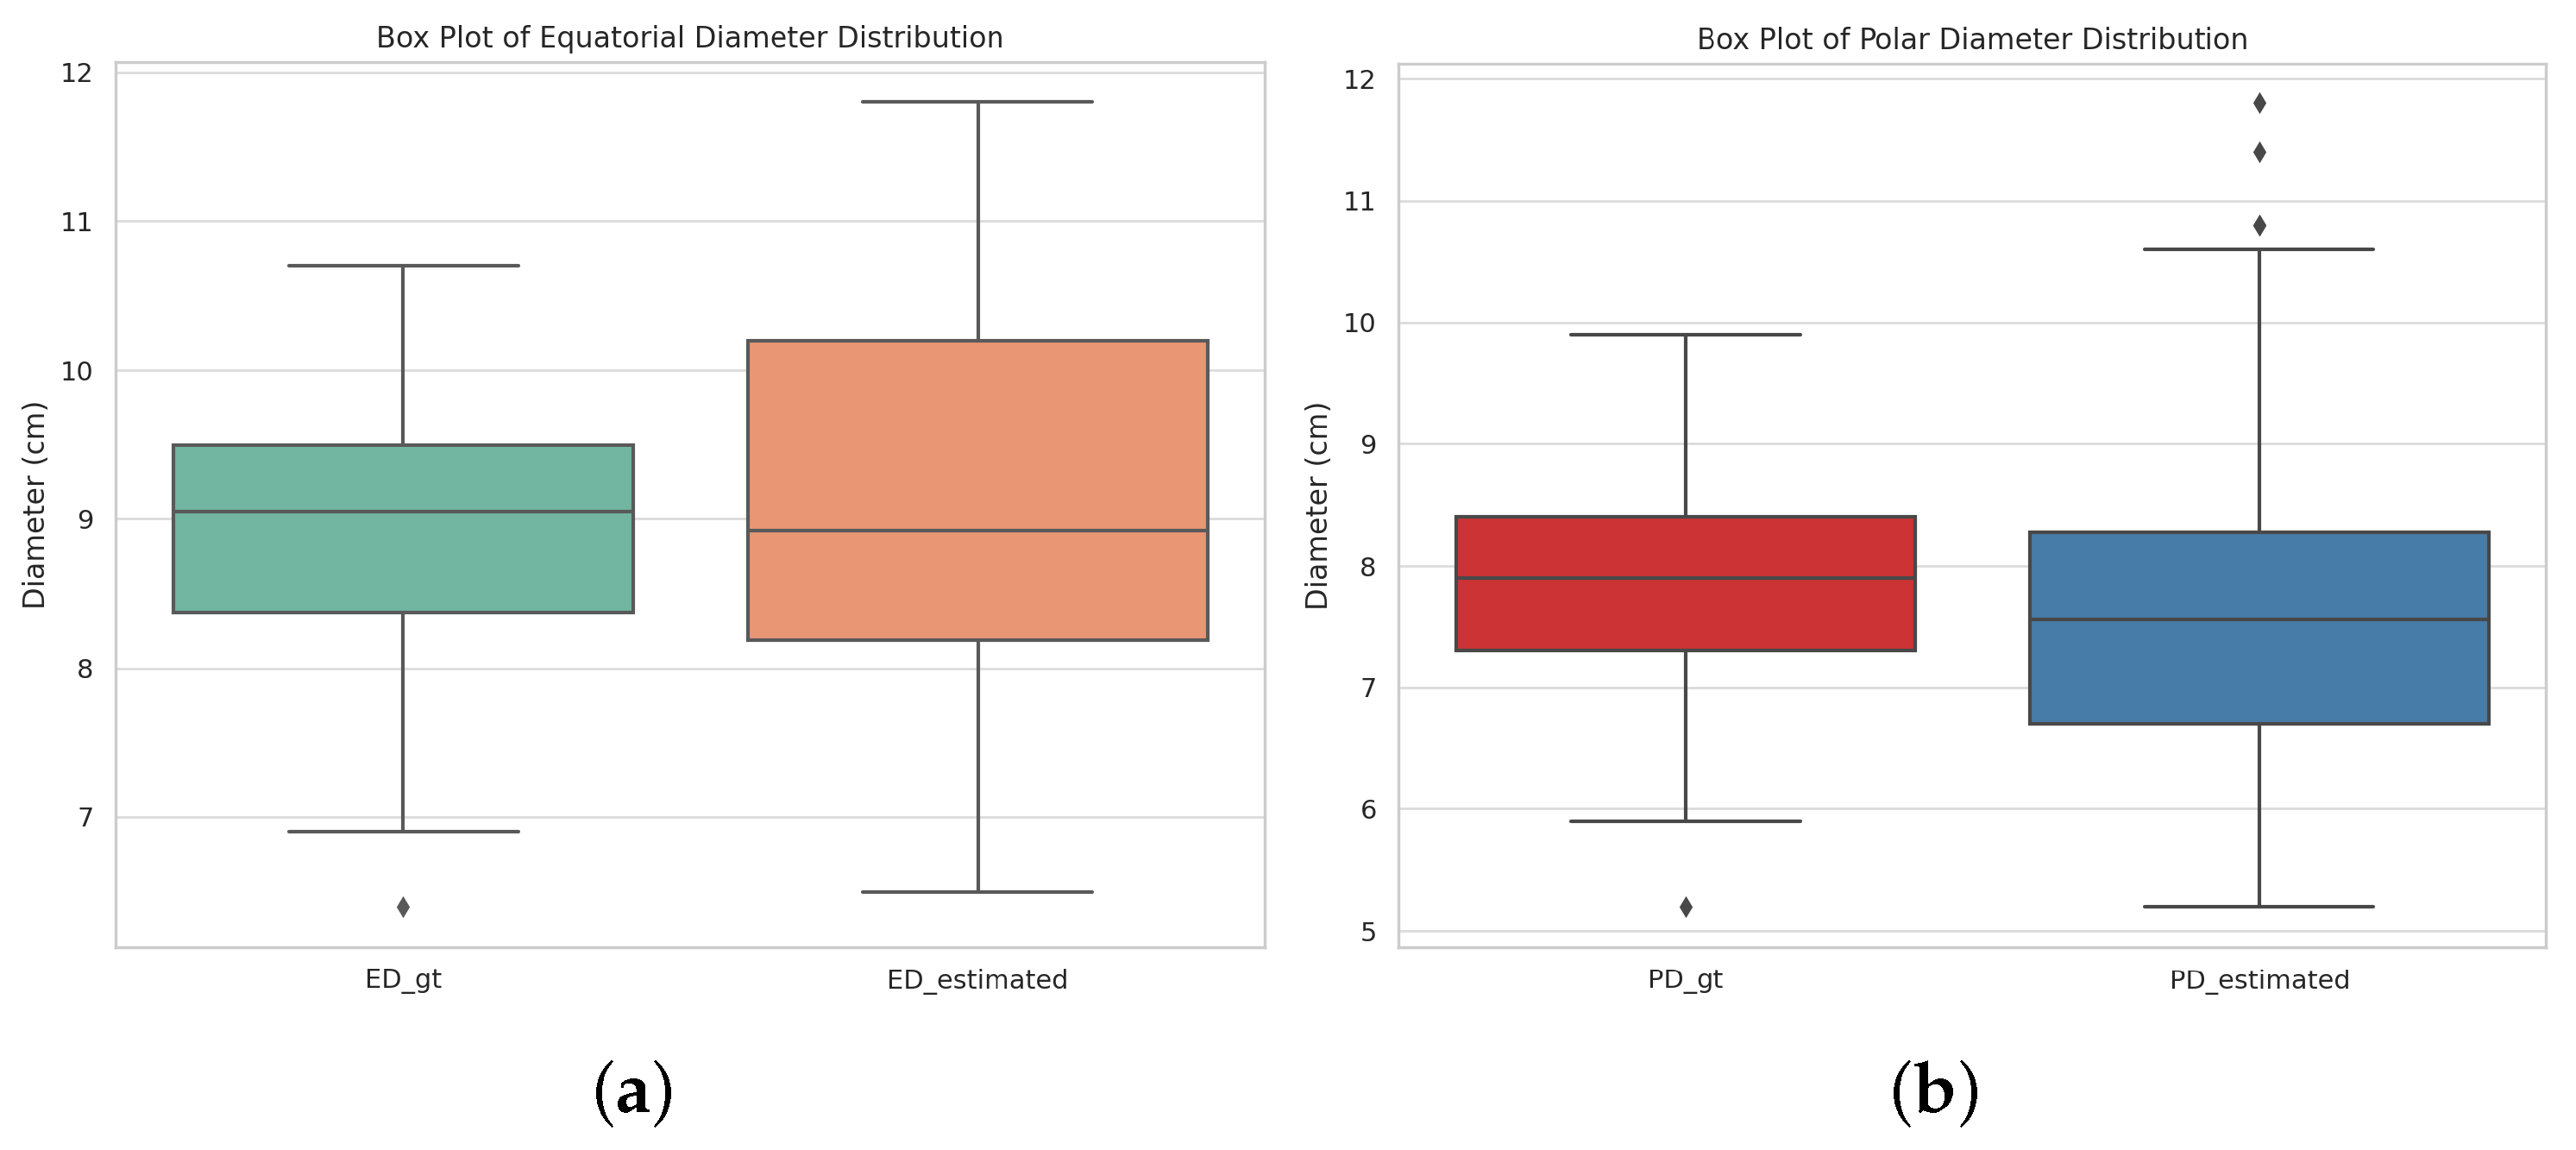
Of all detected fruits, 96 were randomly harvested and manually measured with a caliper for comparison. A box plot representation of collected ground-truth and camera-based estimates is provided in Figure 11. For equatorial diameters, the ground truth has a mean of 8.91 cm and a standard deviation of 0.85 cm. The estimated data show a mean of 9.15 cm and a standard deviation of 1.31 cm. This suggests a higher mean and greater variability in the estimated data compared to the ground truth. In the case of polar diameters, the ground-truth data show a mean of 7.89 cm with a standard deviation of 0.88 cm. The estimated data have a mean of 7.62 cm and a standard deviation of 1.37 cm, displaying a lower mean and a higher spread than the ground truth.
Figure 12 shows the error between ground-truth and vision-based measures for both equatorial (Figure 12a) and polar (Figure 12b) diameters. Specifically, each bar reports the difference between the caliper (ground truth) and the camera measurements for individual fruit samples. It can be seen that the errors appear relatively balanced around zero, mostly falling within ±2 cm.
Table 1 summarizes the error statistics obtained by comparing caliper- and camera-based measurements of fruit diameters in terms of Mean Absolute Error (MAE), standard deviation of absolute error (St.Dev.), Root Mean Square Error (RMSE), and Mean Absolute Percentage Error (MAPE). It can be seen that the performance of the camera system is consistent across both equatorial and polar diameters. Specifically, the MAE is 1.10 cm for equatorial and 1.05 cm for polar diameters, indicating that, on average, the deviation from the ground-truth caliper measurements is approximately 1 centimeter. The RMSE values (1.35 cm and 1.31 cm, respectively) support these findings and suggest that larger deviations are few, as the RMSE remains close to the MAE. The standard deviations of the error distributions (0.78–0.79 cm) indicate similar levels of variability across measurement types, confirming the stability of the system performance. When normalized to the reference size, the MAPE values are 12.4% and 13.3% for equatorial and polar diameters, respectively.

4. Discussion

Overall, the experimental results demonstrate that the camera-based approach provides reliable estimates of fruit size, with errors constrained to a narrow range and without substantial differences between equatorial and polar measurements. The higher noise observed in vision-based estimates can be attributed to multiple factors inherent in the fruit measurement procedure, including the following:
  • Segmentation issues: Difficulties in correctly detecting fruits, as a result of partially obscured or incorrectly identified fruit regions, which are common in real-world applications with high scene complexity.
  • Uncontrolled acquisition conditions: All tests are conducted in fully natural settings, without control over lighting and without removing major occlusions (e.g., through defoliation), which introduces variability in the data.
  • Acquisition platform limitations: Data collection is based on a consumer-grade depth sensor worth a few hundred euros mounted on a mobile robotic platform, occasionally leading to motion artifacts and reduced image quality.
Figure 13 shows two representative examples of challenging cases, where uneven illumination conditions (Figure 13a) and severe occlusions (Figure 13b) led to poor segmentation results.
Some state-of-the-art approaches (e.g., [23,33]) have reported relatively lower error rates. In particular, the approach proposed in [33] approximates the pomegranate shape to a sphere and reports a regression RMSE of 0.235 cm in the measurement of the radius of 100 randomly selected pomegranate samples. Their pipeline combines Mask R-CNN for instance segmentation with F-PointNet for 3D object detection, allowing highly accurate fruit localization and shape reconstruction. In contrast, our approach achieves an RMSE of 1.35 cm and 1.31 cm in the estimation, respectively, of the equatorial and polar diameter. Although these errors are larger in absolute terms, it is worth noting that the proposed system completely relies on semi-supervised fruit detection strategies that significantly reduce human intervention. As such, the system is more scalable and easier to adapt to large-scale deployments, although it may be inherently affected by segmentation errors compared to fully supervised, deep-learning-based pipelines such as Mask R-CNN.
In conclusion, the proposed approach remains competitive in field conditions and offers practical advantages in terms of automation and applicability to real-world orchard monitoring. Nevertheless, several challenges must be addressed before it can be deployed in full-scale commercial farming operations. These include hardware durability, effective coverage, and low-maintenance functioning for extended use. Algorithms must be improved to be able to handle a wide range of illumination conditions, canopy architectures, fruit orientations, and occlusions. Furthermore, ease of use and integration with farm management workflows are critical aspects to be considered for practical adoption [38]. Addressing these issues will be essential to translate the proposed prototype into a reliable, large-scale system suitable for commercial orchards.

5. Conclusions

In this paper, a new framework for on-tree pomegranate detection and sizing by a farmer robot equipped with an Intel RealSense D435 RGB-D camera is proposed. It relies on a multi-stage transfer learning approach to segment fruits, which employs a semi-supervised technique to reduce manual labeling. A connected component analysis clustering method is then used to separate individual fruits, followed by a fruit modeling strategy to fit an elliptical model to each cluster. Two-dimensional information is finally associated with the three-dimensional space for estimation of polar and equatorial diameters. Experimental results obtained in a commercial farm show that the proposed system is viable for in-field pomegranate morphological characterization with an average error on both the equatorial and polar diameters of about 1 cm. During the field trials, several challenging cases were encountered. These mainly involved partial occlusion by foliage or neighboring fruits and strong illumination contrasts. In such instances, segmentation and size estimation accuracy may be affected. These cases reflect the practical challenges of orchard environments.
Future work will be aimed at improving the robustness of the framework to better handle such conditions. An obvious enhancement would be the adoption of higher performance sensors available on the market such as LiDAR or high dynamic range cameras, which may enhance robustness and reliability in diverse field environments. Future developments could also benefit from incorporating illumination-invariant features or data augmentation strategies. The potential of the proposed technique will be further investigated through a comparative analysis with current mainstream detection and segmentation models including Mask R-CNN and the latest YOLO-based architectures, as well as with zero-shot learning approaches. Finally, research will focus on expanding the sample size, ensuring a more robust validation of the method generalizability. At the same time, the portability of the system to different crops (e.g., horticultural species) or different stages of fruit growth will be evaluated to assess its practical applicability in broader agricultural contexts.

Author Contributions

Conceptualization, A.M., G.R., S.P. and G.A.V.; methodology, A.M., G.R. and R.P.D.; software, A.M. and R.P.D.; validation, A.M., R.P.D., G.R. and F.V.; formal analysis, A.M., R.P.D. and G.R.; investigation, A.M., R.P.D. and G.R.; data curation, R.P.D., S.P.G., G.A.V., S.P., A.M. and G.R.; writing—original draft preparation, A.M., R.P.D. and F.V.; writing—review and editing, A.M. and G.R.; supervision, A.M. and G.R.; project administration, A.M. and G.R.; funding acquisition, A.M. and G.R. All authors have read and agreed to the published version of the manuscript.

Funding

This work was partially funded by the following projects: AgRibot-Harnessing Robotics, XR/AR, and 5G for a New Era of Safe, Sustainable, and Smart Agriculture, European Union’s Horizon Europe research and innovation programme (Grant Number: 101183158); CNR DIITET project DIT.AD022.207, STRIVE-le Scienze per le TRansizioni Industriale, Verde ed Energetica (FOE 2022), sub task activity Agro-Sensing2.

Data Availability Statement

The data presented in this study are available on request from the corresponding author.

Acknowledgments

The administrative support of Giuseppe Bono, Michele Attolico, and Paola Romano is gratefully acknowledged.

Conflicts of Interest

The authors declare no conflicts of interest.

References

  1. Montefusco, A.; Durante, M.; Migoni, D.; De Caroli, M.; Ilahy, R.; Pék, Z.; Helyes, L.; Fanizzi, F.P.; Mita, G.; Piro, G.; et al. Analysis of the Phytochemical Composition of Pomegranate Fruit Juices, Peels and Kernels: A Comparative Study on Four Cultivars Grown in Southern Italy. Plants 2021, 10, 2521. [Google Scholar] [CrossRef] [PubMed]
  2. Available online: https://esploradati.istat.it/databrowser/#/it/dw/categories/IT1,Z1000AGR,1.0/AGR_CRP/DCSP_COLTIVAZIONI/IT1,101_1015_DF_DCSP_COLTIVAZIONI_1,1.0 (accessed on 9 September 2025).
  3. Miranda, J.C.; Gené-Mola, J.; Zude-Sasse, M.; Tsoulias, N.; Escolà, A.; Arnó, J.; Rosell-Polo, J.R.; Sanz-Cortiella, R.; Martínez-Casasnovas, J.A.; Gregorio, E. Fruit sizing using AI: A review of methods and challenges. Postharvest Biol. Technol. 2023, 206, 112587. [Google Scholar] [CrossRef]
  4. Kaleem, A.; Hussain, S.; Aqib, M.; Cheema, M.J.M.; Saleem, S.R.; Farooq, U. Development Challenges of Fruit-Harvesting Robotic Arms: A Critical Review. AgriEngineering 2023, 5, 2216–2237. [Google Scholar] [CrossRef]
  5. Massaglia, S.; Borra, D.; Peano, C.; Sottile, F.; Merlino, V.M. Consumer Preference Heterogeneity Evaluation in Fruit and Vegetable Purchasing Decisions Using the Best–Worst Approach. Foods 2019, 8, 266. [Google Scholar] [CrossRef]
  6. Neupane, C.; Pereira, M.; Koirala, A.; Walsh, K.B. Fruit Sizing in Orchard: A Review from Caliper to Machine Vision with Deep Learning. Sensors 2023, 23, 3868. [Google Scholar] [CrossRef]
  7. Walsh, B.B. Advances in Agricultural Machinery and Technologies, 1st ed.; Chapter Fruit and Vegetable Packhouse Technologies for Assessing Fruit Quantity and Quality; CRC Press: Boca Raton, FL, USA, 2018. [Google Scholar]
  8. Gongal, A.; Amatya, S.; Karkee, M.; Zhang, Q.; Lewis, K. Sensors and systems for fruit detection and localization: A review. Comput. Electron. Agric. 2015, 116, 8–19. [Google Scholar] [CrossRef]
  9. Bargoti, S.; Underwood, J. Deep fruit detection in orchards. In Proceedings of the 2017 IEEE International Conference on Robotics and Automation (ICRA), Singapore, 29 May–3 June 2017; pp. 3626–3633. [Google Scholar] [CrossRef]
  10. Xiao, F.; Wang, H.; Xu, Y.; Zhang, R. Fruit Detection and Recognition Based on Deep Learning for Automatic Harvesting: An Overview and Review. Agronomy 2023, 13, 1625. [Google Scholar] [CrossRef]
  11. Milella, A.; Marani, R.; Petitti, A.; Reina, G. In-field high throughput grapevine phenotyping with a consumer-grade depth camera. Comput. Electron. Agric. 2019, 156, 293–306. [Google Scholar] [CrossRef]
  12. Santos, T.T.; de Souza, L.L.; dos Santos, A.A.; Avila, S. Grape detection, segmentation, and tracking using deep neural networks and three-dimensional association. Comput. Electron. Agric. 2020, 170, 105247. [Google Scholar] [CrossRef]
  13. Mane, S.; Bartakke, P.; Bastewad, T. DetSSeg: A Selective On-Field Pomegranate Segmentation Approach. In Proceedings of the 2023 IEEE International Conference on Computer Vision and Machine Intelligence (CVMI), Gwalior, India, 10–11 December 2023; pp. 1–6. [Google Scholar] [CrossRef]
  14. Wang, J.; Liu, M.; Du, Y.; Zhao, M.; Jia, H.; Guo, Z.; Su, Y.; Lu, D.; Liu, Y. PG-YOLO: An efficient detection algorithm for pomegranate before fruit thinning. Eng. Appl. Artif. Intell. 2024, 134, 108700. [Google Scholar] [CrossRef]
  15. Zhao, J.; Du, C.; Li, Y.; Mudhsh, M.; Guo, D.; Fan, Y.; Wu, X.; Wang, X.; Almodfer, R. YOLO-Granada: A lightweight attentioned Yolo for pomegranates fruit detection. Sci. Rep. 2024, 14, 16848. [Google Scholar] [CrossRef]
  16. Zhang, C.; Zhang, K.; Ge, L.; Zou, K.; Wang, S.; Zhang, J.; Li, W. A method for organs classification and fruit counting on pomegranate trees based on multi-features fusion and support vector machine by 3D point cloud. Sci. Hortic. 2021, 278, 109791. [Google Scholar] [CrossRef]
  17. Stajnko, D.; Rakun, J.; Blanke, M.M. Modelling apple fruit yield using image analysis for fruit colour, shape and texture. Eur. J. Hortic. Sci. 2009, 74, 260–267. [Google Scholar] [CrossRef]
  18. Stajnko, D.; Lakota, M.; Hočevar, M. Estimation of number and diameter of apple fruits in an orchard during the growing season by thermal imaging. Comput. Electron. Agric. 2004, 42, 31–42. [Google Scholar] [CrossRef]
  19. Apolo-Apolo, O.; Martínez-Guanter, J.; Egea, G.; Raja, P.; Pérez-Ruiz, M. Deep learning techniques for estimation of the yield and size of citrus fruits using a UAV. Eur. J. Agron. 2020, 115, 126030. [Google Scholar] [CrossRef]
  20. Lu, S.; Chen, W.; Zhang, X.; Karkee, M. Canopy-attention-YOLOv4-based immature/mature apple fruit detection on dense-foliage tree architectures for early crop load estimation. Comput. Electron. Agric. 2022, 193, 106696. [Google Scholar] [CrossRef]
  21. Giménez-Gallego, J.; Martínez-del Rincon, J.; Blaya-Ros, P.J.; Navarro-Hellín, H.; Navarro, P.J.; Torres-Sánchez, R. Fruit Monitoring and Harvest Date Prediction Using On-Tree Automatic Image Tracking. IEEE Trans. Agrifood Electron. 2025, 3, 56–68. [Google Scholar] [CrossRef]
  22. Méndez, V.; Pérez-Romero, A.; Sola-Guirado, R.; Miranda-Fuentes, A.; Manzano-Agugliaro, F.; Zapata-Sierra, A.; Rodríguez-Lizana, A. In-Field Estimation of Orange Number and Size by 3D Laser Scanning. Agronomy 2019, 9, 885. [Google Scholar] [CrossRef]
  23. Ferrer-Ferrer, M.; Ruiz-Hidalgo, J.; Gregorio, E.; Vilaplana, V.; Morros, J.R.; Gené-Mola, J. Simultaneous fruit detection and size estimation using multitask deep neural networks. Biosyst. Eng. 2023, 233, 63–75. [Google Scholar] [CrossRef]
  24. Gené-Mola, J.; Sanz-Cortiella, R.; Rosell-Polo, J.R.; Escolà, A.; Gregorio, E. In-field apple size estimation using photogrammetry-derived 3D point clouds: Comparison of 4 different methods considering fruit occlusions. Comput. Electron. Agric. 2021, 188, 106343. [Google Scholar] [CrossRef]
  25. Wang, Z.; Walsh, K.B.; Verma, B. On-Tree Mango Fruit Size Estimation Using RGB-D Images. Sensors 2017, 17, 2738. [Google Scholar] [CrossRef]
  26. Aerobotics. Available online: https://aerobotics.com/ (accessed on 5 September 2025).
  27. Green Atlas. Available online: https://greenatlas.com/ (accessed on 5 September 2025).
  28. Tevel. Available online: https://www.tevel-tech.com/ (accessed on 5 September 2025).
  29. Kootstra, G.; Wang, X.; Blok, P.M.; Hemming, J.; van Henten, E. Selective Harvesting Robotics: Current Research, Trends, and Future Directions. Curr. Robot. Rep. 2021, 2, 95–104. [Google Scholar] [CrossRef]
  30. Benos, L.; Moysiadis, V.; Kateris, D.; Tagarakis, A.C.; Busato, P.; Pearson, S.; Bochtis, D. Human–Robot Interaction in Agriculture: A Systematic Review. Sensors 2023, 23, 6776. [Google Scholar] [CrossRef] [PubMed]
  31. Benos, L.; Bechar, A.; Bochtis, D. Safety and ergonomics in human-robot interactive agricultural operations. Biosyst. Eng. 2020, 200, 55–72. [Google Scholar] [CrossRef]
  32. Devanna, R.P.; Milella, A.; Marani, R.; Garofalo, S.P.; Vivaldi, G.A.; Pascuzzi, S.; Galati, R.; Reina, G. In-Field Automatic Identification of Pomegranates Using a Farmer Robot. Sensors 2022, 22, 5821. [Google Scholar] [CrossRef] [PubMed]
  33. Yu, T.; Hu, C.; Xie, Y.; Liu, J.; Li, P. Mature pomegranate fruit detection and location combining improved F-PointNet with 3D point cloud clustering in orchard. Comput. Electron. Agric. 2022, 200, 107233. [Google Scholar] [CrossRef]
  34. Khoshnam, F.; Tabatabaeefar, A.; Varnamkhasti, M.G.; Borghei, A. Mass modeling of pomegranate (Punica granatum L.) fruit with some physical characteristics. Sci. Hortic. 2007, 114, 21–26. [Google Scholar] [CrossRef]
  35. Reina, G.; Mantriota, G. On the Climbing Ability of Passively Suspended Tracked Robots. J. Mech. Robot. 2025, 17, 075001. [Google Scholar] [CrossRef]
  36. Keselman, L.; Woodfill, J.I.; Grunnet-Jepsen, A.; Bhowmik, A. Intel(R) RealSense(TM) Stereoscopic Depth Cameras. In Proceedings of the 2017 IEEE Conference on Computer Vision and Pattern Recognition Workshops (CVPRW), Honolulu, HI, USA, 21–26 July 2017; pp. 1267–1276. [Google Scholar] [CrossRef]
  37. Haralick, R.M.; Shapiro, L.G. Computer and Robot Vision; Addison–Wesley: Reading, MA, USA, 1992; Volume 1. [Google Scholar]
  38. Milella, A.; Rilling, S.; Rana, A.; Galati, R.; Petitti, A.; Hoffmann, M.; Stanly, J.L.; Reina, G. Robot-as-a-Service as a New Paradigm in Precision Farming. IEEE Access 2024, 12, 47942–47949. [Google Scholar] [CrossRef]
Figure 1. The robotic platform used for in-field data acquisition.
Robotics 14 00131 g001
Figure 2. Schematic of the proposed pomegranate phenotyping system.
Robotics 14 00131 g002
Figure 3. Graphical scheme of the three-stage training process.
Robotics 14 00131 g003
Figure 4. Dataset generation for the first training stage: sample image acquired under uniform lighting conditions (a) and the corresponding labeled image obtained by color threshold (b).
Robotics 14 00131 g004
Figure 5. Dataset generation for the second training stage: sample image acquired under non-uniform lighting conditions (a), the corresponding coarse mask obtained by applying the first stage semantic segmentation network (b), and the same mask refined with morphological operations (c).
Robotics 14 00131 g005
Figure 6. Final network result for a sample in-field image. Original image (a); result of segmentation (b); projection of the 2D mask in the 3D space (c).
Robotics 14 00131 g006
Figure 7. Example of image segmentation. (a) Original RGB image; (b) binary mask deriving from semantic image segmentation; (c) binary mask after morphological operations.
Robotics 14 00131 g007
Figure 8. Ellipse fitting for the case of Figure 7. (a) Ellipse fitting applied to the refined binary mask. Each blob is circumscribed by an ellipse; (b) blobs after the application of an eccentricity threshold. Only ellipses with eccentricity within a predefined threshold are retained; (c) computation of principal axes of the ellipses fitted to the pomegranate blobs. The red dots mark the intersection points of the axes with the ellipses, representing the vertices that will be used to infer the fruit’s dimensions in three-dimensional space.
Robotics 14 00131 g008
Figure 9. Projection on the depth map. (a) Original RGB image; (b) aligned depth image; (c) close-up view of the projected poles on the disparity map aligned with RGB geometry. The false-color representation highlights the inaccuracies in depth at the fruit edges, with some poles falling outside the fruit; (d) close-up view after algorithmic correction of the poles. The poles are adjusted to ensure they fall within the pomegranate fruit’s actual boundaries.
Robotics 14 00131 g009
Figure 10. Sample images from the sequence acquired by the robotic farmer with overlaid fruit size estimates. The use of 3D information allows for determining the size of pomegranates located at different distances from the camera. The absence of pomegranates in the third frame from left reveals a tree with problems (discolored leaves).
Robotics 14 00131 g010
Figure 11. Box plots showing the distribution of equatorial (a) and polar (b) diameters, as obtained from caliper ( E D g t and P D g t ) and from the automated approach ( E D e s t i m a t e d and P D e s t i m a t e d ). The line inside the box represents the median value of the distribution.
Robotics 14 00131 g011
Figure 12. Error ( c a l i p e r c a m e r a ) for equatorial (a) and polar (b) diameters at each fruit sample.
Robotics 14 00131 g012
Figure 13. Representative examples of challenging cases: (a) poor illumination conditions; (b) severe occlusions from leaves or neighboring fruits. Such conditions may lead to inaccurate segmentation and fruit size estimation.
Robotics 14 00131 g013
Table 1. Comparison between caliper- and camera-based measurements: Mean Absolute Error (MAE), standard deviation of absolute error (St.Dev.), Root Mean Square Error (RMSE), and Mean Absolute Percentage Error (MAPE) for equatorial and polar diameters.
MAE [cm]St.Dev. [cm]RMSE [cm]MAPE [%]
Eq. Diam.1.100.781.3512.4
Pol. Diam.1.050.791.3113.3
Disclaimer/Publisher’s Note: The statements, opinions and data contained in all publications are solely those of the individual author(s) and contributor(s) and not of MDPI and/or the editor(s). MDPI and/or the editor(s) disclaim responsibility for any injury to people or property resulting from any ideas, methods, instructions or products referred to in the content.