Article

Optimized Decentralized Swarm Communication Algorithms for Efficient Task Allocation and Power Consumption in Swarm Robotics

by
Mohamed Yasser
1,
Omar Shalash
1,* and
Ossama Ismail
2
1
College of Artificial Intelligence, Arab Academy for Science, Technology and Maritime Transport, Alexandria 1029, Egypt
2
Arab Academy for Science, Technology and Maritime Transport, Alexandria 1029, Egypt
*
Author to whom correspondence should be addressed.
Robotics 2024, 13(5), 66; https://doi.org/10.3390/robotics13050066
Submission received: 21 March 2024 / Revised: 20 April 2024 / Accepted: 25 April 2024 / Published: 26 April 2024
(This article belongs to the Section AI in Robotics)

Abstract

:
Unanimous action to achieve specific goals is crucial for the success of a robotic swarm. This requires clearly defined roles and precise communication between the robots of a swarm. An optimized task allocation algorithm defines the mechanism and logistics of decision-making that enable the robotic swarm to achieve such common goals. With more nodes, the traffic of messages that are required to communicate inside the swarm relatively increases to maintain decentralization. Increased traffic eliminates real-time capabilities, which is an essential aspect of a swarm system. The aim of this research is to reduce execution time while retaining efficient power consumption rates. In this research, two novel decentralized swarm communication algorithms are proposed, namely Clustered Dynamic Task Allocation–Centralized Loop (CDTA-CL) and Clustered Dynamic Task Allocation–Dual Loop (CDTA-DL), both inspired by the Clustered Dynamic Task Allocation (CDTA) algorithm. Moreover, a simulation tool was developed to simulate different swarm-clustered communication algorithms in order to calculate the total communication time and consumed power. The results of testing the proposed CDTA-DL and CDTA-CL against the CDTA attest that the proposed algorithm consumes substantially less time. Both CDTA-DL and CDTA-CL have achieved a significant speedup of 75.976% and 54.4% over CDTA, respectively.

1. Introduction

With the advancement of automation in the industrial world, such as flying drones [1], autonomous driving [2,3,4], biomedical engineering [5,6], and agriculture [7], many researchers have shown interest in different strategies for centralized computations due to the lack of computational power, as in [8,9]. One of the approaches to decentralized problem-solving is swarm intelligence. Studies on social insects have shown different aspects of swarm intelligence, for example, maintaining equilibrium, issuing orders, and evolving plans [10,11,12,13,14,15,16]. In a colony, social insects are the workers who perform tasks like exploring, foraging, hunting, defending, constructing, etc. However; a single worker doesn’t usually perform all tasks. Therefore, in order to coordinate all tasks, a lot of sensory input is required and communicated between insects to be able to sustain self-organization (SO) [17,18,19].
Studies have shown that to apply swarm intelligence to a robotic system, the main characteristics of this system should allow the allocation of autonomous robots as well as a cooperative method of operation between robotic members, while preventing the existence of centralized communication or a single external unit of control [20,21,22,23,24,25,26,27]. Meanwhile, the behavior of any robot in a swarm should reflect robustness, scalability, and flexibility. The robustness of a swarm is the ability to cope with the loss of a node or a leader [28], flexibility is the ability to operate in different environments and perform different tasks, while scalability is the ability of the swarm to perform regardless the size of the group as well as the number of tasks to be performed by the swarm. The number of applications that utilize swarm intelligence is exponentially increasing, hence its communication problems [29,30,31,32]. Given the increase in the need to use swarm intelligence, the Particle Swarm Optimization (PSO) technique was introduced, in which a swarm of particles is modeled and moved in a virtual search space to present a potential solution to a given swarm problem. This technique was inspired by the interactions and movements between birds in a flock [33,34,35,36,37].
The motivation of this research is to improve the capabilities of densely populated robotic swarms to perform more complex tasks while reducing both power consumption and communication delays between swarm members.
This research aims to improve the efficiency and effectiveness of robotic swarms through the use of a decentralized derivation from the Clustered Dynamic Task Allocation algorithm with better efficiency in execution time and less power consumption for the robots in the swarm.
The objectives of this research are twofold: firstly, to develop a decentralized swarm-based algorithm for task allocation. Secondly, to develop a simulation tool (Pyswaro) that can simulate and accurately test the proposed algorithms’ execution time and battery level over the previous algorithm.
The article is structured as follows. In Section 2, related work to the proposed work is reviewed. In Section 3, we state the problems in previously described methods regarding communication overhead and a centralized approach followed by the proposed methods, and algorithms. In Section 4, the results of the simulation of the proposed algorithm are compared to a related work algorithm simulated on the same tool, which was also especially developed and presented for simulating the communication between swarm groups. In Section 5, a discussion about the results is presented, followed by Section 6 to conclude the conducted work.

2. Related Work

Many decentralized algorithms have been developed in order to optimize the communication between swarm entities. Authors in [38,39] proposed an ant algorithm that was used in the context of node cooperation to solve a given task. The algorithm was inspired by social insects as a colony and used to allocate colony specialists using the Ant Colony Optimizer (ACO).
Another study inspired by the bee hive, refs. [40,41,42], used a Distributed Bee Algorithm (DBA). The algorithm was proven to be scalable in terms of the number of nodes, and also adaptive to a non-uniform organization of nodes’ qualities.
In [43], the authors proposed a decentralized strategy for task allocation problems by creating a task selection probability function without any communication or messaging between robots. In [44], a multi-task allocation model for mobile crowd-sensing was designed to maximize the overall sensing quality of all tasks. The algorithm has shown a speed-up in execution compared to previous algorithms.
In the research proposed by [45], the aim was to prolong the network lifetime using a novel energy-efficient clustering mechanism. Their algorithm used an artificial bee colony (ABC) and PSO. However, ABC is used for global optimization problems but Clustered Dynamic Task Allocation (CDTA) (which is the base algorithm for the proposed research) is used specifically for task allocation in swarm robotics by measuring the execution time and power consumption of the tasks, not only fitness of the solution.
The next iteration of research is the Dynamic Task Allocation algorithm (DTA). According to [46], all robot members of a swarm are equally able to perform a specific task, but the problem lies in specifying which tasks should be performed by each robot member, as well as the priority of some tasks over the others given the circumstances of the environment. Robot members of a swarm being idle is also not permitted, since, ideally, all robots should execute tasks as long as they are capable. The DTA algorithm aims to optimize the selected tasks for each robot so as to enhance the overall performance of the swarm as well as to reduce execution time. The main idea of DTA is to constantly adapt to changes to the state of the swarm by reallocating tasks to different robots based on several factors like the addition of new tasks with higher priority values and the addition or removal of robots from the swarm for any reason. The problem that arises is the capability limits of the robots themselves. Robot members of the swarm may have limited communication abilities that prevent them from fetching global swarm information or being forced to physically traverse the environment to reach suitable proximity for communications, which hinders performance and increases execution time.
Another approach driven by DTA was developed to manage task allocation as a dynamic task allocation algorithm with a global approach (GDTA). The algorithm was initially based on PSO. If the task was segmented, then decision assembling results were robust and beneficial in terms of efficiency. The algorithm relies on decentralized decision-making. On the other hand, GDTA uses a full-mesh approach, which leads to communication overhead with the increasing number of nodes [47,48].
In [49], authors proposed the Clustered Dynamic Task Allocation (CDTA) algorithm. The goal of CDTA is to perform by means of dividing the robotic swarm into clusters, where each cluster’s objective is to aggregate the best in-cluster value, which represents a decision to take based on the swarm’s objective, which is denoted by Cbest. Afterward, all Cbest values are compared to derive a final and global decision that all swarm members will execute, which is denoted by global best allocation Gbest. According to [49], a clustered topology is flexible as it has no rules compared to the star and tree topologies, which explains why it can be adapted to different use cases. Each cluster in the CDTA algorithm has designated informant and non-informant robots. Informant robots are responsible for aggregating the value of Cbest, which is the best solution in the respective cluster. The proposed algorithms were inspired by the CDTA algorithm.
As discussed by [49], the CDTA algorithm can be chosen for robotic swarms over more common and well-studied algorithms like Particle Swarm Optimization (PSO) due to its ability to adapt to dynamic environments where parameters of the optimization problem change over time, requiring quick, diverse, and efficient adaptability. The clustered nature of the CDTA algorithm also optimizes the task allocation process, which results in better performance regarding execution time, as opposed to more traditional algorithms.
The exploration of synchronization phenomena in complex dynamical networks, as demonstrated by [50,51], offers valuable insights into the communication and coordination challenges faced in swarm robotics. The investigation led by  [50] highlights the importance of nonlinear control schemes in ensuring synchronization in the presence of external disturbances. By conceptualizing synchronization as a communication process between distinct network components, similarities with the clustered nature of the CDTA algorithm, and its variants, can be observed.
Similarly, ref.  [51] explored master–slave outer synchronization in diverse inner–outer network topologies. Their research sheds light on the role of single nodes as bridges between subnetworks. Through their analysis of coupling strategies and network stability, they provide insights into how information flows between network components and how synchronization can be achieved across interconnected systems, which aligns as well with communication in CDTA (see Section 2.1). The conceptualization of synchronization as a communication process between subnetworks offers a valuable perspective on how swarm members exchange information and coordinate their actions in a clustered configuration.

2.1. CDTA Stages

The CDTA algorithm consists of five main stages:
  • Initialization stage,
  • Tuning stage,
  • Identification stage,
  • Updating stage,
  • Stopping stage.
In the CDTA algorithm, robots are divided into two groups: informants and non-informants. Informant robots are responsible for communicating and exchanging information about the best solutions within their cluster and across clusters. Non-informant robots, on the other hand, rely on the information provided by informants to update their own best solutions.
In the initialization stage, the initial parameters of the CDTA algorithm are set. Such parameters include the total number of robots for each cluster, the number of tasks, the role of each robot, which is either informant or non-informant, as well as initial values for the suggested solution by each robot and their perceived cluster best value Cbest and Gbest values.
In the tuning stage, for each cluster, each robot calculates its value for the suggested solution for the dynamic task allocation problem. The robots then begin communicating with other robots in the same cluster by sending their identifiers as well as their suggested solutions. Each robot receives multiple potential values for Cbest from other robots and decides to keep the best value before communicating with other robots. When each robot holds the potential values of all other robots in the same cluster, then this stage is completed and each robot knows the true value of Cbest.
In the identification stage, after each cluster knows its respective Cbest value, it is desirable to compare the Cbest values of all clusters and compare them in order to evaluate the value of Gbest, which is the absolute best solution for the given task for the entire robotic swarm. Only informant robots are responsible for this stage. The informant robots of each cluster communicate with each other, exchanging multiple values of Cbest. When this stage concludes, all the informant robots will have acquired the true value of Gbest.
Up until the updating stage, only the informants have acquired the value of Gbest. In the updating stage, all non-informant robots of each cluster await communication from the informant robot, so that they can update their Cbest value to the Gbest value. This stage ends when all non-informant robots have acquired the value of Gbest.
In the stopping stage, it is determined whether the optimal solution has been reached or not, thus determining whether another iteration of the CDTA algorithm is needed or not. Once the optimal solution has been reached, the CDTA algorithm is successful and all robots can start executing the task.
It is important to acknowledge the effect of tuning parameters in the PSO algorithm and other algorithms inspired by it, like the CDTA algorithm. Some of the parameters that affect the algorithms’ operation are the inertia weight (w), the cognitive learning rate ( c 1 ), and the social learning rate ( c 2 ). The inertia weight (w) in PSO-based algorithms balances exploration and exploitation during optimization. It dictates the tendency of particles to retain their current velocities, influencing the degree to which particles can explore, as opposed to exploiting promising solutions. Additionally, the cognitive learning rate ( c 1 ) represents a particle’s confidence in its own best-known position, while the social learning rate ( c 2 ) represents its confidence in the best-known position among its neighbors in the cluster. During the experiments and simulations, certain values for w, c 1 , and  c 2 were selected based on [52]. As a result, a value of 0.6 was set for w to allow for a balanced mode of operation between exploration and exploitation. Similarly, a value of 1.8 was selected for both c 1 and c 2 . The stages of the CDTA algorithm can be presented as pseudo-code in the following Algorithm 1, as implemented by [49].
The CDTA algorithm suffers from slow execution time as well as inefficient power consumption in large swarm populations due to its communication method, which, in turn leads, to the reliance on a base station for inter-swarm communications.
Algorithm 1 CDTA: main steps executed by a robot
1:
Initialization
2:
repeat
3:
    Tuning
4:
    Identification
5:
    if informant_robot then
6:
      Updating
7:
    end if
8:
    Stopping/Executing Task
9:
until A valid allocation is found
  • ▹ Setting initial parameters
  •  
  • ▹ Adjusting parameters for optimization
  • ▹ Determining local best solution
  • ▹ Check if robot is an informant
  • ▹ Updating local best to global best
  •  
  • ▹ Check termination condition
  •  

2.2. Hardware Configuration and Applications

According to [49], the CDTA algorithm was carried out by ELISA-3 robots. An ELISA-3 robot contains embedded devices that facilitate communication with other ELISA-3 robots. Such embedded devices include an 8 MHz ATmega 2560 microcontroller with 8 KB of RAM [53]. The program of each ELISA-3 robot is stored in a 4 KB EEPROM. All communications that occur in the CDTA algorithm pass through a radio base station of type nRF24L01+ [54]. This base station is connected to a computer via a USB cable. The rate of transmission of communication packets between the swarm robots and the antenna is 250 KB/s. It is worth noting that the proposed novel algorithms CDTA-CL and CDTA-DL did not utilize ELISA-3 robots. Both algorithms were tested on Yanshee robots (see Section 4.3) as well as the simulation tool Pyswaro (see Section 3.3).
By utilizing the hardware capabilities and mobility of robots such as ELISA-3 and Yanshee, various applications of CDTA, which is PSO-based, can be implemented to solve real-world problems.
Such implementations cover many fields. For example, the field of engineering could benefit from the integration of robots equipped with PSO-based algorithms in tasks such as the inverse modeling of leakage in earth dams to improve infrastructure stability and prevent potential disasters [55].
In the medical field, the deployment of robotic systems leveraging PSO-based algorithms can assist medical professionals in the early detection of cancerous pulmonary nodules, thereby significantly improving patient outcomes [56].
In security and controlling crowded events, robotic systems equipped with PSO-based algorithms excel in tracking targets with high precision in images and videos. Powering different types of robots by PSO-based algorithms offers solutions to various real-world problems [57,58].
For CDTA-based applications, in [59], the problem of dynamic task allocation is addressed in the domain of UAV swarms. Their research introduced a clustered approach to the problem where swarm members are assigned different roles in complex combat scenarios. The UAV swarm is clustered according to the different roles of a single top leader, group leaders, and followers. Such time-critical multi-target combat applications apply a great cost to execution time.
Applying algorithms like CDTA enhances the process of organizing and optimizing communication between the top leader and group leaders, between group leaders and followers, as well as between members of the same cluster to accomplish the task of engaging with multiple targets simultaneously. The characteristics of multi-target combat swarms align with the CDTA algorithm, owing to its dynamic role-based clustered nature.

3. Methodology

The Clustered Dynamic Task Allocation (CDTA) algorithm is better than the Global Dynamic Task Allocation (GDTA) algorithm in terms of scalability, robustness, and adaptability [49]. CDTA divides the swarm into smaller clusters, allowing for better management of the swarm and avoiding congestion, which improves the overall performance of the swarm. Additionally, if a robot fails, the swarm can continue to function, as the other robots in the cluster can take over the tasks, making CDTA more robust. CDTA is also more adaptable, as it can handle changes in the environment and task requirements more effectively. The swarm can adjust to new tasks and changes in the environment by redistributing tasks among the clusters. Building on top of that, the proposed CDTA-CL and CDTA-DL algorithms offer complete decentralization, as members of the swarm do not need to rely on a base station, as well as optimized communication modes that reduce latency and power consumption.
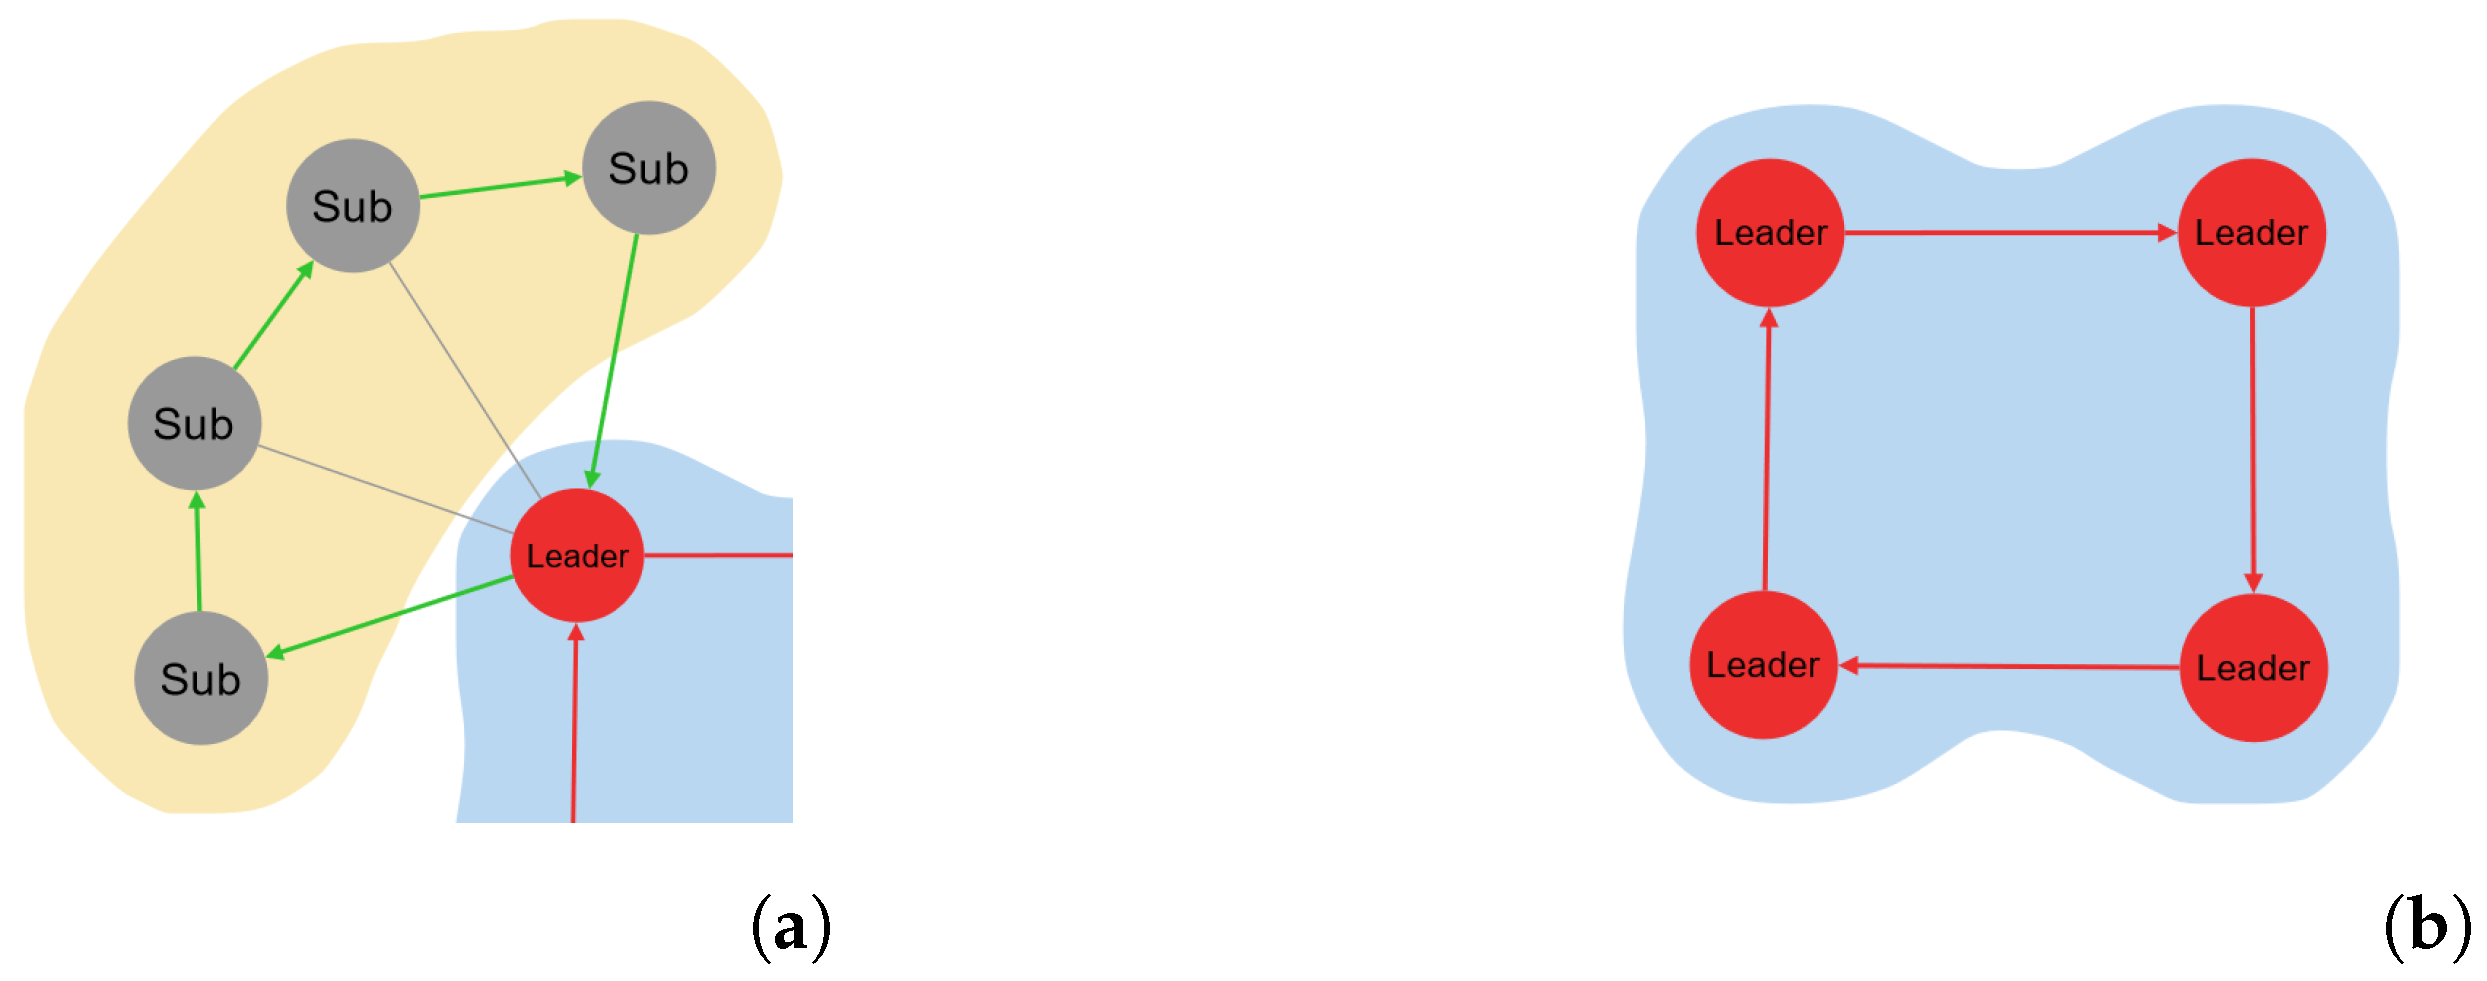
Proposed enhancements to the CDTA algorithm involve major modifications to the core communication processes. The proposed algorithm consists of two variations CDTA–Centralized Loop (CDTA-CL) and CDTA–Dual Loop (CDTA-DL) (see Figure 1a,b). Both variations share the same starting conditions; hence, the leader of each swarm cluster knows the identifiers of its subordinates. Also, each subordinate inside a cluster knows the identifiers of other subordinates of the same cluster as well as the identifier of the leader.

3.1. CDTA-CL and CDTA-DL

All robots of the swarm are expected to communicate directly without the need for a central base station due to the knowledge of other cluster members’ identifiers. In order to allocate a task (in both variations), the following stages are needed:
  • Leader synopsis,
  • Leaders’ congregation,
  • Result circulation.

3.1.1. Objective Function and Optimization Goal

The CDTA-CL and CDTA-DL algorithms aim to optimize task allocation within a robotic swarm; this optimization involves minimizing both power consumption and communication delays, which are interconnected factors affecting swarm efficiency.
Mathematically, the optimization objective can be stated as follows in Equation (1):
Minimize f ( P , D )
where f represents the objective function of minimization, P represents power consumption, and D represents communication delays. This function describes the trade-off between both energy and communication efficiency in the robotic swarm.
Higher communication delays lead to increased power consumption due to longer periods of active communication, thereby impacting energy efficiency negatively. Oppositely, minimizing power consumption can decrease the effects of communication delays by reducing the energy burden on individual swarm members, and enhancing overall system performance.
To quantify the relation between power consumption, communication delays, and swarm performance, we introduce the following Equation (2):
f ( P , D ) = α · P + β · D
where α and β are coefficients representing the importance of power consumption (P) and communication delays (D), respectively. This objective function f ( P , D ) aims to minimize the combined effect of power consumption and communication delays on swarm performance, which, in turn, optimizes task allocation in the robotic swarm.
To maintain consistency with the parameters used in the PSO-based algorithms, the values chosen for α and β were aligned with those for c 1 and c 2 and w. Specifically, α and β were set to 1.8 and 0.6, respectively, matching the values selected for c 1 and c 2 and w, respectively. This alignment ensures a balanced consideration for the trade-off between power consumption and communication delays in the optimization process, facilitating effective task allocation in the robotic swarm.

3.1.2. Leader Synopsis

The goal of this stage is to calculate Cbest, which is the responsibility of the leader of each cluster. Since the leader already knows the identifiers of their subordinates, communication can be done directly between the leader and the subordinates without further inquiry involving a base station making the task allocation process fully autonomous, independent, and decentralized.
For example, if we consider a cluster of particles of size N, each particle P i formulates a candidate value for Cbest that can be denoted by A i . The value of A i is based on the type of task (raiding, foraging, exploration,... etc.). The cluster leader has to aggregate N values for A: A 0 , A 1 , …, A N 1 , to achieve the value of Cbest and conclude the leader synopsis stage.
In the CDTA-CL variation, the leader of the cluster is considered to be the central point of communication. In a traditional star network topology, there exists a central hub or networking device that receives and relays all communications (see Figure 2). However, In the CDTA-CL variation, a novel network structure is applied to capitalize on the properties of the robotic swarm; this structure is referred to as the Centralized Loop. Using the Centralized Loop structure, the leader communicates with each subordinate (i) of its cluster asking for their value of Ai, which is the perceived allocation of the task according to the respective subordinate. Subsequently, the addressed subordinates reply to the cluster leader with the required values. It is then the leader’s responsibility to calculate Cbest, which is the best allocation for the task according to the leader’s cluster (see Figure 3). The steps of operation of the leader synopsis stage for the CDTA-CL algorithm can be formulated as pseudo-code in Algorithm 2.
The CDTA-DL variation addresses this stage in a different manner. The ring network topology has been adapted into a complex and novel structure that utilizes the properties of robotic swarms for maximum performance; this novel structure is referred to as the dual loop. The dual loop structure is applied where communication starts with the leader of the cluster. The leader sends for the first available subordinate the inquiry to calculate Cbest as well as a bit-masked integer where, in binary form, each bit Bi indicates that the subordinate with the identifier i is available and still has not contributed to the synopsis stage. This state is defined by the value of B, which is either 0 or 1. In this variation, the responsibility of calculating Cbest is distributed among all members of the cluster, which reduces the energy drain of the cluster leader (see Figure 4a). Each subordinate calculates Equation (3).
Algorithm 2 Leader synopsis for CDTA-CL
1:
Input: Cluster leader (L), Subordinates (S)
2:
Output:  C best
3:
procedure LeaderSynopsisCDTACL( L , S )
4:
     C best 0
5:
    for  s 1 to  Size ( S ) do
6:
         A s  FormulateCandidate(s)
7:
         C best max ( C best , A s )
8:
    end for
9:
    return  C best
10:
end procedure
11:
procedure FormulateCandidate(s)
12:
     A s  TaskAllocationFunction(s)
13:
    return  A s
14:
end procedure
15:
procedure TaskAllocationFunction(s)
16:
    Perform calculations and operations to determine A s based on the task type
17:
    return  A s
18:
end procedure
  •  
  •  
  •  
  • ▹ Initialize the best allocation
  • ▹ Iterate through subordinates
  • ▹ Each subordinate formulates a candidate value A s
  • ▹ Aggregate N values of A
  •  
  • ▹ Return the best allocation
  •  
  •  
  • ▹ Based on the type of task
  •  
  •  
  •  
  •  
  •  
  •  
C best i = max ( A i , C best i 1 )
where Cbest i 1 is the best-accumulated value of A before reaching the current subordinate in the dual loop structure. The current subordinate in question compares the best between the two values and passes its own value of Cbest to the next subordinate after setting its own bit in the sub-mask to the value 0.
When the entire integer sub-mask has a value of 0, it means that all subordinates have been inquired and that the current subordinate should report directly to the leader the final value of Cbest and, with this, the dual loop would be closed and the leader would have received the true value of Cbest. At the end of the leader synopsis stage, the value of Cbesti of the last subordinate of the dual loop should be equal to the value of Cbest of the whole cluster. The steps of operation of the leader synopsis stage for the CDTA-DL algorithm can also be written in the form of pseudo-code in Algorithm 3.
Algorithm 3 Leader synopsis for CDTA-DL
1:
Input: Cluster leader (L), Subordinates (S)
2:
Output:  C best
3:
procedure LeaderSynopsisCDTADL( L , S )
4:
     C best 0
5:
     B 2 | S | 1
6:
    while  B 0 do
7:
         s  GetNextAvailableSubordinate(B)
8:
         A s  FormulateCandidate(s)
9:
         C best max ( C best , A s )
10:
         B B ( 2 s )
11:
    end while
12:
    return  C best
13:
end procedure
14:
procedure GetNextAvailableSubordinate(B)
15:
     s 0
16:
    while  B mod 2 = 0  do
17:
         B B / 2
18:
         s s + 1
19:
    end while
20:
    return s
21:
end procedure
22:
procedure FormulateCandidate(s)
23:
     A s  TaskAllocationFunction(s)
24:
    return  A s
25:
end procedure
26:
procedure TaskAllocationFunction(s)
27:
    Perform calculations and operations to determine A s based on the task type
28:
    return  A s
29:
end procedure
  •  
  •  
  •  
  • ▹ Initialize the best allocation
  • ▹ Initialize the bit-mask with all bits set to 1
  • ▹ Loop until all subordinates have contributed
  • ▹ Find the next available subordinate
  • ▹ Each subordinate formulates a candidate value A s
  • ▹ Aggregate N values of A
  • ▹ Set the bit corresponding to s to 0 in the bit-mask
  •  
  • ▹ Return the best allocation
  •  
  •  
  • ▹ Initialize the index of the next available subordinate
  • ▹ Find the next bit set to 1 in the bit-mask
  •  
  •  
  •  
  • ▹ Return the index of the next available subordinate
  •  
  •  
  • ▹ Based on the type of task
  •  
  •  
  •  
  •  
  •  
  •  

3.1.3. Leader Congregation

This stage aims to find the value Gbest, which is the global best allocation among all clusters. Both CDTA-CL and CDTA-DL variations follow the same algorithm in this stage. The leaders of all clusters utilize a dual loop structure in the same way that occurred in the leader synopsis stage in the CDTA-DL variation, with the difference that the integer sub-mask represents other available cluster leaders instead of subordinates. Additionally, when the leader that initiated the dual loop communication receives the value of Gbest, it initiates another dual loop congregation in order to inform the other leaders of the final value of Gbest (see Figure 4b). The pseudo-code in Algorithm 4 shows the steps of operation of the leader congregation stage for both CDTA-CL and CDTA-DL algorithms.
Algorithm 4 Leader congregation for CDTA-CL
1:
Input: Cluster leader (L), Other cluster leaders ( L other )
2:
Output:  G best
3:
procedure LeaderCongregation( L , L other )
4:
    for  l L other  do
5:
         G best max ( G best , LeaderSynopsisCDTADL ( l ) )
6:
    end for
7:
    for  l L other  do
8:
        Inform(l, G best )
9:
    end for
10:
    return  G best
11:
end procedure
12:
procedure Inform(l, G best )
13:
    Send message to leader l with the value of G best
14:
end procedure
  •  
  •  
  •  
  • ▹ Loop through other cluster leaders
  • ▹ Find the global best allocation
  •  
  • ▹ Inform other leaders of the final value of G best
  •  
  •  
  • ▹ Return the global best allocation
  •  
  •  
  •  
  •  

3.1.4. Result Circulation

By this stage, all leaders should already know the value of Gbest. In this stage, each leader ensures that all of their subordinates in their respective clusters are informed of the same value of Gbest so that it becomes swarm-wide knowledge. Each variation (see Figure 5a,b) follows the same algorithm that was executed in its leader synopsis stage, whether it was a centralized or dual loop communication. The difference is that the goal of communication becomes to inform the subordinates of the value of Gbest, rather than inquiring to calculate Cbest.
After evaluating the CDTA-CL and CDTA-DL variations, it is important to emphasize that, while Equations (4) and (5) provide quantitative insights into the algorithms’ performance, they do not fully describe the entire process. These equations offer performance estimates primarily in controlled environments, such as simulations. However, it is crucial to acknowledge that real-world swarm behavior is influenced by various parameters and environmental conditions that cannot be fully captured or predicted by mathematical formulations alone.
Equation (4) represents the total time consumed in the operation of CDTA-CL, where S represents the size of the swarm, L represents the number of leaders in the swarm, and C is a value representing the communication delay between swarm robots.
t = 2 · S L L · C + 2 · L · C + 2 · S L L · C
Similarly, Equation (5) describes the total time consumed in the operation of CDTA-DL. These equations offer valuable insights into the efficiency of the algorithms, but should not be interpreted as exhaustive descriptions of their performance.
t = 2 · L · C + S L L + 1 · C + S L L + 1 · C
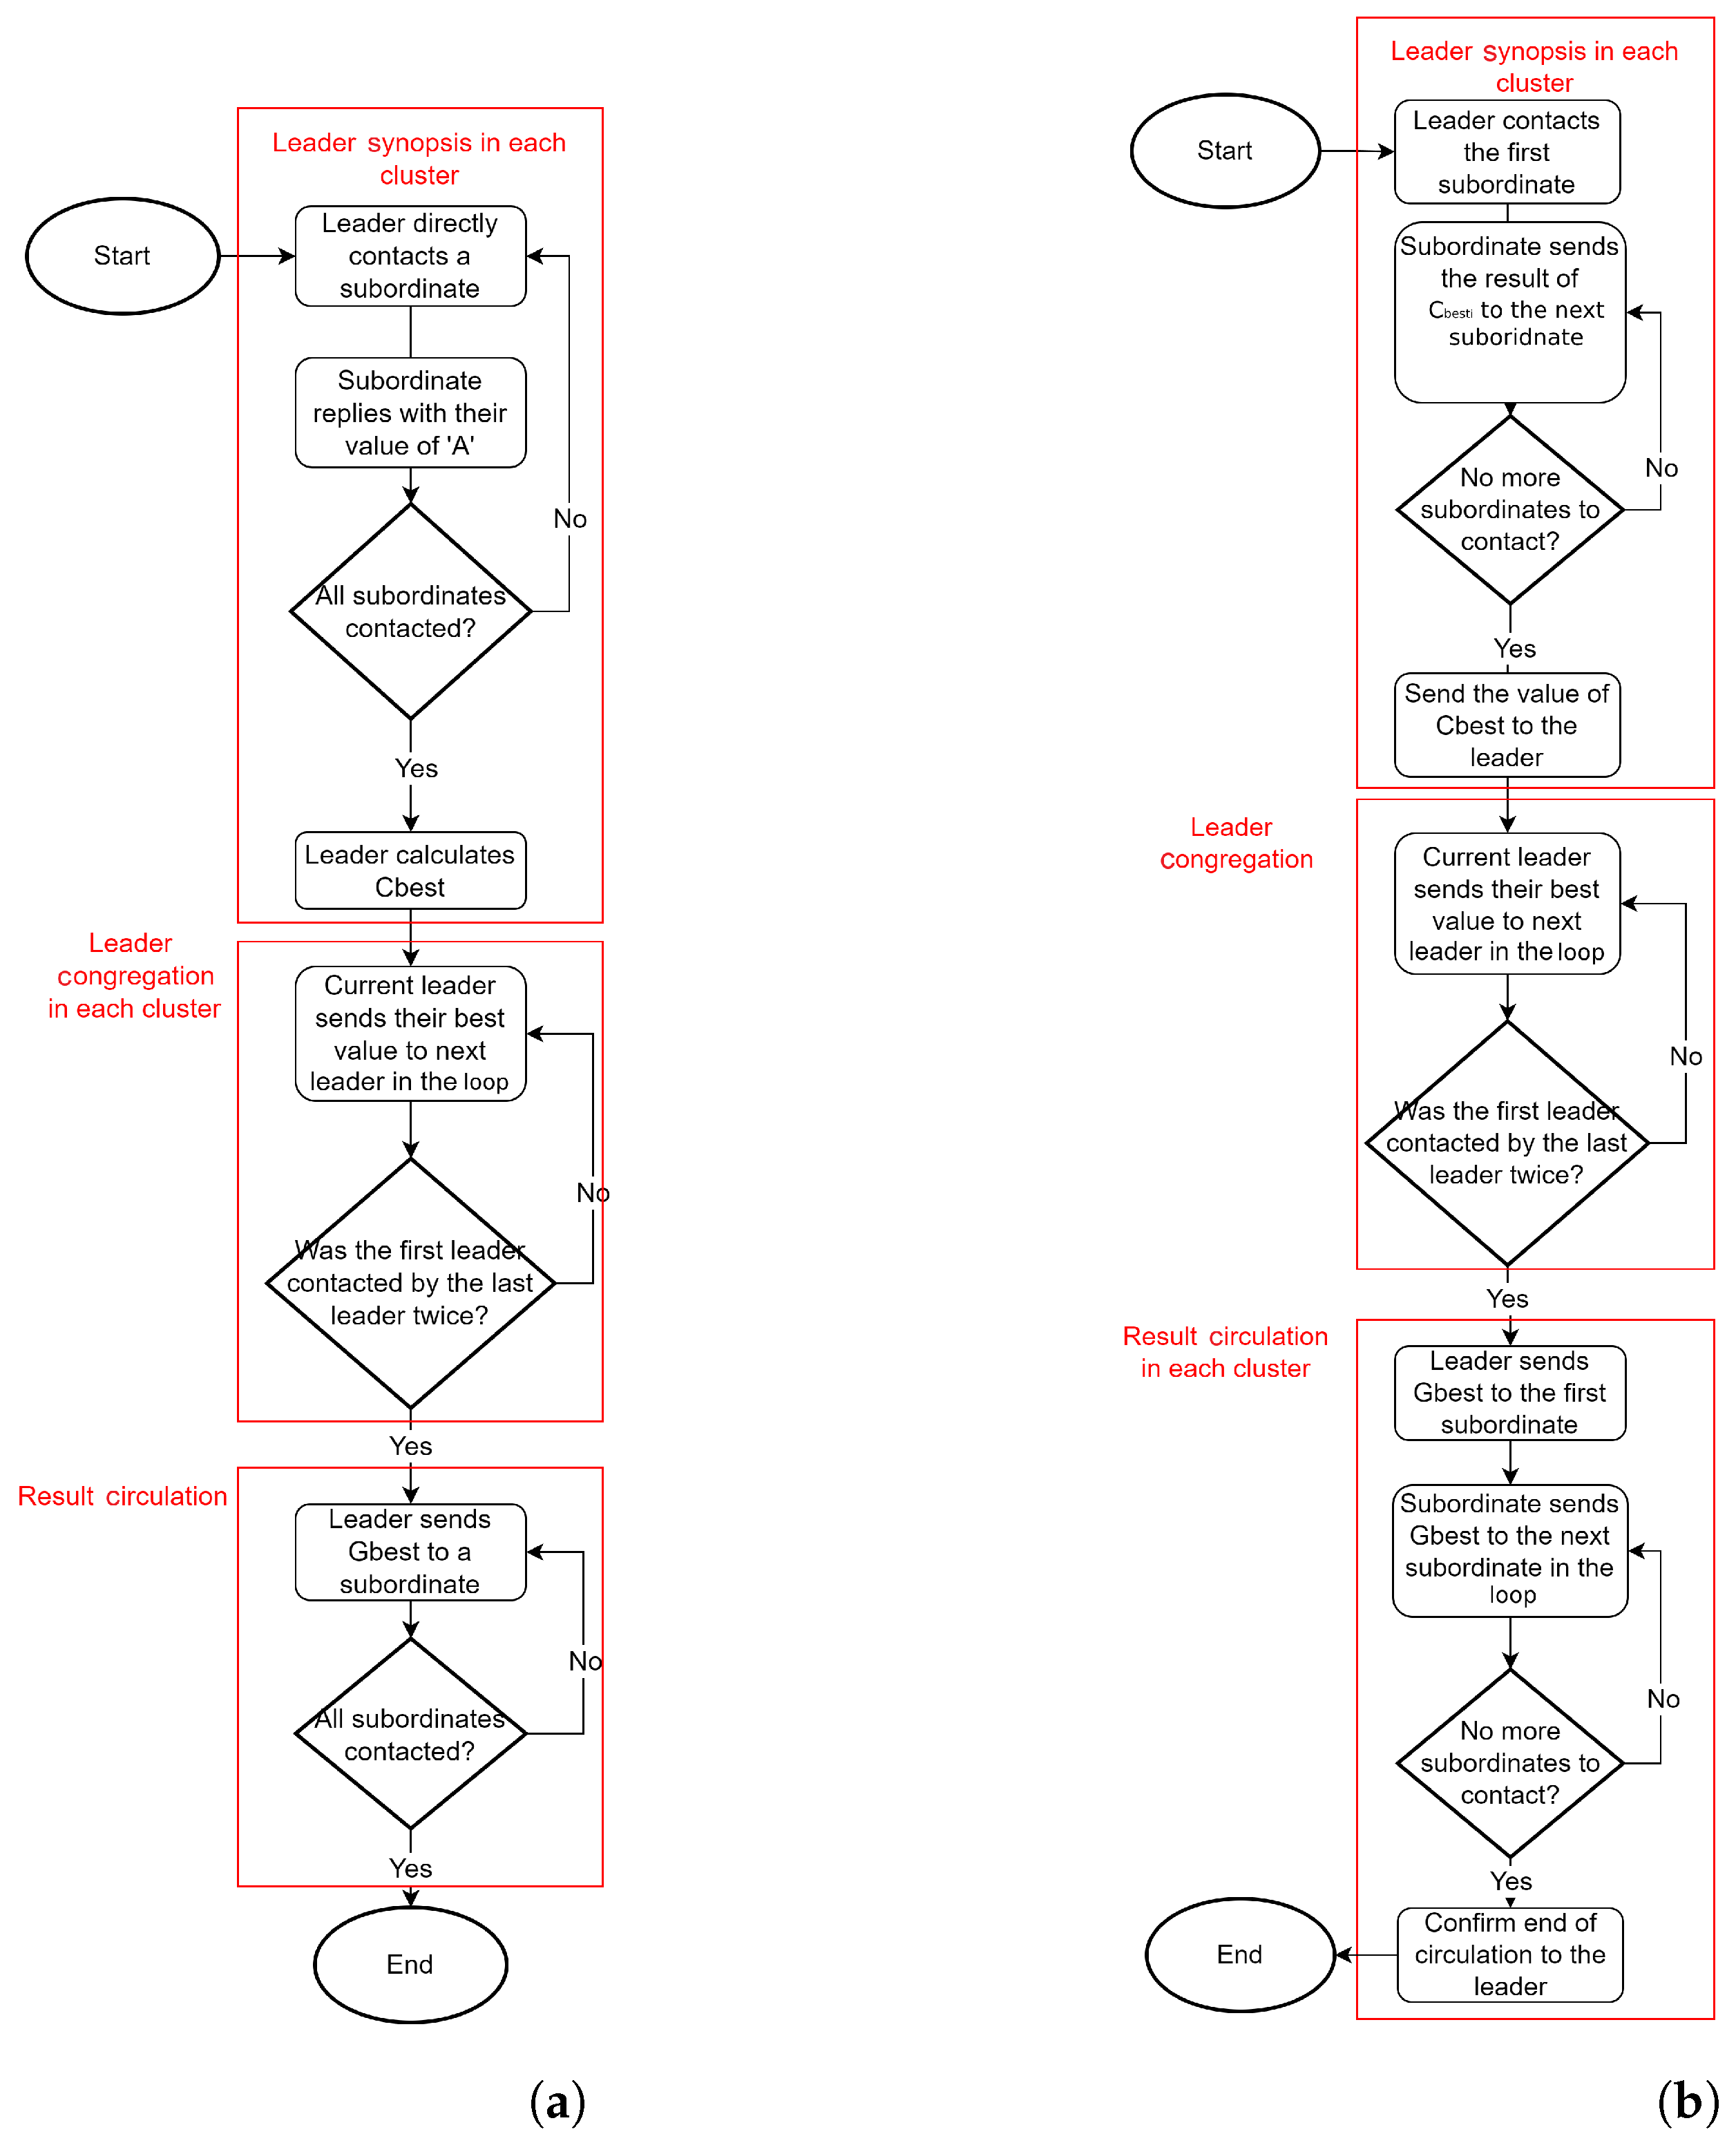
In addition, the flowcharts in Figure 6a,b illustrate an overview of the whole process for both variations.
To reiterate the method of operation, see the following:
  • The leader of each cluster calculates the best allocation for the task (Cbest) using information from its subordinates.
  • The leaders of all clusters then find the global best allocation (Gbest) among all clusters using the dual loop structure.
  • The leaders then ensure that all their subordinates are informed of Gbest, so it becomes swarm-wide knowledge.
  • The process follows a centralized or dual loop communication topology, depending on the variation (CDTA-CL or CDTA-DL) being used.

3.2. Self-Organization

As stated in Section 1, self-organization (SO) is one of the core concepts of swarm robotics. The SO concept ensures that the robotic swarm can efficiently and autonomously coordinate its actions without the need for centralized control or explicit communication between individual robots. Self-organization mechanisms include the following:
  • Setting the initial formation of the swarm and its clusters.
  • The optimal selection of leader robots for each cluster of the swarm.
  • Flexibility and fault tolerance, as follows:
    Interchanging cluster subordinates when they fail or shut down, so that the CDTA-CL and CDTA-DL stages resume normally.
    Re-selection of leader robots for a cluster in case of failure or shutting down.
The capability of achieving different SO mechanisms is crucial for the scalability, robustness, and adaptability of swarm systems, allowing them to perform complex tasks in dynamic conditions and environments.
Furthermore, it is important to highlight the significance of self-organization in swarm robotics. As the field progresses, the effective implementation and enhancement of self-organizing mechanisms will remain a focal point for researchers. Thus, the exploration of self-organization in swarm robotics represents a direction for future research, with the potential to unlock new capabilities and applications, as mentioned in Section 6.

3.3. Pyswaro Simulation Tool

In order to test the proposed algorithm, a proposed simulation tool “Pyswaro” was developed to create an accurate execution of these stages of operation for both the CDTA-CL and CDTA-DL variations. Pyswaro allows the user to set values for swarm and cluster sizes, leaders and their coordinates, battery levels for all robots, values for the rate of depletion of battery levels, as well as network latency values for each operation. Pyswaro produces detailed logs for each stage of the process, and it also generates graphs and histograms for the battery consumption of each robot following each stage. An open-source version of Pyswaro is publicly available on GitHub as well [60]. The simulation was developed in Python language. The simulation experimentation was performed on a PC with core-i7 10th generation, Windows 10, 16 GB of RAM, and Python 3.9.
Pyswaro calculates the total time consumed for each experiment by setting a timer variable with an initial value of 0. Pyswaro imports the user-set configurations, which are modeled after real swarm robots. Pyswaro then applies the imported configurations on the timer variable, which is incremented during the different stages of the experiments based on the type and quantity of sent and received communications.
Users can also copy values from real swarm robot data sheets to model and configure battery consumption rates in Pyswaro, which reacts to different operations using the same mechanism as Pyswaro’s timer. Pyswaro’s mechanism of calculating battery consumption also facilitates generating heat maps and histograms, which gives users more insights on the tested algorithm’s performance.

4. Results

All experiments were executed inside the Pyswaro simulation environment. In all experiments, the swarm followed a clustered formation instead of a full mesh formation, as [49] proved that a clustered formation reduces execution time by about 50% compared to a full mesh formation. This research compares the results of the proposed CDTA-CL variation and the proposed CDTA-DL variation with the original CDTA algorithm.
The simulation tool Pyswaro was introduced in Section 3.3; Pyswaro was developed to evaluate the performance of different swarm configurations against CDTA, CDTA-CL, and CDTA-DL.
The performance of the CDTA, CDTA-CL, and CDTA-DL algorithms are examined in two different experiments in Section 4.1 and Section 4.2. The first experiment examined the algorithms’ performance on a small swarm population of 36 robots with four leaders, operating for one iteration. The second experiment scrutinized their performance on a large swarm population of 400 robots with four leaders, operating for 10 iterations.
Section 4.3 states the hardware specifications of the Yanshee robot that was used to evaluate the algorithms outside of the Pyswaro simulation environment. Different swarm configurations were tested on the Yanshee robot as well.
The performance of the three algorithms is examined in Section 4.4 against other various swarm sizes with a different number of leaders.
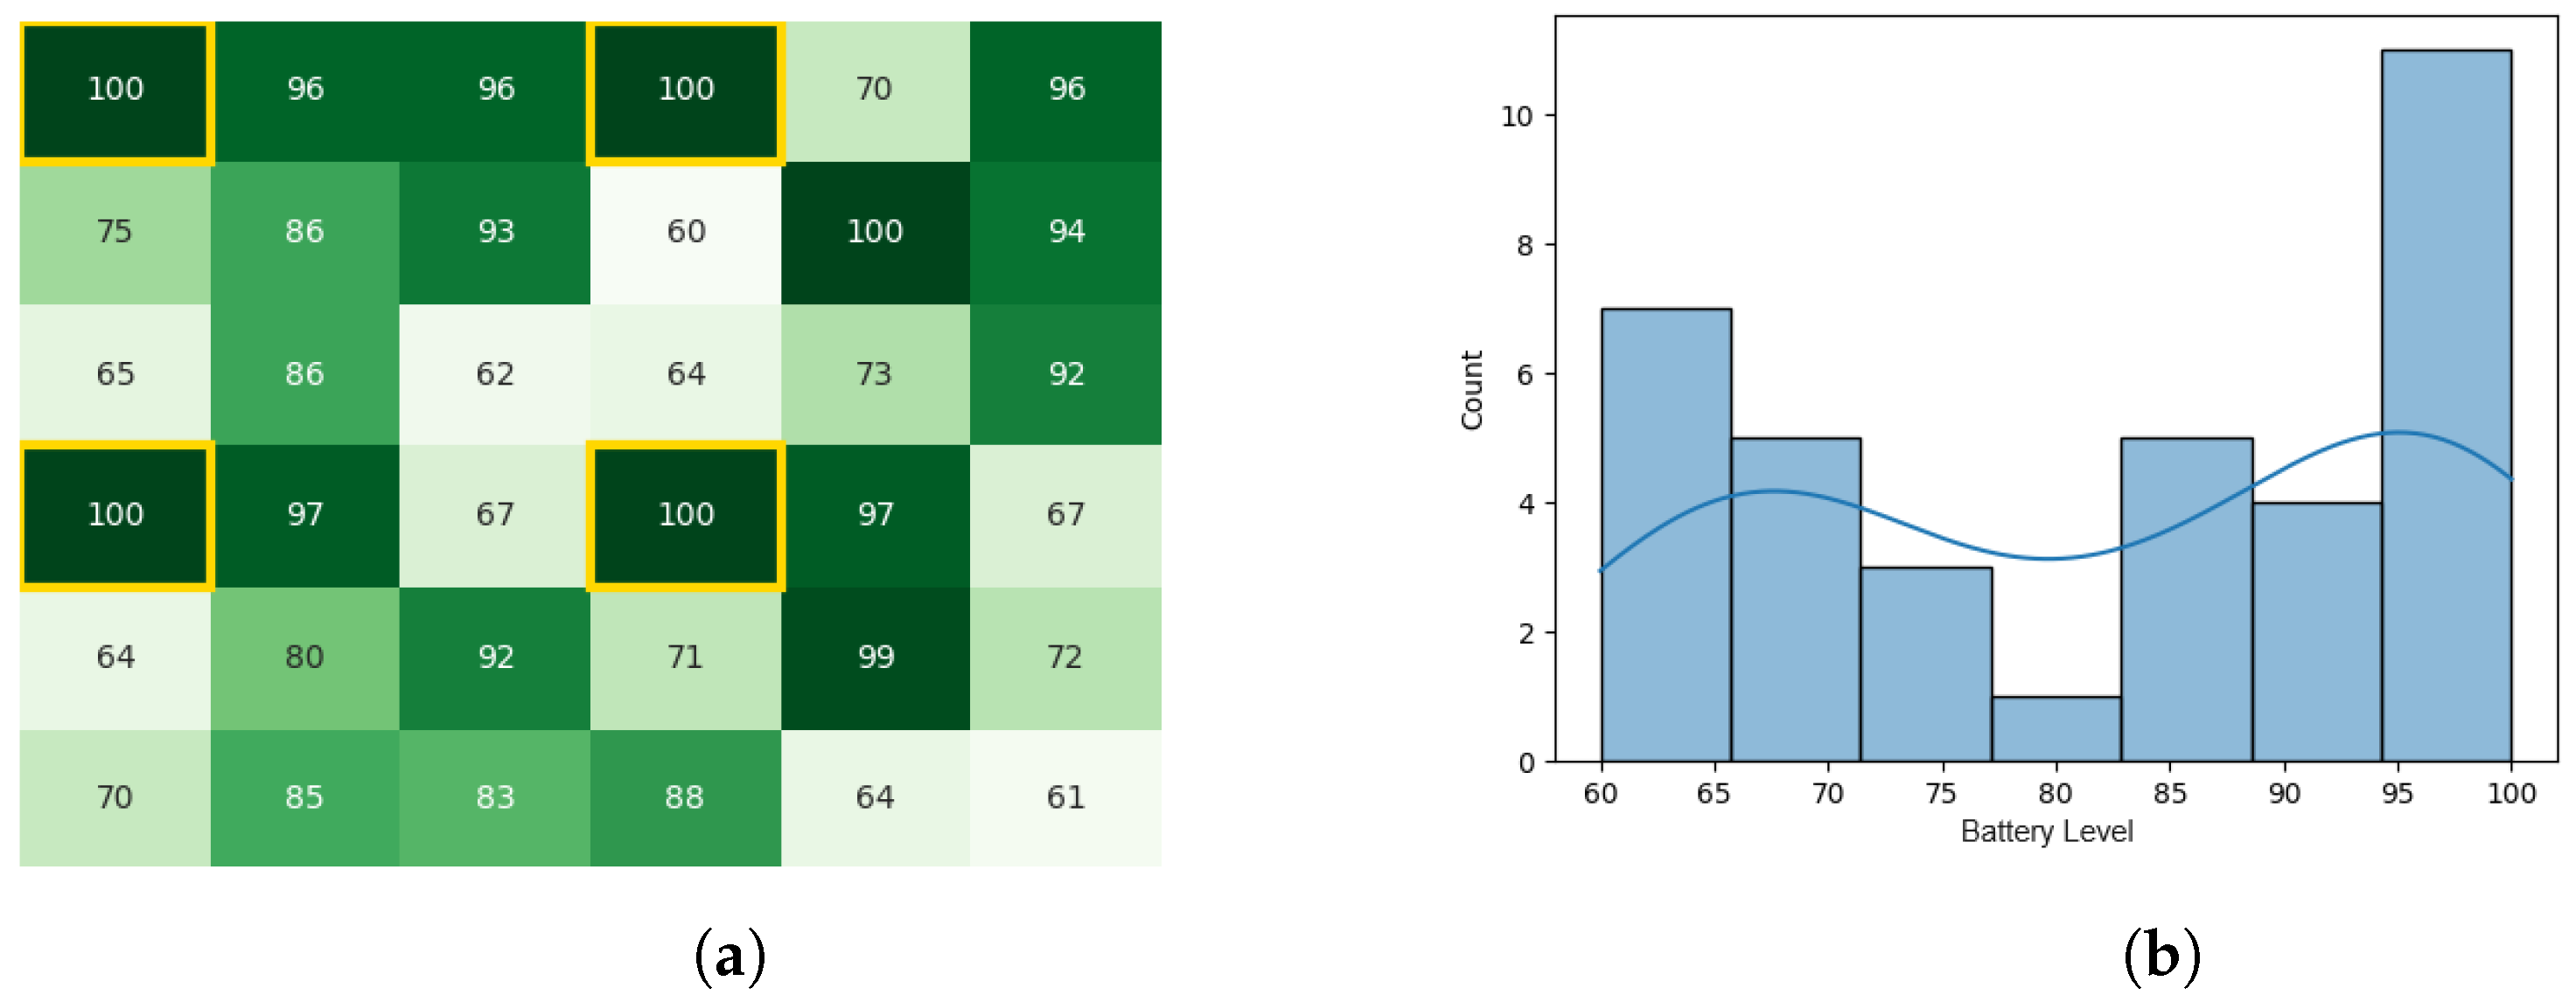
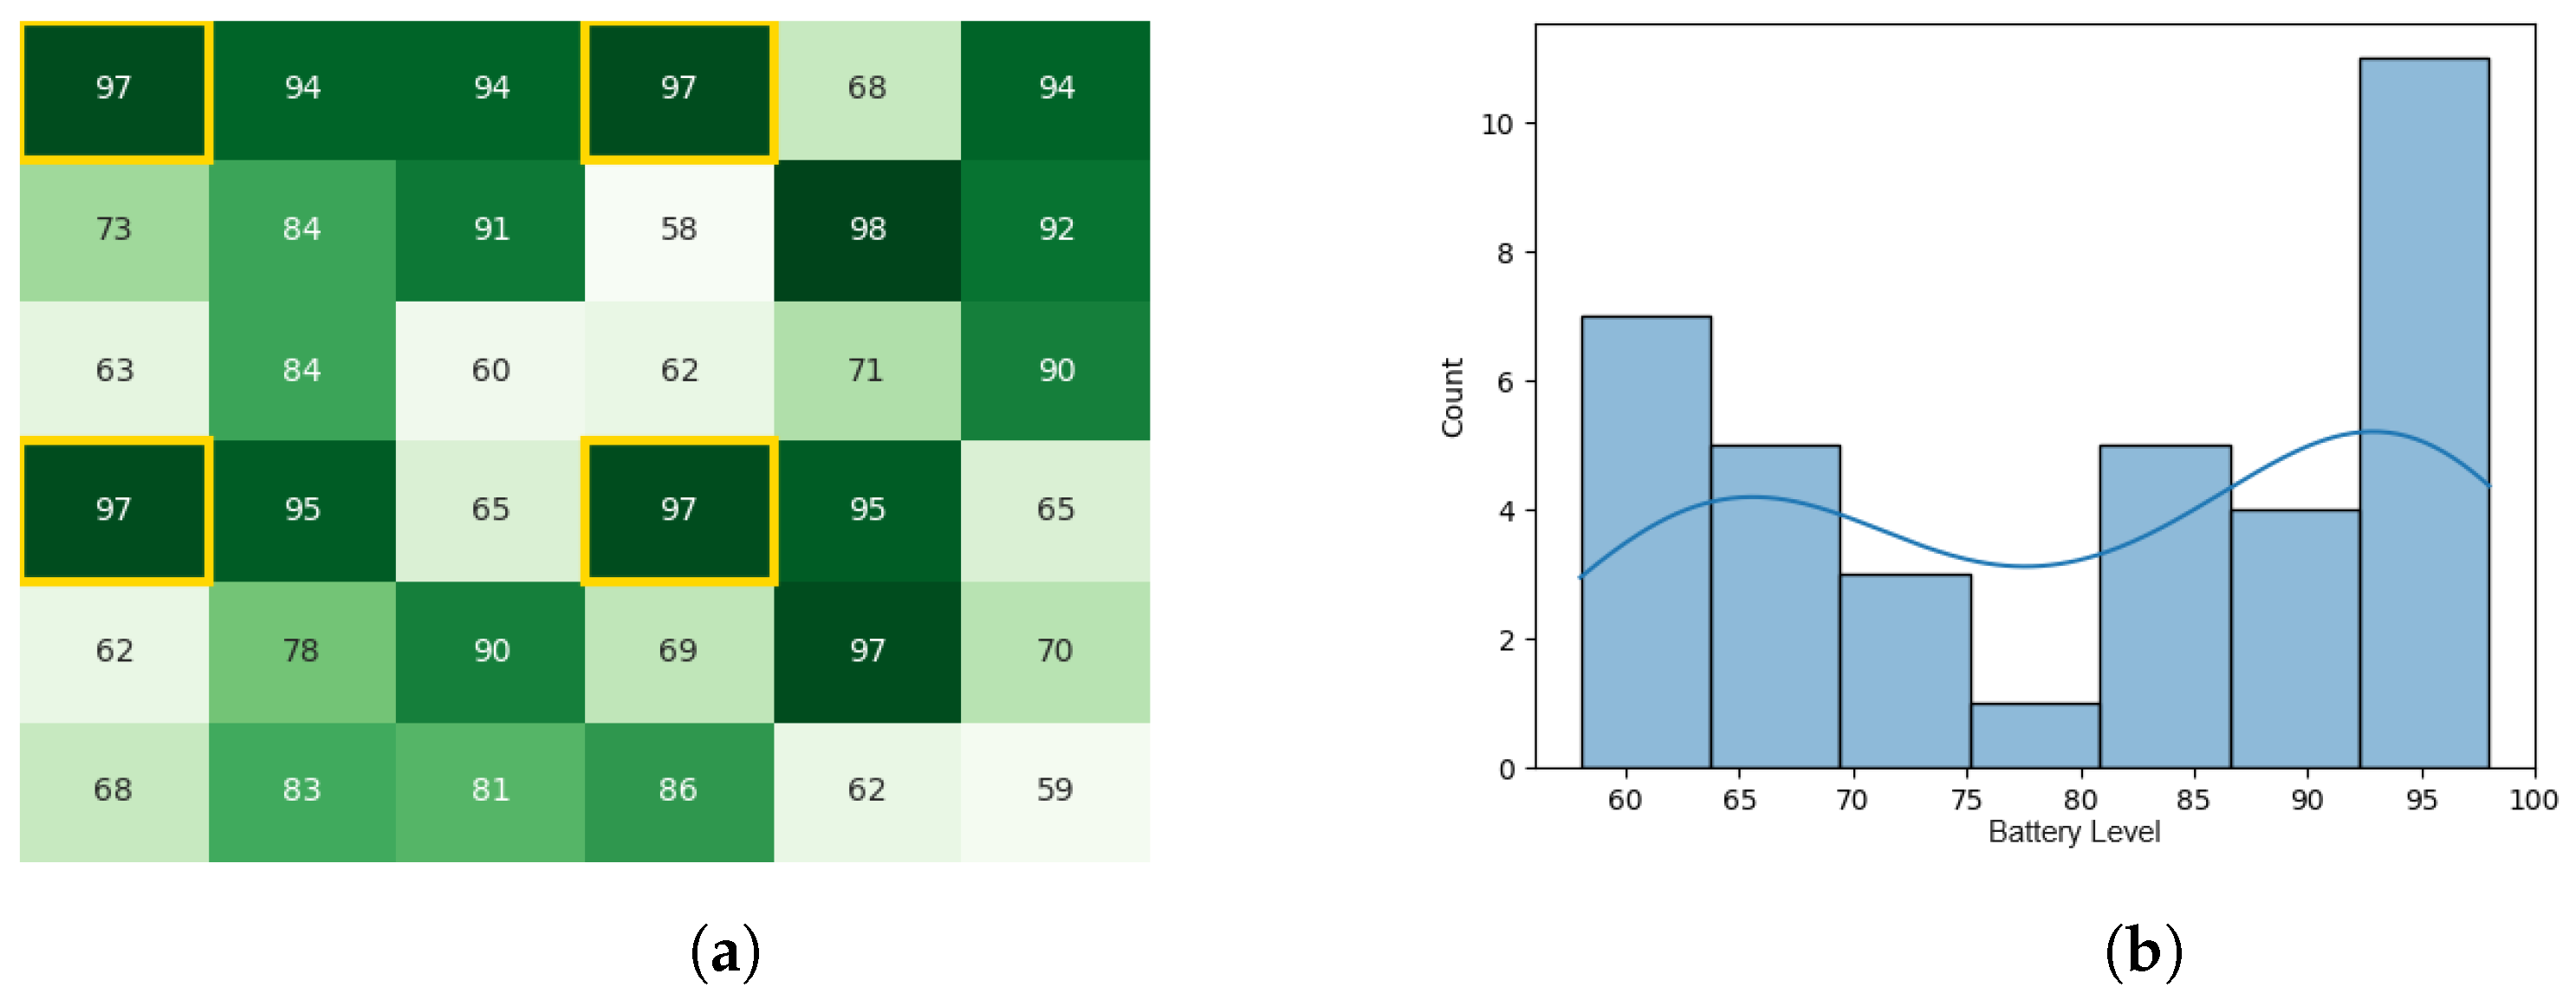
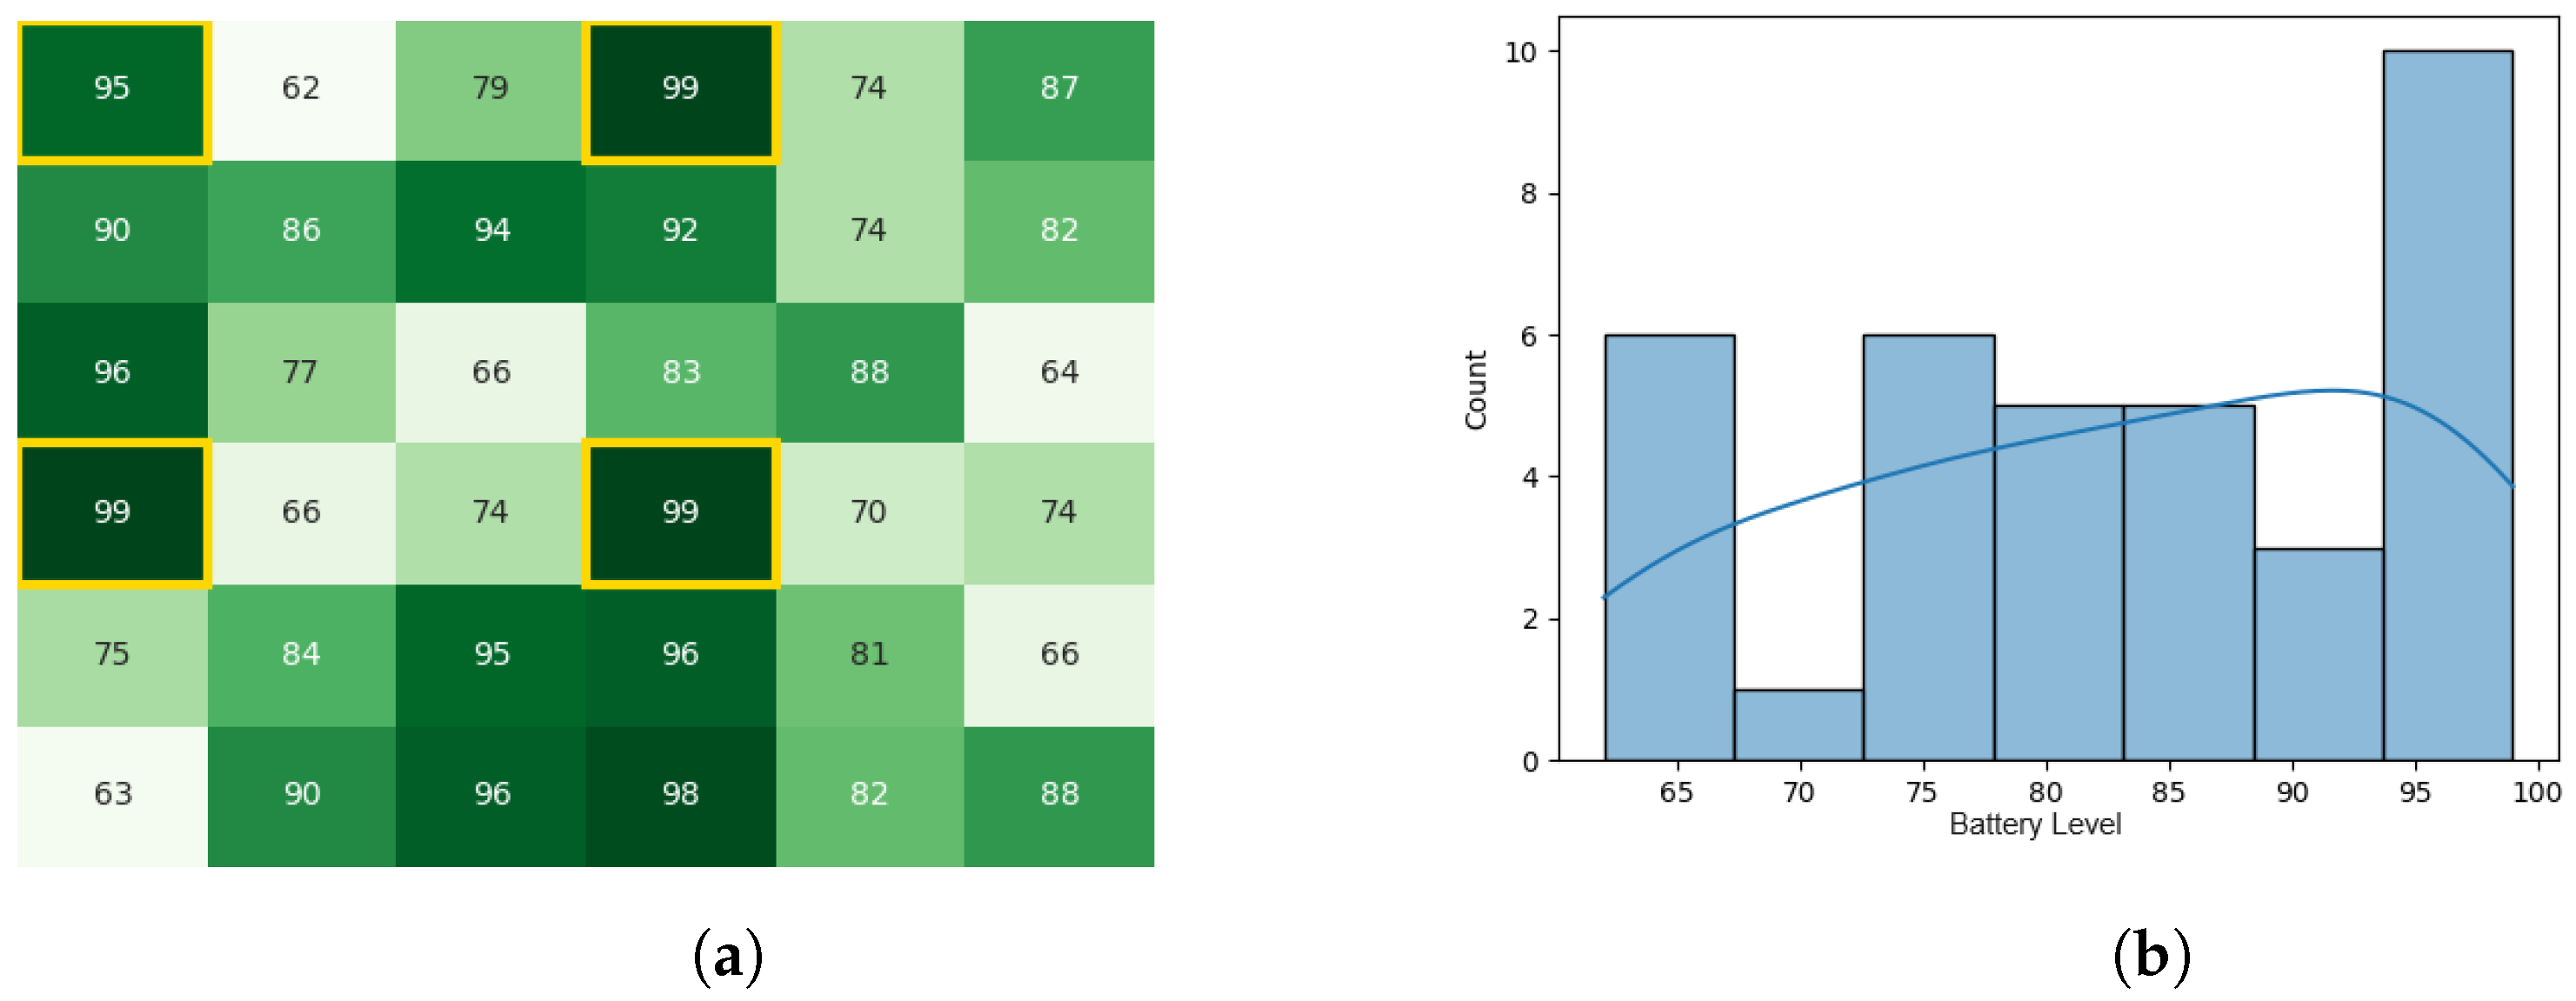
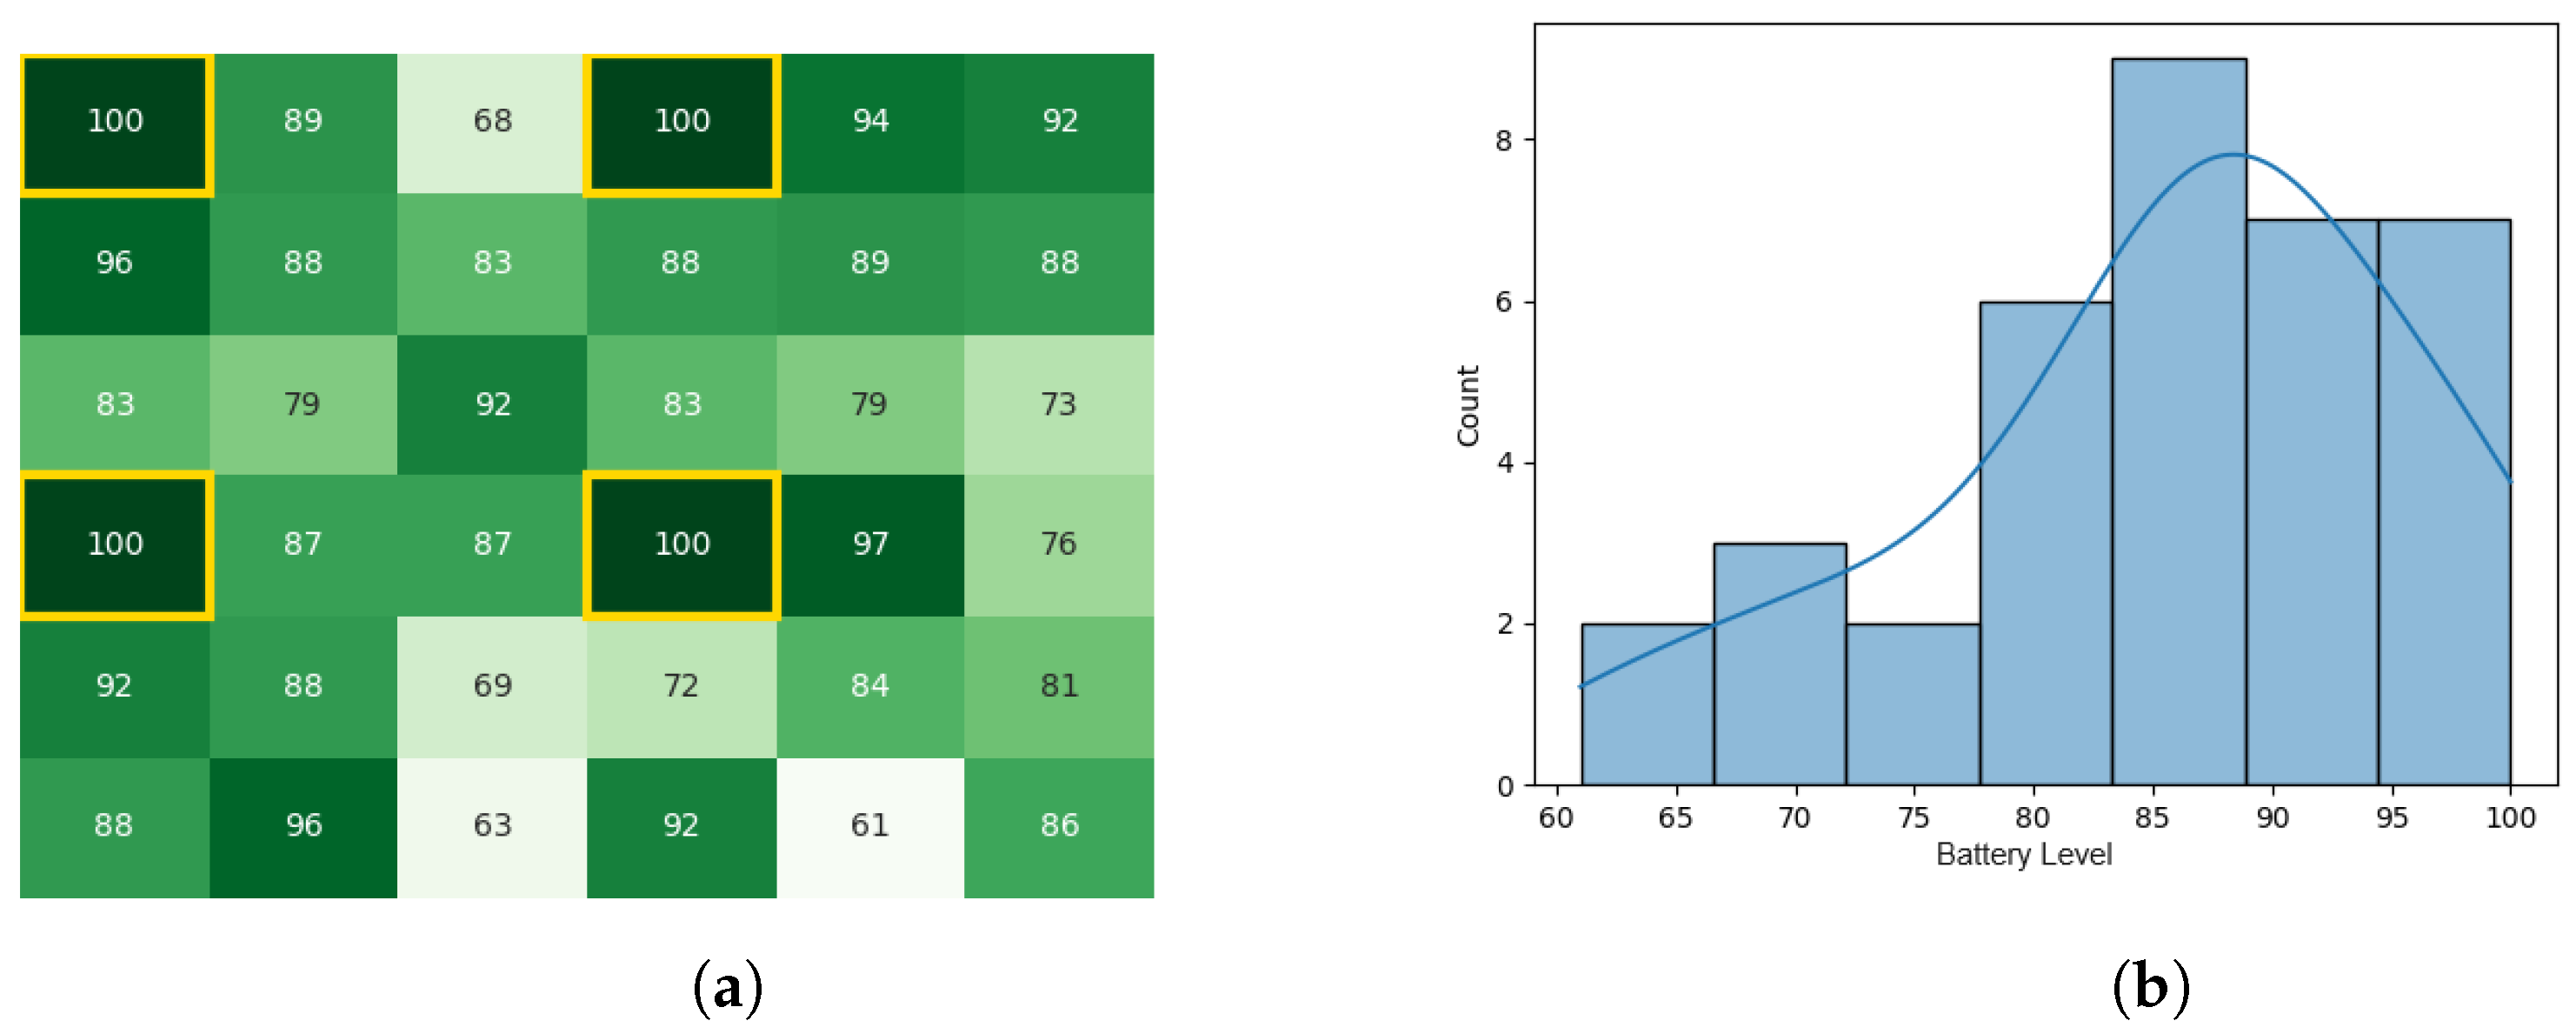
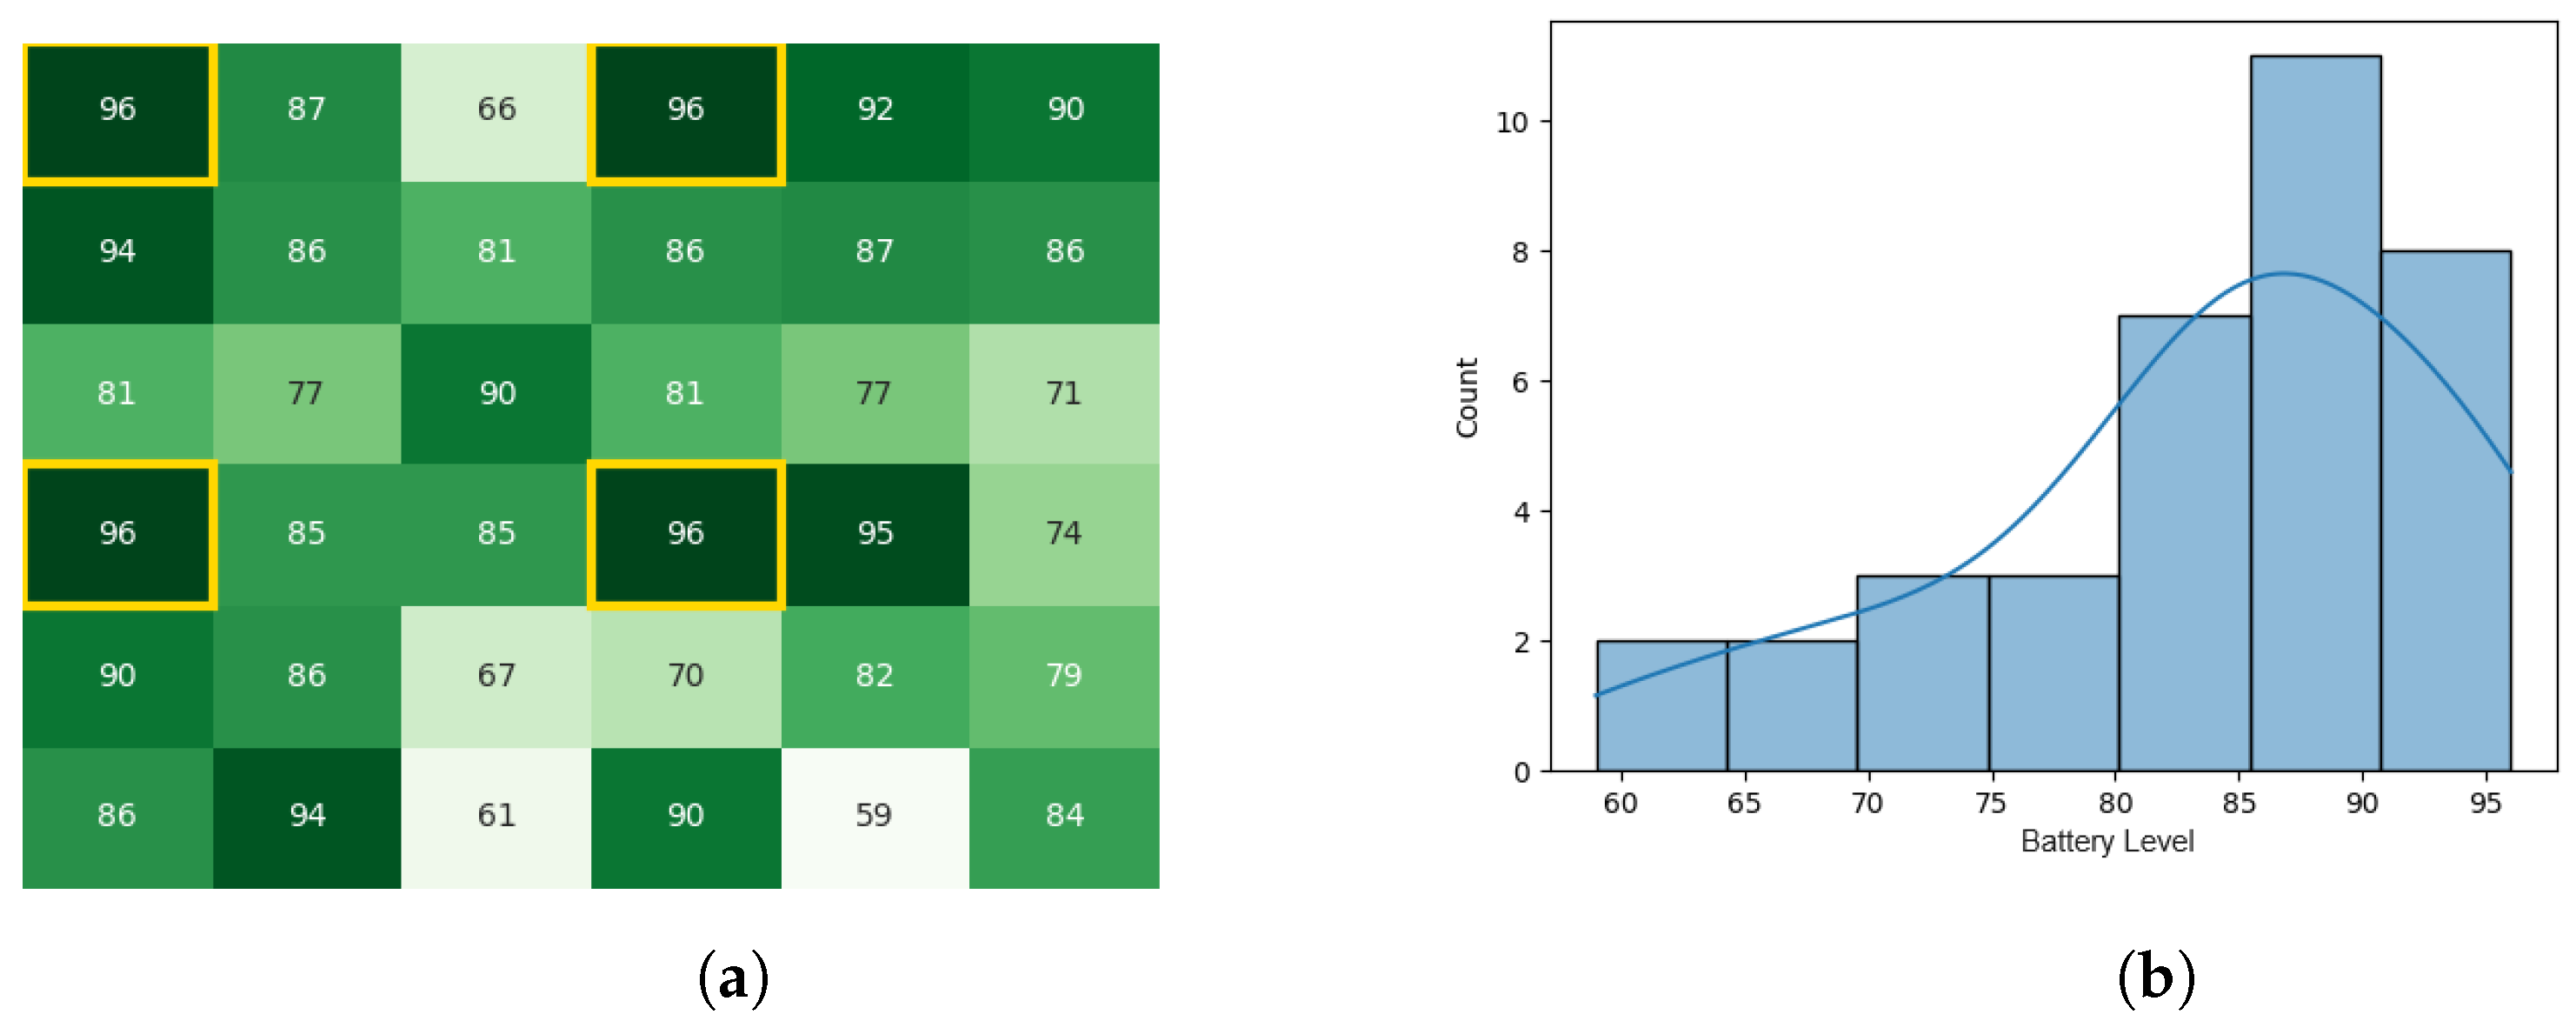
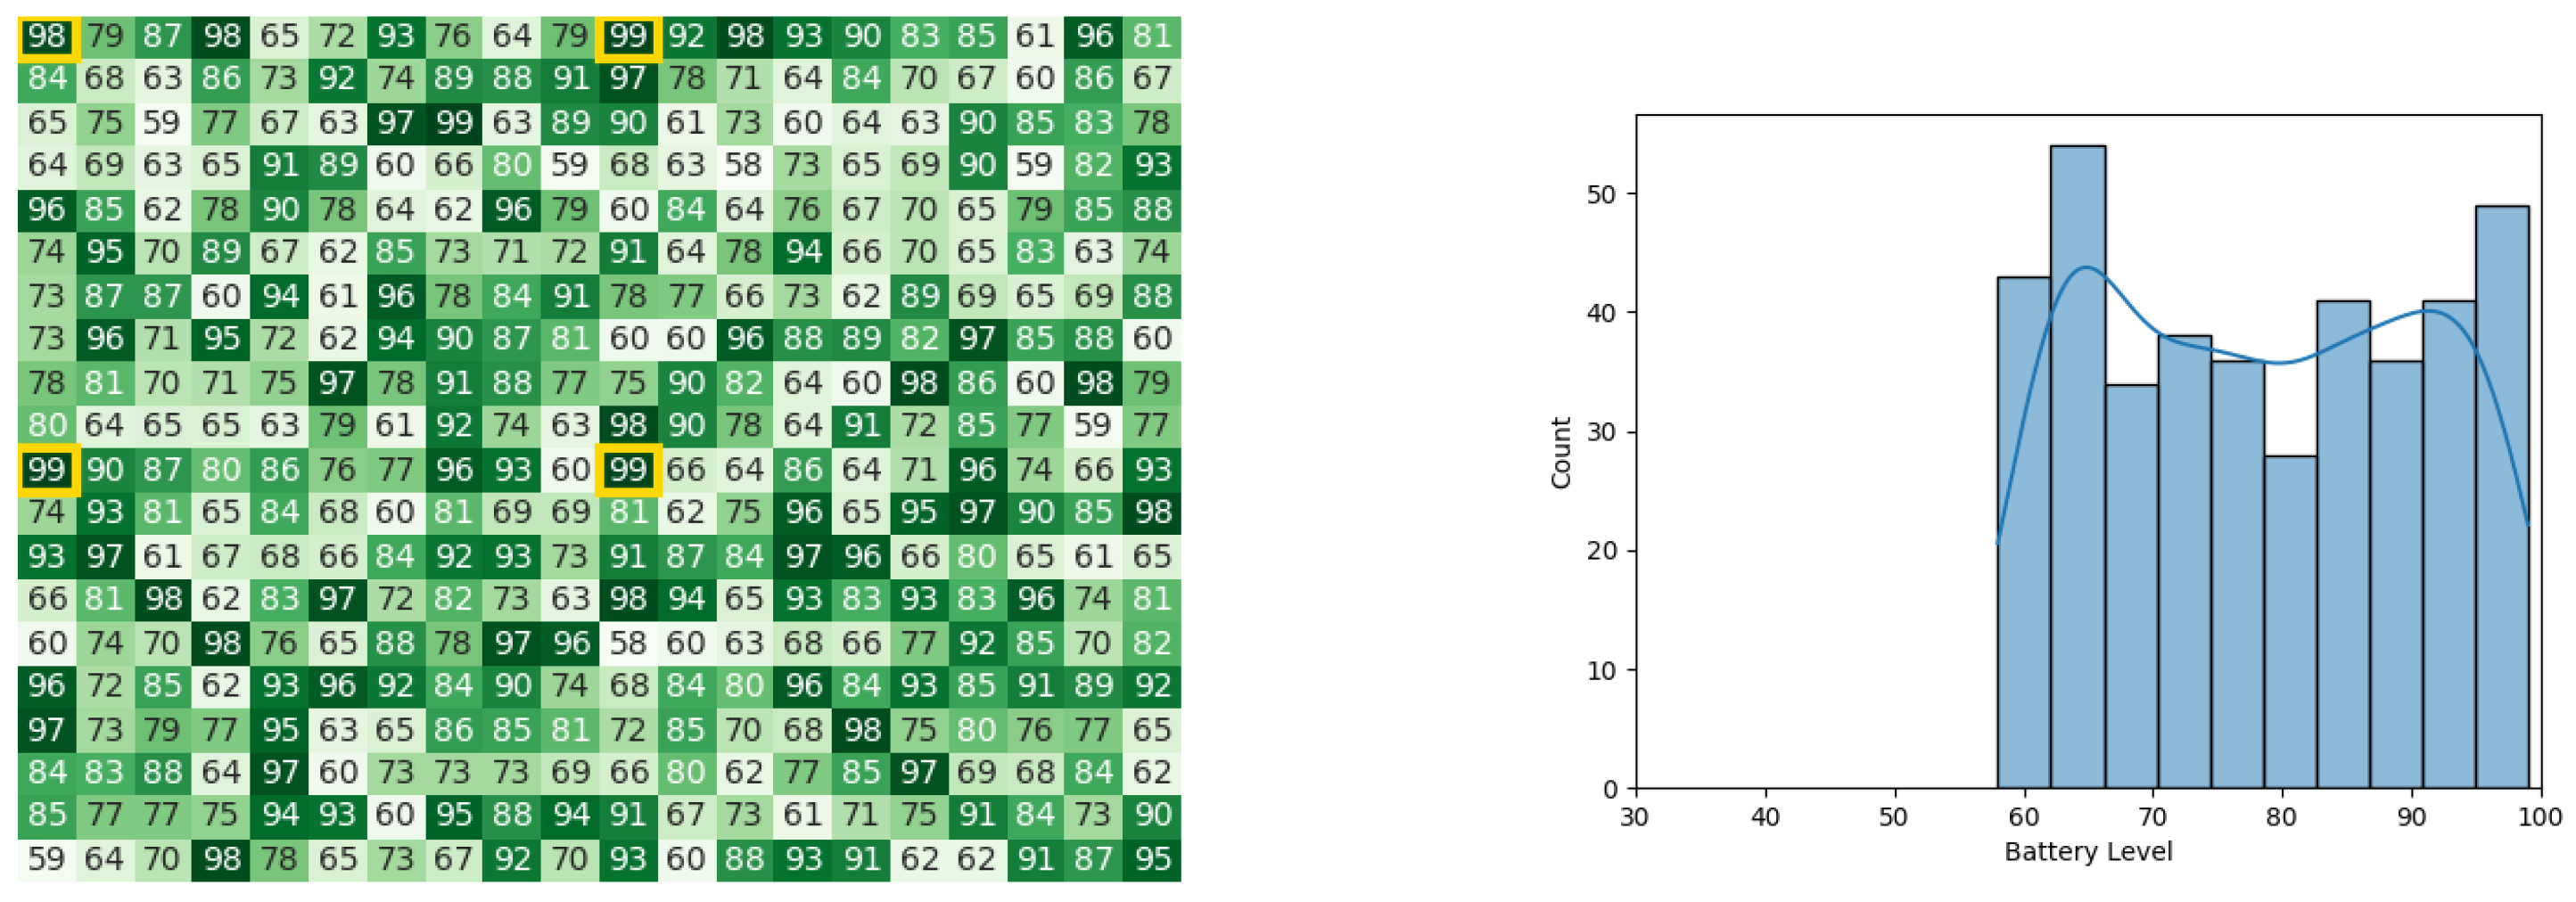
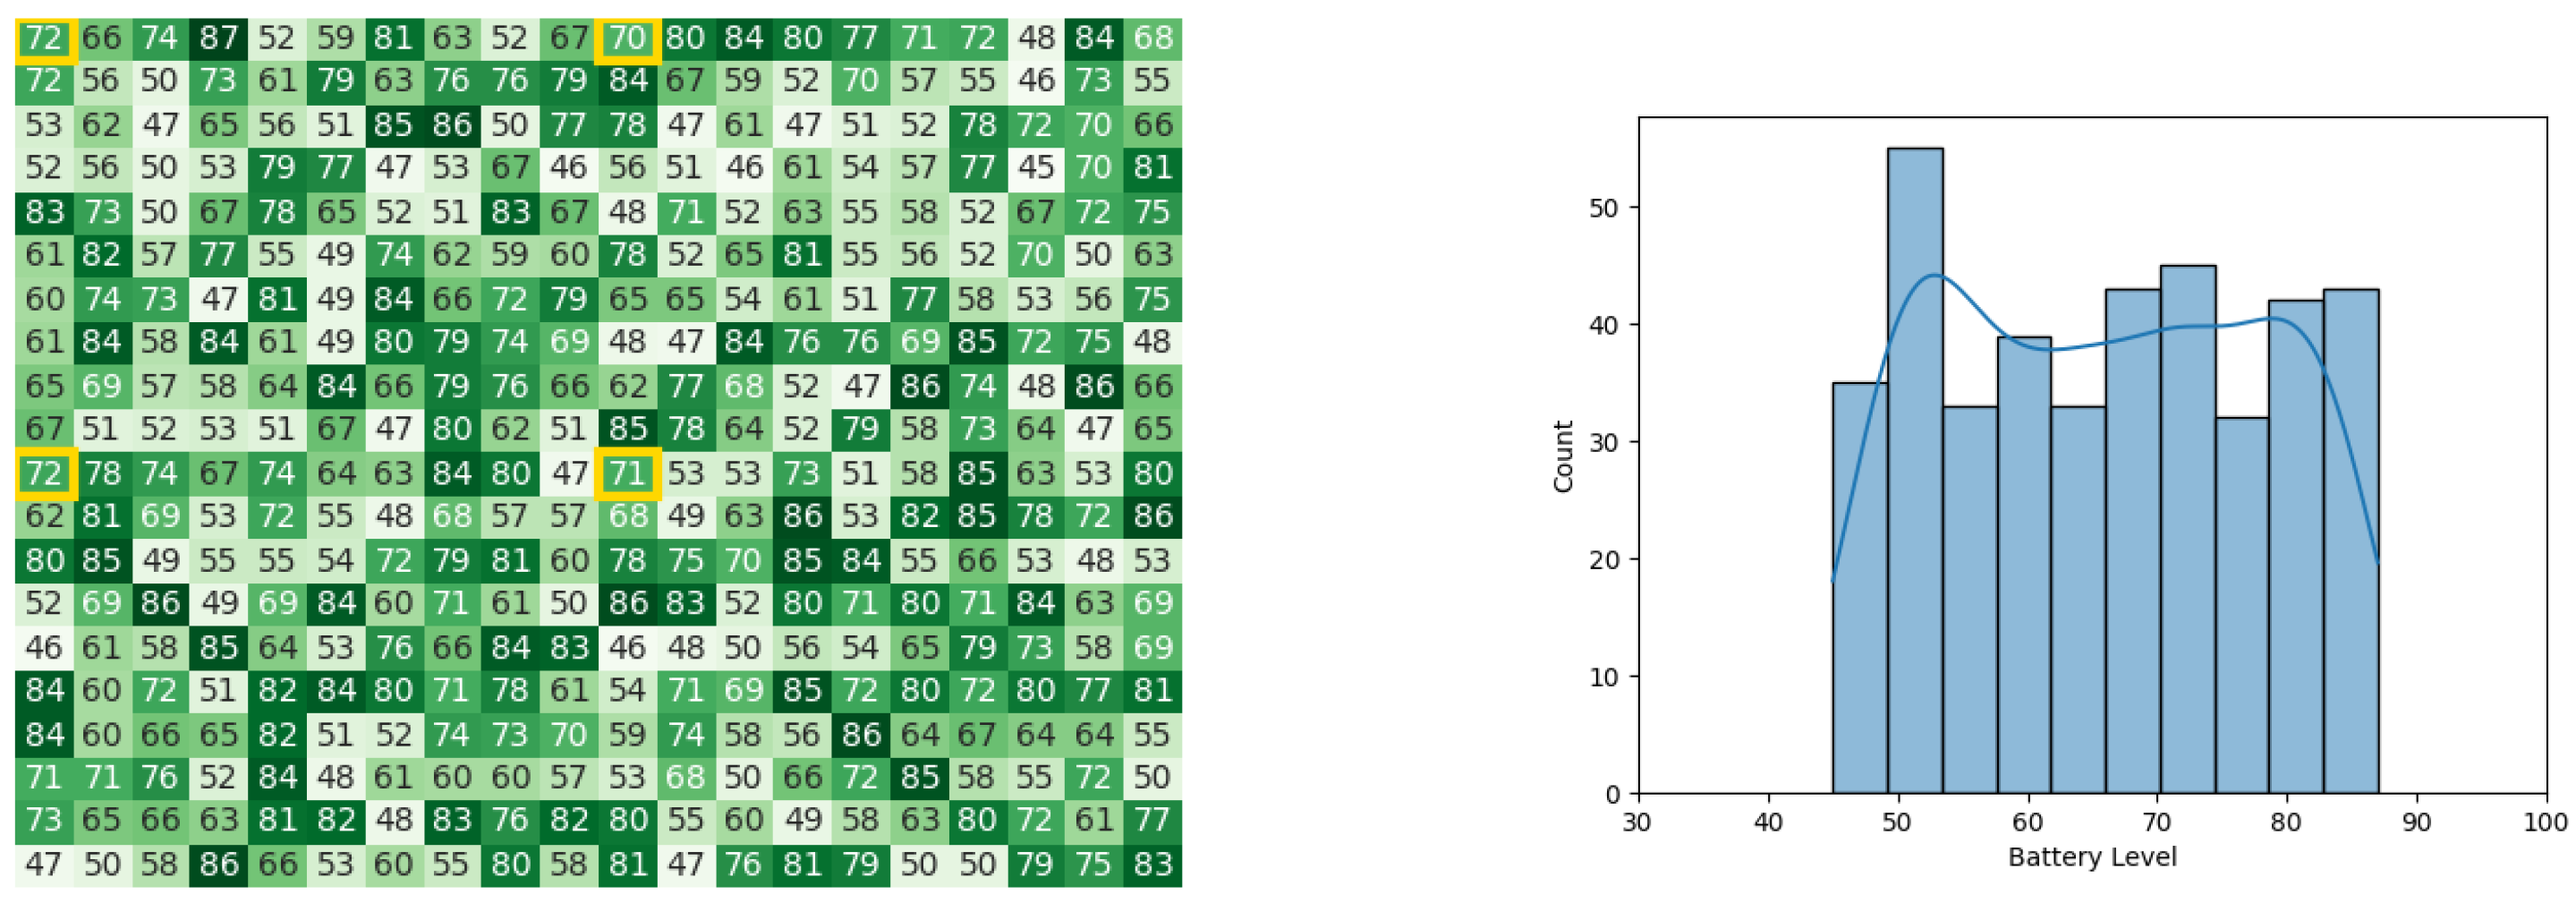
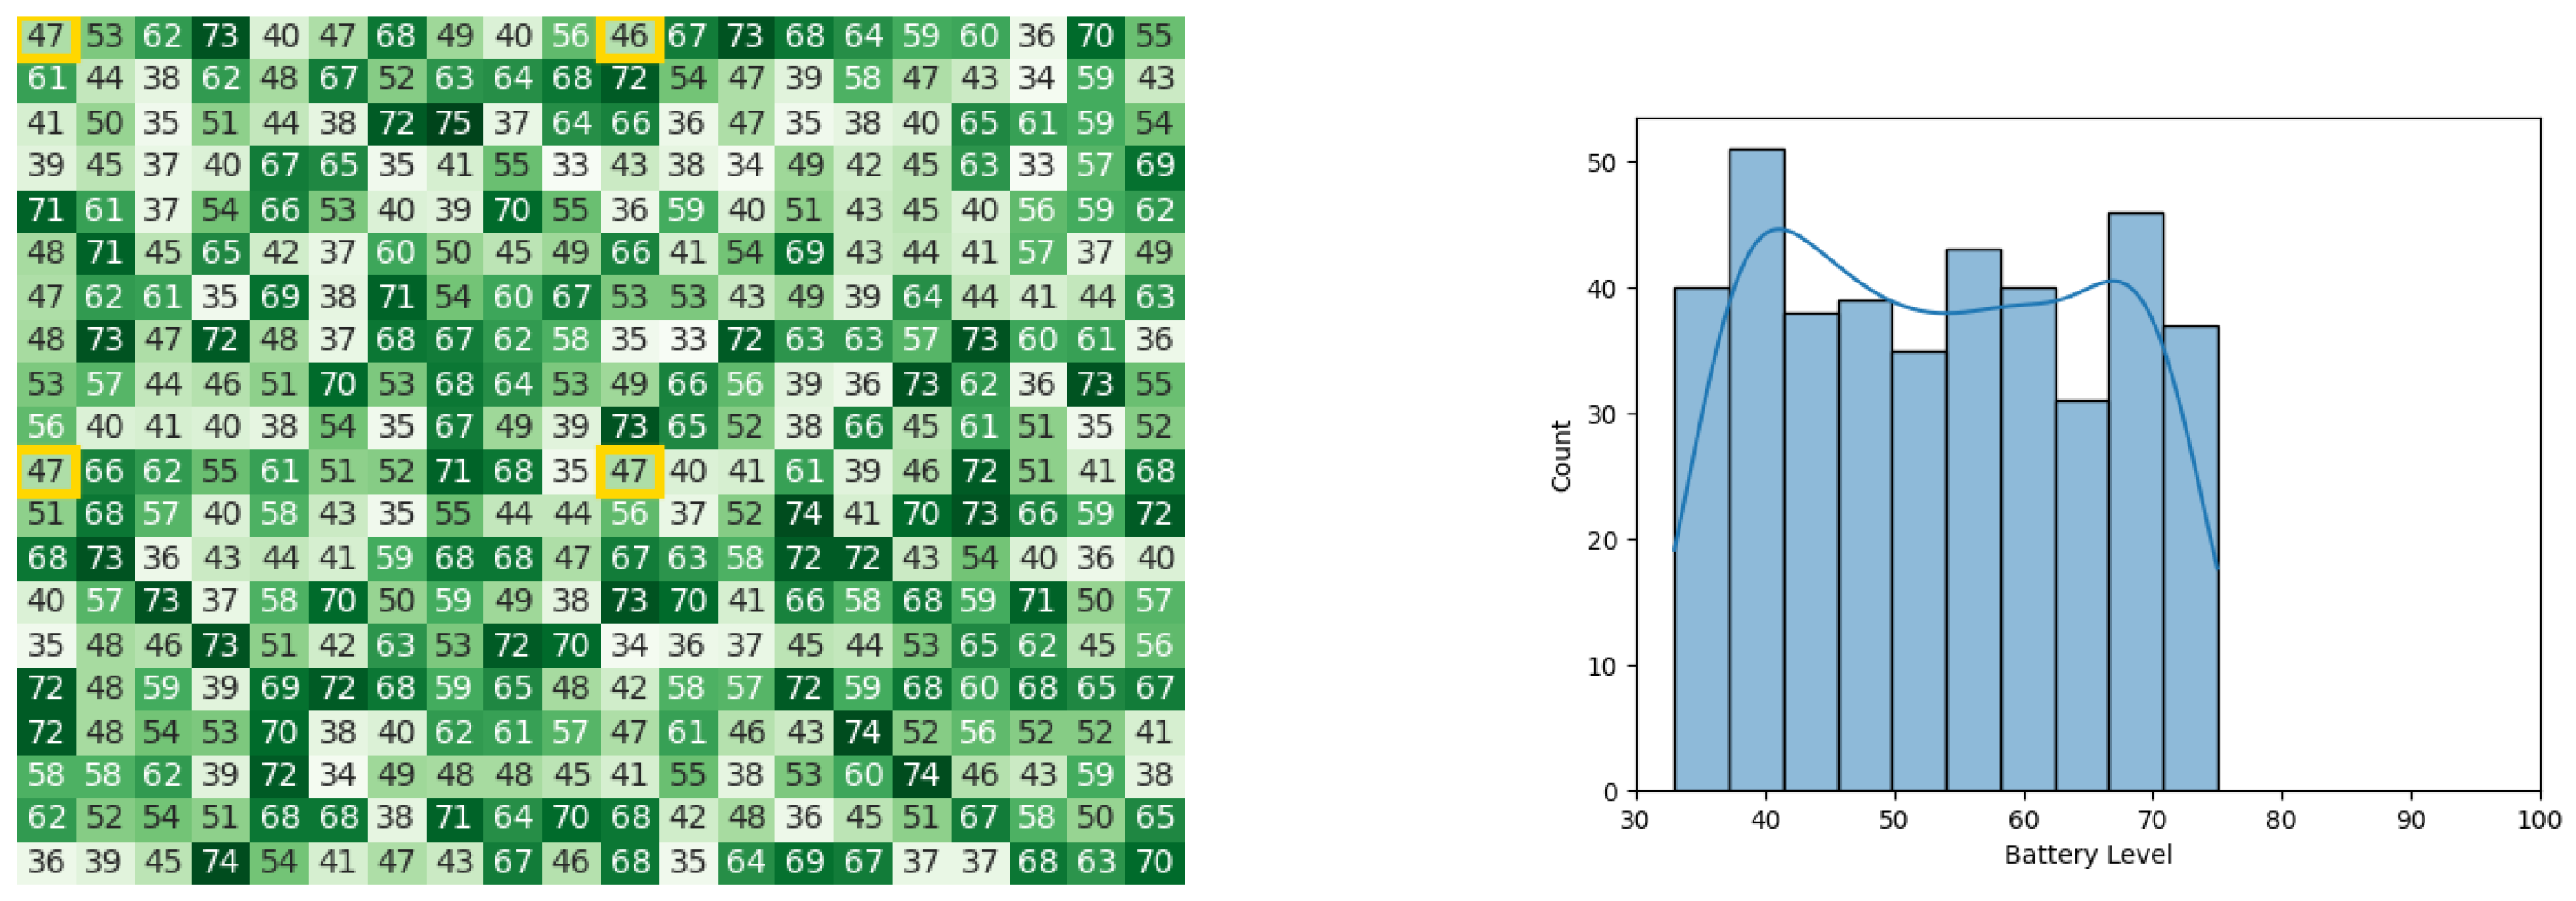
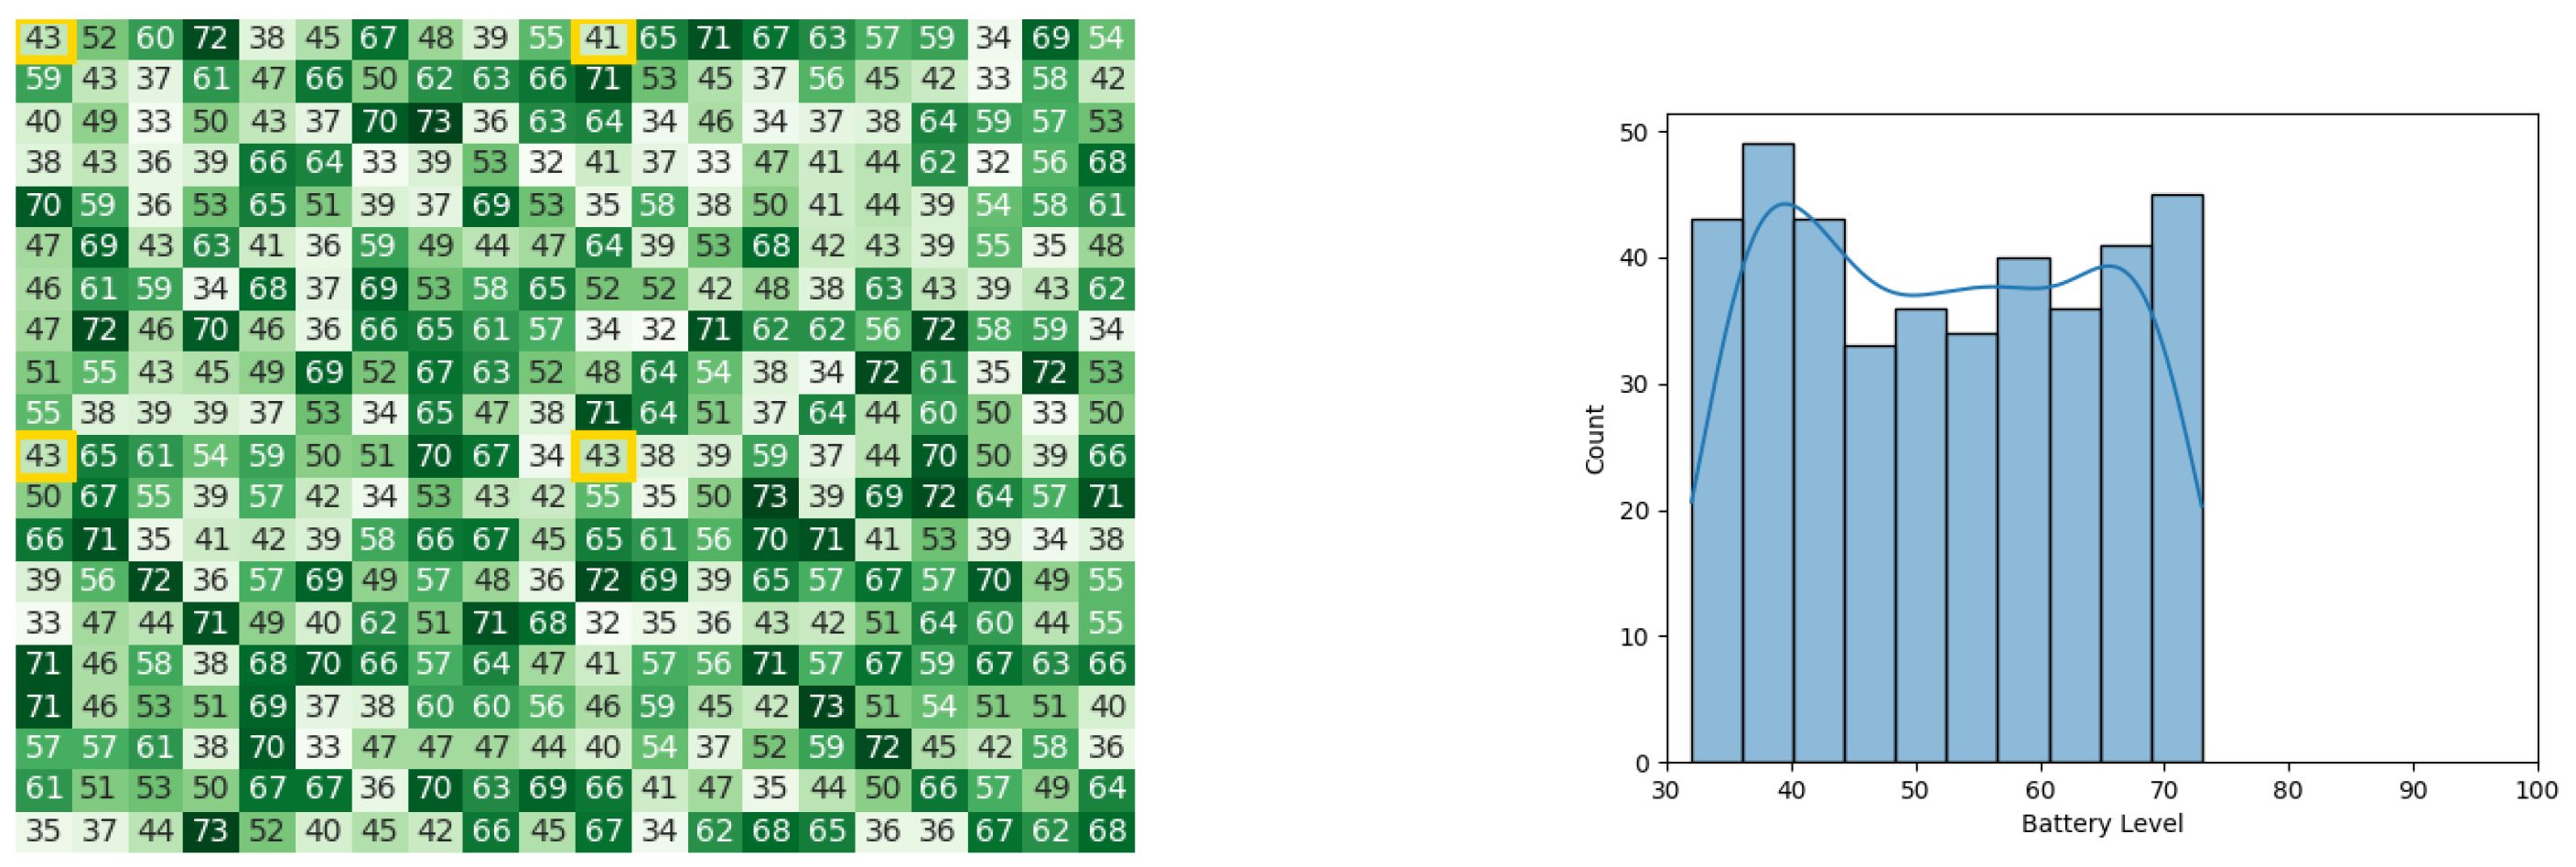
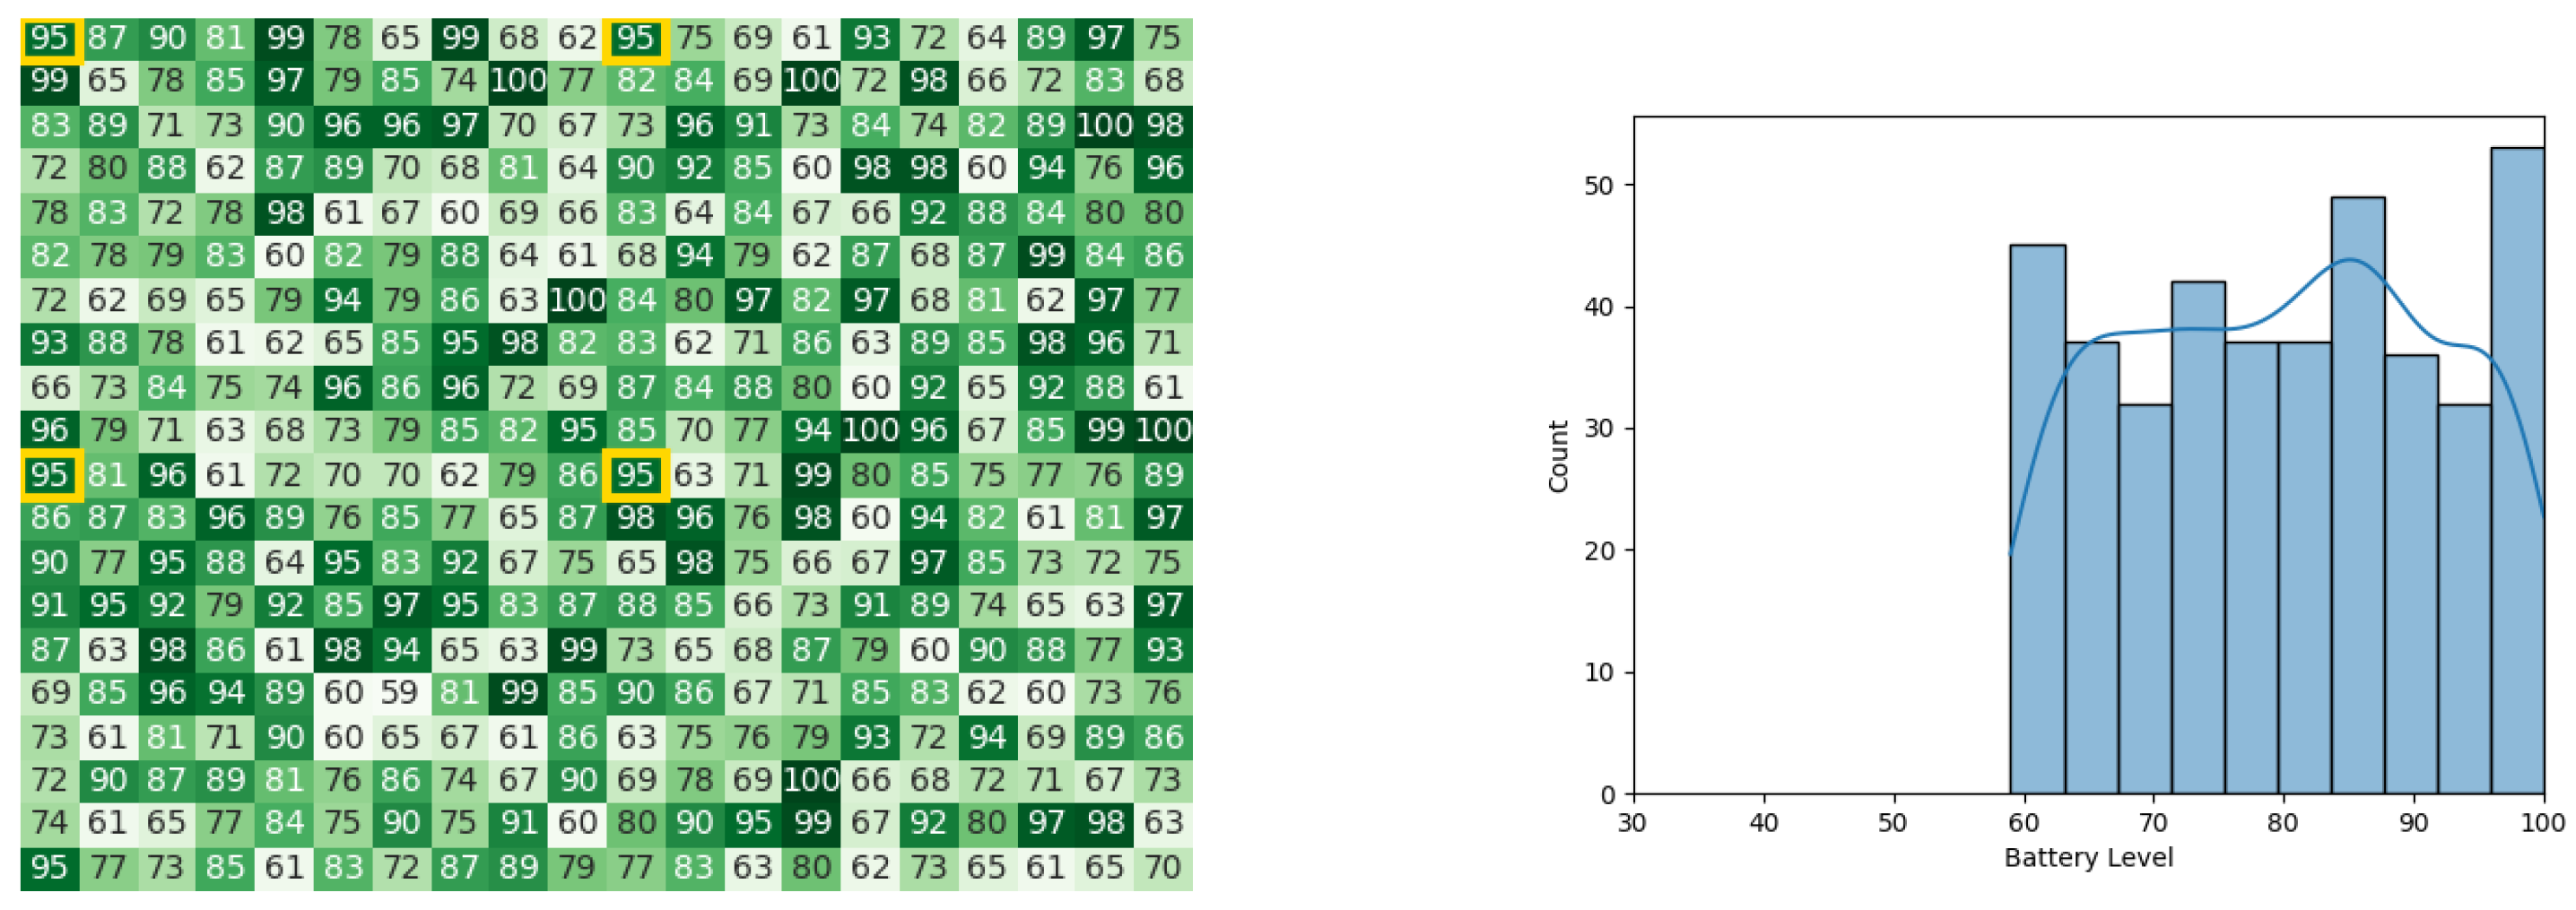
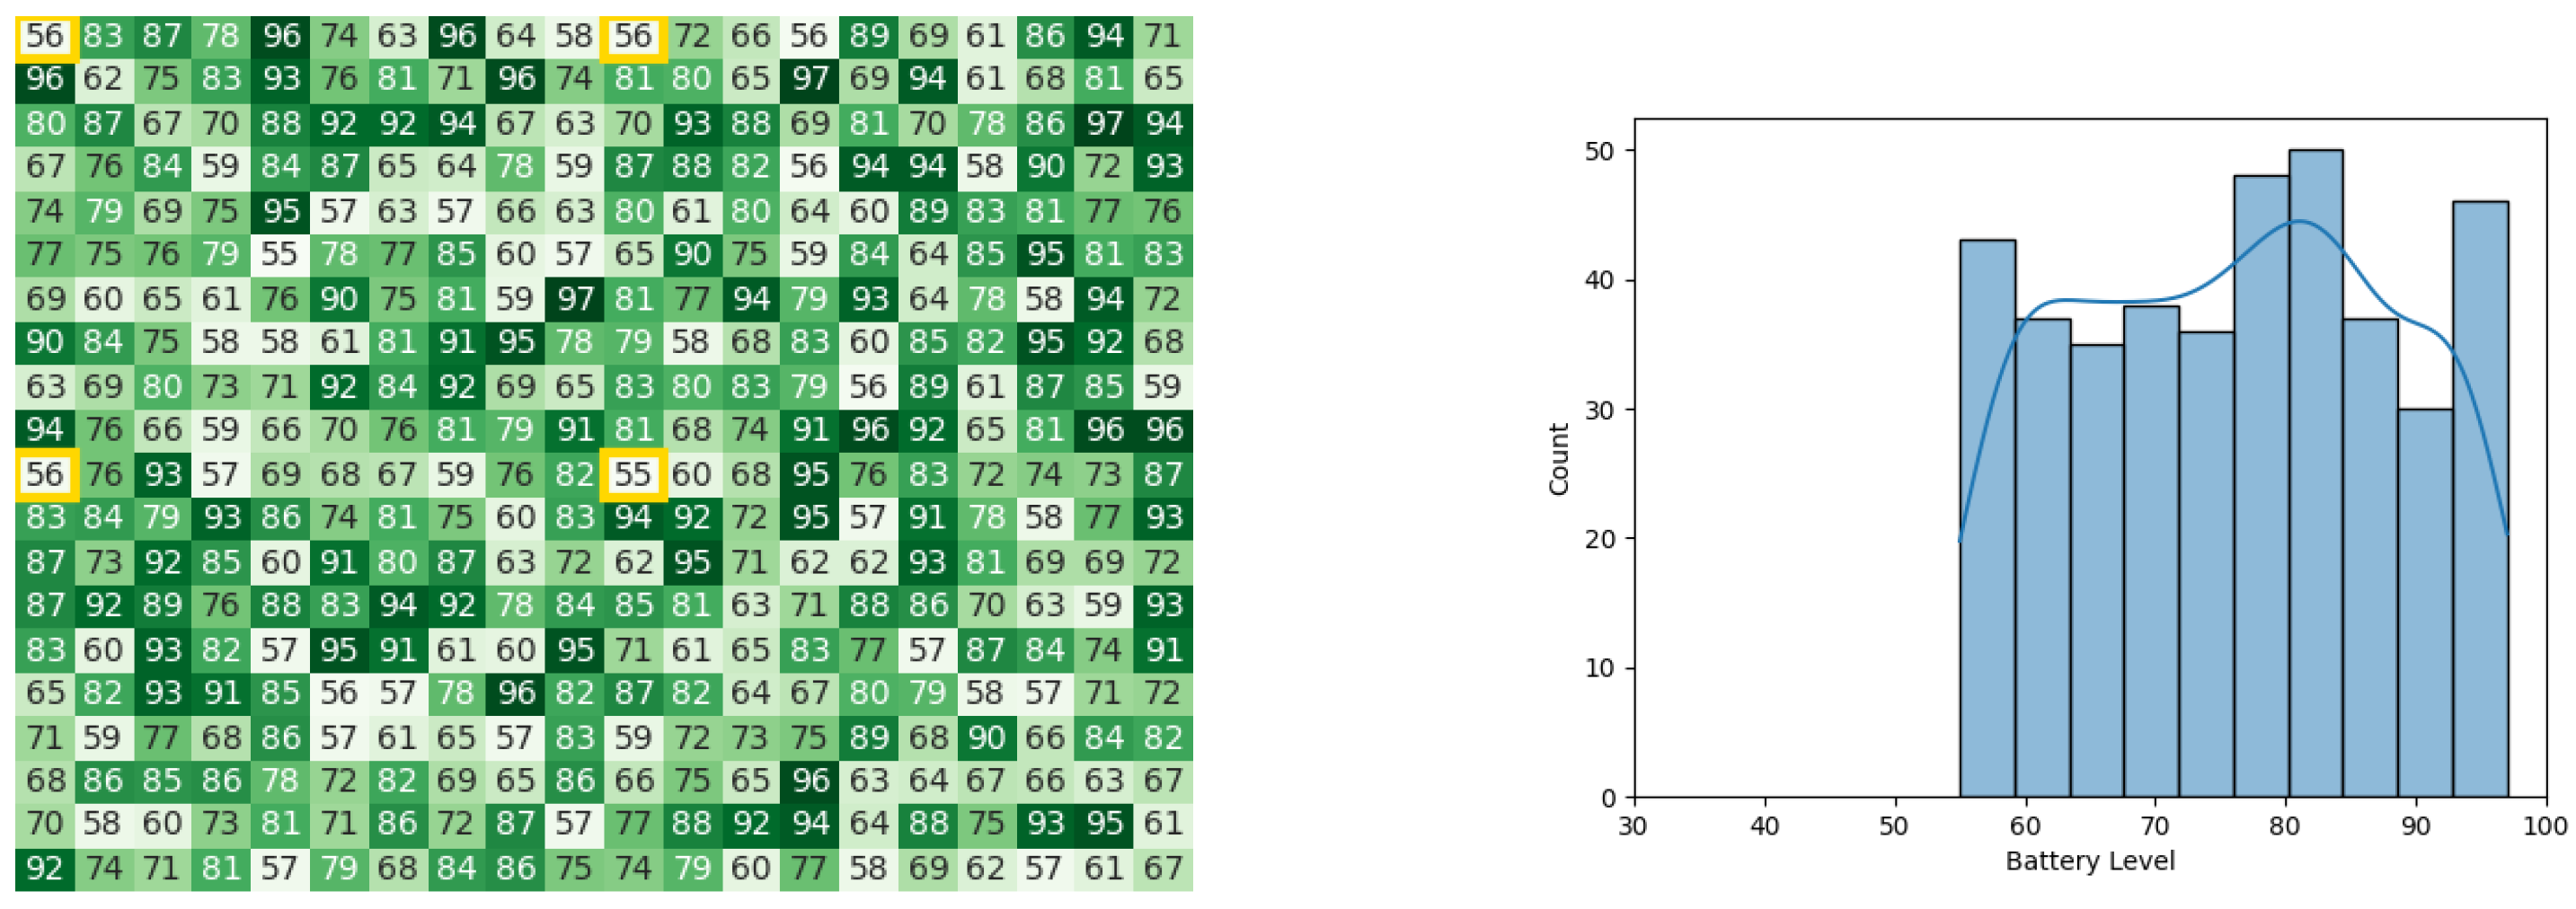
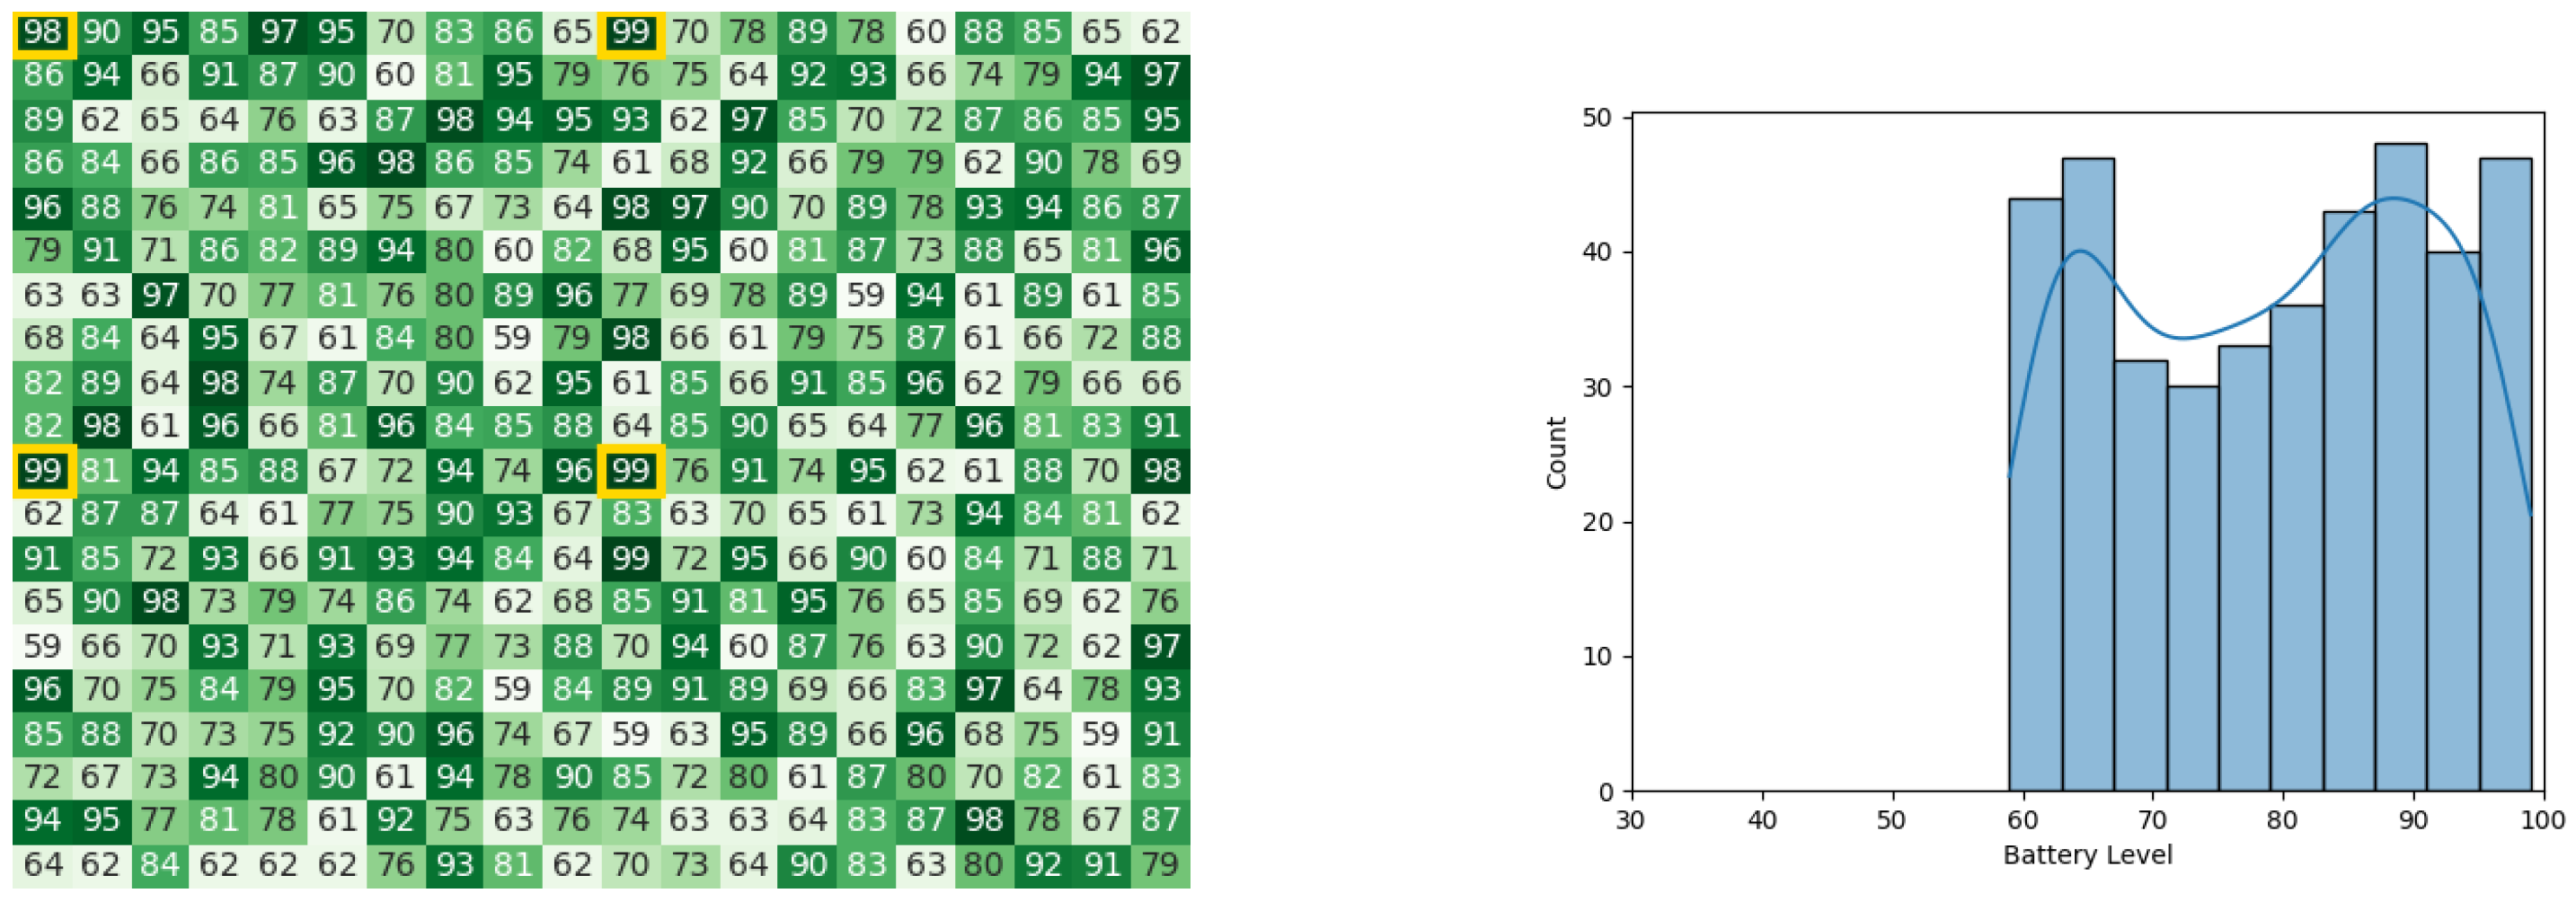
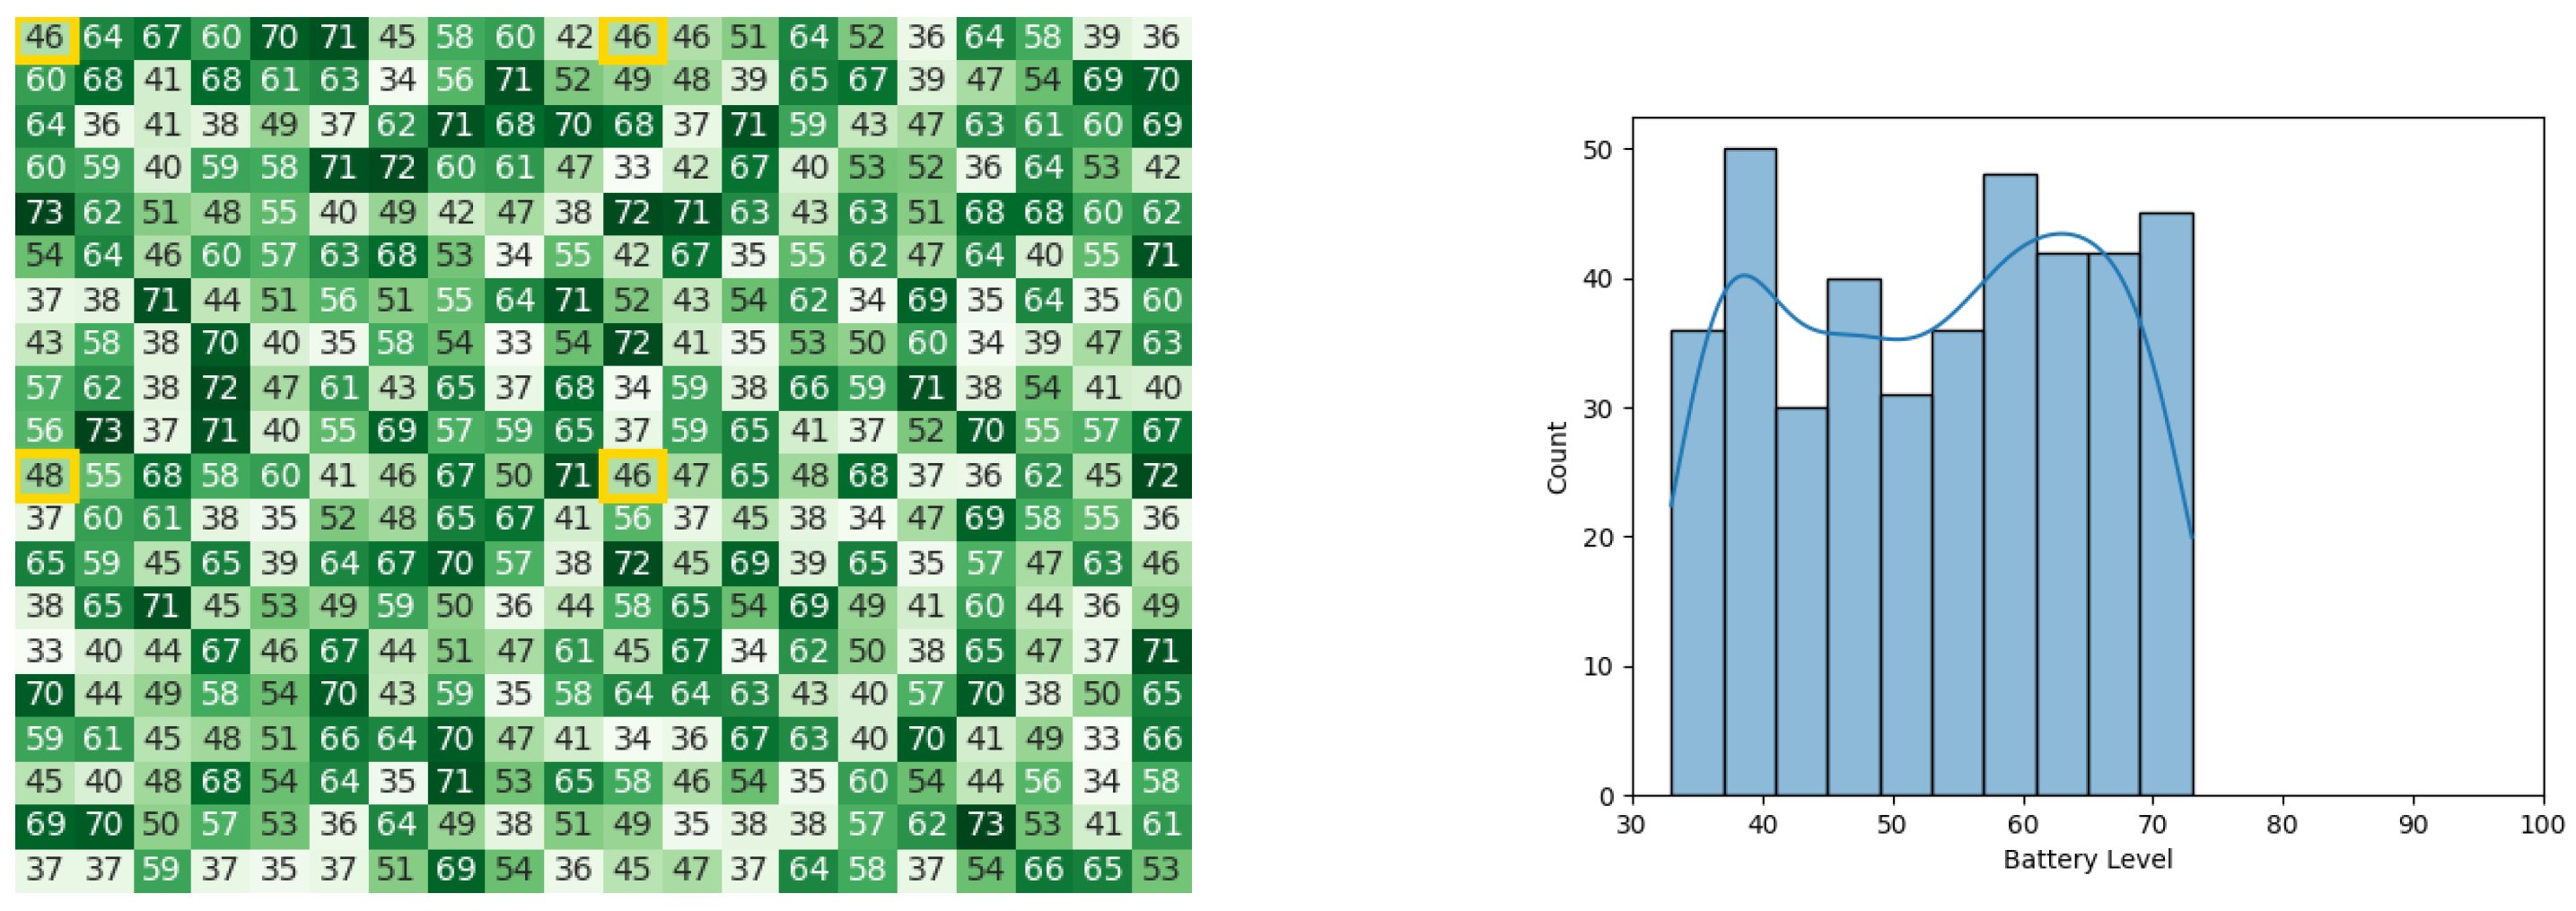
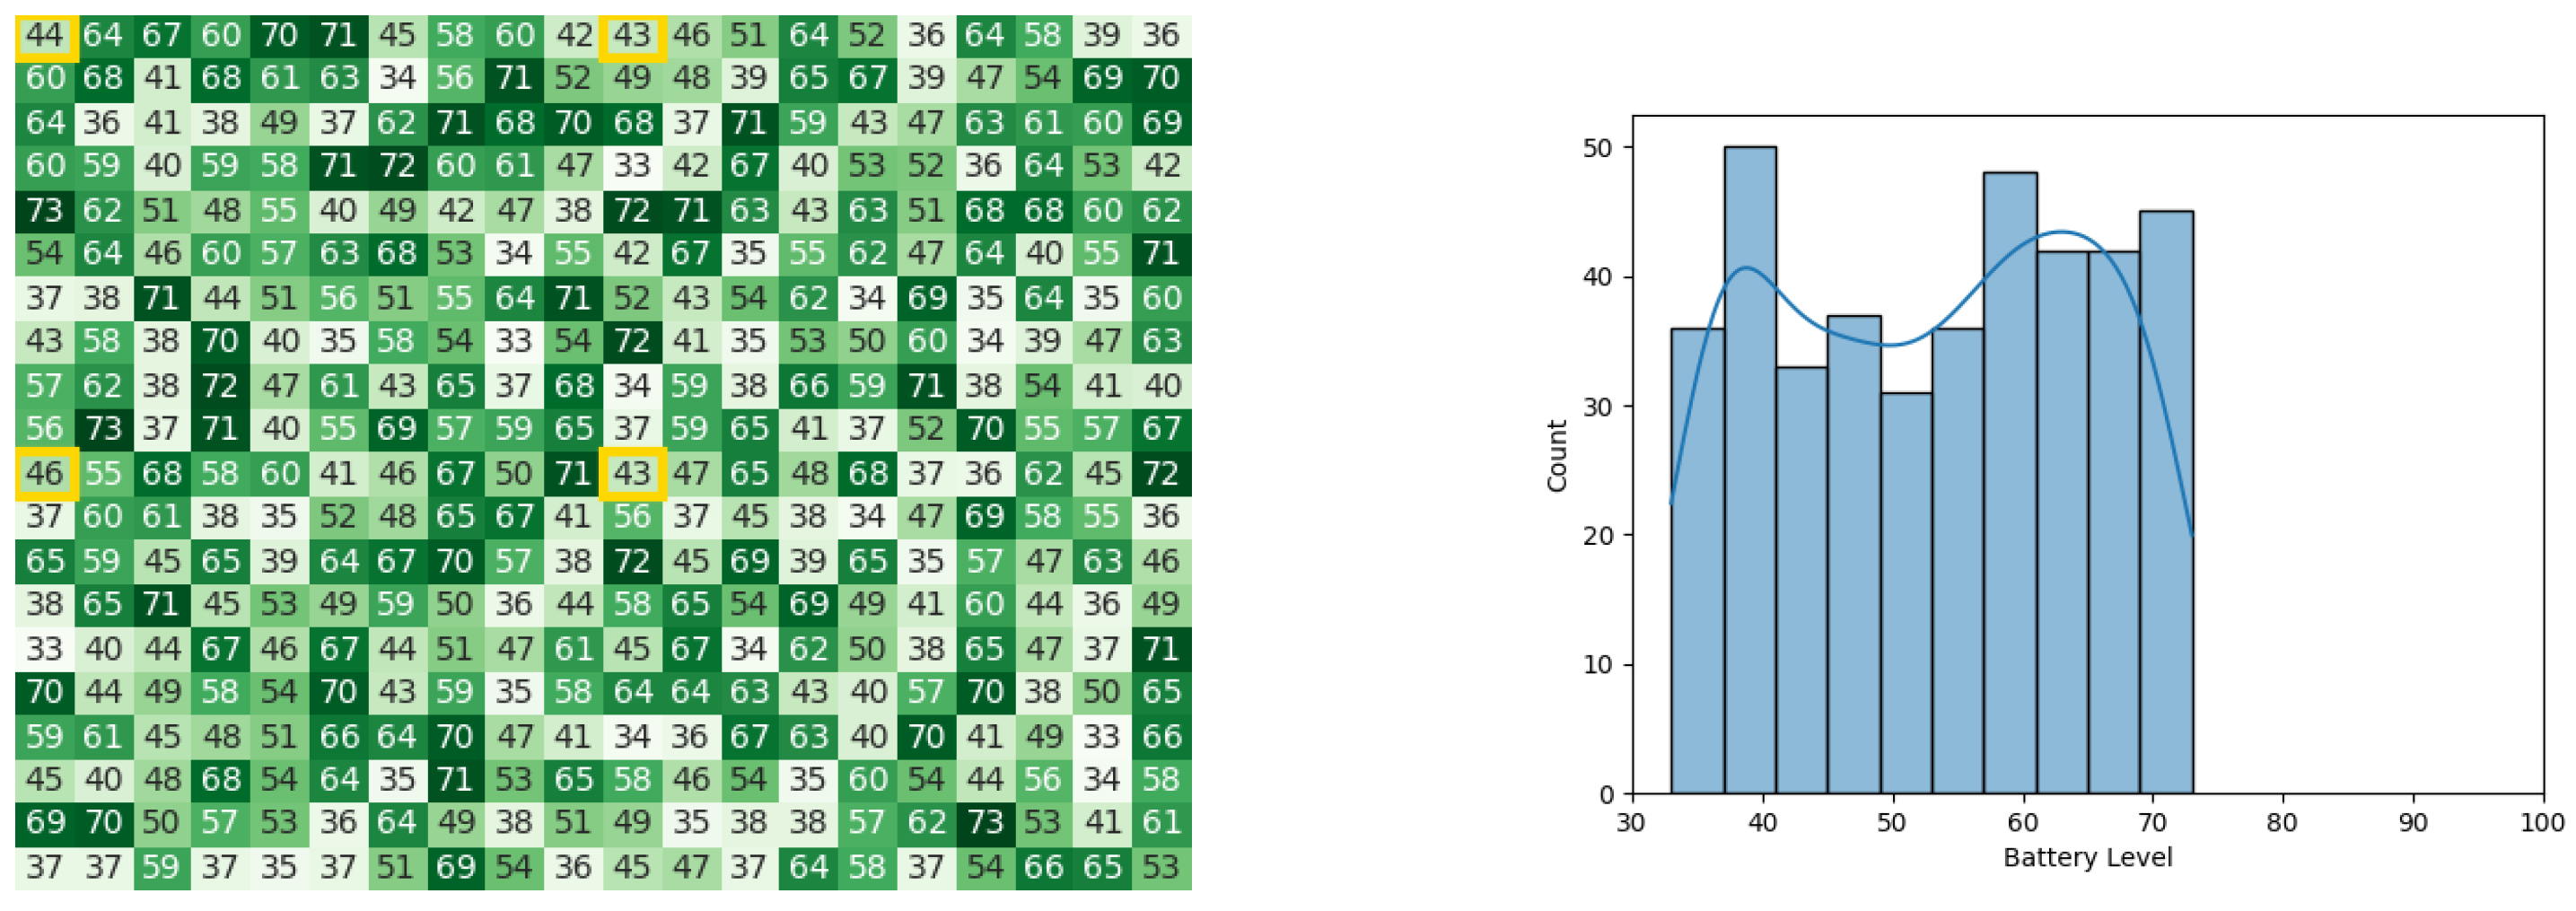
In the following experiments, each of the heat maps illustrates a two-dimensional grid, with each square representing a member of the swarm. The squares with yellow outlines signify the leaders of each cluster, who, as per the initial conditions, possess an initial battery level of 100%. The color of each square corresponds to the battery level of the corresponding swarm member. The histograms illustrate the frequency of battery levels during the different stages of the operation of CDTA, CDTA-CL, and CDTA-DL.

4.1. Experiment 1

All simulations in this experiment shared the same starting conditions in Pyswaro, which were as follows:
  • A swarm consisting of 36 robots.
  • A minimum initial battery of 60%.
  • A maximum initial battery of 100%.
  • A minimum operable robot battery of 2%.
  • All leaders start with 100% battery.
  • All subordinates start with a random battery value between 60% and 100%.
  • There are four leaders in the swarm, each leader is responsible for its cluster.
  • Each leader has eight subordinates in each of the four clusters.
  • Communication delays and battery drainage rates were modeled after the Yanshee robot (see Section 4.3).

4.1.1. Original CDTA Algorithm

With the starting conditions stated earlier, the following heat map and histogram (see Figure 7a,b) illustrate the initial swarm state before executing the original CDTA algorithm, where the tiles with a yellow outline are the leaders of each cluster.
As stated in [49], the ELISA-3 robots communicate with the base station in order to execute all stages of the task allocation process. This type of communication was recreated using the Pyswaro simulation tool. The heat map and histograms (see Figure 8a,b) illustrate the battery levels after the stage of calculating Cbest.
After the process of leaders calculating Gbest and communicating the final value of Gbest to all subordinates, the battery levels became as stated by Figure 9a,b. The total execution time of the original CDTA algorithm in the Pyswaro environment was 0.333 s.

4.1.2. Proposed CDTA-CL Algorithm

With the same starting conditions stated earlier in Section 4.1, the heat map and histogram (see Figure 10a,b) illustrate the initial swarm state before executing the CDTA-CL variation.
After executing the leader synopsis stage, Figure 11a,b represent the battery levels of the swarm. Next, the leader congregation stage contributed to the battery level drainage of the swarm, as indicated by Figure 12a,b. Finally, as the stage of result circulation concluded and the whole swarm knew the value of Gbest, the final battery levels of the swarm are represented in Figure 13a,b. The whole experiment in Pyswaro took 0.152 s to execute.

4.1.3. Proposed CDTA-DL Algorithm

With the same starting conditions stated in the other experiments, the heat maps and histograms in Figure 14a,b, Figure 15a,b, Figure 16a,b, and Figure 17a,b, illustrate the battery levels of the swarm during all stages of the CDTA-DL variation. This experiment took 0.08 s to execute in the Pyswaro environment.

4.2. Experiment 2

In this experiment, the starting conditions for all algorithms were as follows:
  • A swarm consisting of 400 robots.
  • The swarm operates for 10 iterations.
  • A minimum initial battery of 60%.
  • A maximum initial battery of 100%.
  • A minimum operable robot battery of 2%.
  • All leaders start with 100% battery.
  • All subordinates start with a random battery value between 60% and 100%.
  • There are four leaders in the swarm, each leader is responsible for its cluster.
  • Each leader has 99 subordinates in each of the four clusters.
  • Communication delays and battery drainage rates were modeled after the Yanshee robot (see Section 4.3).

4.2.1. Original CDTA Algorithm

The initial battery levels of robots in the CDTA algorithm can be observed in Figure 18.
In the first iteration, heat maps and histograms for battery levels of the robots in the stages of calculating Cbest and Gbest can be observed in Figure 19 and Figure 20, respectively.
In the fifth iteration, heat maps and histograms for battery levels of the robots in the stages of calculating Cbest and Gbest can be observed in Figure 21 and Figure 22, respectively.
In the 10th iteration, heat maps and histograms for battery levels of the robots in the stages of calculating Cbest and Gbest can be observed in Figure 23 and Figure 24, respectively.
After 10 iterations, the swarm consumed a total time of 41.89 s.

4.2.2. Proposed CDTA-CL Algorithm

The initial battery levels of robots in the CDTA-CL algorithm can be observed in Figure 25.
In the first iteration, heat maps and histograms for battery levels of the robots in the leader synopsis, leader congregation, and result circulation stages can be observed in Figure 26, Figure 27, and Figure 28, respectively.
In the fifth iteration, heat maps and histograms for battery levels of the robots in the three stages can be observed in Figure 29, Figure 30, and Figure 31, respectively.
In the 10th iteration, heat maps and histograms for battery levels of the robots in the three stages can be observed in Figure 32, Figure 33, and Figure 34 respectively. Pyswaro executed the 10 iterations in 18.791 s.

4.2.3. Proposed CDTA-DL Algorithm

The initial battery levels of robots in the CDTA-DL algorithm can be observed in Figure 35.
In the first iteration, heat maps and histograms for battery levels of the robots in the leader synopsis, leader congregation, and result circulation stages can be observed in Figure 36, Figure 37, and Figure 38, respectively.
In the fifth iteration, heat maps and histograms for battery levels of the robots in the three stages can be observed in Figure 39, Figure 40, and Figure 41, respectively.
In the 10th iteration, heat maps and histograms for battery levels of the robots in the three stages can be observed in Figure 42, Figure 43, and Figure 44 respectively. The simulation took 9.897 s to execute the 10 iterations.

4.3. Testing on Yanshee

In addition to the experiments executed in Pyswaro’s simulation environment, simplified versions of the experiments were conducted using the Yanshee humanoid robot, referring to the user manual [61]. Five Yanshee robots were provided by the Arab Academy for Science and Technology’s facilities in order to conduct the experiments (see Figure 45). The Yanshee robot is powered by the ARMv8 Cortex-A53 which offers four cores at 1.2 GHz. It also has an onboard memory of 16 GB and 1 GB of RAM. Yanshee also supports 802.11b/g/n 2.4 G Wi-Fi as well as Bluetooth 4.1, which facilitates robot-to-robot communication immensely, which, in turn, supports decentralized communication. Yanshee’s battery capacity is 2750mAh, which is the basis of Pyswaro’s battery consumption rate modeling.
Yanshee comes packed with other features and sensors, but they are irrelevant to the scope of this research. Pyswaro’s results were scaled and verified by the experiments conducted on the Yanshee robots as the results were accurate with minimal error.
Table 1 shows the execution times of the CDTA, CDTA-CL, and CDTA-DL algorithms applied on a swarm of five Yanshee robots with two different swarm configurations:
  • One cluster with one leader and four subordinates.
  • Two clusters where one cluster has one leader and two subordinates, while the other has one leader and one subordinate.
Due to the limited availability of Yanshee robots for experimentation, restricted to only five robots, it is important to note that these results may not perfectly represent the performance of the algorithms with larger swarm sizes, keeping in mind the presence of overhead delays related to the robot hardware, as well as the communication interfaces. However, the execution times observed in these experiments align with the data produced by the Pyswaro simulation tool, which serves as a promising indicator of the algorithms’ behavior.

4.4. Calculating the Optimal Number of Leaders in CDTA-CL and CDTA-DL

Pyswaro was used to test both CDTA-CL and CDTA-DL variations against different swarm sizes and numbers of leaders. In this specific simulation environment, a number of different starting conditions were introduced in order to evaluate execution time solely based on communication time. The introduced conditions are as follows:
  • No battery drainage occurs.
  • No communication timeouts occur.
  • All leaders have an equal number of subordinates.
  • Communication delay was set to 1 ms.
Table 2 and Table 3 show different swarm configurations executed in the Pyswaro environment. Both tables show that the relation between execution time and the number of leaders relative to the size of the swarm follows Equation (6).
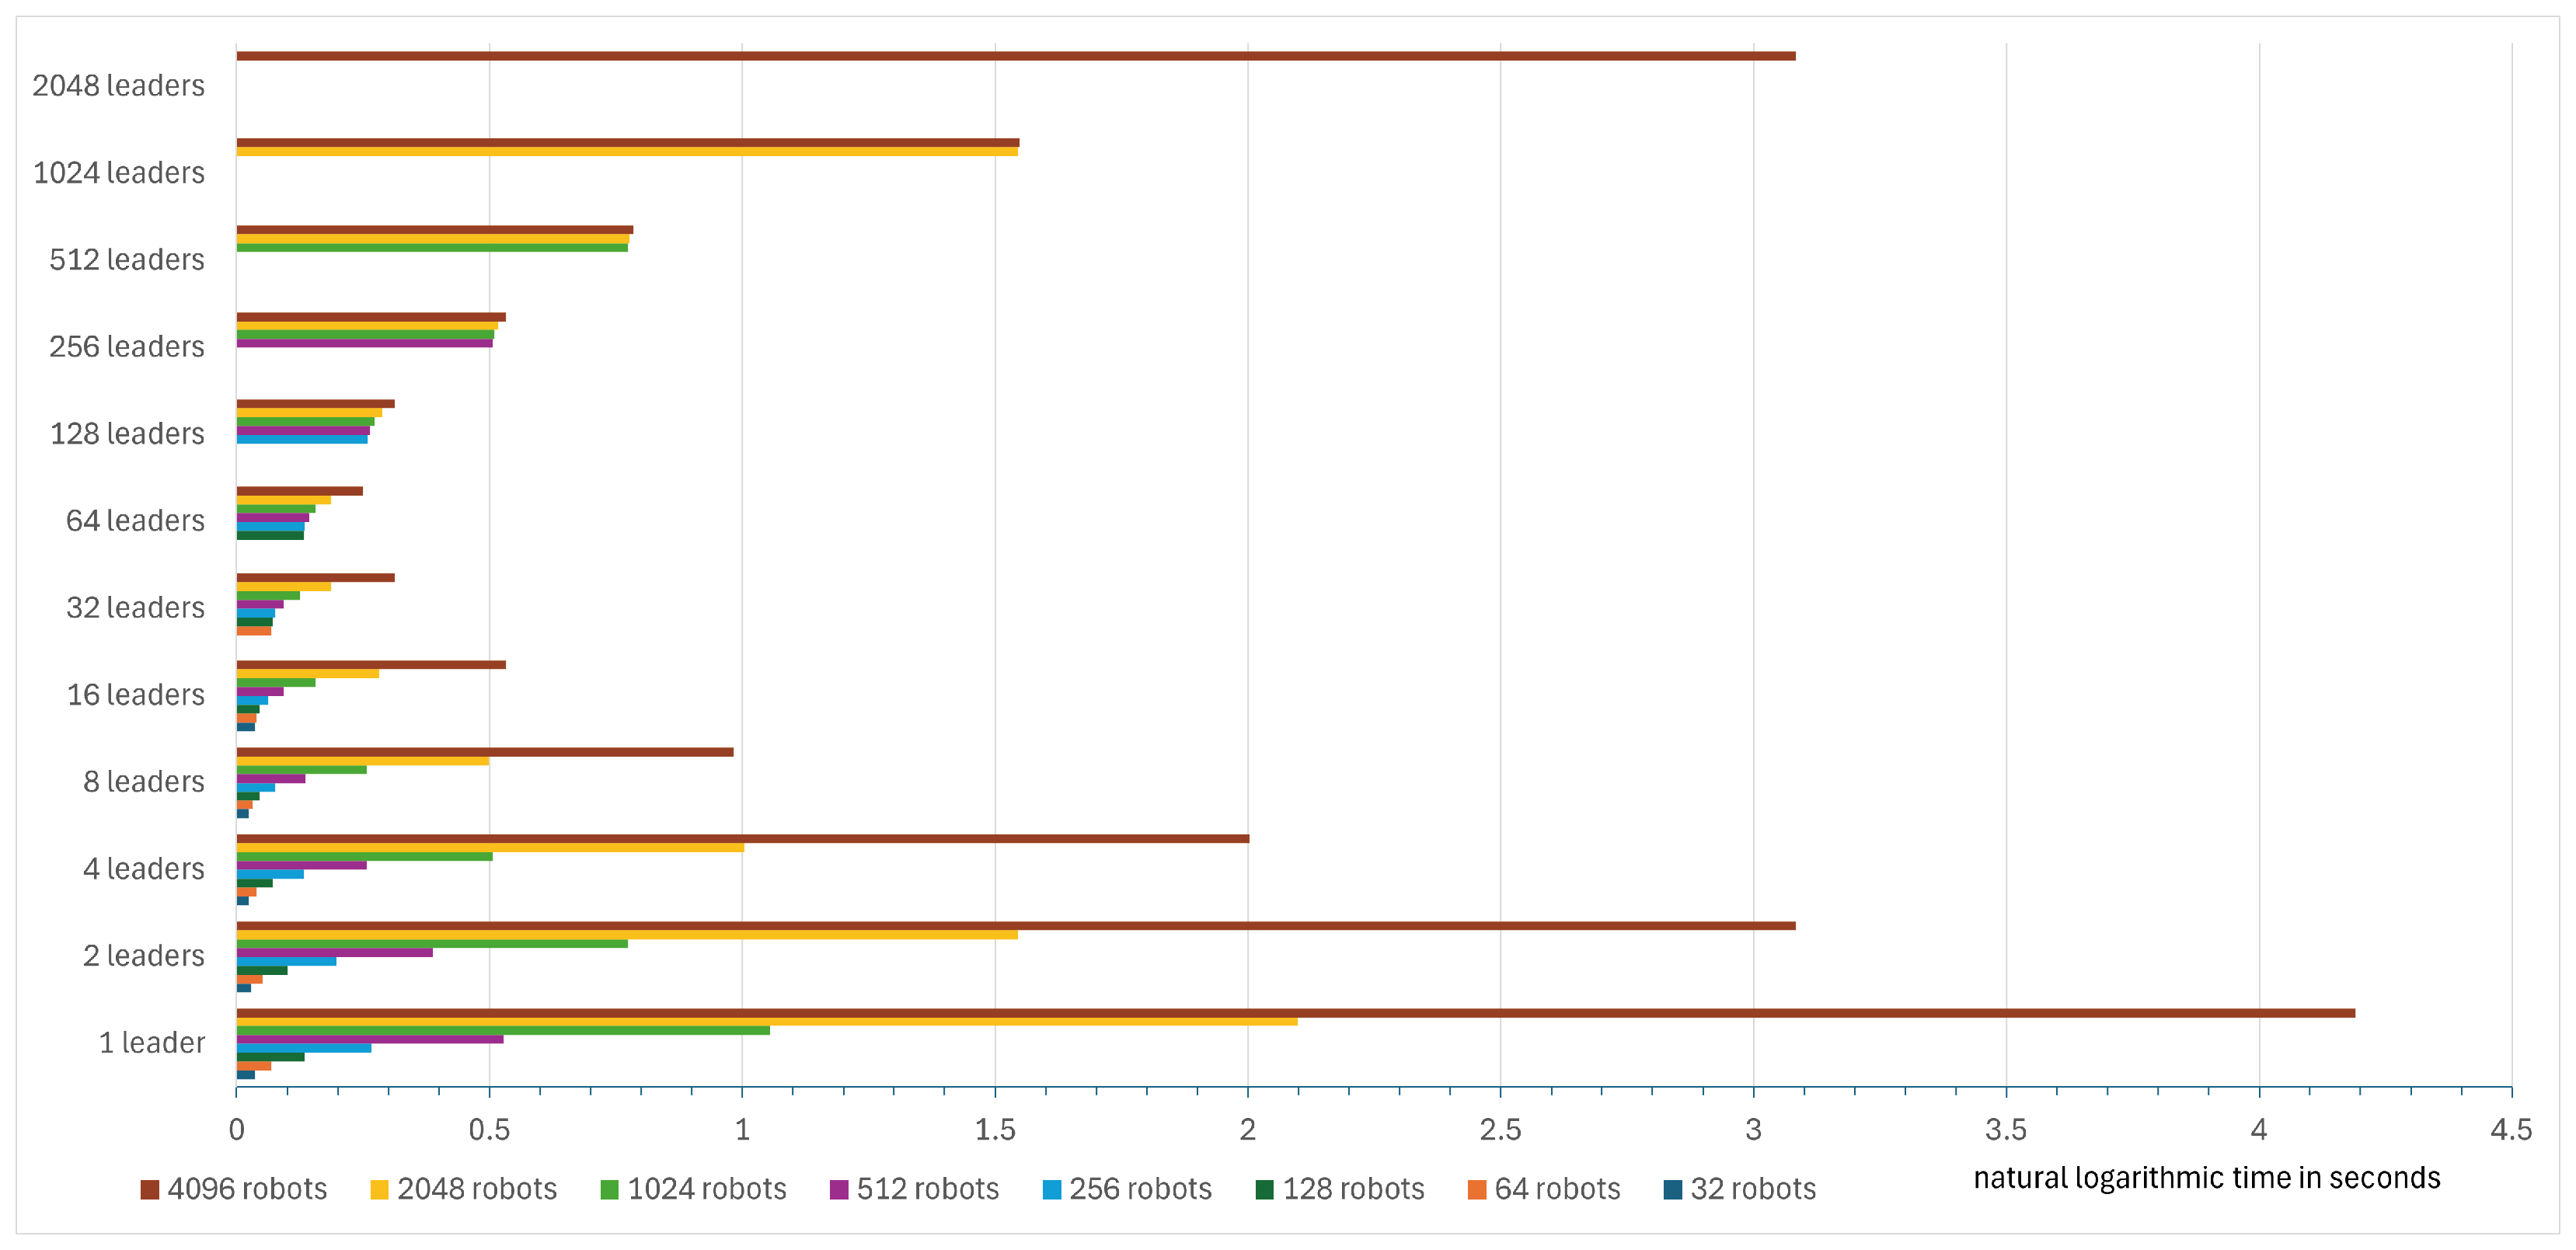
In Table 2, which tested the CDTA-CL variation, it is observed that with a swarm size of 32, increasing the number of leaders improves execution time, as the difference between using four leaders and eight leaders is an improvement of 22.2% in execution time. In a swarm of size 64 robots, the execution time improvement between utilizing four leaders and the optimal number of leaders of eight is 35.29%. Similarly, using the optimal number of leaders of 16 leaders in a swarm of size 128 yields an execution time improvement of 54.5%. The optimal number of leaders in a swarm of size 512 is thirty-two leaders and yields an execution time improvement of 75.96% over using four leaders. It is observed that execution times improve significantly with large robotic swarms, as the improvement in a swarm of 1024 robots with 32 leaders is 81.71%, and, in the case of a swarm of 2048 robots including 64 leaders, the improvement is 87.72%. Finally, in a large swarm of 4096 robots that have an optimal number of 64 leaders, the execution time improvement is 90.73%. These improvements can be further visualized in the form of a bar chart with time scaled using the natural logarithmic scale (see Figure 46).
The CDTA-DL variation follows a similar pattern as shown in Table 3 and bar chart depicted in Figure 47, which is also scaled based on the natural logarithmic scale. In a swarm of size 32 robots, four leaders is already the optimal number, which is similar to the experiments described in Section 4.1.3, which tested a swarm of size 36 on four leaders, with a difference that the experiments described in this subsection have different starting conditions. Moreover, using the optimal number of leaders of eight instead of four on a swarm of size 64 yields an execution time improvement of 20%. The optimal number of leaders in a swarm of size 128 is eight as well, and yields a time improvement of 33.3%. The time improvement in a swarm of size 256 utilizing an optimal number of 16 leaders is 52.94%. And that of a swarm of size 1024 with an optimal number of 32 leaders is 75.38%. Swarms of sizes 2048 and 4096 utilize an optimal number of leaders of 32 and 64, respectively. Both swarm configurations experience an execution time improvement of 81.39% and 87.54%, respectively.
The results showed that increasing the number of leaders for both variations did not necessarily mean that execution times would decrease. That is due to the added communication overhead that is introduced in the leader congregation stage.
Simulation results showed that for a swarm of 2048 robots following the CDTA-DL variation, execution times for a different number of leaders followed Equation (6).
y = 0.5684 · e 0.001 x
where y is the total execution time, and x is the number of leaders. Figure 48 further illustrates the relation between execution time and the number of leaders in swarms of sizes 2048 and 4096, following the CDTA-DL variation in order to determine the optimal number of leaders. The figure shows that for a swarm size of 2048, the optimal number of leaders is six with an execution time of 0.192 s, while for a swarm size of 4096, the optimal number of leaders is seven with an execution time of 0.256 s.
It is observed from both sets of results that, for small swarms, using an optimal number of leaders yields a less significant improvement than for larger swarms. This data could be useful when calculating trade-offs and compromises for real-world scenarios in swarm robotics where communication timeouts and power consumption play a role in the operation of swarms.
The results also prove the superiority of the CDTA-DL variant, which uses the dual loop structure over the CDTA-CL variant, which uses the Centralized Loop structure.
It is worth noting that these simulation results should differ slightly when applied to a real robotic swarm with other factors of time and power consumption.

5. Discussion

5.1. Experiment 1

Experiment 1 (see Section 4.1) showed that the CDTA-DL variation executed the fastest as it was faster than the original CDTA algorithm by 75.976%. The CDTA-DL variation was also faster than the CDTA-CL variation by 47.37%. On the other hand, the CDTA-CL variation was faster than the original CDTA algorithm by 54.4%.
Both of the proposed variations performed better in terms of execution time due to the omission of the base station (see Section 2.2) as a central point of communication and relying on direct robot-to-robot communication, as well as the novel Centralized Loop and dual loop structures utilized to organize communication inside each cluster of the swarm. The presence of a base station decreases the level of autonomy of the swarm, which should ideally be completely decentralized and independent. Removing the base station also removes the issue of a single point of failure, as any error in the base station serves all types of communication and processing for the whole swarm.
In terms of battery loss, (Table 4) shows that the CDTA-DL variation is almost as efficient as the original CDTA algorithm, while the CDTA-CL is less efficient than the other two algorithms. In the original CDTA algorithm, the average battery power lost by any robot of the swarm is 2.1%. In the CDTA-DL algorithm, the average lost battery power is 2.2%, which is only a difference of 0.1% from the most battery-efficient algorithm. The aforementioned table also demonstrates that the CDTA-DL is close to the original CDTA algorithm in terms of the standard deviation of power consumption where it stands at 0.64%, while the original CDTA has a standard deviation of power consumption of 0.32%. The CDTA-CL variation, on the other hand, has a power consumption standard deviation of 1.73%. Similarly, the original CDTA algorithm and the CDTA-DL variation are close in terms of power consumption variance where they have values of 0.1 and 0.41, respectively. The CDTA-CL variation has a power consumption variance of 3 which is much greater than CDTA and CDTA-DL, which indicates greater power consumption.
The CDTA-CL variation was the smallest in terms of power efficiency among the three tested algorithms, as the average battery power lost was 2.4%, whereas a single robot in the experiments lost 12%.
Both of the proposed variations offered less efficient battery consumption than the original CDTA algorithm, although the CDTA-DL variation was on par with the original CDTA algorithm. The reason behind this is that both variations do not rely on a base station, which carries away the heavy and power-consuming processing from the robots in the original CDTA algorithm. However, both variations were significantly faster than the original CDTA algorithm, as stated in (Table 4).
By further utilizing the capabilities of Pyswaro, the three algorithms were tested against colossal swarm populations. As swarm population sizes increased, the two proposed variations executed significantly faster than the CDTA algorithm. For instance, when the swarm population was 1 million robots divided into four clusters with a leader assigned to each cluster, the CDTA algorithm executed in 2.5 h, while the CDTA-CL variation executed in 1.1 h and the CDTA-DL variation executed in just 33 min (see Table 5).

5.2. Experiment 2

Experiment 2 (see Section 4.2) evaluated a much larger swarm population of size 400 for 10 iterations to further enhance the differences between the three algorithms. This experiment showed that the CDTA-DL variation still had the least execution time, where it was faster than the CDTA-CL variation and the original CDTA by 47.33% and 76.37%, respectively. The CDTA-CL variation was faster than the original CDTA by 55.14%.
Both CDTA-CL and CDTA-DL took significantly less time to operate due to the absence of a base station to delegate communication, which adds overhead time as well as an increased probability of communication failure. Decentralized communication is proven to be more effective in terms of execution time for large swarm populations.
In terms of battery loss, the original CDTA algorithm remained the most efficient with a negligible lead against the CDTA-DL variation. In the original CDTA algorithm, the minimum and maximum power lost by a single robot in the 10 iterations were 24.75% and 58.65%, respectively. The CDTA-DL came close with 26.32% and 58.69%, respectively (see Table 6).
The same pattern could be observed regarding the average power lost by any robot during the 10 iterations. For this metric, the original CDTA algorithm achieved 27.69%, while the CDTA-DL variation achieved 28.98%.
While the CDTA-CL variation was considered the least efficient algorithm regarding power consumption, the results shown in Table 6 provide insights for potential applications where the CDTA-CL variation exceeds both CDTA and CDTA-DL. The results show that, in the CDTA-CL variation, the average power lost by any robot is only 9.33%, which exceeds the other algorithms. The reason for this behavior is that CDTA-CL relies on the star network topology inside clusters, which means that each leader is considered the central point of communication. This results in leaders being overworked when communicating with all the subordinates in their respective clusters. This causes the battery levels of leaders to drop severely throughout the swarm’s operation. This also means that subordinates are never overworked, so they retain their battery levels. This can be observed in Table 6, where the minimum power lost by a single robot is 5.2%, which belongs to a subordinate, and the maximum power lost by a single robot is 98.81%, which belongs to a leader. This behavior explains the higher-than-usual standard deviation and variance values of 8.92% and 79.62%, respectively. This behavior can also be visually observed in Figure 34, where all leaders are almost completely depleted beyond an operable state, while all the subordinates succeed in preserving their battery levels.
Such behavior in the CDTA-CL variation can be exploited when the leaders can have much larger battery reserves than the subordinates or can be easily replaced depending on the environment and task at hand. This makes CDTA-CL ideal for applications where the battery health of the majority of the swarm is a priority while maintaining a fast execution time.
After observing the results of experiment 2, CDTA-DL proved to be the best algorithm of the three, as it was the fastest and maintained balanced power consumption, making it applicable in more applications than CDTA-CL and the original CDTA.

6. Conclusion and Future Work

This research proposes the CDTA-CL and CDTA-DL algorithms that accomplish fully autonomous and decentralized clustered dynamic task allocation. Both CDTA-CL and CDTA-DL are considered to be an enhancement of the CDTA algorithm, where communication methods were optimized to be faster. The CDTA-CL variation was tested to operate in only 45.7% of the time taken by the CDTA algorithm, while the CDTA-DL variation only took 24.02% of the time taken by the CDTA algorithm.
The CDTA-CL variation fell behind regarding power efficiency, as the average power lost by any robot during the operation of CDTA-CL was 2.4%, while that of the CDTA algorithm was 2.1%. On the other hand, the CDTA-DL variation was on par with CDTA’s power efficiency, as the average power lost by any robot during the operation of a CDTA-DL was 2.2%.
In conclusion, the CDTA-DL variation is truly an advancement in the field of swarm task allocation as it is substantially faster than the CDTA algorithm while retaining power efficiency and adhering to the ideal representation of a robotic swarm that is fully autonomous and decentralized.
Future optimizations for the existing CDTA-CL and CDTA-DL variations could include an intelligent model that applies different algorithms in order to determine the optimal physical positions of leaders inside their respective clusters to further reduce the time consumed in communications as well as power consumption. Additionally, exploring novel self-organization mechanisms presents another opportunity for future research. Investigating how these mechanisms can enhance coordination and adaptability within the swarm could lead to significant advancements in swarm robotics.

Author Contributions

Conceptualization, M.Y. and O.S.; methodology, M.Y.; software, M.Y.; validation, M.Y., O.S. and O.I.; formal analysis, M.Y. and O.S.; investigation, M.Y.; resources, M.Y. and O.S.; data curation, M.Y.; writing—original draft preparation, M.Y. and O.S.; writing—review and editing, O.S. and O.I.; visualization, M.Y.; supervision, O.S. and O.I.; project administration, O.S. All authors have read and agreed to the published version of the manuscript.

Funding

This research received no external funding.

Institutional Review Board Statement

Not applicable.

Informed Consent Statement

Not applicable.

Data Availability Statement

Data are contained within the article.

Conflicts of Interest

The authors declare no conflicts of interest.

Abbreviations

The following abbreviations are used in this manuscript:
ABCArtificial Bee Colony
ACOAnt Colony Optimizer
CDTAClustered Dynamic Task Allocation
CDTA-CLClustered Dynamic Task Allocation–Centralized Loop
CDTA-DLClustered Dynamic Task Allocation–Dual Loop
DBADistributed Bee Algorithm
DTADynamic Task Allocation
GDTAGlobal Dynamic Task Allocation
PSOParticle Swarm Optimization
SOSelf-Organization

References

  1. Alyassi, R.; Khonji, M.; Karapetyan, A.; Chau, S.C.K.; Elbassioni, K.; Tseng, C.M. Autonomous recharging and flight mission planning for battery-operated autonomous drones. IEEE Trans. Autom. Sci. Eng. 2022, 20, 1034–1046. [Google Scholar] [CrossRef]
  2. Campion, M.; Ranganathan, P.; Faruque, S. UAV swarm communication and control architectures: A review. J. Unmanned Veh. Syst. 2018, 7, 93–106. [Google Scholar] [CrossRef]
  3. Khatab, E.; Onsy, A.; Abouelfarag, A. Evaluation of 3D Vulnerable Objects’ Detection Using a Multi-Sensors System for Autonomous Vehicles. Sensors 2022, 22, 1663. [Google Scholar] [CrossRef]
  4. Ardiny, H.; Witwicki, S.; Mondada, F. Construction automation with autonomous mobile robots: A review. In Proceedings of the 2015 3rd RSI International Conference on Robotics and Mechatronics (ICROM), Tehran, Iran, 7–9 October 2015; IEEE: Piscataway, NJ, USA, 2015; pp. 418–424. [Google Scholar]
  5. Pang, Z.; Yang, G.; Khedri, R.; Zhang, Y.T. Introduction to the Special Section: Convergence of Automation Technology, Biomedical Engineering, and Health Informatics Toward the Healthcare 4.0. IEEE Rev. Biomed. Eng. 2018, 11, 249–259. [Google Scholar] [CrossRef]
  6. Rowe, O.S.P. Computer-assisted robotic system for autonomous unicompartmental knee arthroplasty. Alex. Eng. J. 2023, 70, 441–451. [Google Scholar] [CrossRef]
  7. Albiero, D.; Garcia, A.P.; Umezu, C.K.; de Paulo, R.L. Swarm Robots in Agriculture. arXiv 2021, arXiv:2103.06732. [Google Scholar]
  8. Kovalev, D.; Salim, A.; Richtárik, P. Optimal and practical algorithms for smooth and strongly convex decentralized optimization. Adv. Neural Inf. Process. Syst. 2020, 33, 18342–18352. [Google Scholar]
  9. Miyazaki, R.; Murase, T. Centralized Route Control for Expanding Coverage by Wireless LAN with Many Vehicle APs. In Proceedings of the 2021 IEEE 11th Annual Computing and Communication Workshop and Conference (CCWC), Las Vegas, NV, USA, 27–30 January 2021; IEEE: Piscataway, NJ, USA, 2021; pp. 0399–0404. [Google Scholar]
  10. Maeterlinck, M. The Life of the White Ant; George Allen and Unwin: Crows Nest, NSW, Australia, 1927. [Google Scholar]
  11. Hölldobler, B.; Wilson, E.O. The Ants; Harvard University Press: Cambridge, MA, USA, 1990. [Google Scholar]
  12. Zhu, A.; Dai, T.; Xu, G.; Pauwels, P.; de Vries, B.; Fang, M. Deep reinforcement learning for real-time assembly planning in robot-based prefabricated construction. IEEE Trans. Autom. Sci. Eng. 2023, 20, 1515–1526. [Google Scholar] [CrossRef]
  13. Kehoe, B.; Patil, S.; Abbeel, P.; Goldberg, K. A survey of research on cloud robotics and automation. IEEE Trans. Autom. Sci. Eng. 2015, 12, 398–409. [Google Scholar] [CrossRef]
  14. Gaber, I.M.; Shalash, O.; Hamad, M.S. Optimized Inter-Turn Short Circuit Fault Diagnosis for Induction Motors using Neural Networks with LeLeRU. In Proceedings of the 2023 IEEE Conference on Power Electronics and Renewable Energy (CPERE), Luxor, Egypt, 9–21 February 2023; IEEE: Piscataway, NJ, USA, 2023; pp. 1–5. [Google Scholar]
  15. Issa, R.; Badr, M.M.; Shalash, O.; Othman, A.A.; Hamdan, E.; Hamad, M.S.; Abdel-Khalik, A.S.; Ahmed, S.; Imam, S.M. A Data-Driven Digital Twin of Electric Vehicle Li-Ion Battery State-of-Charge Estimation Enabled by Driving Behavior Application Programming Interfaces. Batteries 2023, 9, 521. [Google Scholar] [CrossRef]
  16. Khatab, E.; Onsy, A.; Varley, M.; Abouelfarag, A. A Lightweight Network for Real-Time Rain Streaks and Rain Accumulation Removal from Single Images Captured by AVs. Appl. Sci. 2022, 13, 219. [Google Scholar] [CrossRef]
  17. Nicolis, G. Self-organization in nonequilibrium systems. In Dissipative Structures to Order through Fluctuations; Springer: Dordrecht, The Netherlands, 1977; pp. 339–426. [Google Scholar]
  18. Del Valle, Y.; Venayagamoorthy, G.K.; Mohagheghi, S.; Hernandez, J.C.; Harley, R.G. Particle swarm optimization: Basic concepts, variants and applications in power systems. IEEE Trans. Evol. Comput. 2008, 12, 171–195. [Google Scholar] [CrossRef]
  19. McMahon, J.; Plaku, E. Autonomous Data Collection With Dynamic Goals and Communication Constraints for Marine Vehicles. IEEE Trans. Autom. Sci. Eng. 2022, 20, 1607–1620. [Google Scholar] [CrossRef]
  20. Candea, C.; Hu, H.; Iocchi, L.; Nardi, D.; Piaggio, M. Coordination in multi-agent RoboCup teams. Robot. Auton. Syst. 2001, 36, 67–86. [Google Scholar] [CrossRef]
  21. Brambilla, M.; Ferrante, E.; Birattari, M.; Dorigo, M. Swarm robotics: A review from the swarm engineering perspective. Swarm Intell. 2013, 7, 1–41. [Google Scholar] [CrossRef]
  22. Hu, W.; Yen, G.G. Adaptive multiobjective particle swarm optimization based on parallel cell coordinate system. IEEE Trans. Evol. Comput. 2013, 19, 1–18. [Google Scholar]
  23. Bonyadi, M.R. A theoretical guideline for designing an effective adaptive particle swarm. IEEE Trans. Evol. Comput. 2019, 24, 57–68. [Google Scholar] [CrossRef]
  24. Zhang, Y.; Wang, Y.H.; Gong, D.W.; Sun, X.Y. Clustering-guided particle swarm feature selection algorithm for high-dimensional imbalanced data with missing values. IEEE Trans. Evol. Comput. 2021, 26, 616–630. [Google Scholar] [CrossRef]
  25. Li, R.; Xiao, Y.; Yang, P.; Tang, W.; Wu, M.; Gao, Y. UAV-aided two-way relaying for wireless communications of intelligent robot swarms. IEEE Access 2020, 8, 56141–56150. [Google Scholar] [CrossRef]
  26. Sun, Y.; Cai, Z.; Guo, C.; Ma, G.; Zhang, Z.; Wang, H.; Liu, J.; Kang, Y.; Yang, J. Collaborative Dynamic Task Allocation With Demand Response in Cloud-Assisted Multiedge System for Smart Grids. IEEE Internet Things J. 2021, 9, 3112–3124. [Google Scholar] [CrossRef]
  27. Yang, J.; Ni, J.; Xi, M.; Wen, J.; Li, Y. Intelligent path planning of underwater robot based on reinforcement learning. IEEE Trans. Autom. Sci. Eng. 2022, 20, 1983–1996. [Google Scholar] [CrossRef]
  28. Camazine, S.; Deneubourg, J.L.; Franks, N.; Sneyd, J.; Theraulaz, G.; Bonabeau, E. Self-Organization in Biological Systems; Princeton Studies in Complexity; Princeton University Press: Princeton, NJ, USA, 2001. [Google Scholar]
  29. Bonabeau, E.; Theraulaz, G.; Dorigo, M.; Theraulaz, G.; Marco, D.d.R.D.F. Swarm Intelligence: From Natural to Artificial Systems; Number 1; Oxford University Press: Oxford, UK, 1999. [Google Scholar]
  30. Groß, R.; Bonani, M.; Mondada, F.; Dorigo, M. Autonomous self-assembly in swarm-bots. IEEE Trans. Robot. 2006, 22, 1115–1130. [Google Scholar]
  31. Pimenta, L.C.; Pereira, G.A.; Michael, N.; Mesquita, R.C.; Bosque, M.M.; Chaimowicz, L.; Kumar, V. Swarm coordination based on smoothed particle hydrodynamics technique. IEEE Trans. Robot. 2013, 29, 383–399. [Google Scholar] [CrossRef]
  32. Liu, D.; Dou, L.; Zhang, R.; Zhang, X.; Zong, Q. Multi-Agent Reinforcement Learning-Based Coordinated Dynamic Task Allocation for Heterogenous UAVs. IEEE Trans. Veh. Technol. 2022, 72, 4372–4383. [Google Scholar] [CrossRef]
  33. Pugh, J.; Martinoli, A. Parallel learning in heterogeneous multi-robot swarms. In Proceedings of the 2007 IEEE Congress on Evolutionary Computation, Singapore, 25–28 September 2007; pp. 3839–3846. [Google Scholar]
  34. Chung, S.J.; Paranjape, A.A.; Dames, P.; Shen, S.; Kumar, V. A survey on aerial swarm robotics. IEEE Trans. Robot. 2018, 34, 837–855. [Google Scholar] [CrossRef]
  35. Yang, L.; Yu, J.; Yang, S.; Wang, B.; Nelson, B.J.; Zhang, L. A survey on swarm microrobotics. IEEE Trans. Robot. 2021, 38, 1531–1551. [Google Scholar] [CrossRef]
  36. Shami, T.M.; El-Saleh, A.A.; Alswaitti, M.; Al-Tashi, Q.; Summakieh, M.A.; Mirjalili, S. Particle swarm optimization: A comprehensive survey. IEEE Access 2022, 10, 10031–10061. [Google Scholar] [CrossRef]
  37. Rossides, G.; Metcalfe, B.; Hunter, A. Particle Swarm Optimization—An Adaptation for the Control of Robotic Swarms. Robotics 2021, 10, 58. [Google Scholar] [CrossRef]
  38. Yingying, D.; Yan, H.; Jingping, J. Multi-robot cooperation method based on the ant algorithm. In Proceedings of the Proceedings of the 2003 IEEE Swarm Intelligence Symposium. SIS’03 (Cat. No. 03EX706), Indianapolis, IN, USA, 26 April 2003; pp. 14–18. [Google Scholar]
  39. Zhang, D.; Xie, G.; Yu, J.; Wang, L. Adaptive task assignment for multiple mobile robots via swarm intelligence approach. Robot. Auton. Syst. 2007, 55, 572–588. [Google Scholar] [CrossRef]
  40. Jevtic, A.; Gutiérrez, A.; Andina, D.; Jamshidi, M. Distributed bees algorithm for task allocation in swarm of robots. IEEE Syst. J. 2011, 6, 296–304. [Google Scholar] [CrossRef]
  41. Jevtić, A.; Gutiérrez, A. Distributed bees algorithm parameters optimization for a cost efficient target allocation in swarms of robots. Sensors 2011, 11, 10880–10893. [Google Scholar] [CrossRef] [PubMed]
  42. Tkach, I.; Jevtić, A.; Nof, S.Y.; Edan, Y. A modified distributed bees algorithm for multi-sensor task allocation. Sensors 2018, 18, 759. [Google Scholar] [CrossRef] [PubMed]
  43. Lee, W.; Kim, D. Adaptive approach to regulate task distribution in swarm robotic systems. Swarm Evol. Comput. 2019, 44, 1108–1118. [Google Scholar] [CrossRef]
  44. Ji, J.; Guo, Y.; Gong, D.; Shen, X. Evolutionary multi-task allocation for mobile crowdsensing with limited resource. Swarm Evol. Comput. 2021, 63, 100872. [Google Scholar] [CrossRef]
  45. Karaboga, D.; Okdem, S.; Ozturk, C. Cluster based wireless sensor network routing using artificial bee colony algorithm. Wirel. Networks 2012, 18, 847–860. [Google Scholar] [CrossRef]
  46. Lerman, K.; Jones, C.; Galstyan, A.; Matarić, M.J. Analysis of dynamic task allocation in multi-robot systems. Int. J. Robot. Res. 2006, 25, 225–241. [Google Scholar] [CrossRef]
  47. Eberhart, R.; Kennedy, J. A new optimizer using particle swarm theory. In Proceedings of the MHS’95. Proceedings of the Sixth International Symposium on Micro Machine and Human Science, Nagoya, Japan, 4–6 October 1995; pp. 39–43. [Google Scholar]
  48. Nedjah, N.; de Mendonça, R.M.; de Macedo Mourelle, L. PSO-based distributed algorithm for dynamic task allocation in a robotic swarm. Procedia Comput. Sci. 2015, 51, 326–335. [Google Scholar] [CrossRef]
  49. Nedjah, N.; Ribeiro, L.M.; de Macedo Mourelle, L. Communication optimization for efficient dynamic task allocation in swarm robotics. Appl. Soft Comput. 2021, 105, 107297. [Google Scholar] [CrossRef]
  50. Sun, Y.; Li, W.; Ruan, J. Generalized outer synchronization between complex dynamical networks with time delay and noise perturbation. Commun. Nonlinear Sci. Numer. Simul. 2013, 18, 989–998. [Google Scholar] [CrossRef]
  51. Arellano-Delgado, A.; López-Gutiérrez, R.M.; Murillo-Escobar, M.Á.; Posadas-Castillo, C. Master–Slave Outer Synchronization in Different Inner–Outer Coupling Network Topologies. Entropy 2023, 25, 707. [Google Scholar] [CrossRef]
  52. Shi, Y.; RC, E. A Modified Particle Swarm Optimizer. In Proceedings of the 1998 IEEE International Conference on Evolutionary Computation Proceedings. IEEE World Congress on Computational Intelligence (Cat. No.98TH8360), Anchorage, AK, USA, 4–9 May 1998; pp. 69–73. [Google Scholar] [CrossRef]
  53. Atmel. ATmega 2560 Data Sheet. Techreport, 1600 Technology Drive San Jose, CA 95110 United States, 2022. Available online: https://ww1.microchip.com/downloads/en/devicedoc/atmel-2549-8-bit-avr-microcontroller-atmega640-1280-1281-2560-2561_datasheet.pdf (accessed on 10 March 2023).
  54. Semiconductors, N. Preliminary Product Specification V1. Technical Report. 2022. Available online: https://www.sparkfun.com/datasheets/Components/SMD/nRF24L01Pluss_Preliminary_Product_Specification_v1_0.pdf (accessed on 10 March 2023).
  55. Vaezinejad, S.; Marandi, S.M.; Salajegheh, E. A Hybrid of Artificial Neural Networks and Particle Swarm Optimization Algorithm for Inverse Modeling of Leakage in Earth Dams. Civ. Eng. J. 2019, 5, 2041–2057. [Google Scholar] [CrossRef]
  56. de Pinho Pinheiro, C.A.; Nedjah, N.; de Macedo Mourelle, L. Detection and classification of pulmonary nodules using deep learning and swarm intelligence. Multimed. Tools Appl. 2020, 79, 15437–15465. [Google Scholar] [CrossRef]
  57. Ramos, J.; Nedjah, N.; Mourelle, L.; Gupta, B.B. Visual data mining for crowd anomaly detection using artificial bacteria colony. Multimed. Tools Appl. 2018, 77, 17755–17777. [Google Scholar] [CrossRef]
  58. Tavares, Y.; Nedjah, N.; Mourelle, L. Embedded implementation of template matching using correlation and particle swarm optimisation. Int. J. Bio-Inspired Comput. 2018, 11, 102. [Google Scholar] [CrossRef]
  59. Qin, B.; Zhang, D.; Tang, S.; Wang, M. Distributed Grouping Cooperative Dynamic Task Assignment Method of UAV Swarm. Appl. Sci. 2022, 12, 2865. [Google Scholar] [CrossRef]
  60. Yasser, M. Pyswaro. 2022. Available online: https://github.com/MohamedYasser97/pyswaro (accessed on 2 June 2023).
  61. UBTECH ROBOTICS CORP. Yanshee User Manual; Techreport; UBTECH ROBOTICS CORP: Shenzhen, China, 2018. [Google Scholar]
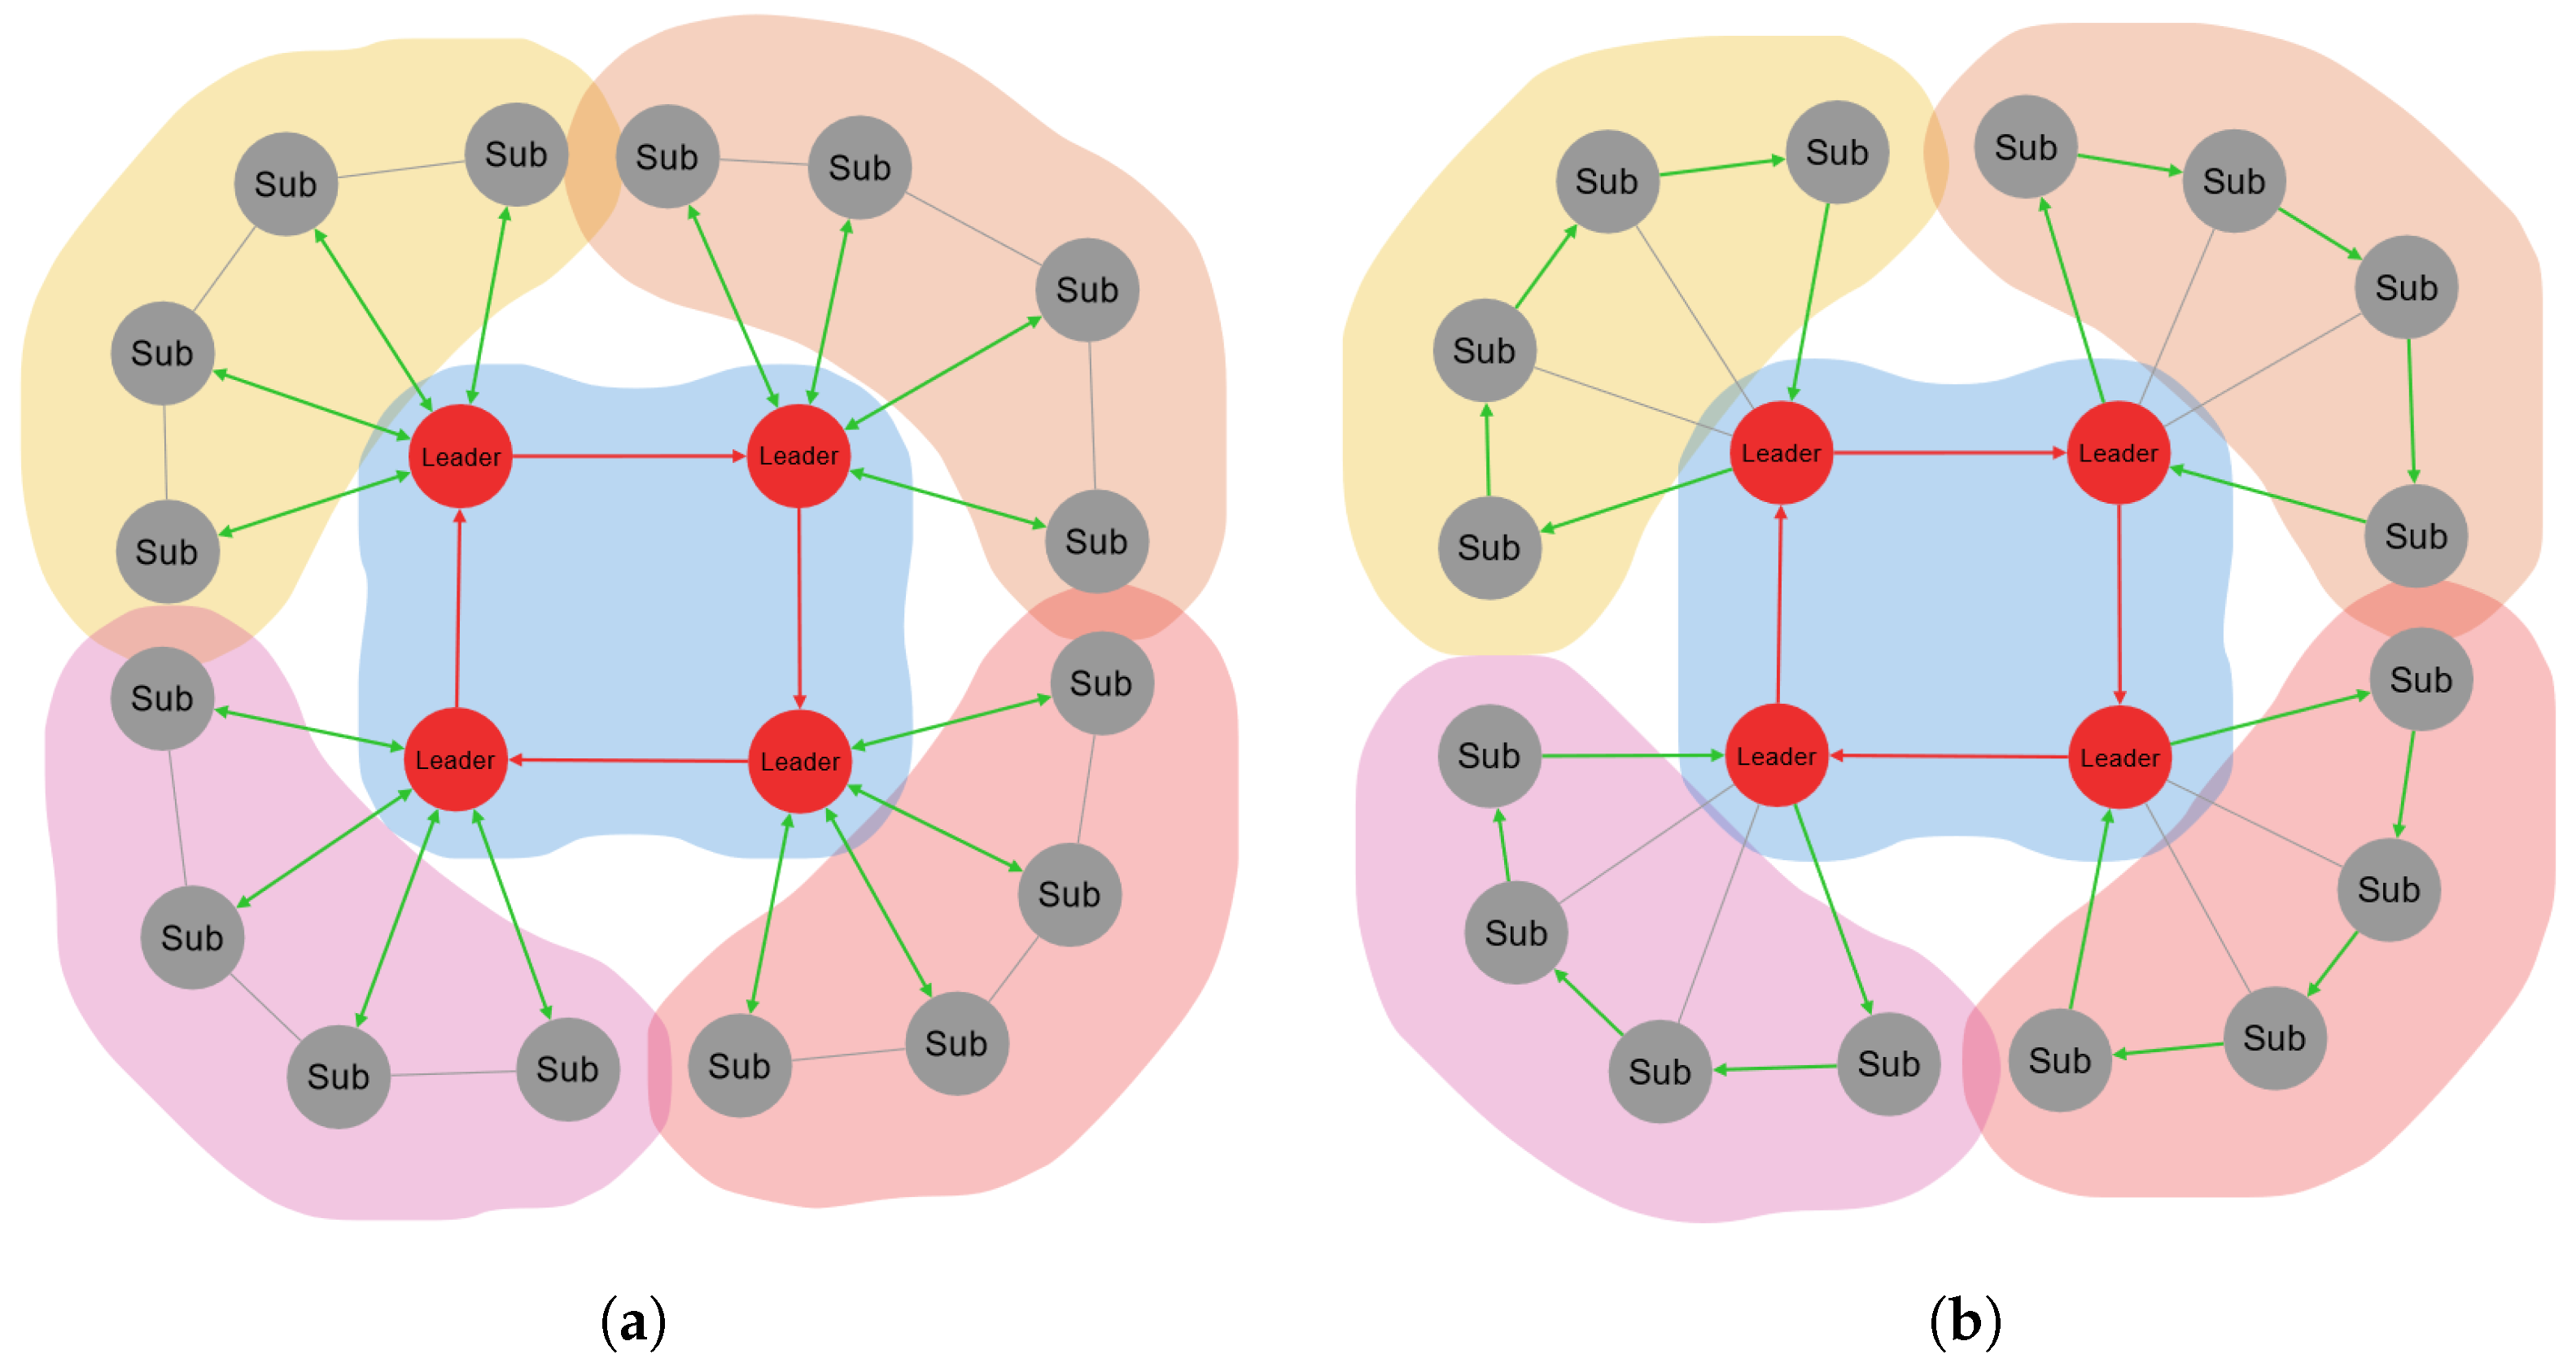
Figure 1. The mechanism of the CDTA-CL and CDTA-DL algorithms. Green arrows highlight the communication topology used between leaders and subordinates. Red arrows indicate ring topology communication applied between leaders. (a) The mechanism of the CDTA-CL algorithm. Green arrows indicate star topology. (b) The mechanism of the CDTA-DL algorithm. Green arrows indicate ring topology.
Robotics 13 00066 g001
Figure 2. Traditional Representation of Star Topology.
Robotics 13 00066 g002
Figure 3. Leader synopsis in the CDTA-CL variation. Green arrows indicate star topology applied between the leader and the subordinates.
Robotics 13 00066 g003
Figure 4. Multiple usages of the dual loop structure in the variations. (a) Leader synopsis in the CDTA-DL variation. Green arrows indicate ring topology applied between the leader and the subordinates. (b) Leader congregation in both variations. Red arrows indicate ring topology applied between leaders.
Robotics 13 00066 g004
Figure 5. Result circulation in both variations. (a) Result circulation in the CDTA-CL variation. Green arrows indicate star topology applied between the leader and the subordinates. (b) Result circulation in the CDTA-DL variation. Green arrows indicate ring topology applied between the leader and the subordinates.
Robotics 13 00066 g005
Figure 6. Flowcharts illustrating the process of both variations. (a) Flowchart for the CDTA-CL variation. (b) Flowchart for the CDTA-DL variation.
Robotics 13 00066 g006
Figure 7. The initial battery states for the CDTA algorithm. (a) Initial heat map for the CDTA algorithm. Battery levels are indicated with a gradient from dark green to white descendingly. (b) initial histogram for the CDTA algorithm.
Robotics 13 00066 g007
Figure 8. Calculating Cbest for the CDTA algorithm. (a) Heat map after calculating Cbest for the CDTA algorithm. Battery levels are indicated with a gradient from dark green to white descendingly. (b) Histogram after calculating Cbest for the CDTA algorithm.
Robotics 13 00066 g008
Figure 9. Final state of the CDTA algorithm. (a) Final heat map for the CDTA algorithm. Battery levels are indicated with a gradient from dark green to white descendingly. (b) Final histogram for the CDTA algorithm.
Robotics 13 00066 g009
Figure 10. The initial battery states for the CDTA-CL algorithm. (a) Initial heat map for the CDTA-CL algorithm. Battery levels are indicated with a gradient from dark green to white descendingly. (b) Initial histogram for the CDTA-CL algorithm.
Robotics 13 00066 g010
Figure 11. The battery states after the leader synopsis stage for the CDTA-CL algorithm. (a) Heat map after the leader synopsis stage for the CDTA-CL algorithm. Battery levels are indicated with a gradient from dark green to white descendingly. (b) Initial histogram after the leader synopsis stage for the CDTA-CL algorithm.
Robotics 13 00066 g011
Figure 12. The battery states after the leader congregation stage for the CDTA-CL algorithm. (a) Heat map after the leader congregation stage for the CDTA-CL algorithm. Battery levels are indicated with a gradient from dark green to white descendingly. (b) Histogram after the leader congregation stage for the CDTA-CL algorithm.
Robotics 13 00066 g012
Figure 13. Final state of the CDTA-CL algorithm. (a) Heat map after the result circulation stage for the CDTA-CL algorithm. Battery levels are indicated with a gradient from dark green to white descendingly. (b) Histogram after the result circulation stage for the CDTA-CL Algorithm.
Robotics 13 00066 g013
Figure 14. The initial battery states for the CDTA-DL algorithm. (a) Initial heat map for the CDTA-DL algorithm. Battery levels are indicated with a gradient from dark green to white descendingly. (b) Histogram after the initial result histogram for the CDTA-DL algorithm.
Robotics 13 00066 g014
Figure 15. The battery states after the leader synopsis stage for the CDTA-DL algorithm. (a) Heat map after the leader synopsis stage for the CDTA-DL algorithm. Battery levels are indicated with a gradient from dark green to white descendingly. (b) Histogram after the leader synopsis stage for the CDTA-DL algorithm.
Robotics 13 00066 g015
Figure 16. The battery states after the leader congregation stage for the CDTA-DL algorithm. (a) Heat map after the leader congregation stage for the CDTA-DL algorithm. Battery levels are indicated with a gradient from dark green to white descendingly. (b) Histogram after the leader congregation stage for the CDTA-DL algorithm.
Robotics 13 00066 g016
Figure 17. Final state of the CDTA-DL algorithm. (a) Heat map after the result circulation stage for the CDTA-DL algorithm. Battery levels are indicated with a gradient from dark green to white descendingly. (b) Heat map after the result circulation stage for the CDTA-DL algorithm.
Robotics 13 00066 g017
Figure 18. The initial battery states for the CDTA algorithm. Battery levels in the heat map are indicated with a gradient from dark green to white descendingly.
Robotics 13 00066 g018
Figure 19. Calculating Cbest for the CDTA algorithm in the 1st iteration. Battery levels in the heat map are indicated with a gradient from dark green to white descendingly.
Robotics 13 00066 g019
Figure 20. Final state of the CDTA algorithm after the 1st iteration. Battery levels in the heat map are indicated with a gradient from dark green to white descendingly.
Robotics 13 00066 g020
Figure 21. Calculating Cbest for the CDTA algorithm in the 5th iteration. Battery levels in the heat map are indicated with a gradient from dark green to white descendingly.
Robotics 13 00066 g021
Figure 22. Final state of the CDTA algorithm after the 5th iteration. Battery levels in the heat map are indicated with a gradient from dark green to white descendingly.
Robotics 13 00066 g022
Figure 23. Calculating Cbest for the CDTA algorithm in the 10th iteration. Battery levels in the heat map are indicated with a gradient from dark green to white descendingly.
Robotics 13 00066 g023
Figure 24. Final state of the CDTA algorithm after the 10th iteration. Battery levels in the heat map are indicated with a gradient from dark green to white descendingly.
Robotics 13 00066 g024
Figure 25. The initial battery states for the CDTA-CL algorithm. Battery levels in the heat map are indicated with a gradient from dark green to white descendingly.
Robotics 13 00066 g025
Figure 26. The battery states after the leader synopsis stage in the 1st iteration for the CDTA-CL algorithm. Battery levels in the heat map are indicated with a gradient from dark green to white descendingly.
Robotics 13 00066 g026
Figure 27. The battery states after the leader congregation stage in the 1st iteration for the CDTA-CL algorithm. Battery levels in the heat map are indicated with a gradient from dark green to white descendingly.
Robotics 13 00066 g027
Figure 28. Final state of the CDTA-CL algorithm after the 1st iteration. Battery levels in the heat map are indicated with a gradient from dark green to white descendingly.
Robotics 13 00066 g028
Figure 29. The battery states after the leader synopsis stage in the 5th iteration for the CDTA-CL algorithm. Battery levels in the heat map are indicated with a gradient from dark green to white descendingly.
Robotics 13 00066 g029
Figure 30. The battery states after the leader congregation stage in the 5th iteration for the CDTA-CL algorithm. Battery levels in the heat map are indicated with a gradient from dark green to white descendingly.
Robotics 13 00066 g030
Figure 31. Final state of the CDTA-CL algorithm after the 5th iteration. Battery levels in the heat map are indicated with a gradient from dark green to white descendingly.
Robotics 13 00066 g031
Figure 32. The battery states after the leader synopsis stage in the 10th iteration for the CDTA-CL algorithm. Battery levels in the heat map are indicated with a gradient from dark green to white descendingly.
Robotics 13 00066 g032
Figure 33. The battery states after the leader congregation stage in the 10th iteration for the CDTA-CL algorithm. Battery levels in the heat map are indicated with a gradient from dark green to white descendingly.
Robotics 13 00066 g033
Figure 34. Final state of the CDTA-CL algorithm after the 10th iteration. Battery levels in the heat map are indicated with a gradient from dark green to white descendingly.
Robotics 13 00066 g034
Figure 35. The initial battery states for the CDTA-DL algorithm. Battery levels in the heat map are indicated with a gradient from dark green to white descendingly.
Robotics 13 00066 g035
Figure 36. The battery states after the leader synopsis stage in the 1st iteration for the CDTA-DL algorithm. Battery levels in the heat map are indicated with a gradient from dark green to white descendingly.
Robotics 13 00066 g036
Figure 37. The battery states after the leader congregation stage in the 1st iteration of the CDTA-DL algorithm. Battery levels in the heat map are indicated with a gradient from dark green to white descendingly.
Robotics 13 00066 g037
Figure 38. Final state of the CDTA-DL algorithm after the 1st iteration. Battery levels in the heat map are indicated with a gradient from dark green to white descendingly.
Robotics 13 00066 g038
Figure 39. The battery states after the leader synopsis stage in the 5th iteration of the CDTA-DL algorithm. Battery levels in the heat map are indicated with a gradient from dark green to white descendingly.
Robotics 13 00066 g039
Figure 40. The battery states after the leader congregation stage in the 5th iteration of the CDTA-DL algorithm. Battery levels in the heat map are indicated with a gradient from dark green to white descendingly.
Robotics 13 00066 g040
Figure 41. Final state of the CDTA-DL algorithm after the 5th iteration. Battery levels in the heat map are indicated with a gradient from dark green to white descendingly.
Robotics 13 00066 g041
Figure 42. The battery states after the leader synopsis stage in the 10th iteration of the CDTA-DL algorithm. Battery levels in the heat map are indicated with a gradient from dark green to white descendingly.
Robotics 13 00066 g042
Figure 43. The battery states after the leader congregation Stage in the 10th iteration of the CDTA-DL algorithm. Battery levels in the heat map are indicated with a gradient from dark green to white descendingly.
Robotics 13 00066 g043
Figure 44. Final state of the CDTA-DL algorithm after the 10th iteration. Battery levels in the heat map are indicated with a gradient from dark green to white descendingly.
Robotics 13 00066 g044
Figure 45. Yanshee robots used in the experiments.
Robotics 13 00066 g045
Figure 46. Bar chart for execution times for different swarm configurations in the CDTA-CL variation.
Robotics 13 00066 g046
Figure 47. Bar chart for execution times for different swarm configurations in the CDTA-DL variation.
Robotics 13 00066 g047
Figure 48. Optimal number of leaders for different swarm sizes following the CDTA-DL variation.
Robotics 13 00066 g048
Table 1. Execution times for different swarm configurations of Yanshee robots.
AlgorithmSwarm ConfigurationTimeUnit
Original CDTA1 leader, 4 subordinates2.31seconds
Original CDTA2 leaders, 3 subordinates2.08seconds
CDTA-CL Variation1 leader, 4 subordinates1.076seconds
CDTA-CL Variation2 leaders, 3 subordinates0.84seconds
CDTA-DL Variation1 leader, 4 subordinates0.577seconds
CDTA-DL Variation2 leaders, 3 subordinates0.468seconds
Table 2. Execution times for different swarm configurations in the CDTA-CL variation.
32 Robots64 Robots128 Robots256 Robots512 Robots1024 Robots2048 Robots4096 RobotsTime  
1 leader0.1260.2540.511.0222.0464.0948.1916.382seconds
2 leaders0.0640.1280.2560.5121.0242.0484.0968.192seconds
4 leaders0.0360.0680.1320.260.5161.0282.0524.1seconds
8 leaders0.0280.0440.0760.140.2680.5241.0362.06seconds
16 leaders0.0360.0440.060.0920.1560.2840.541.052seconds
32 leaders 0.0680.0760.0920.1240.1880.3160.572seconds
64 leaders 0.1320.140.1560.1880.2520.38seconds
128 leaders 0.260.2680.2840.3160.38seconds
256 leaders 0.5160.5240.540.572seconds
512 leaders 1.0281.0361.052seconds
1024 leaders 2.0522.06seconds
2048 leaders 4.1seconds
Table 3. Execution times for different swarm configurations in the CDTA-DL variation.
32 Robots64 Robots128 Robots256 Robots512 Robots1024 Robots2048 Robots4096 RobotsTime  
1 leader0.0660.130.2580.5141.0262.054.0988.194seconds
2 leaders0.0360.0680.1320.260.5161.0282.0524.1seconds
4 leaders0.0240.040.0720.1360.2640.521.0322.056seconds
8 leaders0.0240.0320.0480.080.1440.2720.5281.04seconds
16 leaders0.0360.040.0480.0640.0960.160.2880.544seconds
32 leaders 0.0680.0720.080.0960.1280.1920.32seconds
64 leaders 0.1320.1360.1440.160.1920.256seconds
128 leaders 0.260.2640.2720.2880.32seconds
256 leaders 0.5160.520.5280.544seconds
512 leaders 1.0281.0321.04seconds
1024 leaders 2.0522.056seconds
2048 leaders 4.1seconds
Table 4. A comparison between the different tested algorithms regarding execution time and battery consumption in Experiment 1.
Original
CDTA
Proposed
CDTA-CL
Proposed
CDTA-DL
Unit
Execution Time0.3330.1520.08Seconds
Average Initial Battery Level82.36%84%85.64%Battery Level
Average Final Battery Level80.25%81.56%83.42%Battery Level
Minimum Power Lost
by a Single Robot
During Operation
2%Battery Level
Maximum Power Lost
by a Single Robot
During Operation
3%12%4%Battery Level
Average Power Loss
by Any Robot
During Operation
2.1%2.4%2.2%Battery Level
Standard Deviation of
Battery Power Loss
0.32%1.73%0.64%Battery Level
Variance of Battery
Power Loss
0.130.41(Battery Level)2
Table 5. Utilizing the power of Pyswaro to test the algorithms’ execution times against large swarm populations.
Swarm PopulationOriginal
CDTA
Proposed
CDTA-CL
Proposed
CDTA-DL
Unit
36 robots |4 leaders0.3330.1520.08Seconds
100 robots|4 leaders0.9090.4080.208Seconds
10,000 robots|4 leaders904020Seconds
1,000,000 robots|4 leaders2.51.10.55Hours
100,000,000 robots|4 leaders10.44.62.3Days
Table 6. A comparison between the different tested algorithms regarding execution time and battery consumption in Experiment 2.
Original
CDTA
Proposed
CDTA-CL
Proposed
CDTA-DL
Unit
Execution Time41.8918.7919.897Seconds
Average Initial Battery Level79.84%80.38%80.59%Battery Level
Average Final Battery Level52.15%71.05%51.6%Battery Level
Minimum Power Lost
by a Single Robot
During Operation
24.75%5.2%26.32%Battery Level
Maximum Power Lost
by a Single Robot
During Operation
58.65%98.81%58.69%Battery Level
Average Power Loss
by Any Robot
During Operation
27.69%9.33%28.98%Battery Level
Standard Deviation of
Battery Power Loss
3.15%8.92%3.02%Battery Level
Variance of Battery
Power Loss
9.9479.629.15(Battery Level)2
Disclaimer/Publisher’s Note: The statements, opinions and data contained in all publications are solely those of the individual author(s) and contributor(s) and not of MDPI and/or the editor(s). MDPI and/or the editor(s) disclaim responsibility for any injury to people or property resulting from any ideas, methods, instructions or products referred to in the content.