Figure 1.
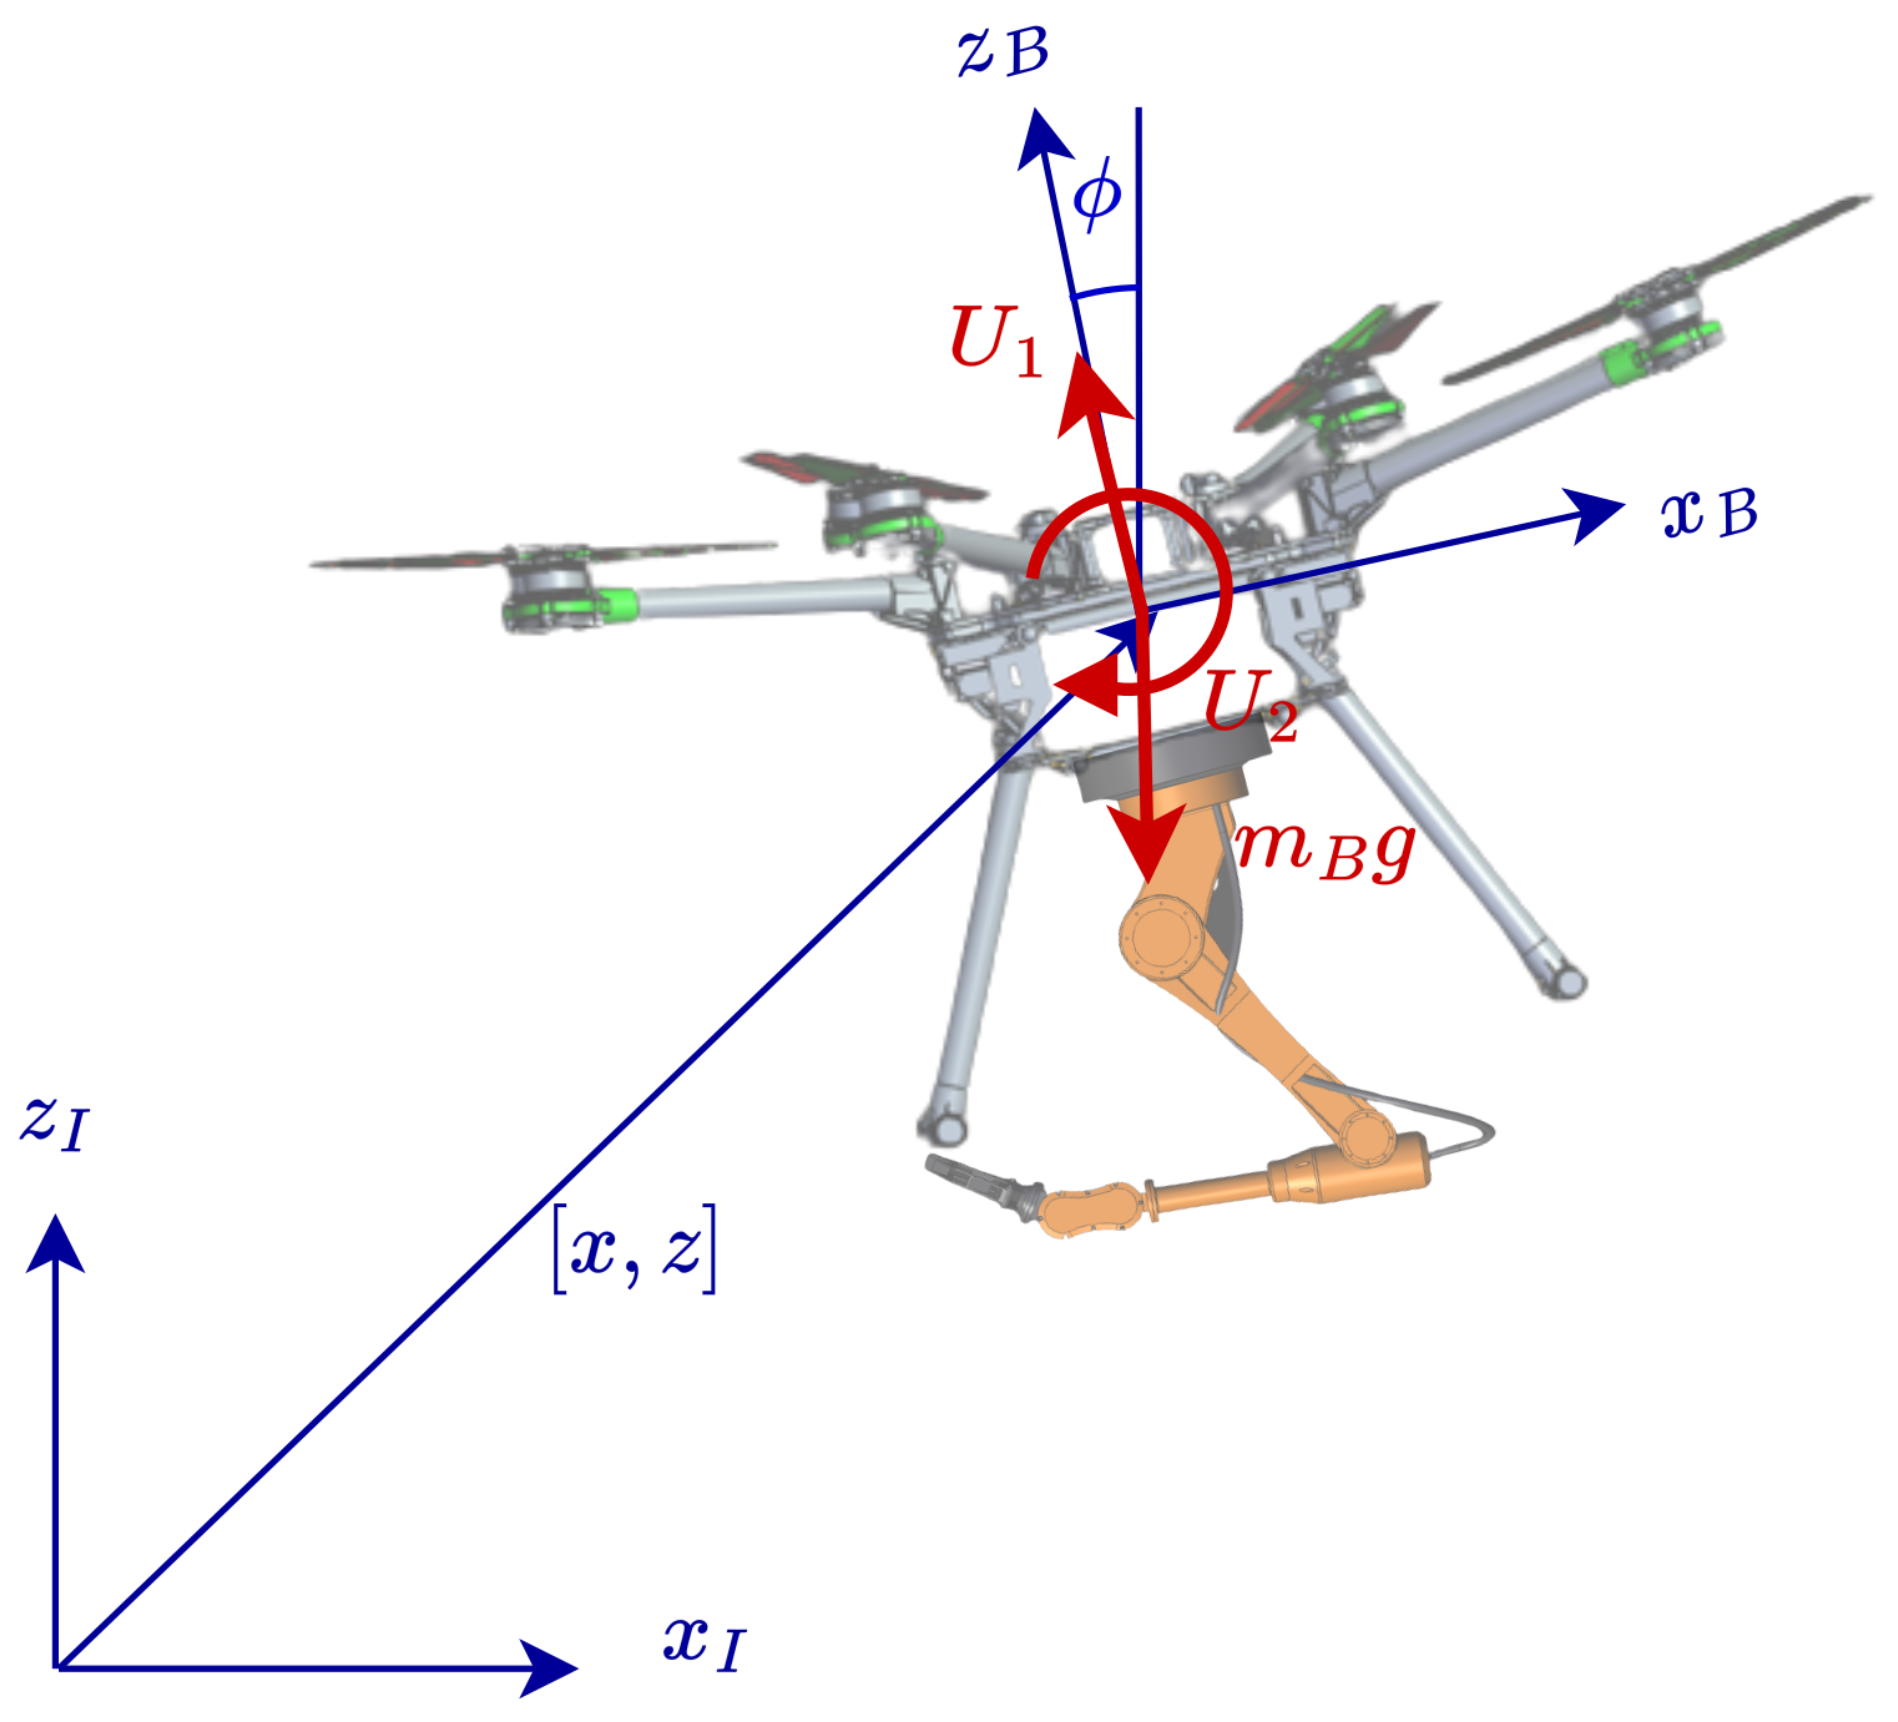
Reference frames for our UAV model (DJI S1000). The inertial frame is denoted with I and UAV base-fixed frame with B.
Figure 1.
Reference frames for our UAV model (DJI S1000). The inertial frame is denoted with I and UAV base-fixed frame with B.
Figure 2.
Coordinates, reference frames and control forces applied on the UAV. Blue shows the reference frames and coordinate parameters x, z and , while red shows the control inputs and gravity force.
Figure 2.
Coordinates, reference frames and control forces applied on the UAV. Blue shows the reference frames and coordinate parameters x, z and , while red shows the control inputs and gravity force.
Figure 3.
Mass distribution and CoG of the manipulator links.
Figure 3.
Mass distribution and CoG of the manipulator links.
Figure 4.
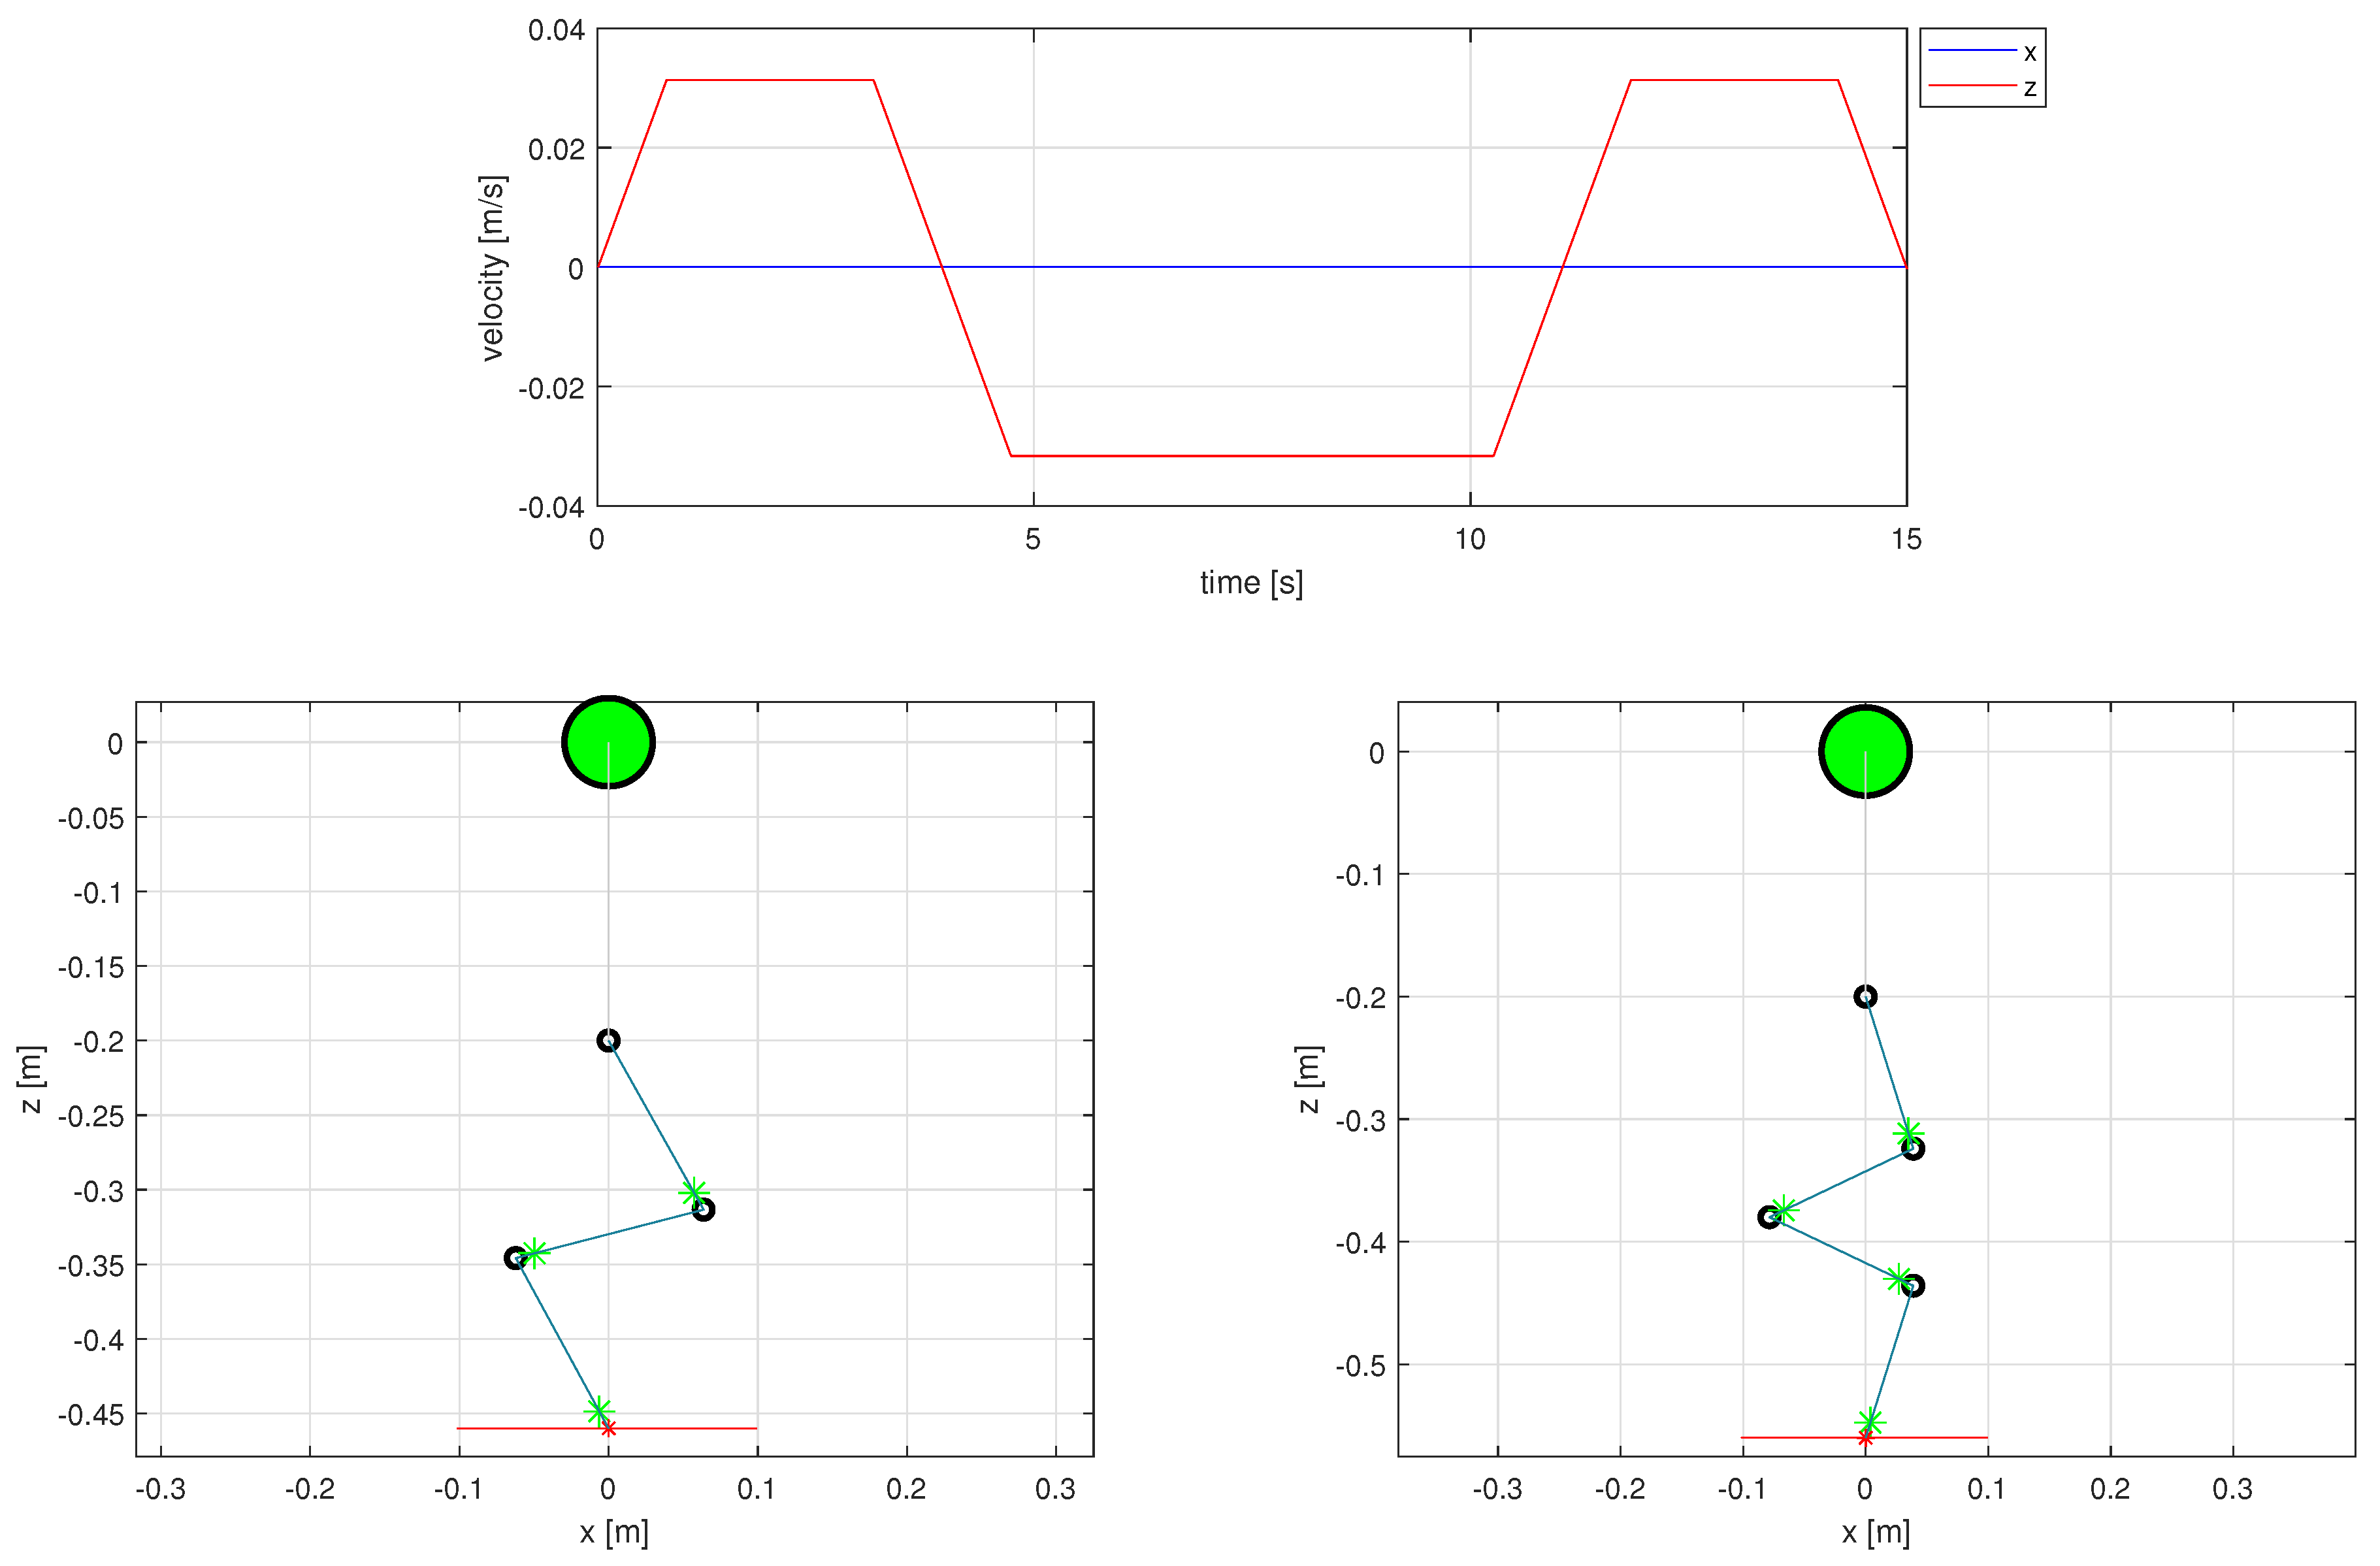
Trajectory 1 (Horizontal line) desired velocity profile for the end-effector (top). The initial configurations for the 3 DOF (left), and 4 DOF (right) manipulators are below, showing the UAV CoG (large green marker), joints (black circles), links (blue lines), link CoGs (green markers), end-effector initial position (red marker), and desired trajectory (red line).
Figure 5.
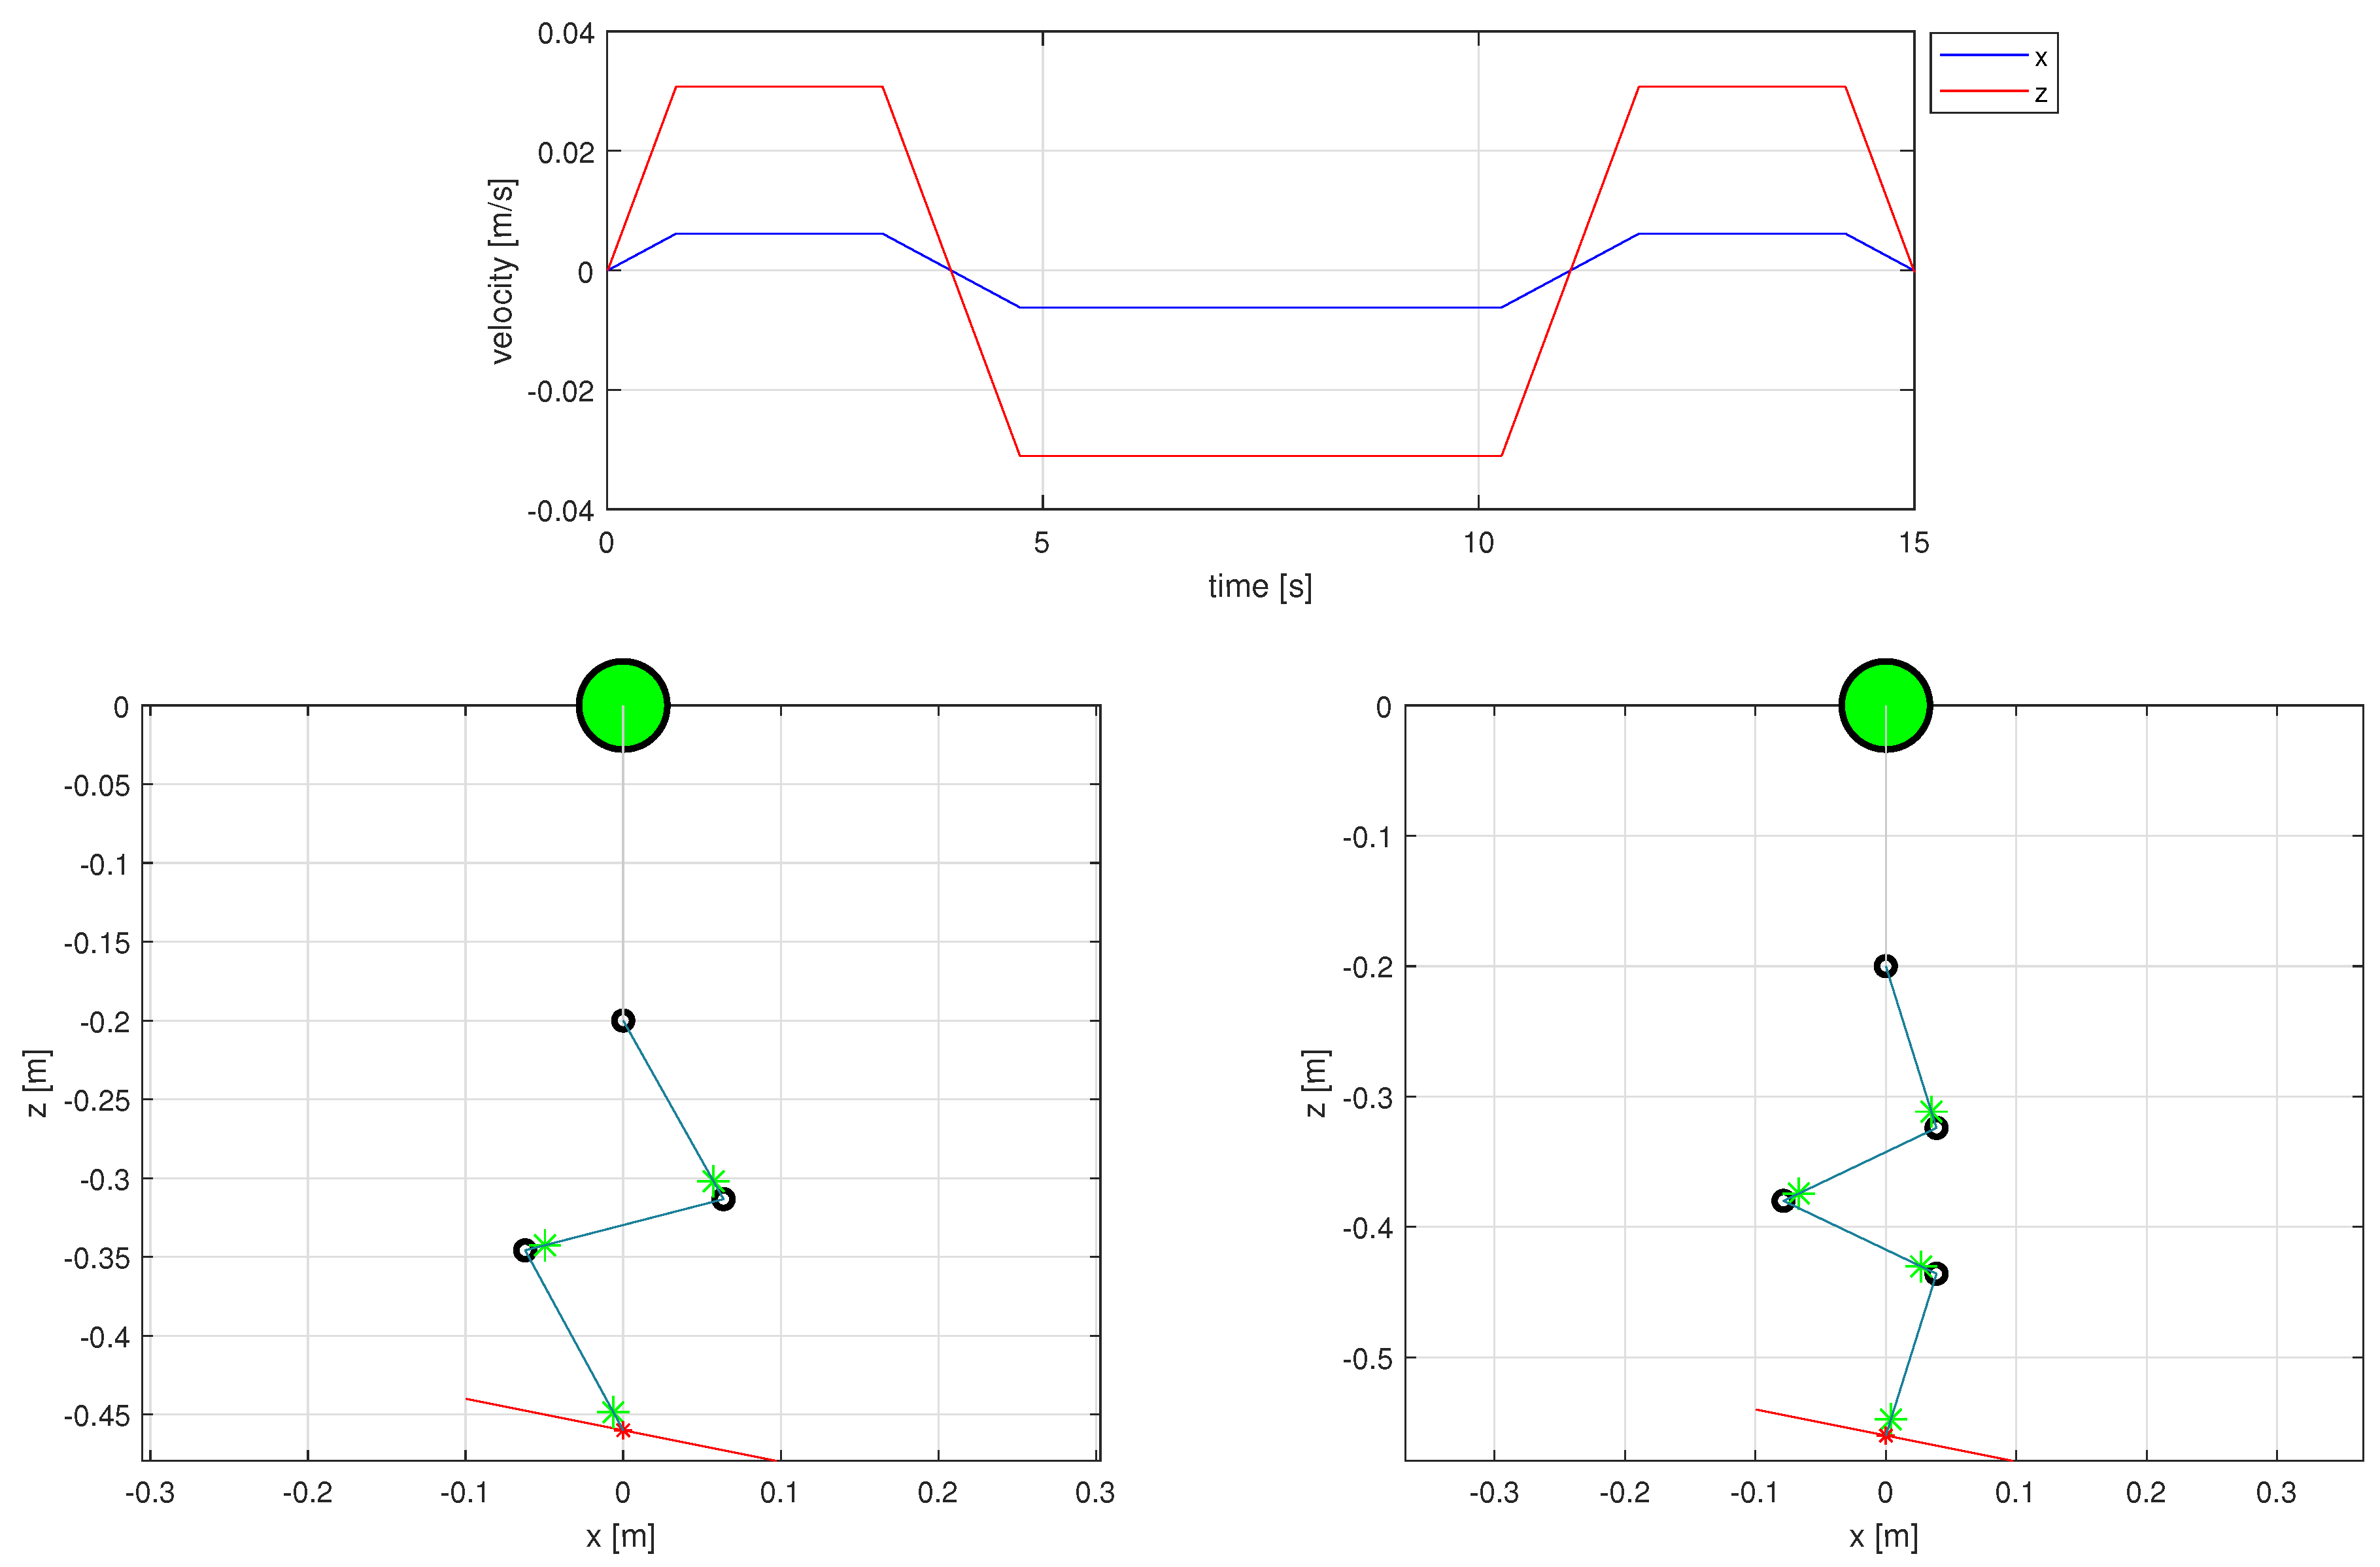
Trajectory 2 (Tilted line) desired velocity profile for the end-effector (top). The initial configurations for the 3 DOF (left), and 4 DOF (right) manipulators are below, showing the UAV CoG (large green marker), joints (black circles), links (blue lines), link CoGs (green markers), end-effector initial position (red marker), and desired trajectory (red line).
Figure 6.
Trajectory 3 (Circle) desired velocity profile for the end-effector (top). The initial configurations for the 3 DOF (left), and 4 DOF (right) manipulators are below, showing the UAV CoG (large green marker), joints (black circles), links (blue lines), link CoGs (green markers), end-effector initial position (red marker), and desired trajectory (red line).
Figure 7.
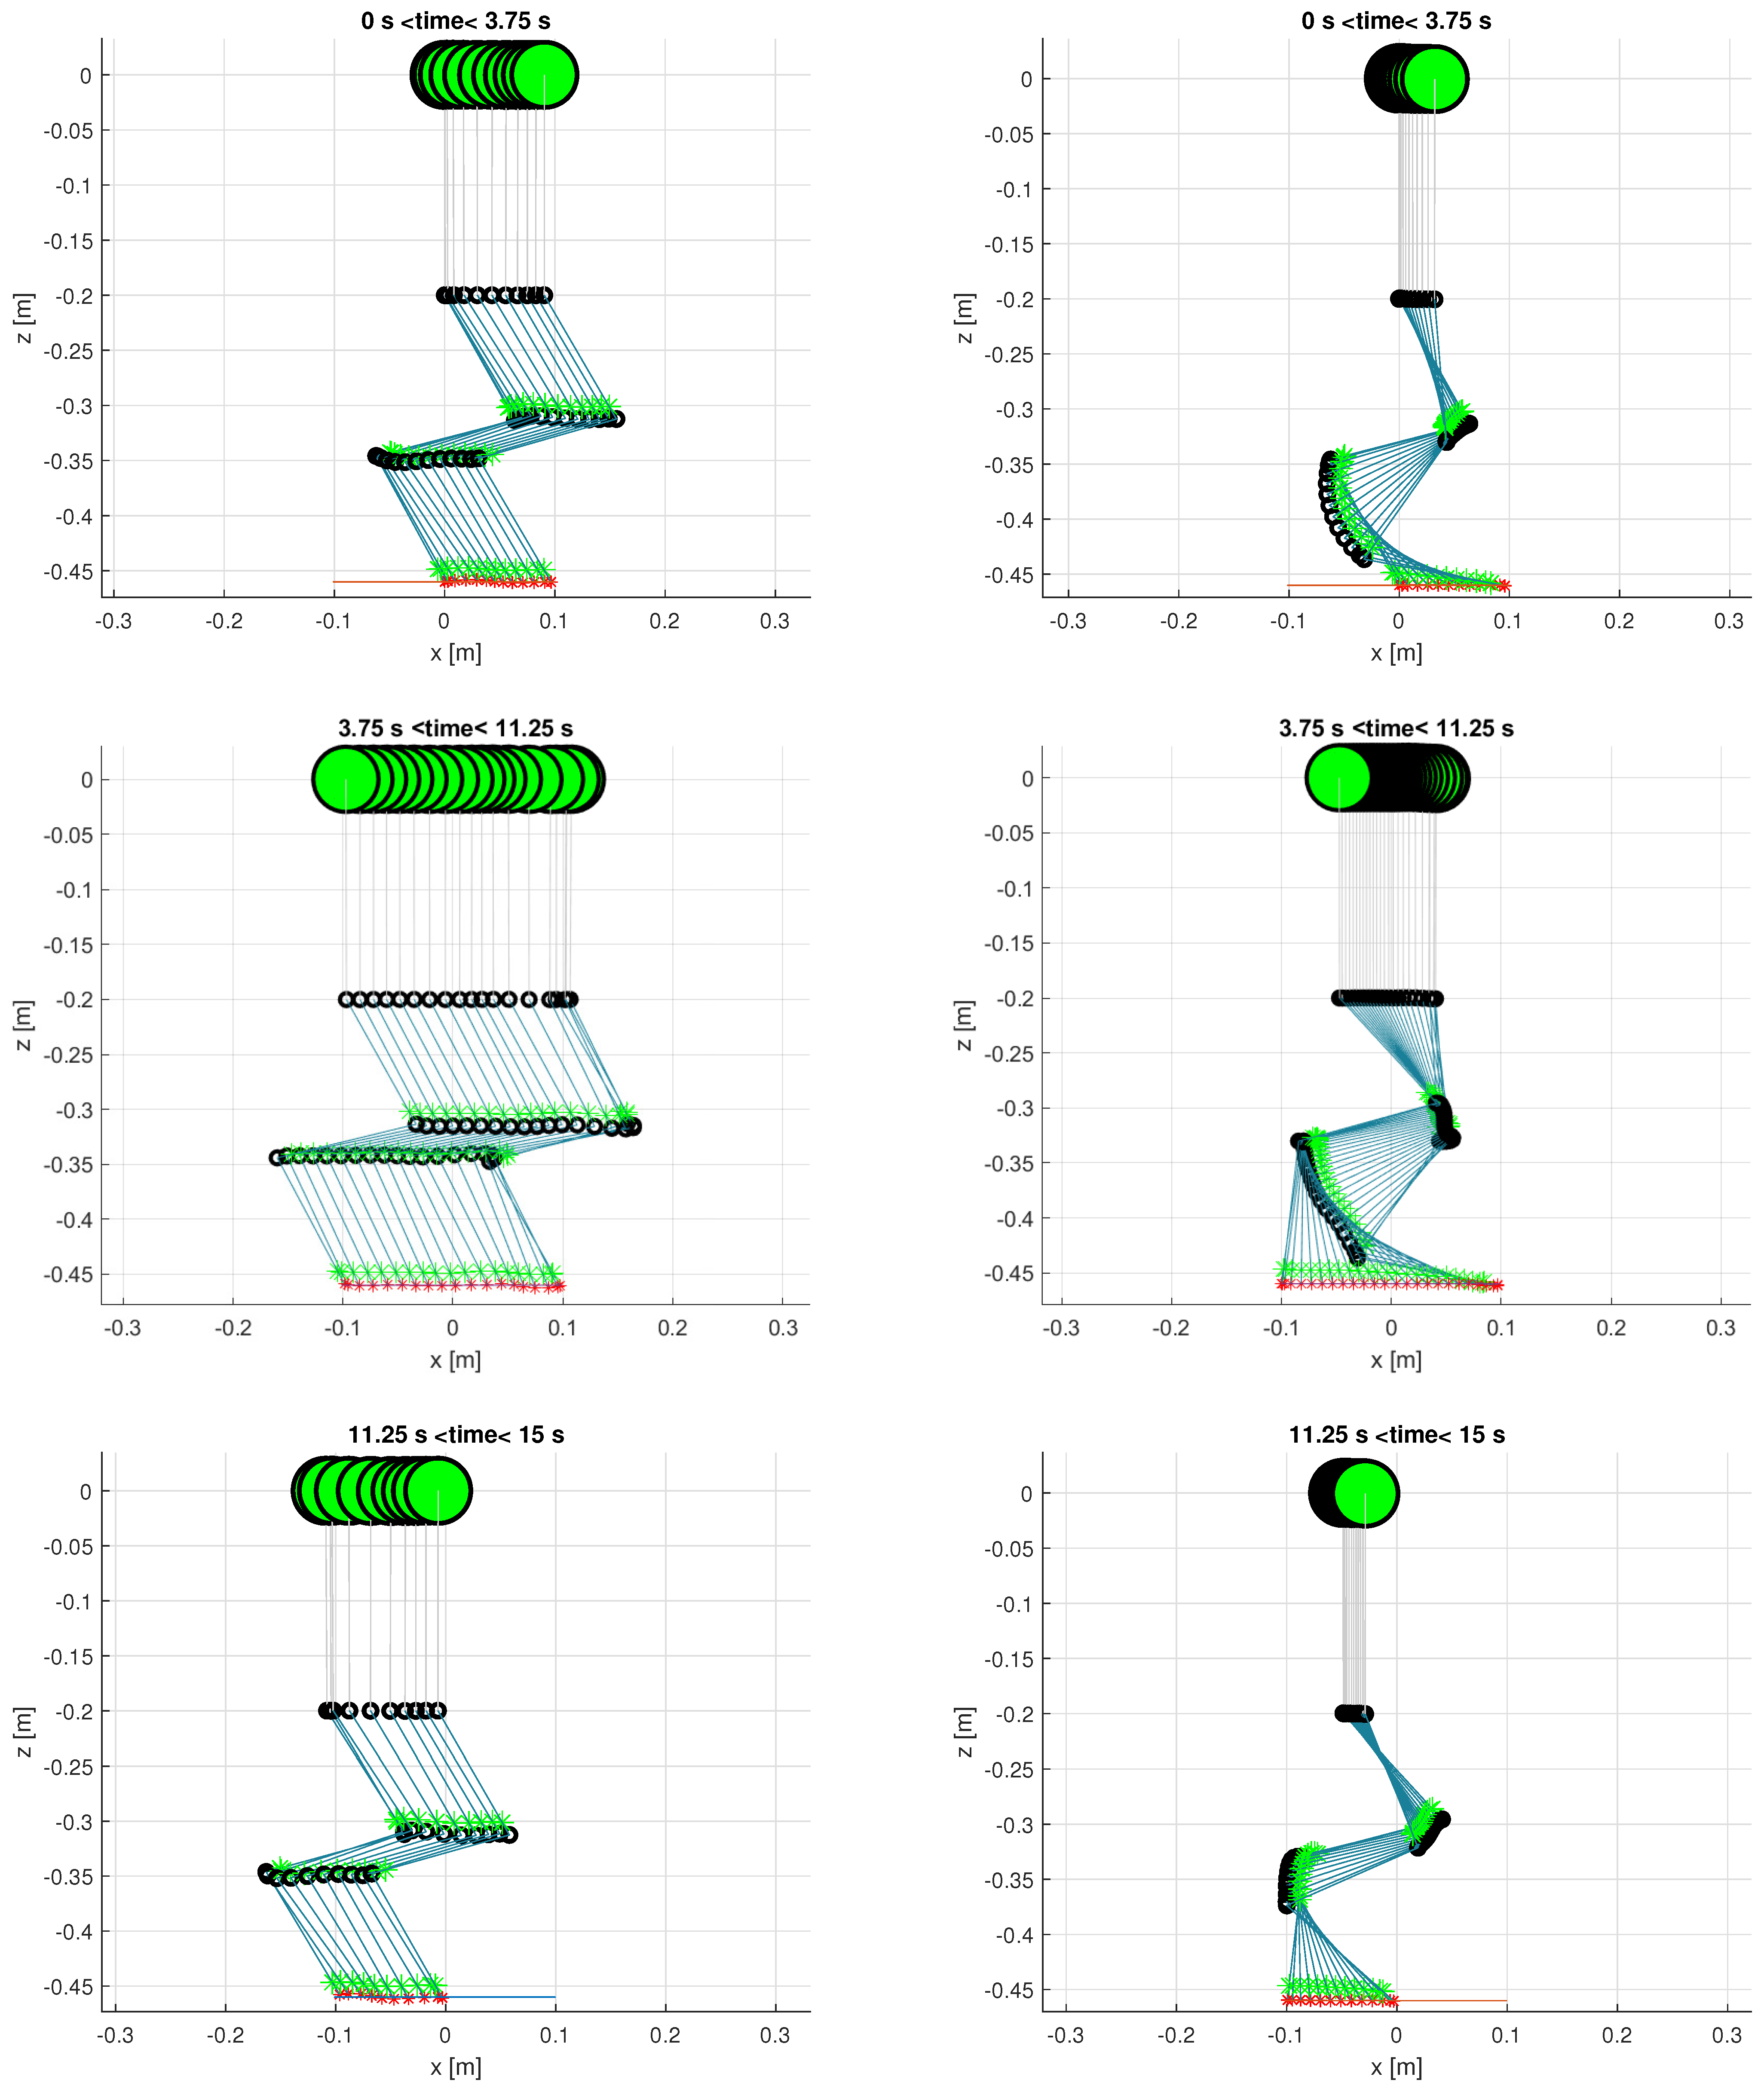
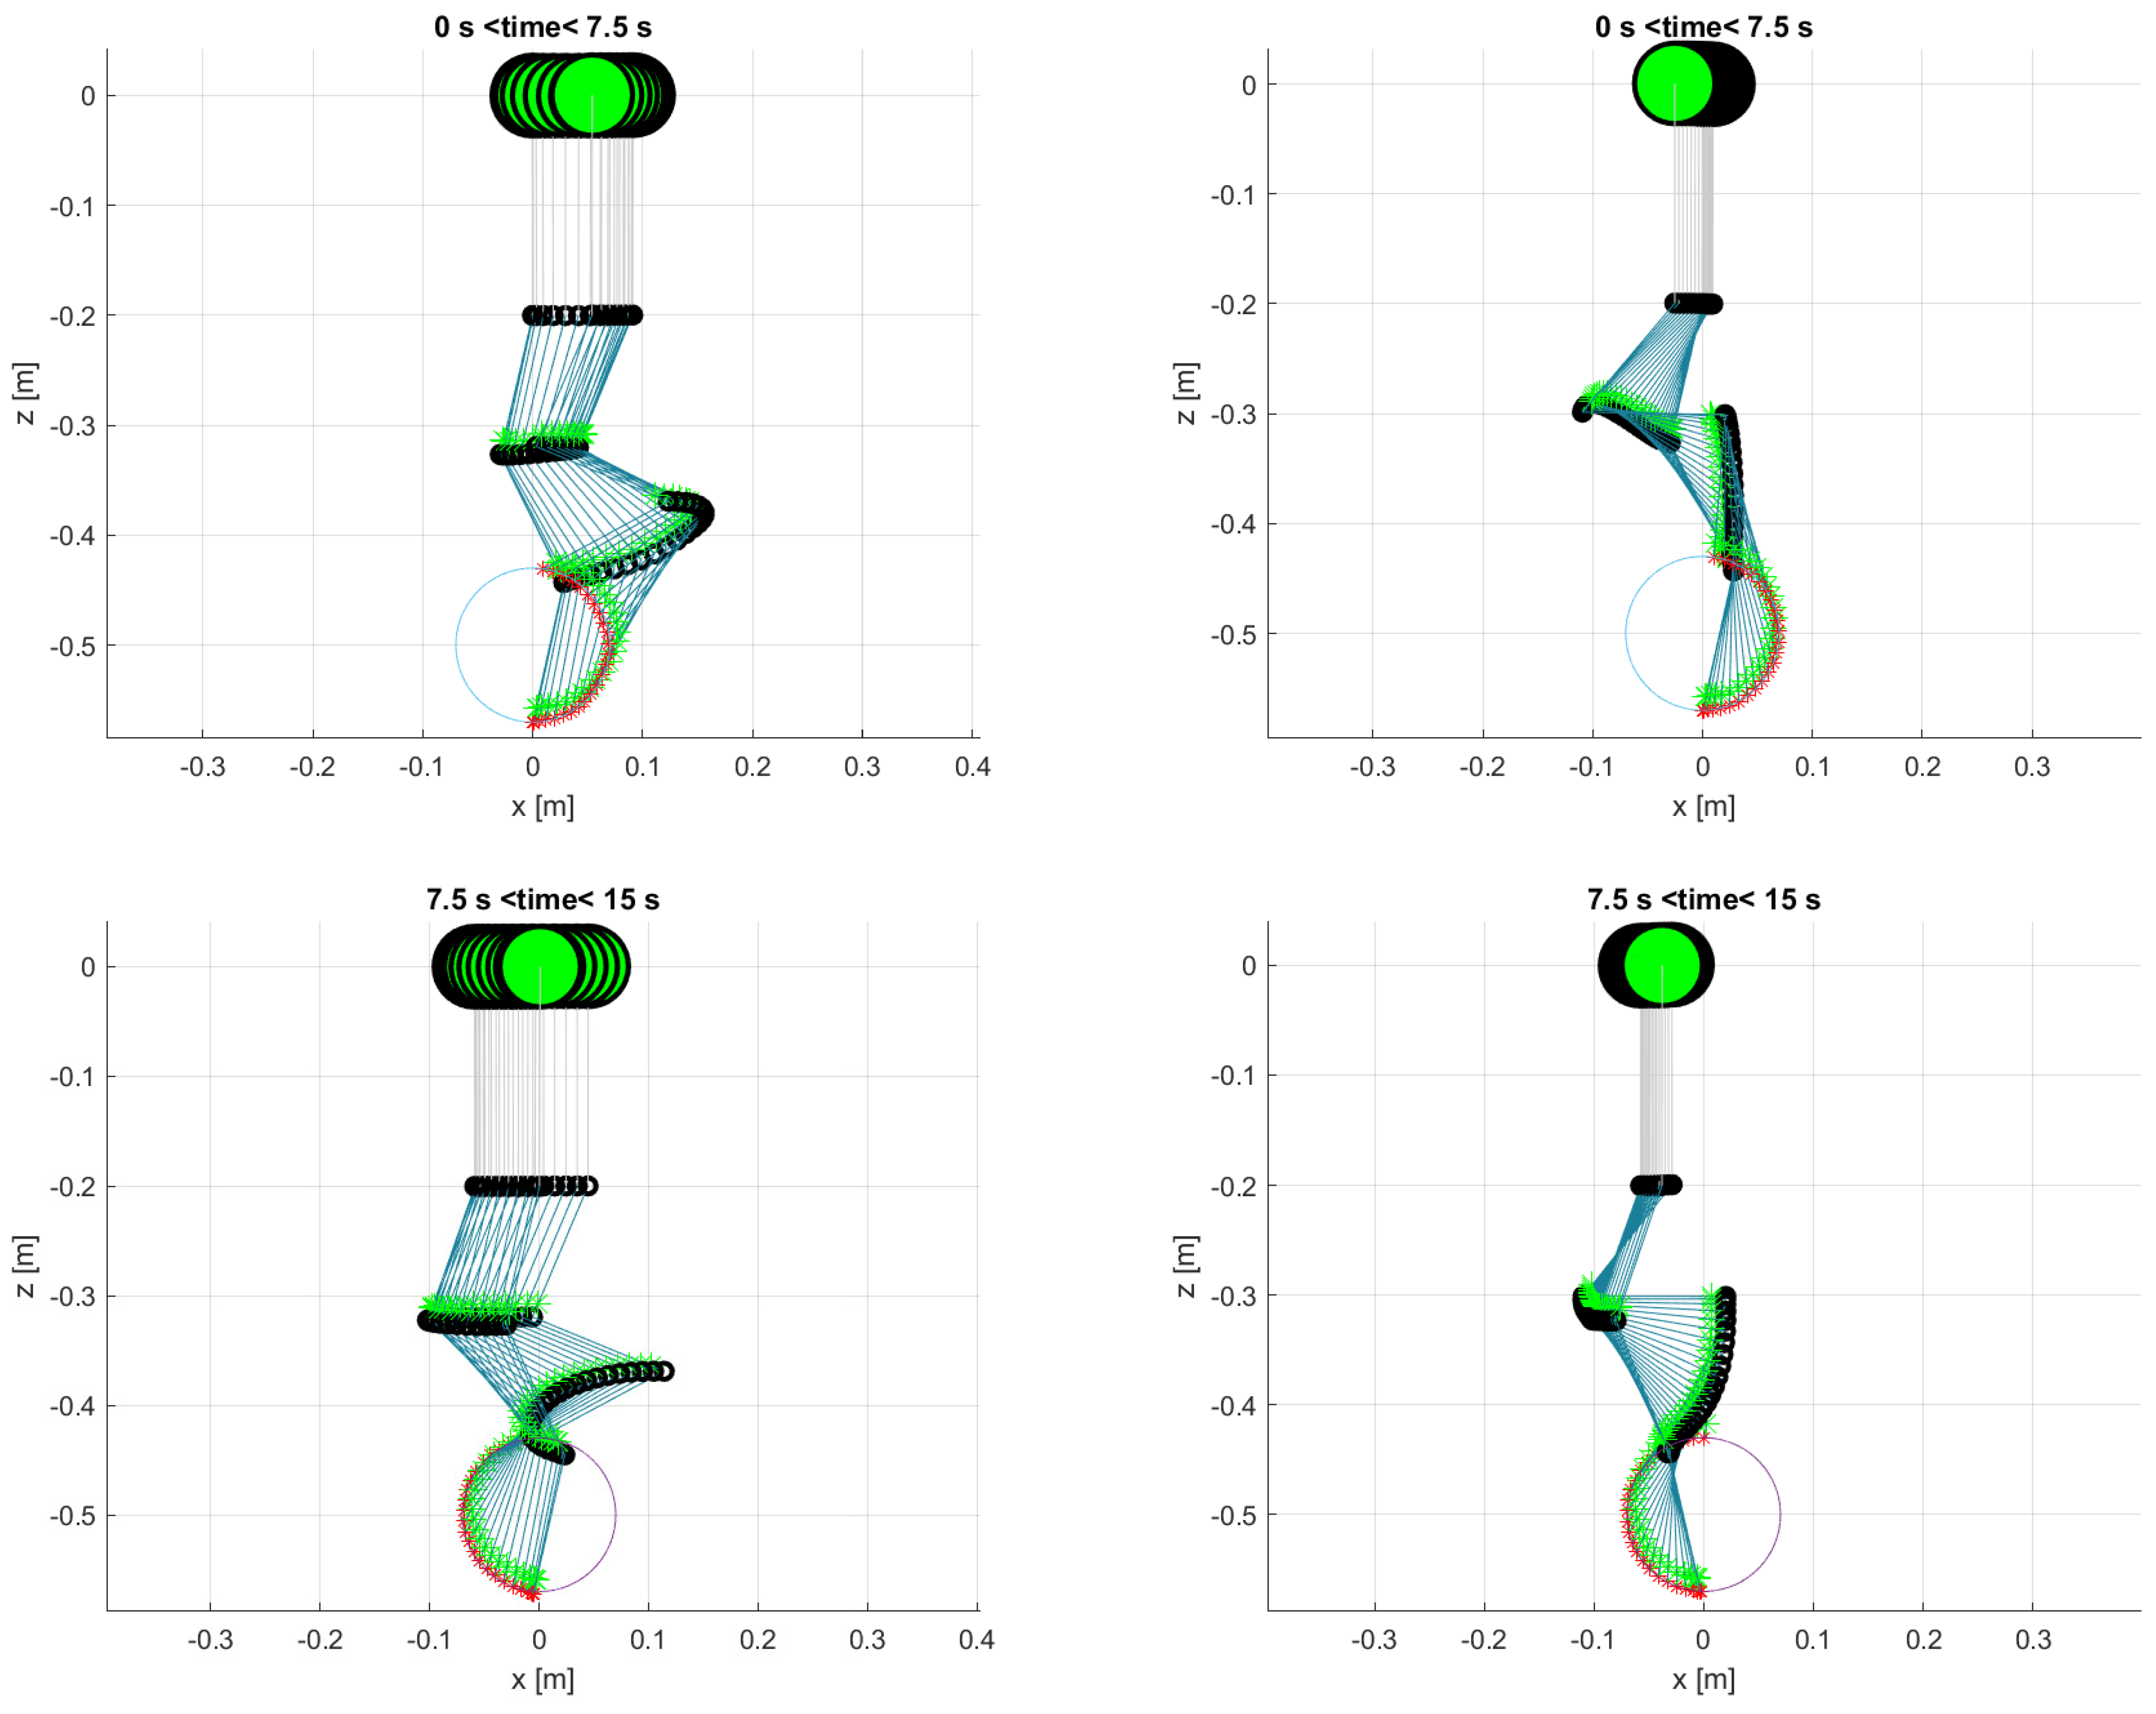
Stroboscopic view of the 3 stages of the horizontal line trajectory for the 3 DOF manipulator with the minimum joint velocities solution (left) and with the gradient projection method (right). The UAV CoG is the large green marker, joints are the black circles, links are the blue lines, link CoGs are green markers, and end-effector positions tracked are red markers.
Figure 8.
Manipulator joint motions (top) and UAV motions and torque disturbance (middle and bottom) for the 3 DOF UAM tracking the horizontal line trajectory. Results obtained with the minimum joint velocities solution are on the left and results obtained with the gradient projection method are on the right.
Figure 9.
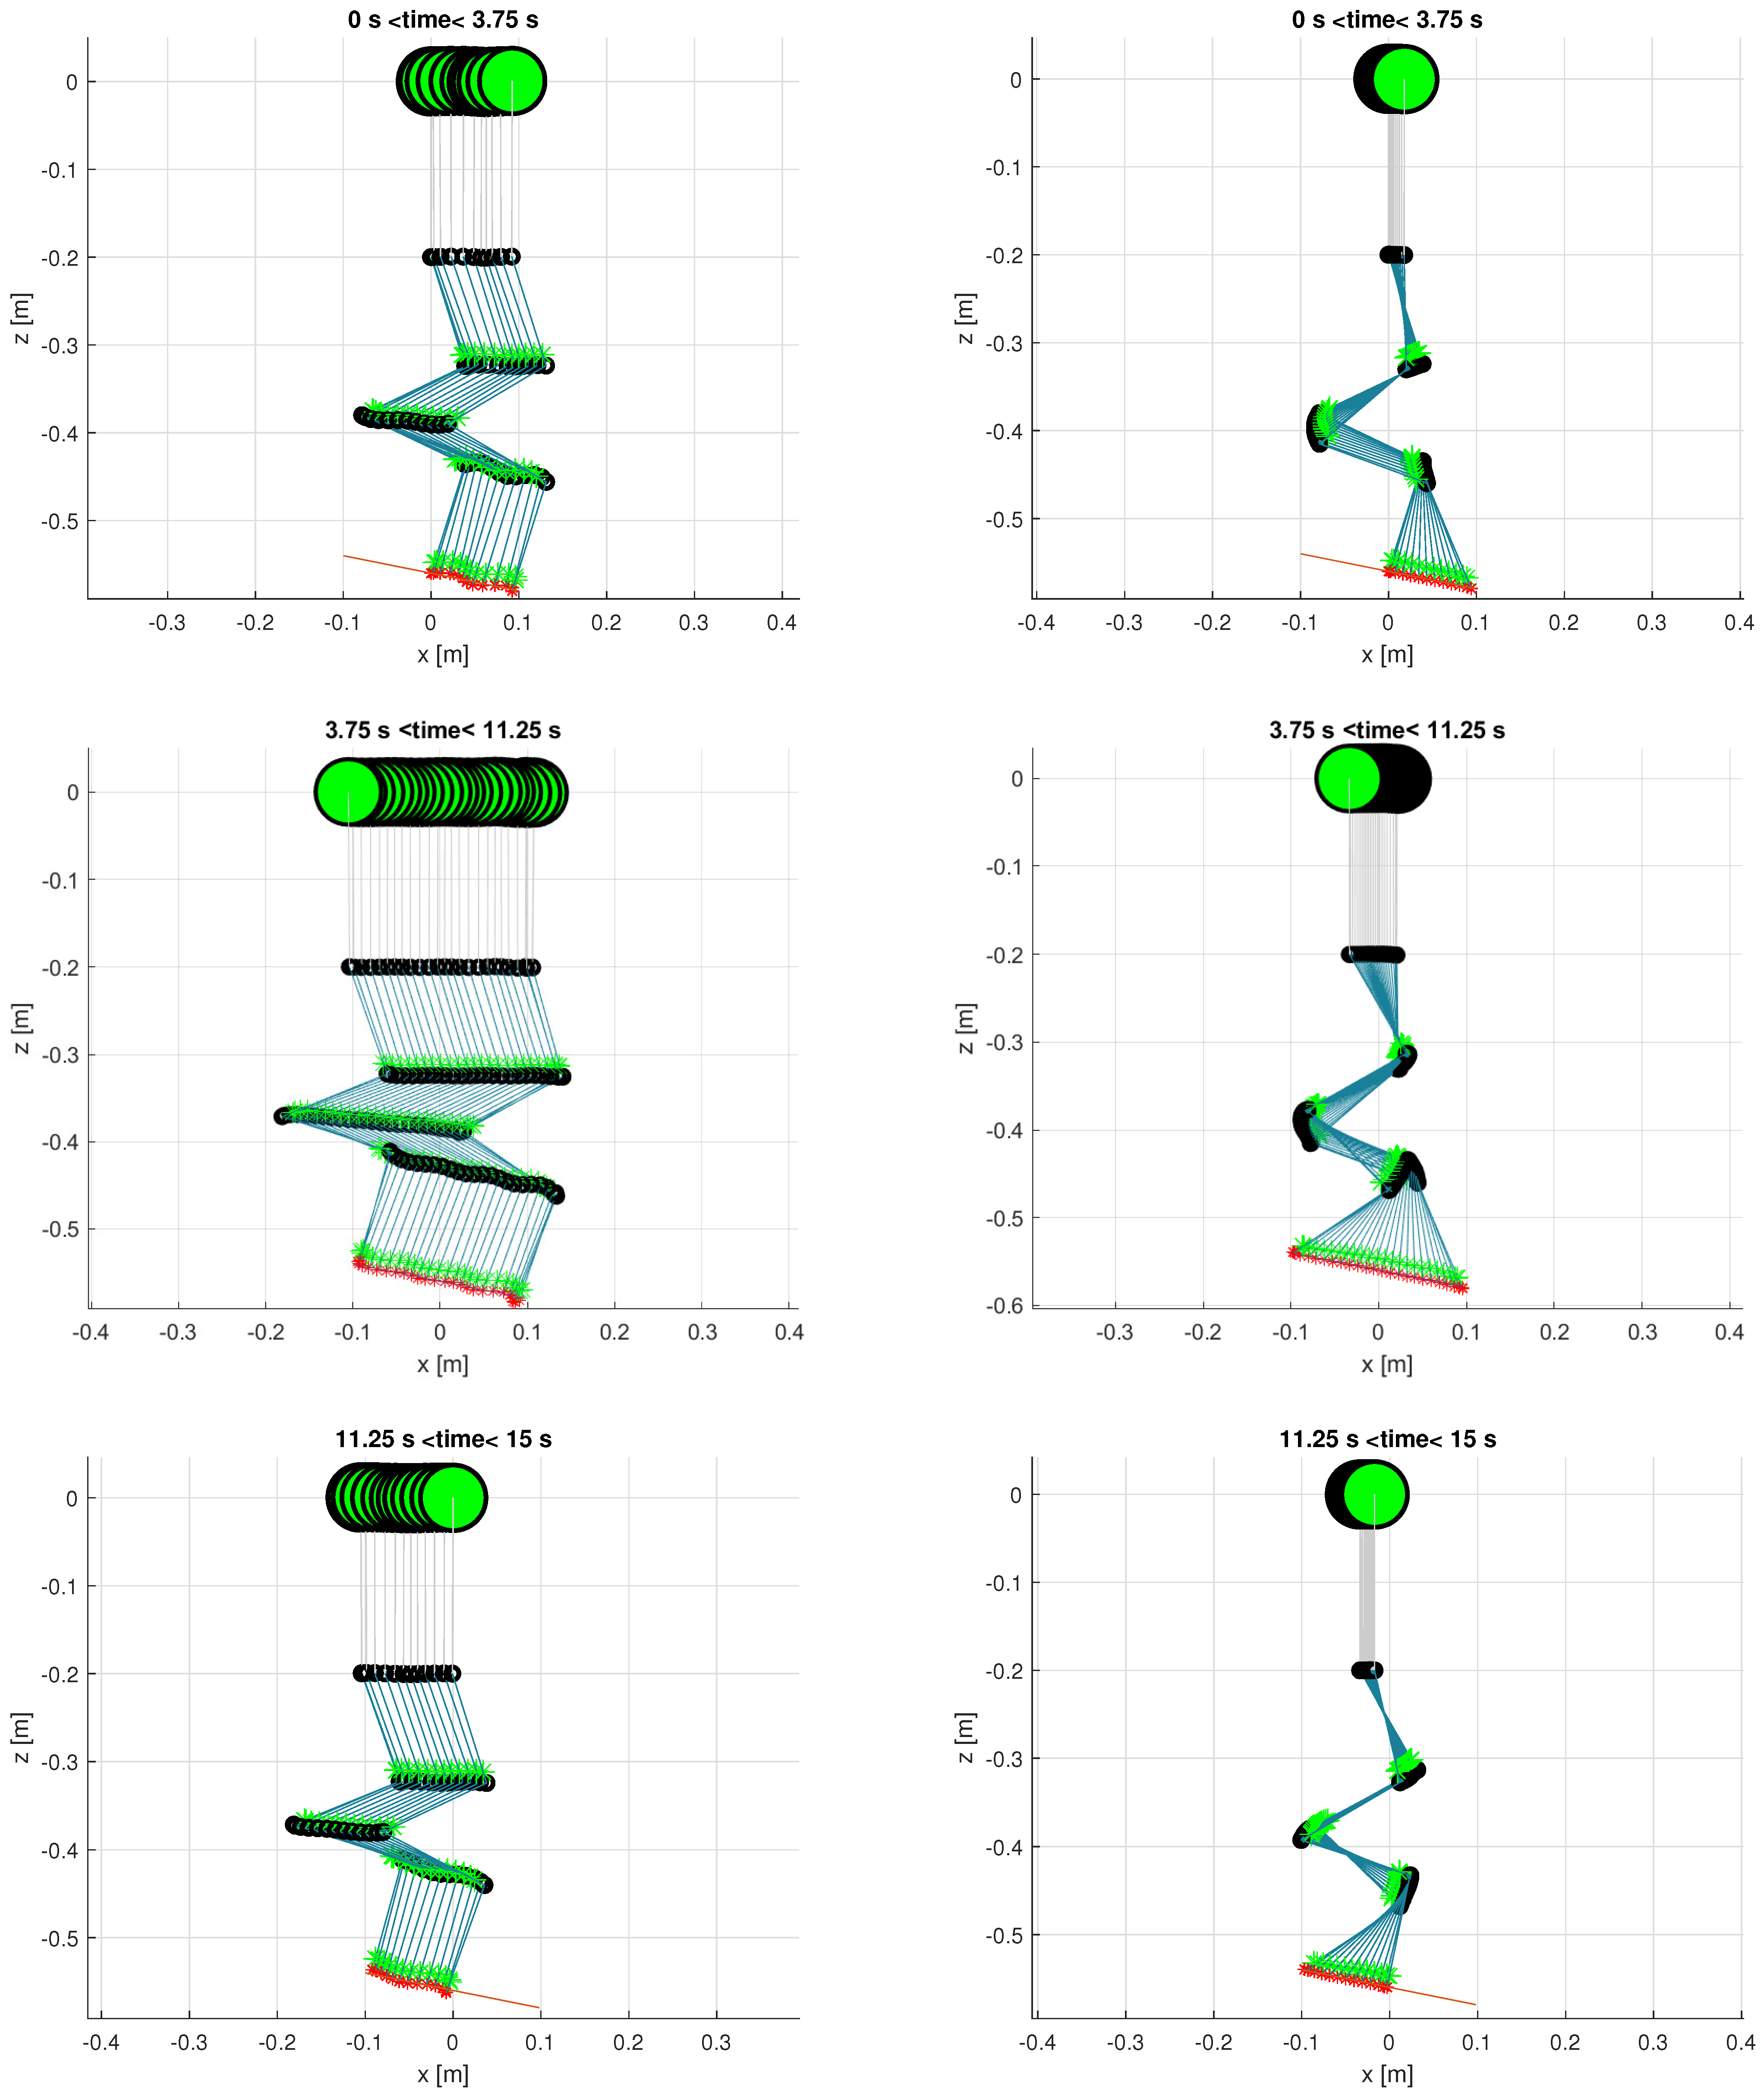
Stroboscopic view of the 3 stages of the horizontal line trajectory for the 4 DOF manipulator with the minimum joint velocities solution (left) and with the gradient projection method (right). The UAV CoG is the large green marker, joints are the black circles, links are the blue lines, link CoGs are green markers, and end-effector positions tracked are red markers.
Figure 10.
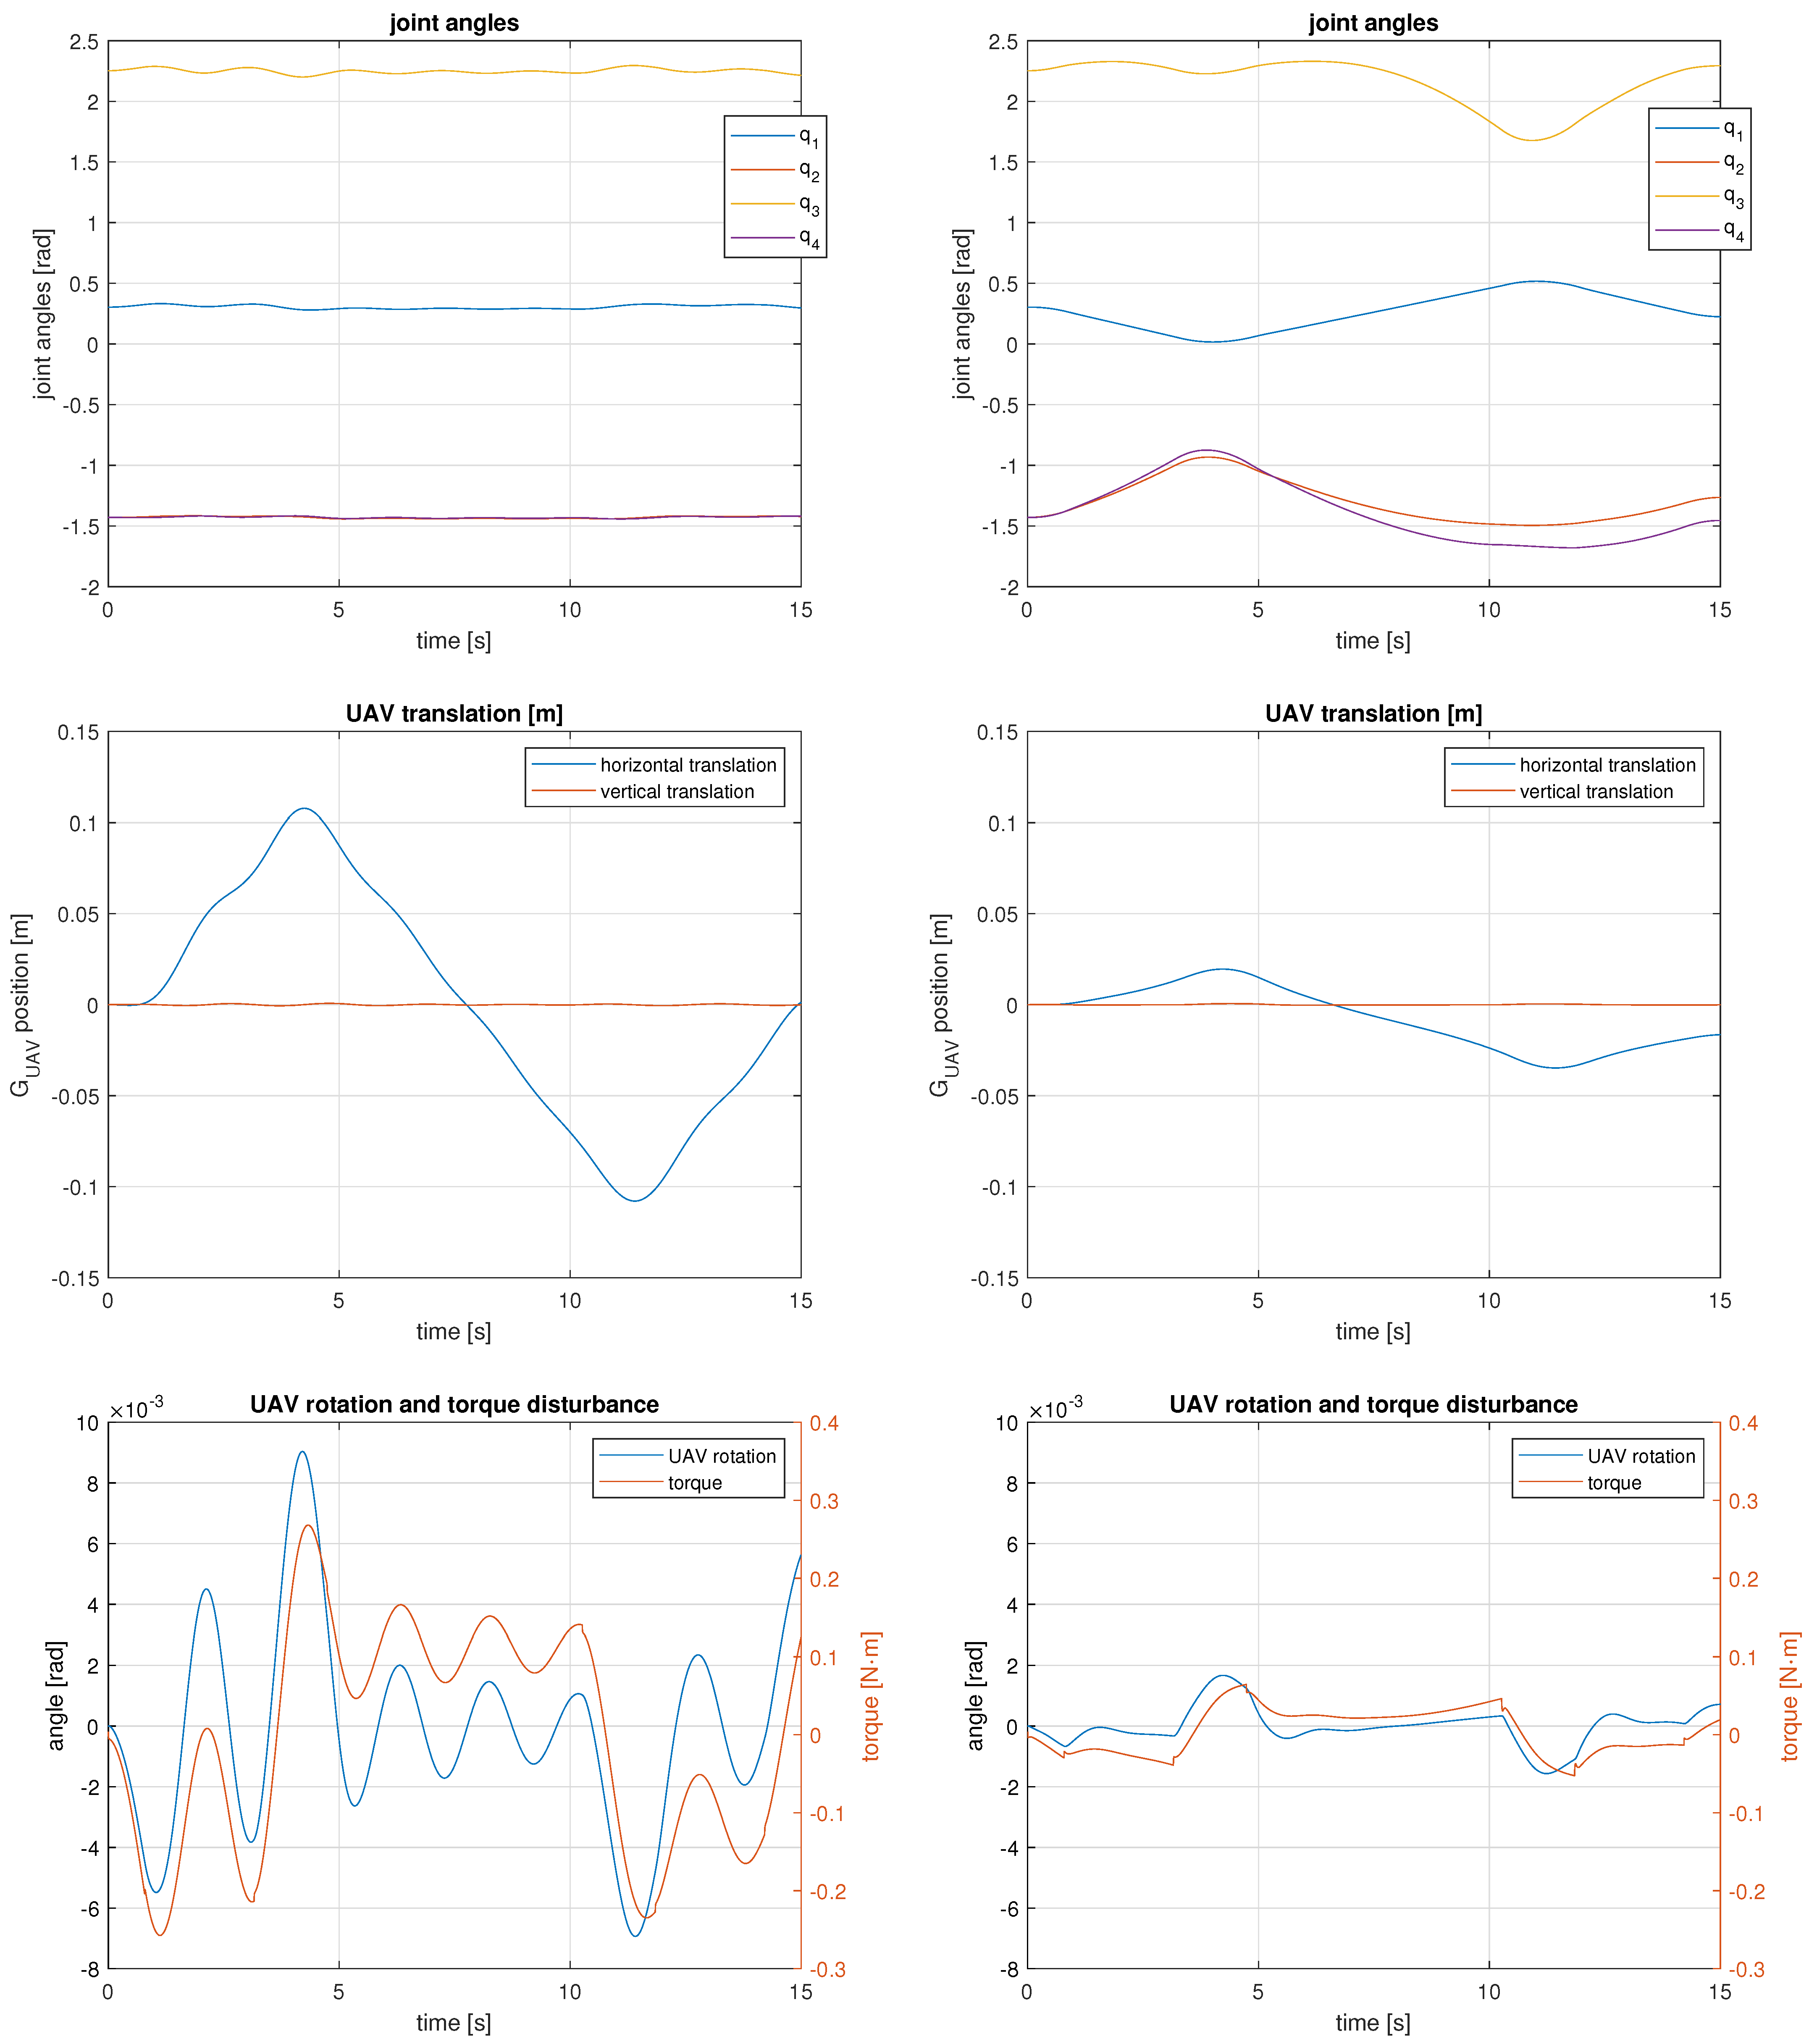
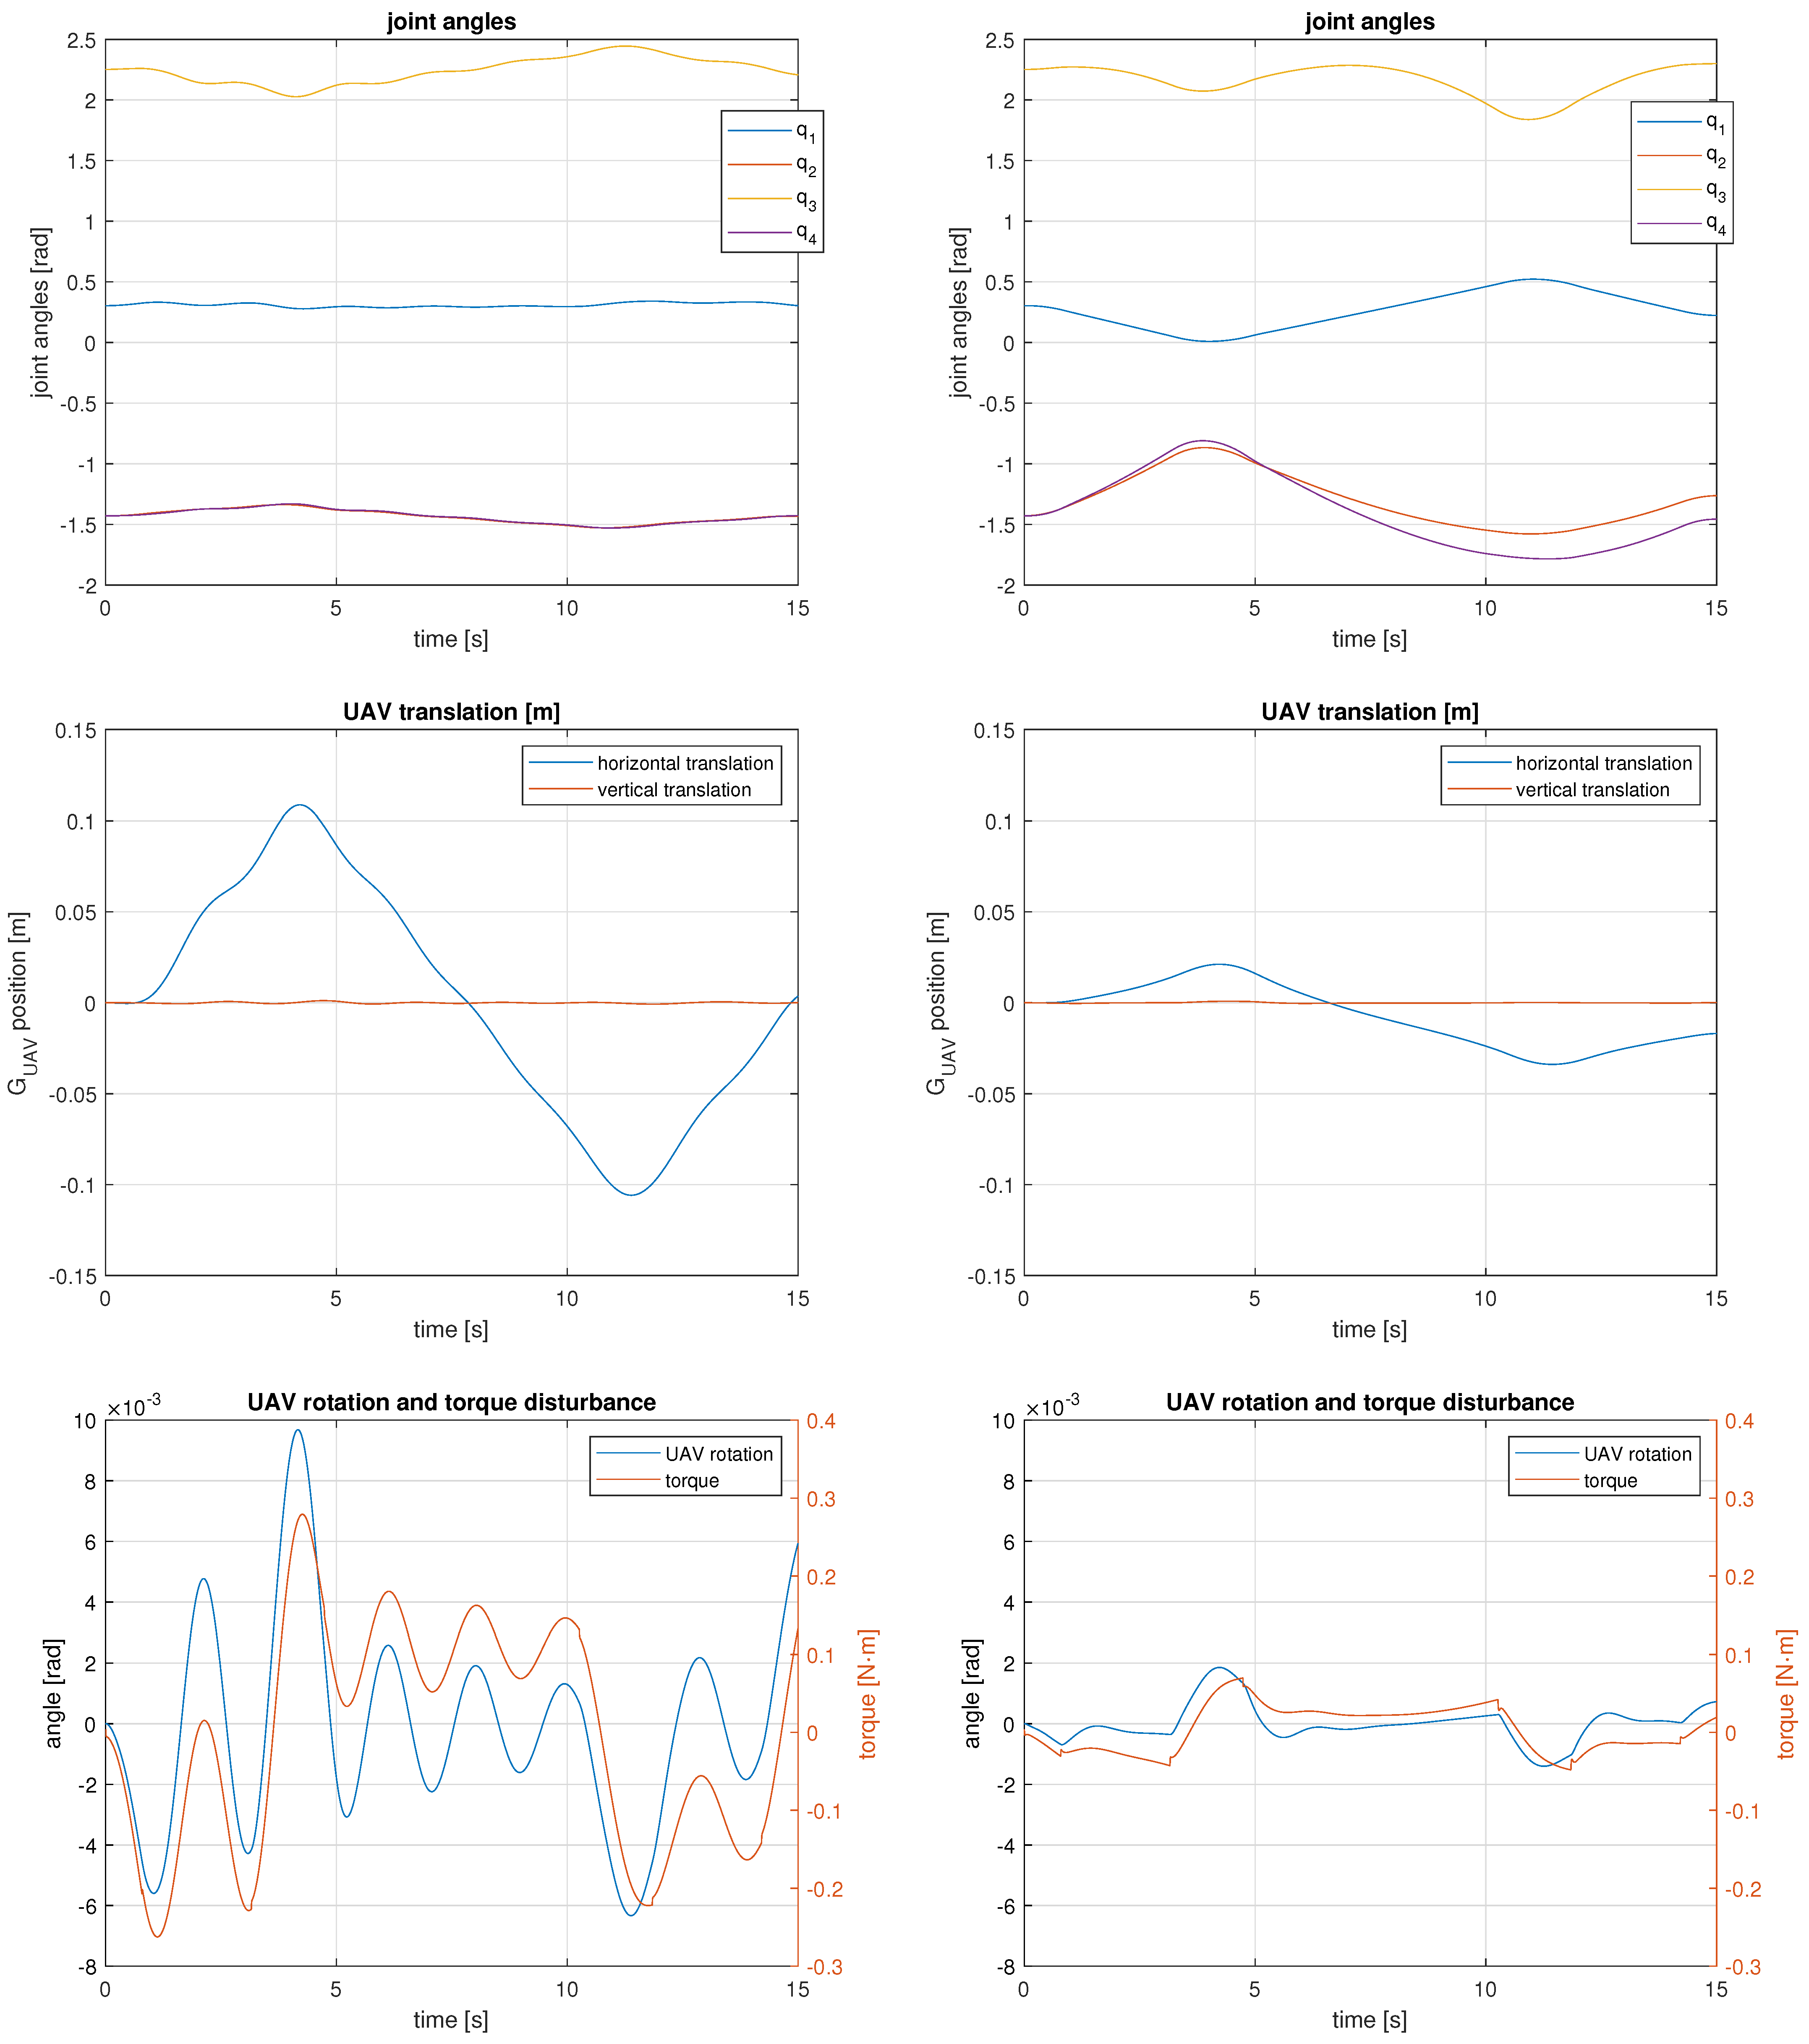
Manipulator joint motions (top) and UAV motions and torque disturbance (middle and bottom) for the 4 DOF UAM tracking the horizontal line trajectory. Results obtained with the minimum joint velocities solution are on the left and results obtained with the gradient projection method are on the right.
Figure 11.
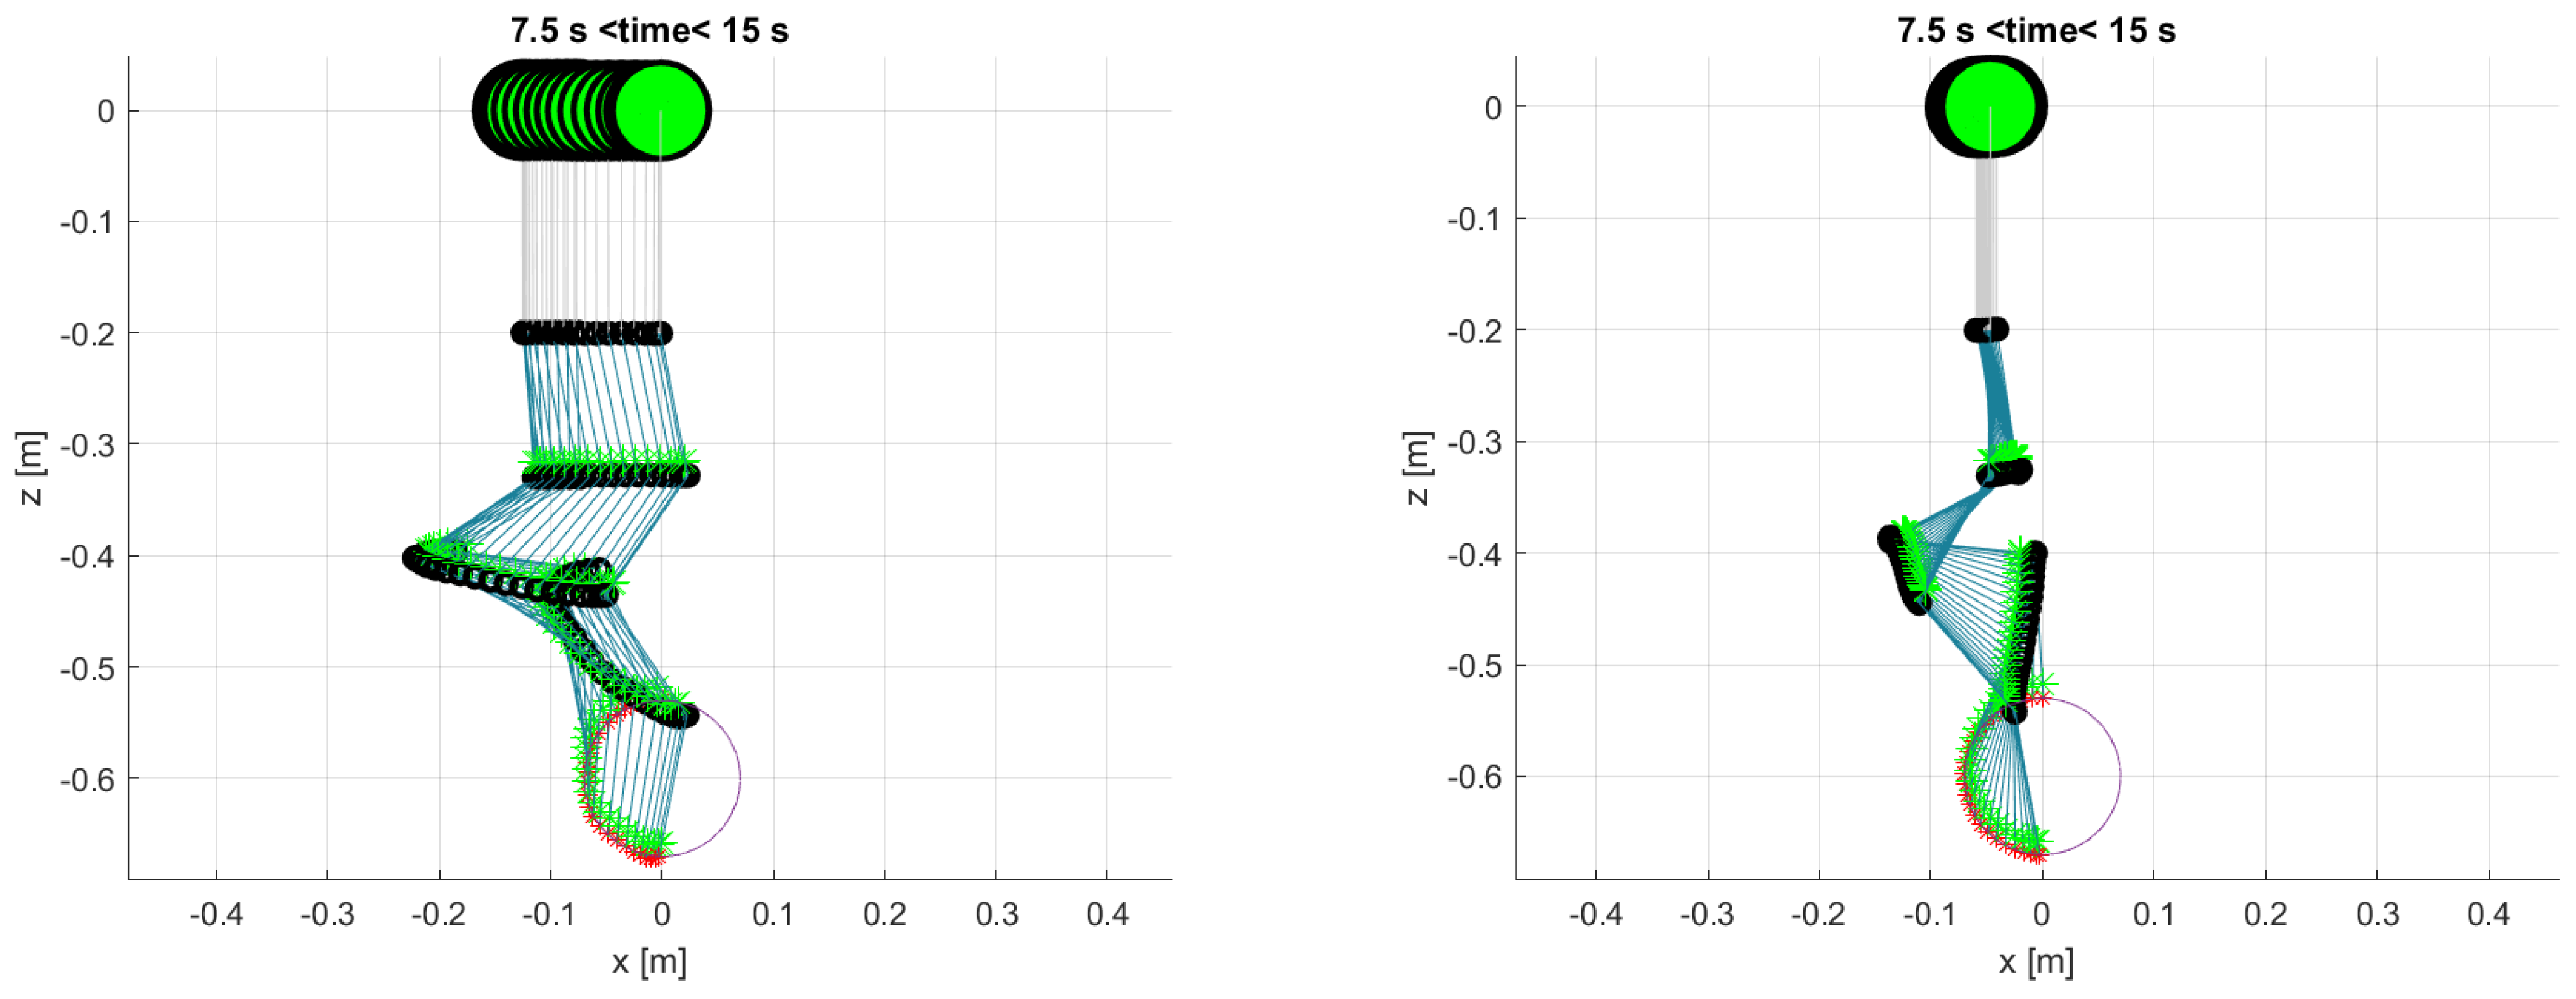
Stroboscopic view of the 3 stages of the tilted line trajectory for the 3 DOF manipulator with the minimum joint velocities solution (left) and with the gradient projection method (right). The UAV CoG is the large green marker, joints are the black circles, links are the blue lines, link CoGs are green markers, and end-effector positions tracked are red markers.
Figure 12.
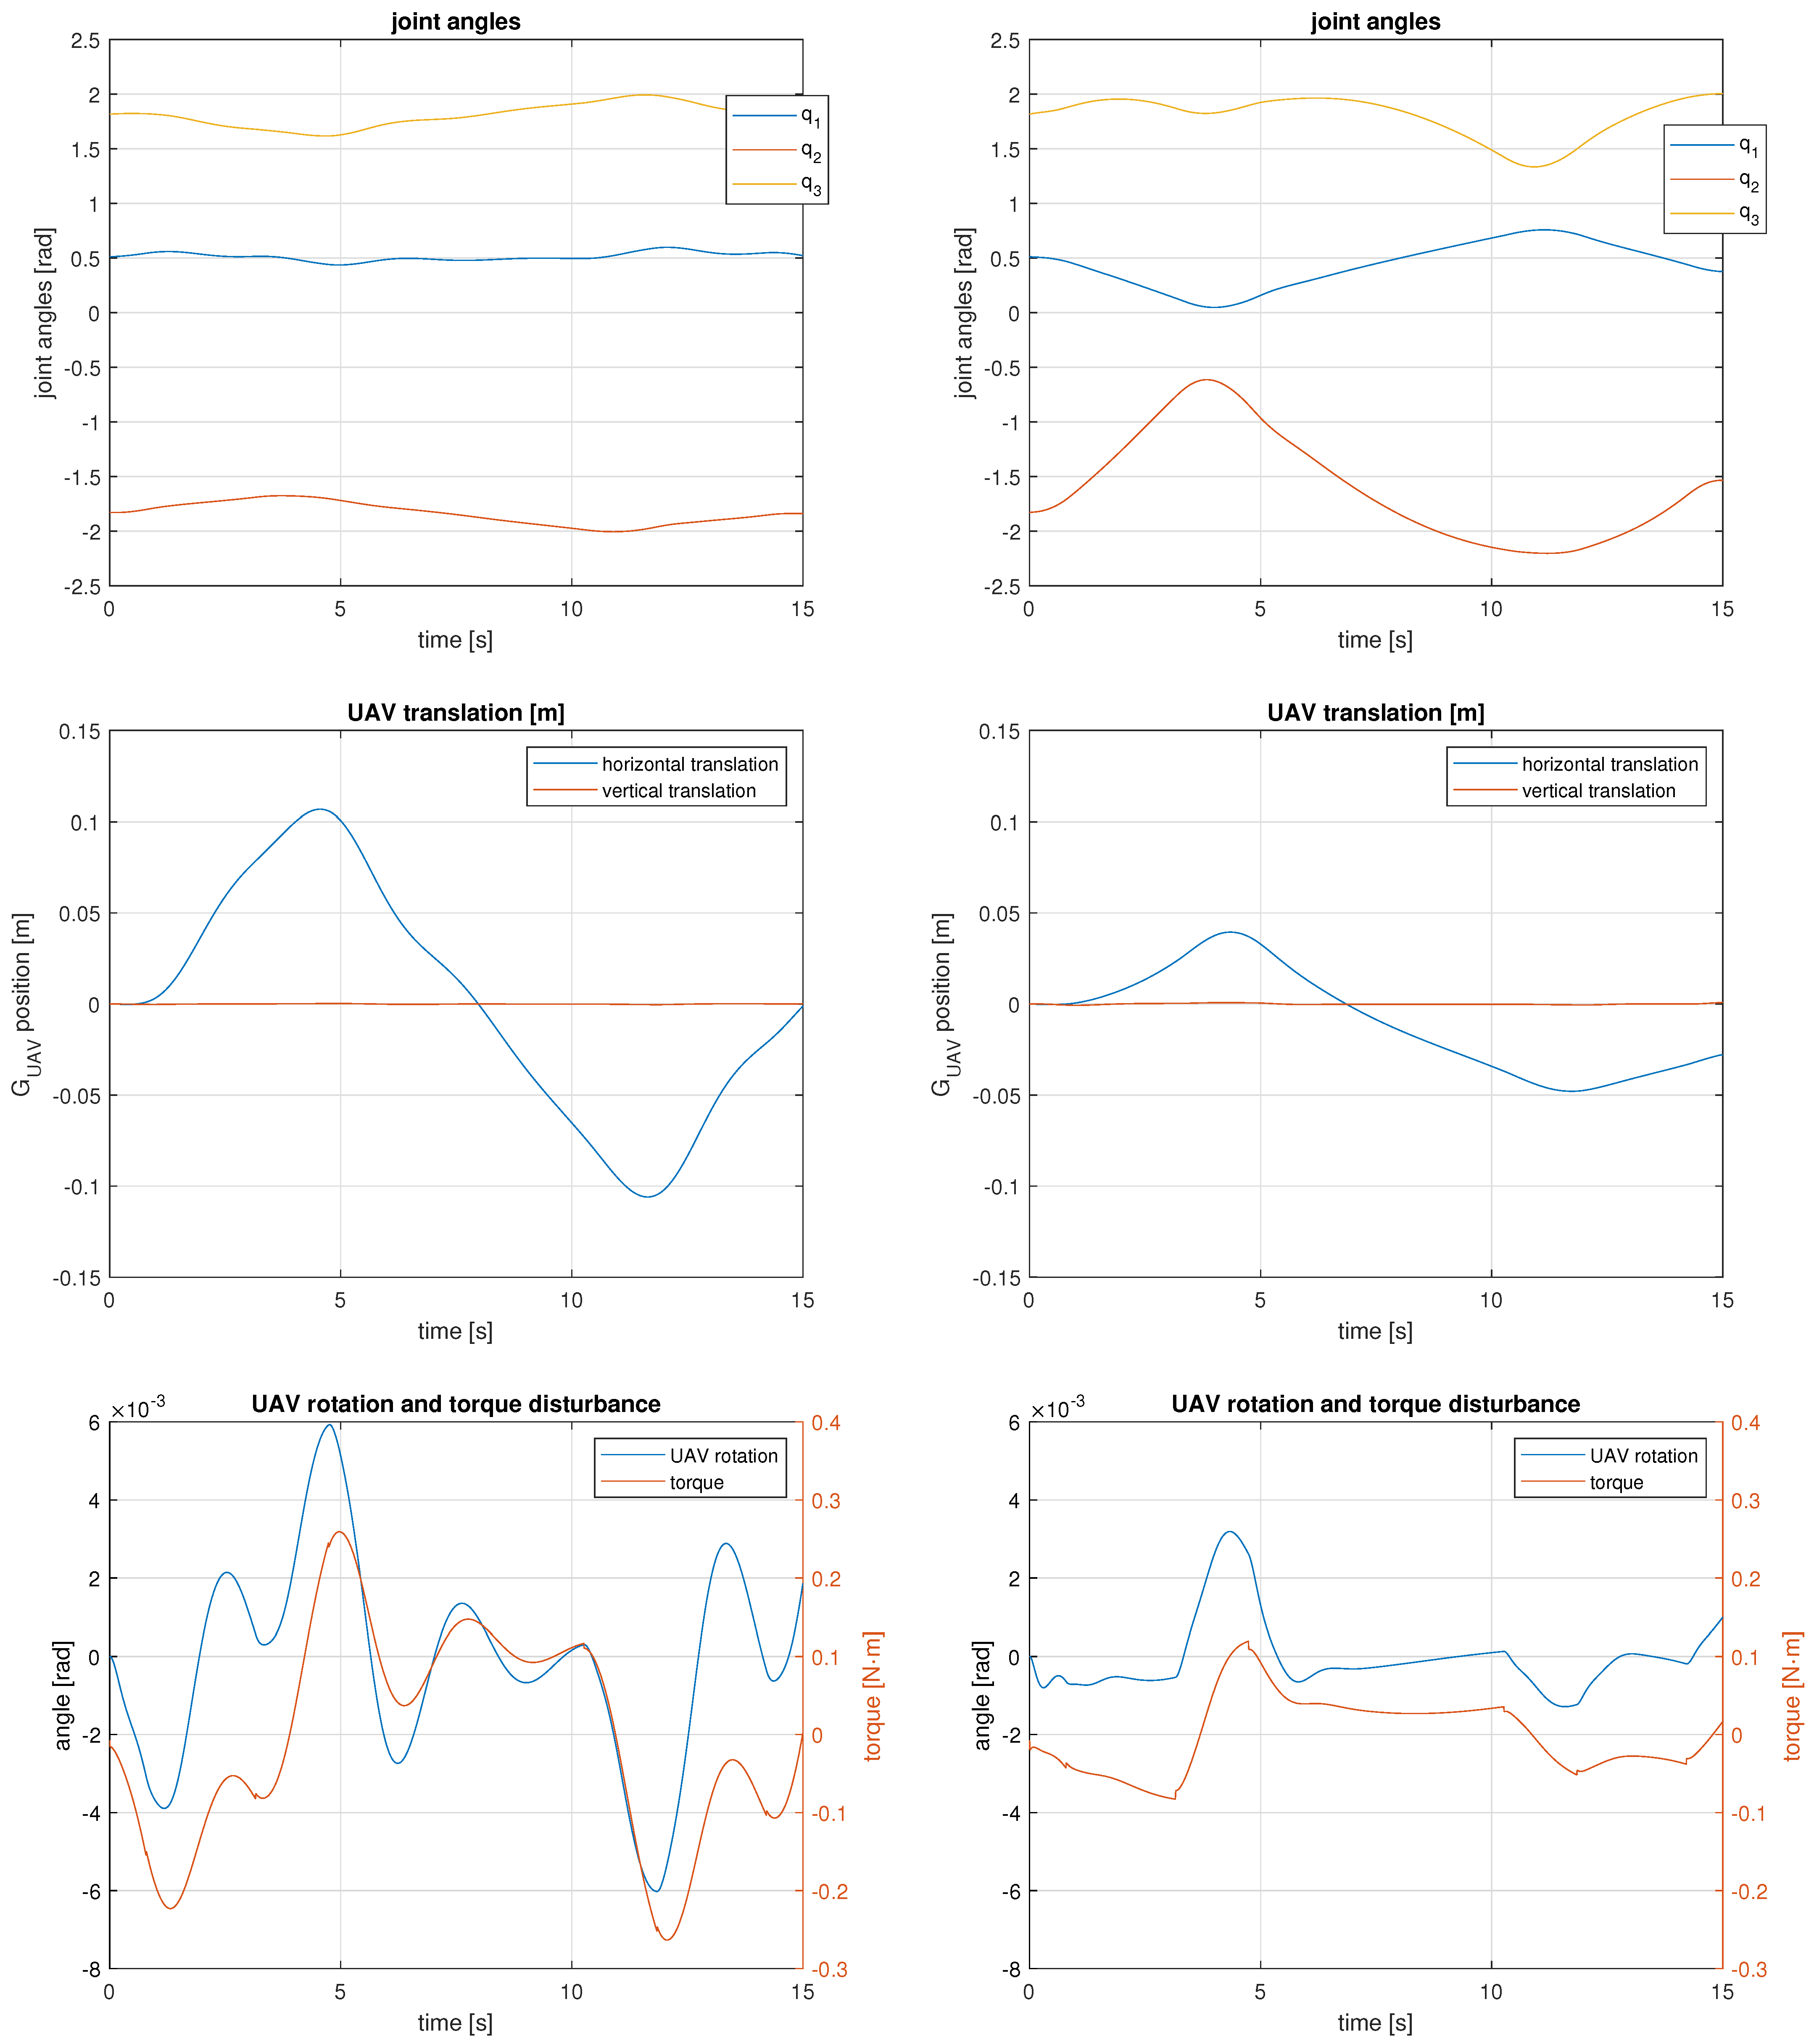
Manipulator joint motions (top) and UAV motions and torque disturbance (middle and bottom) for the 3 DOF UAM tracking the tilted line trajectory. Results obtained with the minimum joint velocities solution are on the left and results obtained with the gradient projection method are on the right.
Figure 13.
Stroboscopic view of the 3 stages of the tilted line trajectory for the 4 DOF manipulator with the minimum joint velocities solution (left) and with the gradient projection method (right). The UAV CoG is the large green marker, joints are the black circles, links are the blue lines, link CoGs are green markers, and end-effector positions tracked are red markers.
Figure 14.
Manipulator joint motions (top) and UAV motions and torque disturbance (middle and bottom) for the 4 DOF UAM tracking the tilted line trajectory. Results obtained with the minimum joint velocities solution are on the left and results obtained with the gradient projection method are on the right.
Figure 15.
Stroboscopic view of the 2 stages of the circle trajectory for the 3 DOF manipulator with the minimum joint velocities solution (left) and with the gradient projection method (right). The UAV CoG is the large green marker, joints are the black circles, links are the blue lines, link CoGs are green markers, and end-effector positions tracked are red markers.
Figure 16.
Manipulator joint motions (top) and UAV motions and torque disturbance (middle and bottom) for the 3 DOF UAM tracking the circle trajectory. Results obtained with the minimum joint velocities solution are on the left and results obtained with the gradient projection method are on the right.
Figure 17.
Stroboscopic view of the 2 stages of the circle trajectory for the 4 DOF manipulator with the minimum joint velocities solution (left) and with the gradient projection method (right). The UAV CoG is the large green marker, joints are the black circles, links are the blue lines, link CoGs are green markers, and end-effector positions tracked are red markers.
Figure 18.
Manipulator joint motions (top) and UAV motions and torque disturbance (middle and bottom) for the 4 DOF UAM tracking the circle trajectory. Results obtained with the minimum joint velocities solution are on the left and results obtained with the gradient projection method are on the right.
Figure 19.
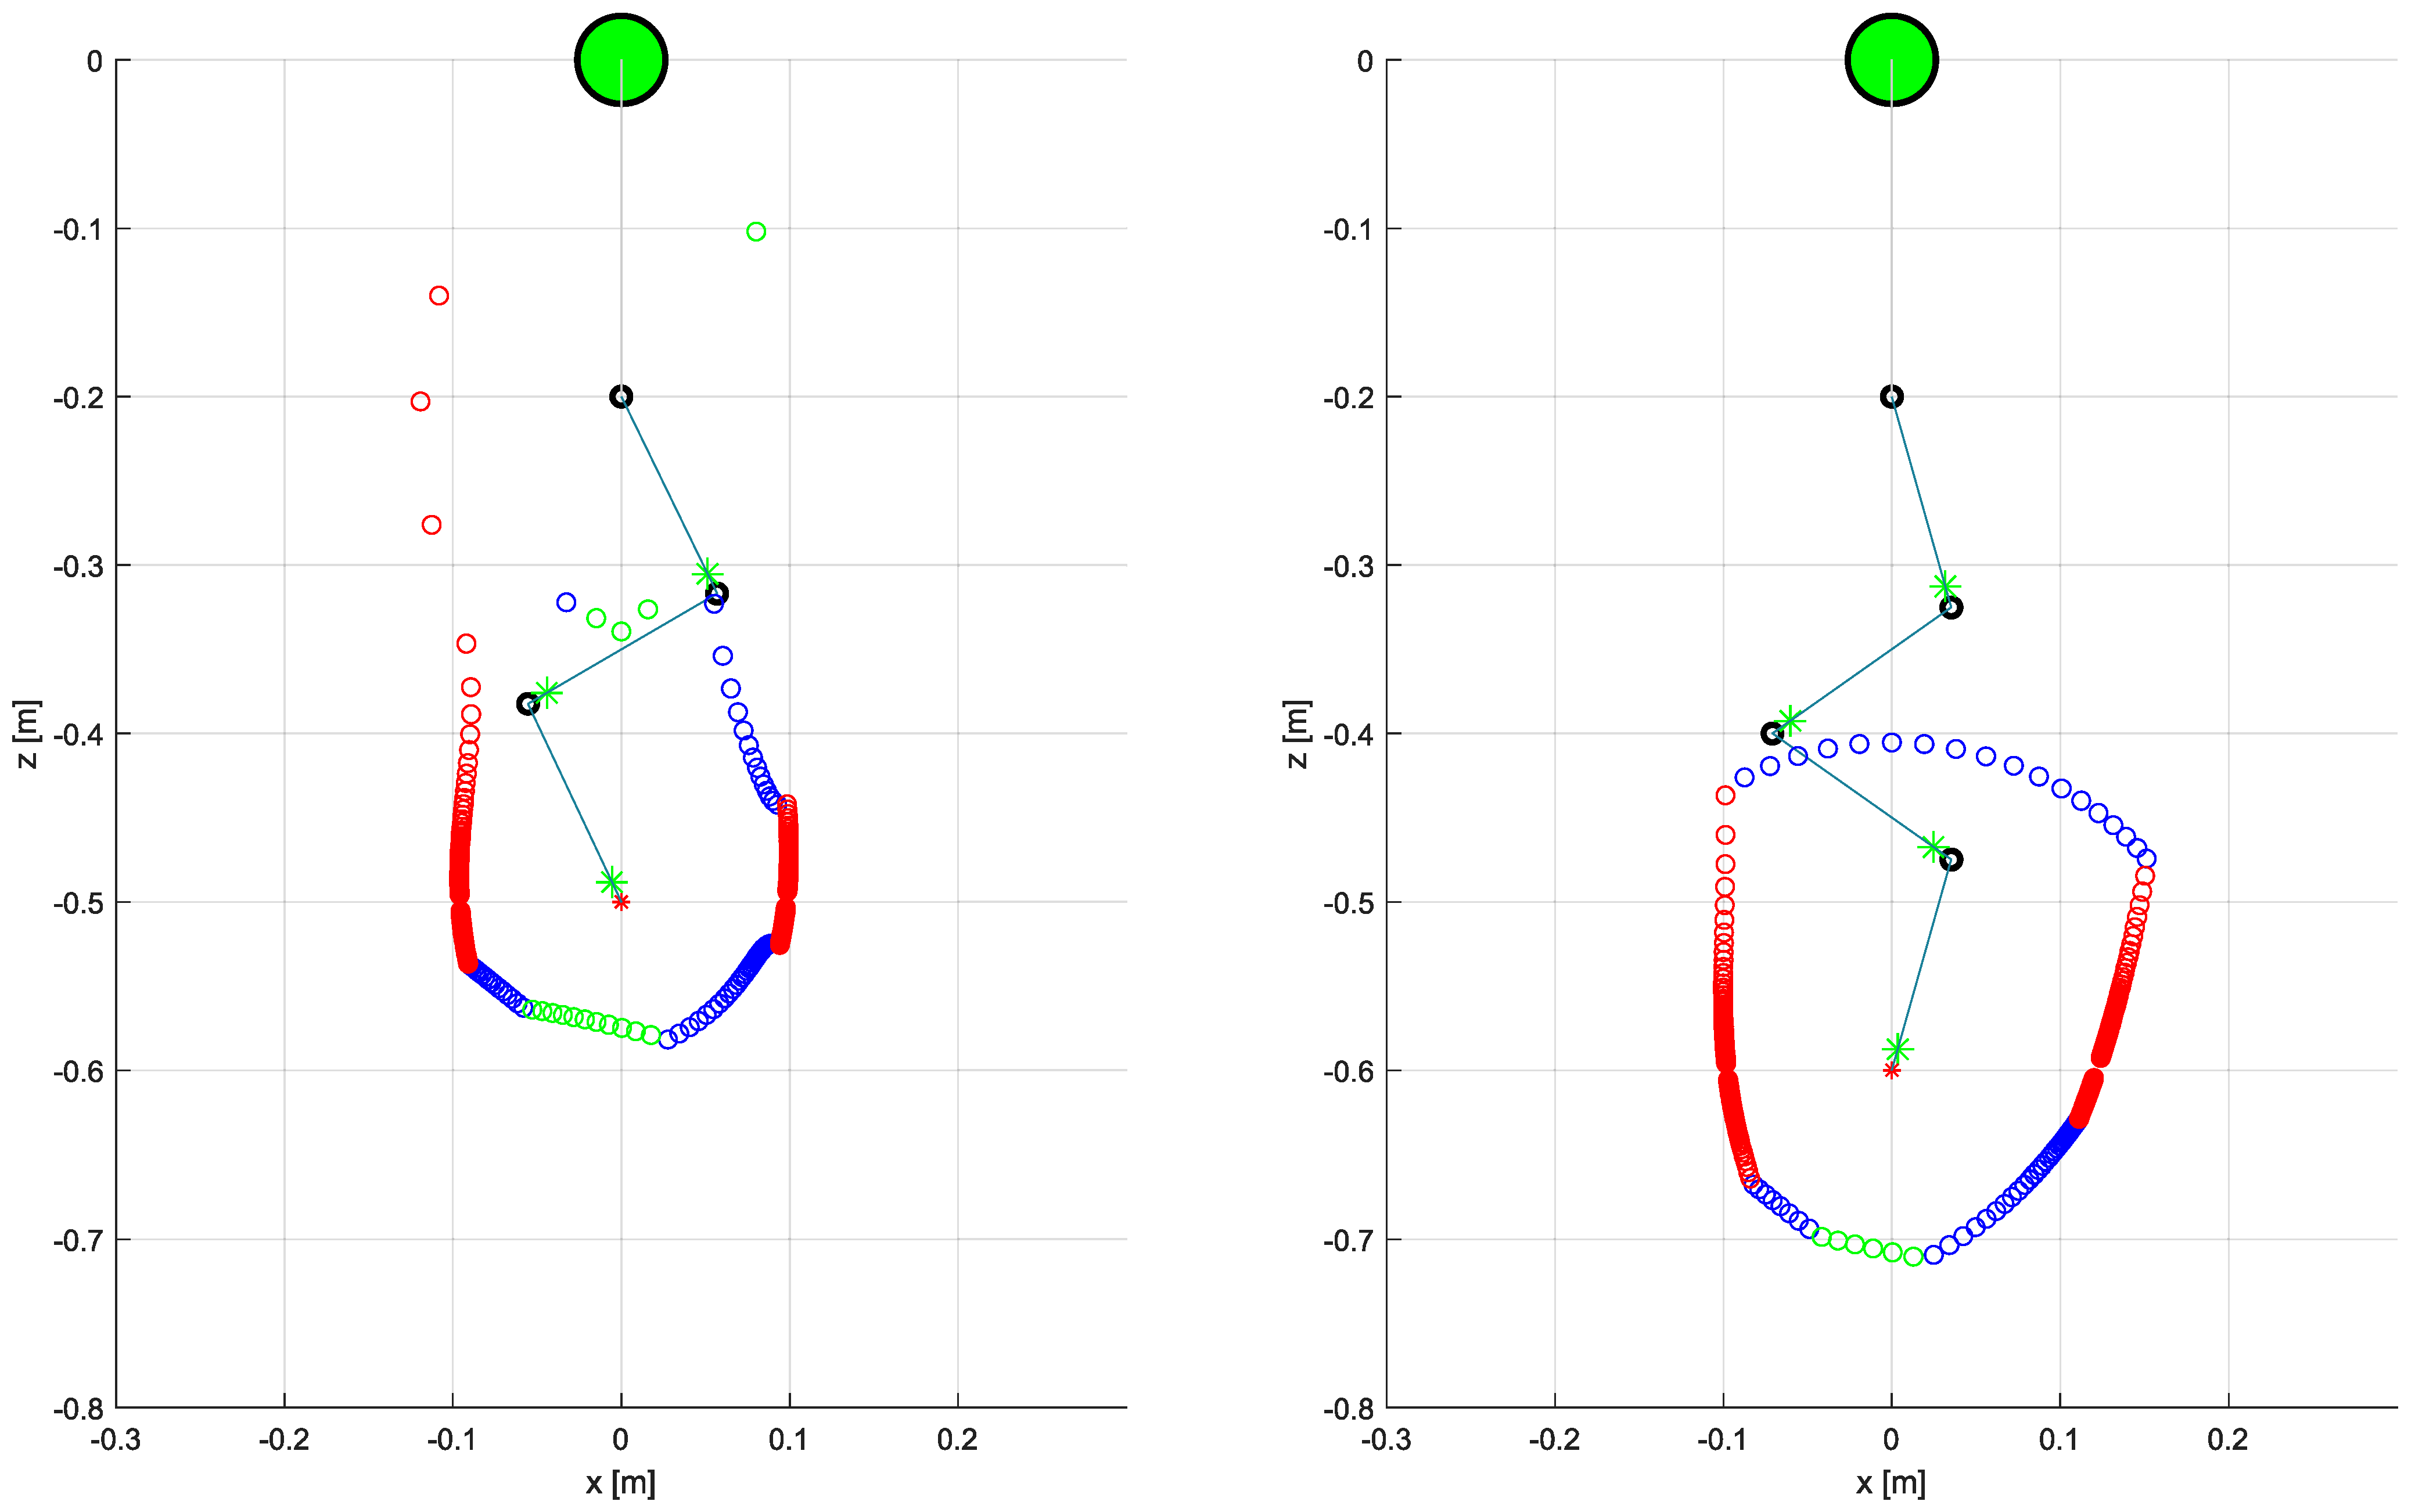
Workspace limits for the 3 DOF (left) and for the 4 DOF (right) UAM. Markers indicate the stopping position while color refers to the stopping condition: green for excessive joint velocities, red for excessive UAV translation, and blue for excessive position error. The UAM initial configuration is shown through the UAV CoG (large green marker), joints (black circles), links (blue lines), link CoG (green marker), and end-effector position (red marker).
Table 1.
Kinematic and dynamic UAM model parameters used in simulation experiments.
Table 1.
Kinematic and dynamic UAM model parameters used in simulation experiments.
| Parameter | Description | Value | Unit |
|---|
| Mass of the UAV | 4.2 | kg |
| Link and Actuator mass | 0.625 | kg |
| Moment of Inertia (y) of the UAV | 0.4097 | kg·m2 |
| Moment of Inertia (y) of Link i | | kg·m2 |
| Link i length | 0.13 | m |
| Distance from joint i to link i CoG | 0.117 | m |
| Distance from UAV CoG to manipulator joint 1 along UAV body x-axis | 0 | m |
| Distance from UAV CoG to manipulator joint 1 along UAV body z-axis | | m |
Table 2.
Duration of the three stages in the horizontal and tilted line trajectories.
Table 2.
Duration of the three stages in the horizontal and tilted line trajectories.
| Stage (i) | T [s] |
|---|
| 1 | 3.95 |
| 2 | 7.10 |
| 3 | 3.95 |
Table 3.
PID controller coefficients.
Table 3.
PID controller coefficients.
| Coordinate (i) | | | |
|---|
| z | 37 | 18 | 8 |
| 40 | 3 | 35 |
Table 4.
Maximum rotation and translation of the UAV using the minimum joint velocities solution (non-optimized) and the gradient projection method (optimized) for the horizontal line trajectory.
Table 4.
Maximum rotation and translation of the UAV using the minimum joint velocities solution (non-optimized) and the gradient projection method (optimized) for the horizontal line trajectory.
| UAV Motion | 3 DOF Non-Optimized | 3 DOF Optimized | 4 DOF Non-Optimized | 4 DOF Optimized |
|---|
| Maximum rotation [rad] | 6.1 × 10⁻³ | 3.5 × 10⁻³ | 9 × 10⁻³ | 1.7 × 10⁻³ |
| Maximum translation on the right [m] | 0.11 | 0.040 | 0.11 | 0.020 |
| Maximum translation on the left [m] | 0.11 | 0.049 | 0.11 | 0.035 |
Table 5.
Maximum rotation and translation of the UAV using the minimum joint velocities solution (non-optimized) and the gradient projection method (optimized) for the tilted line trajectory.
Table 5.
Maximum rotation and translation of the UAV using the minimum joint velocities solution (non-optimized) and the gradient projection method (optimized) for the tilted line trajectory.
| UAV Motion | 3 DOF Non-Optimized | 3 DOF Optimized | 4 DOF Non-Optimized | 4 DOF Optimized |
|---|
| Maximum rotation [rad] | 6 × 10⁻³ | 3.2 × 10⁻³ | 9.6 × 10⁻³ | 1.8 × 10⁻³ |
| Maximum translation on the right [m] | 0.11 | 0.039 | 0.11 | 0.021 |
| Maximum translation on the left [m] | 0.11 | 0.048 | 0.11 | 0.034 |
Table 6.
Maximum rotation and translation of the UAV using the minimum joint velocities solution (non-optimized) and the gradient projection method (optimized) for the circular trajectory.
Table 6.
Maximum rotation and translation of the UAV using the minimum joint velocities solution (non-optimized) and the gradient projection method (optimized) for the circular trajectory.
| UAV Motion | 3 DOF Non-Optimized | 3 DOF Optimized | 4 DOF Non-Optimized | 4 DOF Optimized |
|---|
| Maximum rotation [rad] | 3.5 × 10⁻³ | 1.1 × 10⁻³ | 4.2 × 10⁻³ | 0.73 × 10⁻³ |
| Maximum translation on the right [m] | 0.091 | 0.0093 | 0.041 | 0.0030 |
| Maximum translation on the left [m] | 0.059 | 0.058 | 0.13 | 0.060 |
Table 7.
End-effector maximum position error for all tested trajectories and arm configurations.
Table 7.
End-effector maximum position error for all tested trajectories and arm configurations.
| Trajectory (i) | Maximum End-Effector Position Error [mm] |
|---|
| 3 DOF Non-Optimized | 3 DOF Optimized | 4 DOF Non-Optimized | 4 DOF Optimized |
|---|
| 1 (horizontal line) | 6.6 | 3.6 | 11.0 | 2.1 |
| 2 (tilted line) | 6.3 | 3.4 | 11.9 | 2.4 |
| 3 (circle) | 4.7 | 1.7 | 6.2 | 1.2 |

