Abstract
The assessment of weak acid membrane permeability (Pm) frequently involves large unilamellar vesicles. It relies on measurements of the intravesicular pH drop, ΔpHin, in response to a sudden augmentation of external acid concentration. However, ΔpHin may be primarily governed by non-instantaneous protonation and deprotonation reactions of (i) the acid itself, (ii) the buffer molecules, and (iii) the fluorescent pH reporter dye. Moreover, buffer concentration and acid gradient also serve as determinants of ΔpHin, as we show here. The uniexponential time constant (τ) of ΔpHin(t) is an invalid measure of Pm as Arrhenius plots of Pm and reveal different activation energies for acid influx. We calculate Pm by fitting a mathematical model to experimental stopped-flow traces. The model takes into account not only the time course of total internal buffer capacity but also (i) water self-dissociation, (ii) volume changes due to acid induced osmotic water flow, and (iii) the spontaneous membrane proton leak. It allows extracting a Pm of 30.8 ± 3.5 μm/s for formic acid for 1,2-dioleoyl-sn-glycero-3-phosphocholine (DOPC) vesicles.
1. Introduction
Many pharmacologically important substances belong to the class of weak acids and bases [1,2]. Such drugs are appealing because they may permeate membranes in their neutral form and yet attain high water solubility in their charged form at physiological pH values [3]. Cellular uptake of these substances is intricately linked to protonation and deprotonation reactions [4]. Upon permeating membranes, weak acids augment the pH of the solution they leave and acidify the solution they enter:
where and denote the reaction rates for the deprotonation and protonation reaction, respectively.
These pH changes are used to assess weak acid membrane permeability, [5]. In the most widely used assay, large unilamellar lipid vesicles (LUV) are exposed to a jump in external concentration and is derived from the time constant of exponential intravesicular pH change [6,7]. However, the assumed proportionality between and is only valid in a very limited set of experimental conditions as demonstrated by the following derivation:
The flux density of a weak acid across the membrane of area into a spherical vesicle of radius is defined as:
where is the transmembrane gradient of the protonated acid. A positive value for corresponds to influx. Per definition, must also be equal to the first-time derivative of the amount (n) of molecules (in moles) that cross the membrane per unit area. Exploiting , Equation (2) may be transformed into:
Solving Equation (3) with respect to the boundary conditions that (i) for t = 0, (ii) , i.e., time invariant and (iii) vesicle volume is independent on time (i.e., at all times), i.e., there is no acid flux induced osmotic water flow, yields:
Equation (4) is valid for substances that do not undergo chemical reactions. Weak acids with a pK value below the intravesicular pH value () suffer a net proton release upon arrival. Accounting for the fraction of deprotonated acid molecules transforms Equation (4) into:
Equation (5) is only valid if the chemical reactions are not rate limiting, i.e., if proton uptake and release reactions are in equilibrium. Equation (5) can easily be solved assuming a time invariant (constant) :
where is an exponential time constant. Thus, Equation (6) is not valid in experiments where significant changes of intravesicular pH () take place. That is, Equation (6) does not describe experiments which rely on measurements of a significant drop, , for determining .
Another problem of Equation (6) is its neglect of accompanying chemical reactions. That is, water hydrolysis as well as proton uptake and release by buffer molecules or by fluorescent dyes (Figure 1) may confound the analysis. In other words, the very method of exploiting protonation and deprotonation reactions of encapsulated pH-sensitive dyes as readout may introduce a systematical error to the assessment of . Commonly, the dye has a much higher pK value than the weak acid itself, and thus proton release from the dye molecules may be too slow to measure acid membrane translocation. The resulting liability of Equation (6) to misinterpretations has previously been recognized [8]. The same considerations are valid for buffer molecules with higher pK values. In addition, Equation (6) ignores the importance of buffer capacity in vesicular uptake experiments. Its significance has previously been demonstrated for weak acid and weak base permeation across planar bilayers [9,10,11]. This paper aims at adopting our previously published mathematical model [9,10,11] to describe buffer effects on weak acids flux into lipid vesicles.
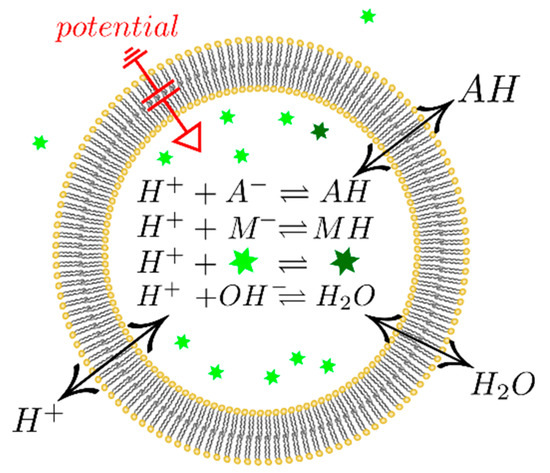
Figure 1.
Graphic representation of the experimental system. Weak acid, buffer, water, and fluorophore participate in protonation/deprotonation reactions. Upon protonation, the fluorophore (bright green star) ceases to fluoresce (dark green star). Weak acid, proton, and water fluxes across the membrane are driven by the respective electrochemical gradients. Charge transfer by protons gives rise to a transmembrane potential.
An alternative approach of measuring is based on the assessment of osmotic water flow that accompanies acid efflux from vesicles. Vesicle shrinkage can be assessed by measuring the intensity of scattered light, i.e., it is possible to obtain in fluorophore-free experiments [12]. Of course, that assay requires high values of membrane water permeability to ensure that the osmotic water flux is not rate limiting. Consequently, reconstitution of water channels (aquaporins) into the vesicular membrane may be necessary. The drawback of that approach is that the acid has to be present in significant amounts to induce observable volume changes. To prevent from increasing during efflux, sizable amounts of encapsulated buffer molecules are required. In consequence, the osmotic assay also requires buffer-reactions to be considered.
Our analysis shows that the neglect of buffer molecules may result in misinterpretations of the experimental results. Most importantly, the commonly assumed proportionality between and is not guaranteed. That is, changes in buffer capacity may well give rise to changes in while remains unaltered.
2. Materials and Methods
2.1. Computation
We developed a mathematical model for weak acid transport across membranes that accounts both for the accompanying water flux and the presence of buffer. The model assumes that only the protonated form of the weak acid is membrane permeable. Since most of the acids are negatively charged at physiological pH values, protonation and deprotonation reactions are of utmost importance. They result in the following time derivatives for the concentration of the acid, its conjugated base and protons:
The ratio of protonation and deprotonation rates is the acid dissociation constant K (in M), which is usually indicated in terms of the acid’s pK value (Equation (8)).
Acid uptake by vesicles results in a difference of osmolarities . The resulting water flux gives rise to a change of volume V. For the sake of simplicity, comprises the sum of the concentrations of osmotically active substances:
where is the molar volume of water and is the membrane water permeability. Changes of vesicle volume act to alter the concentration of the enclosed substances. In addition, both the expenditure in the course of chemical reactions and the diffusion across the membrane result in concentration changes:
where is the amount of in moles. Since the charged is treated as membrane impermeable, its time derivative is:
For the non-permeating buffer (, ) and the pH-dependent fluorophore (deprotonated and protonated carboxyfluorescein , ) similar relations hold. In addition, the self-ionization of water may also serve to release protons:
Water with a concentration of dissociates at rate . Recombination of protons and hydroxide occurs at rate . is the water equilibrium constant. Water self-dissociation changes the hydroxide concentration and contributes to the change in :
Protons possess high membrane permeability [13,14]. As we show in the experimental section, membrane translocation of all other charged species can be neglected. Consequently, we find the decrease of the intravesicular amount of protons due to proton egress from the Goldman–Hodgkin–Katz flux equation [15,16,17] as:
where , , , are Faraday’s constant, gas constant, absolute temperature, and the transmembrane voltage, respectively.
In addition to proton egress, the luminal proton concentration is also altered by chemical reactions. Hence the change in luminal proton concentration is not a measure of the charge that loads the capacitor. Only ncc gives rise to by charging the membrane capacitor: , where (in coulombs) is the charge imbalance between the two sides of the capacitor. Consequently, we find the following expression for :
The negative sign in Equation (15) indicates the directionality of the electrical potential.
Accounting for (i) water self-dissociation (Equation (13)), (ii) proton uptake and release reactions of membrane impermeable buffer molecules (, with deprotonation, protonation rates , , respectively—as in Equation (7)), and (iii) pH dependent fluorophore (, ) deprotonation and protonation rates, , , respectively), the time derivative of intravesicular proton amount adopts the form:
The initial conditions for solving the system of differential Equations (10)–(16) are given by the initial volume of the vesicles and the concentrations of salt, buffer, and weak acid. Since the pH of the solution, in which the vesicles are formed, is adjusted with HCl, the actual amount of chloride inside the vesicles is calculated assuming electrical neutrality. All values used for the computation are summarized in Table 1. The acid deprotonation rates are set to [18] if not otherwise indicated. All protonation rates are presumed to be diffusion limited, i.e., [18].

Table 1.
Values of parameters used for computation.
The measured fluorescence intensity (I) depends on , since carboxyfluorescein is only fluorescent when deprotonated [19]. Variations in between different runs of the experiment are accounted for by defining the normalized experimental fluorescence intensity () as the ratio of I values at time t and time t = 0: . The I value at is not attainable by experimental observation because mixing of vesicle suspension with acid solution is not instantaneous, i.e., time elapses before mixing is completed. Consequently, is obtained by first fitting a monoexponential function to I(t) for ≤ t ≤ 0.1 s and second extrapolating this fit to I(t = 0).
Our model predicts theoretical fluorescence intensity () by assuming proportionality to calculated values (Equations (10)–(16)). Comparing prediction and experiment requires normalization of . The procedure must accommodate the absolute value of time invariant background intensity. This value ( originates from detector dark counts, unspecific fluorescence, and non-encapsulated carboxyfluorescein:
where is the normalized theoretical fluorescence intensity. Substituting proportionality factor a for the ratio Imax/[CF]tot of maximum fluorescence intensity and total concentration of encapsulated dye yields:
where is the relative background fluorescence intensity.
The following three steps serve to extract from :
- Numerical calculation of , the time course of the concentration of fluorescent dye as function of for given initial conditions.
- is calculated from for varying .
- is fitted to using and as fitting parameters.
Step 1 is accomplished in Wolfram Mathematica 11.2 [20]. With the “ParametricNDSolveValue” routine, a parametric solution for is obtained with respect to the initial conditions employing the built-in implicit differential-algebraic (IDA) solver. This solver is a part of the SUite of Nonlinear and DIfferential/ALgebraic Equation Solvers (SUNDIALS, [21]).
In step 2, is inserted into Equation (18) for , which is evaluated in a table for different and . Employing Mathematica’s “Interpolation” routine results in an interpolating formula for .
In step 3, a global fit over traces for different initial conditions is performed to find robust Pm values. For that, for the respective initial conditions are used in a “NonlinearModelFit” routine.
2.1.1. Temperature Correction
Equilibrium and kinetic parameters change with temperature. Calculating the deprotonation rate at the temperature of interest from the deprotonation rate at a known reference temperature (22 °C) requires to take into account the activation energy of proton diffusion [22]:
where is shift of the pK value at temperature T. is treated as temperature independent as it varies by less than one percent [23] in the temperature range of interest. is corrected by using Arrhenius’ equation and a typical activation energy of for natural lipid mixtures (Escherichia coli polar lipid extract) and synthetic phospholipids (1,2-diphytanoyl-sn-glycero-3-phosphocholine) [24].
2.1.2. Additional Assumptions in the Model
In addition to those already mentioned, the model is based on the following assumptions:
- The time it takes a molecule to pass a membrane of thickness can be neglected. The time between the onset of the Fickian flux (Equation (2)) upon the application of is estimated as [25]:denotes the diffusion coefficient of a substance within the membrane. It can be approximated to be equal to ~1/10 of the aqueous diffusion coefficient [26]. amounts to ~ for L = and = . Thus, ≪ indicating that the application of gives rise to an instantaneous J.
- Solute bulk concentrations remain unaltered throughout the experiment because only 1/1000 of the volume of the suspension is encapsulated by vesicles. This can be estimated from (i) the mass concentration of lipid in the measurement cuvette (about ), (ii) the molar mass of 1,2-dioleoyl-sn-glycero-3-phosphocholine (DOPC, ), and (iii) an area per lipid of approximately [27].
- Diffusion through stagnant water layers (unstirred layers) in the immediate membrane vicinity can be neglected because their width does not exceed the vesicle diameter [28]. A molecule with = crosses this distance within a few µs. is orders of magnitude larger.
- Carboxyfluorescein (CF) residues that display acidic pK’s are neglected since they do not contribute to buffer capacity at experimental pH. Only ~6.45 is considered. It is well described by the Henderson–Hasselbalch equation (Figure S1).
- For the same reason, the highly acidic pK of DOPC (2.25; [18]) is neglected.
2.1.3. Activation Energy of Membrane Permeation
The energy barrier that a membrane imposes to permeation is experimentally accessible via temperature dependent measurements of [37,38] or a parameter that is proportional to . Commonly, the activation energy is extracted via an Arrhenius plot (Equation (21); [39]):
where is some temperature independent constant.
If the inverse value of time constant (Equation (6)) was proportional to (Equation (6)), derived from an Arrhenius plot for must be the same as derived from .
2.2. Buffers
All buffers are prepared with MilliQ water (Millipore; Billerica, MA, USA) with a specific resistance of 18 MΩ cm. Chemicals are purchased from Sigma-Aldrich (St. Louis, MO, USA). The intravesicular and extravesicular buffers contain 100 mM KCl, and 5, 10, or 20 mM MES (2-(N-morpholino)ethanesulfonic acid). They are adjusted to pH 7 by HCl addition. The intravesicular solution additionally contains 0.5 mM 5(6)-carboxyfluorescein (CF).
2.3. Large Unilamellar Vesicles
A mass of 5 mg of DOPC (Avanti Polar Lipids, Alabaster, AL, USA) are dissolved in chloroform and added to a glass test tube. Evaporation on a rotavapor for at least 45 min at about 20 mbar vacuum results in a thin lipid film on the glass wall. Rehydration of the lipid film to a 10 mg/mL suspension allows obtaining LUVs by extrusion through 100 nm wide pores. External CF is removed by a Sephadex desalting column (PD-10, GE Healthcare, Chicago, IL, USA). Fresh vesicles are prepared daily.
2.4. Stopped Flow Experiments
A 50 mM stock solution of sodium formate is prepared in the external buffer and mixed with an eight-fold diluted vesicle suspension by a stopped-flow device (SFM-300, bio-logic, Seyssinet-Pariset, France). A 75 mW xenon lamp excites the sample at 480 nm at 4 nm bandwidth. A photomultiplier tube collects the light that is emitted at a right angle behind a 515 nm long-pass filter. Fluorescence intensity is hardware filtered with 300 µs and is sampled at a rate of 1 ms. Each curve is recorded at least six times and then averaged. Per trace, 151 µL total volume are pushed through the cuvette at a flow rate of 9 mL/s resulting in a dead time () of 1.7 ms.
2.5. Dynamic Light Scattering
A DelsaNano HC particle analyzer (Beckman Coulter; Brea, CA, USA) measures the intensity of scattered light to extract the liposome size. Vesicles radius is derived from the mean of the volume distribution, since the amount of encapsulated dye scales with vesicle volume.
2.6. Estimation of Proton Permeability
Membranes are orders of magnitude more permeable to protons than to other cations [13] suggesting that a proton leak might occur. The latter is worth estimating since I depends on proton concentration: We subject the vesicular membrane to a pH gradient by pipetting HCl to a continuously stirred solution and the fluorescence spectrophotometer (HITACHI F2700; Tokyo, Japan) tracks the decay of I. Grid monochromators are set to 480 and 520 nm for excitation and emission, respectively. The bandwidths are restricted to 5 nm. We added the potassium ionophore valinomycin to a final aqueous concentration of 1µM. It clamped the membrane potential to a value that was given by the transmembrane concentration gradient of potassium [40], i.e., to a value that was not significantly different from zero. This conclusion is based on the Goldman–Hodgkin–Katz equation that calculates the membrane potential from the permeabilities of the different ionic species and their concentrations. Since the potassium concentration in our experiments exceeded the proton concentration by roughly six orders of magnitude, the valinomycin induced enhancement of proton permeability by a factor of two [13] remains without effect on the membrane potential.
3. Results
3.1. Vesicle Size
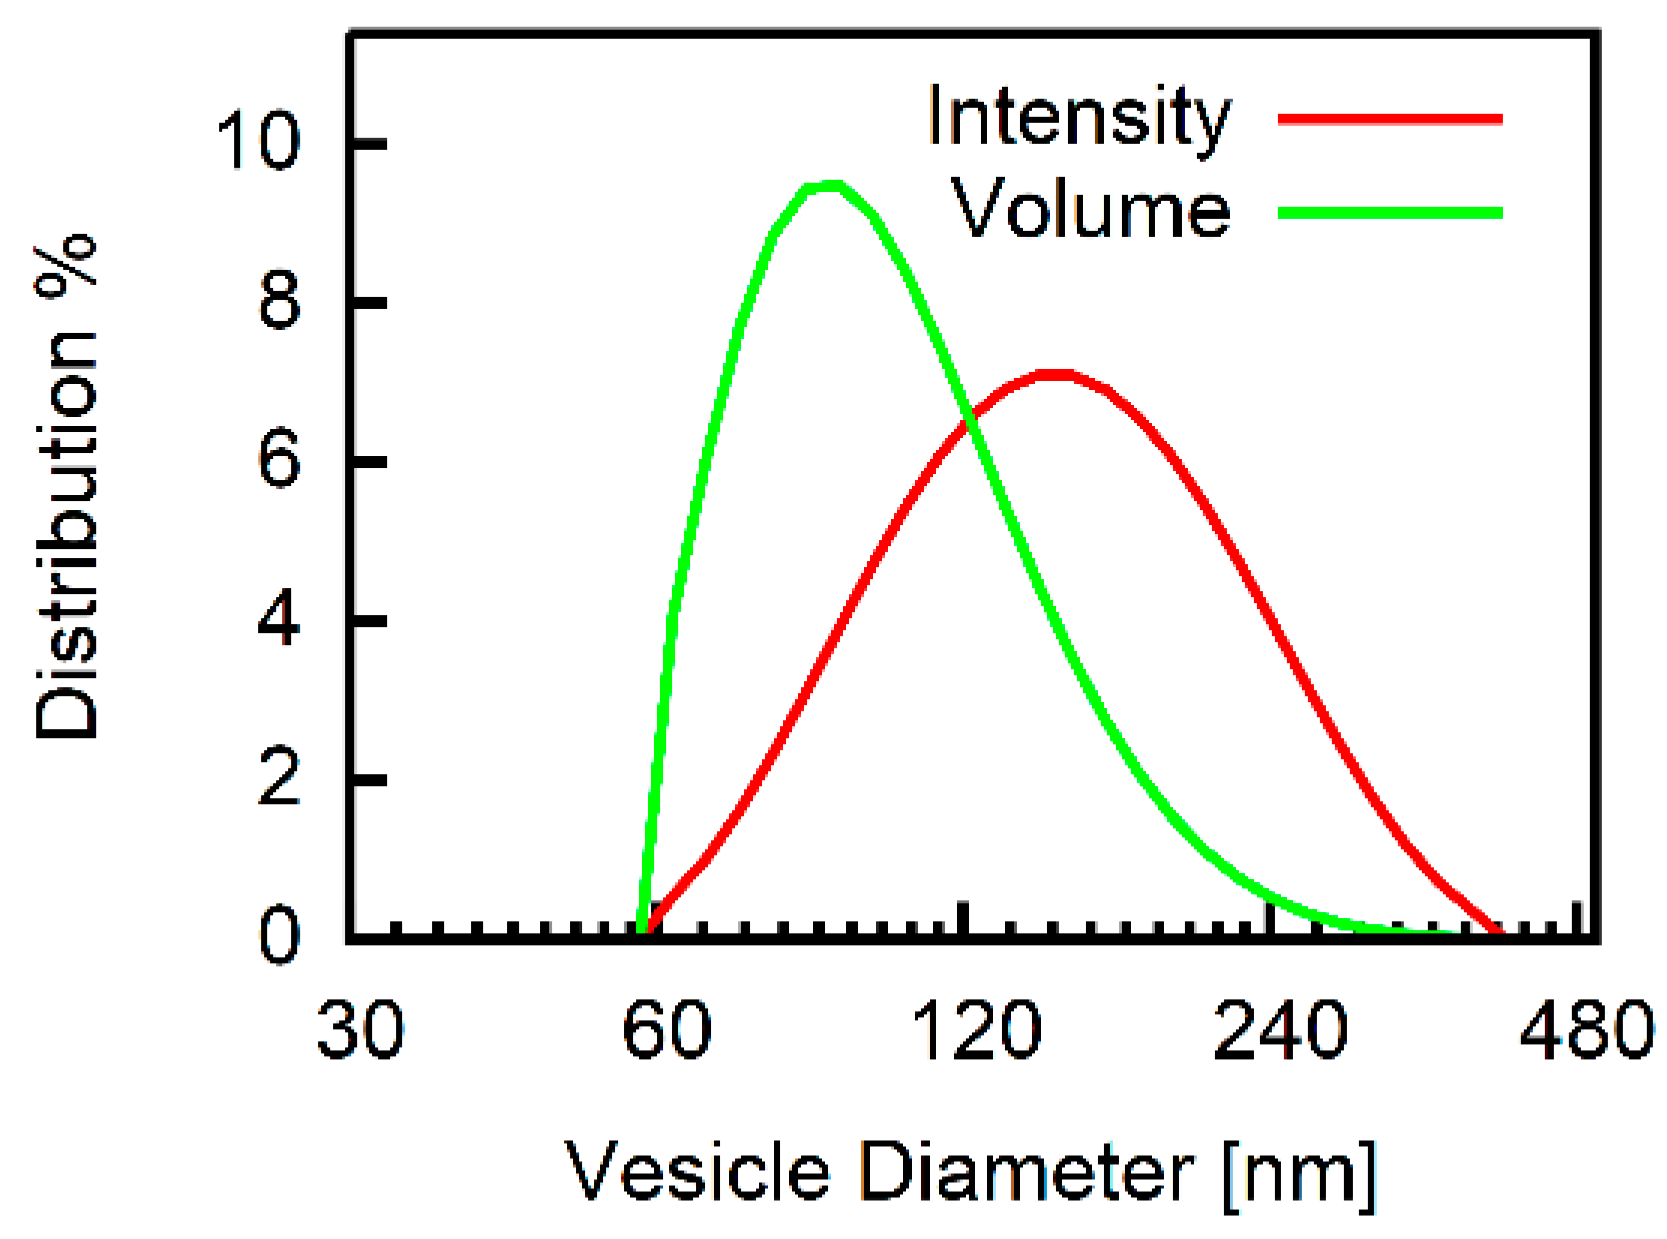
The volume distribution returned by the Dynamic Light Scattering (DLS) measurements indicated a mean diameter of about 110 nm for DOPC vesicles. For each preparation, the diameter was determined and used for the calculations (e.g., Equation (10)). A representative measurement is shown in Figure 2.
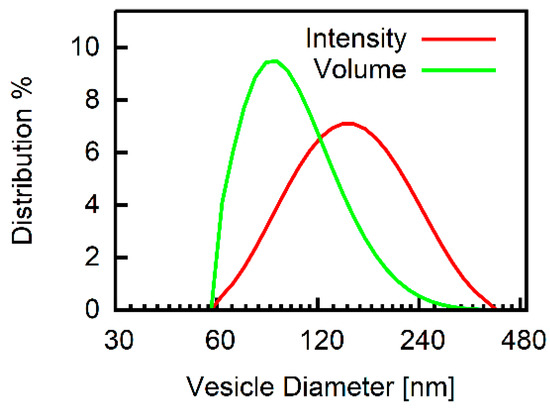
Figure 2.
Vesicle size. Representative semi-logarithmic intensity and volume distributions (107.4 ± 38.4 nm) from Dynamic Light Scattering (DLS) measurements. 1,2-dioleoyl-sn-glycero-3-phosphocholine (DOPC) vesicles (100 mM KCl, 0.5 mM carboxyfluorescein (CF), 5 mM MES pH 7) after extrusion through a 100 nm filter and removal of external CF.
3.2. Estimate for Proton Permeability
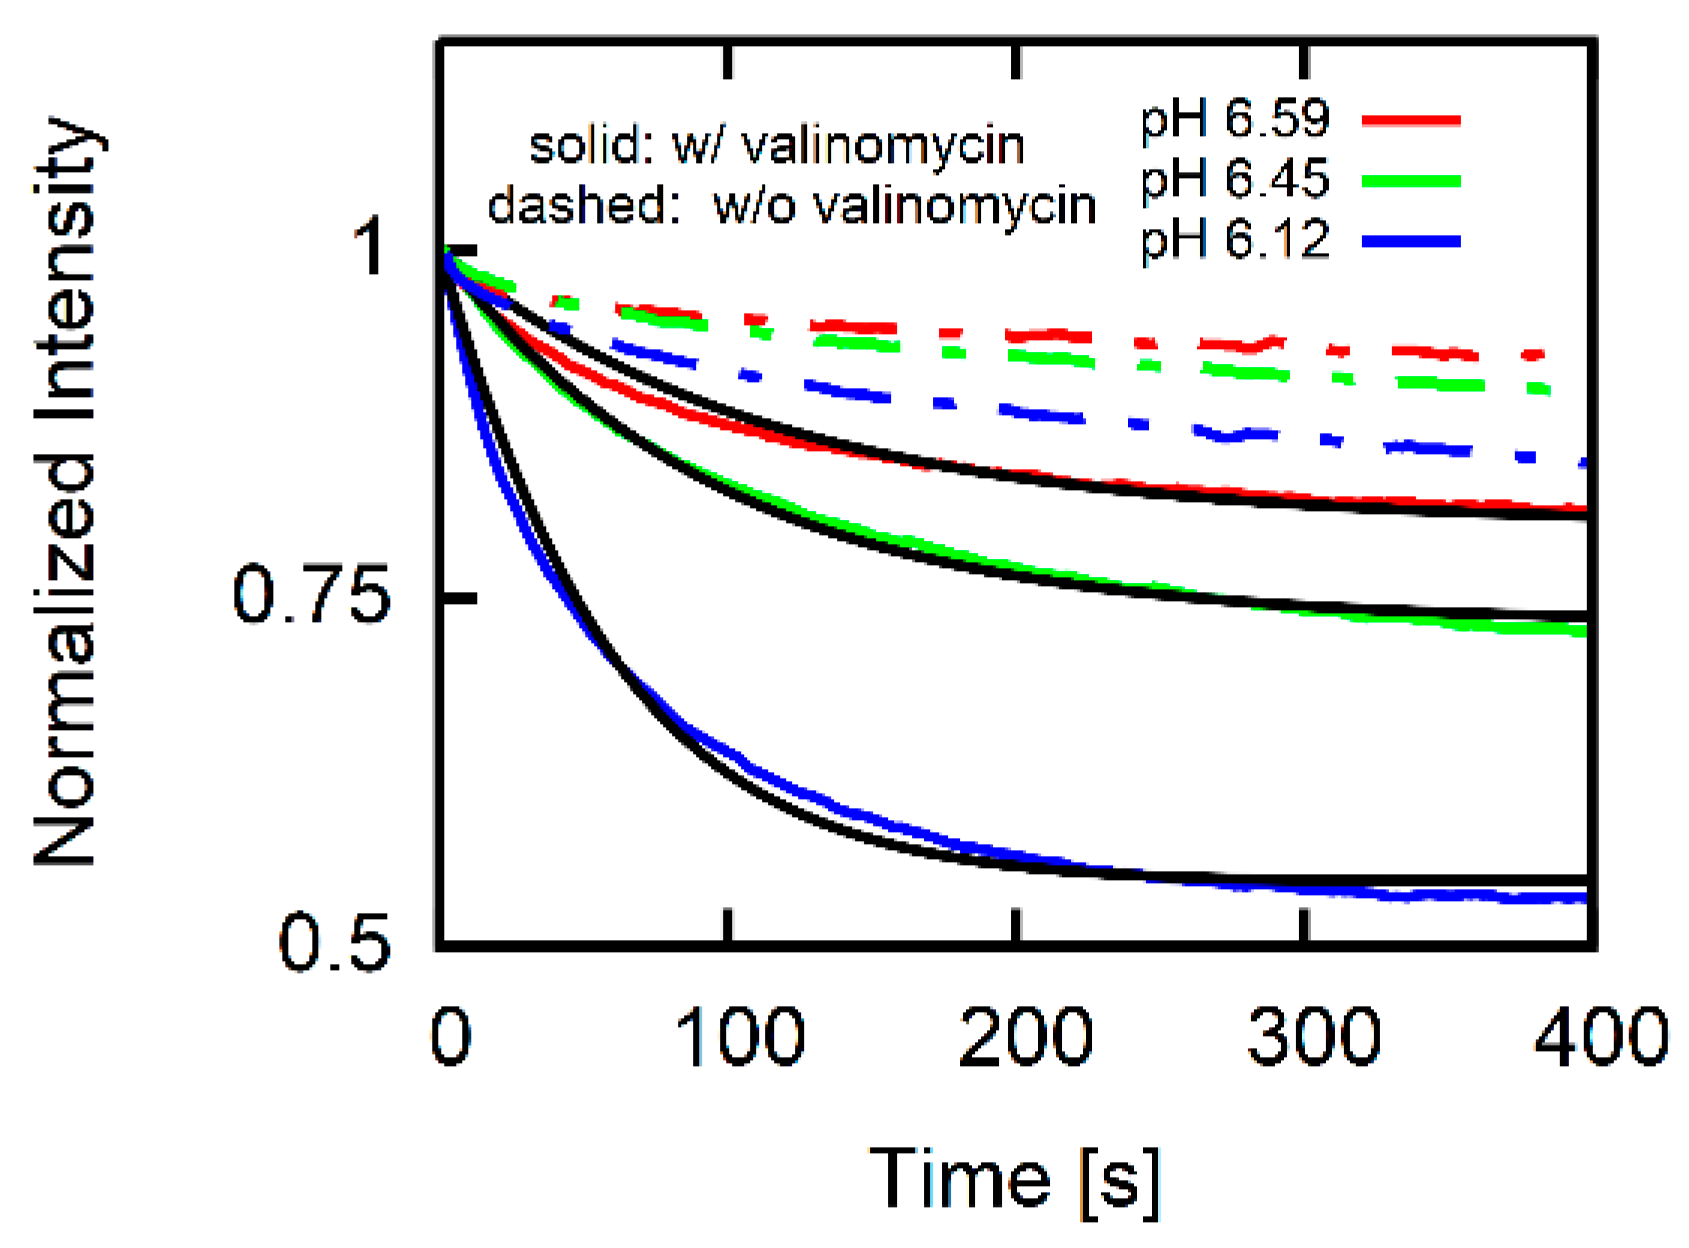
Acidification of the external solution leads to a decline in (Figure 3). We apply the above developed system of differential Equations (10)–(16) assuming that 1 μM of the potassium ionophore valinomycin clamps to almost zero. Accounting for the absence of AH () and substituting Equation (14) for a Fickian flux equation for protons yields . The value is in the range of previously reported values [41]. Thus, is negligibly small since AH uptake leads to 100 times faster acidification of the vesicular interior (Figure 4). Performing the same experiment without valinomycin (dashed lines in Figure 3) yielded a much slower decaying pH since < 0 mV. This observation supports our assumption that the permeation of counterions (e.g., chloride) does not significantly contribute to albeit counterions are present in much larger concentrations than protons.
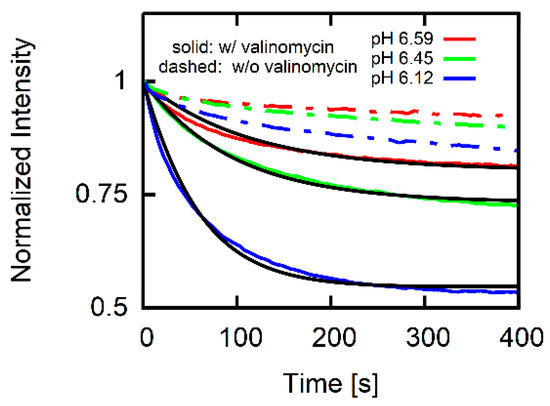
Figure 3.
Assessment of membrane proton permeability. DOPC vesicles in 100 mM KCl, 2 mM MES, pH 7 (inside additionally 0.5 mM CF) are exposed to decreased external pH (denoted in the key) by addition of HCl. The potassium ionophore valinomycin (final concentration 1 µM) clamps the transmembrane potential to almost zero (solid colored lines). A global fit of (black lines) to (colored lines) reveals a proton permeability of in the presence (w/) of valinomycin. The kinetics are slower in the absence (w/o) of valinomycin (dashed lines) confirming that membrane potential > 0 mV hinders proton translocation across the membrane.

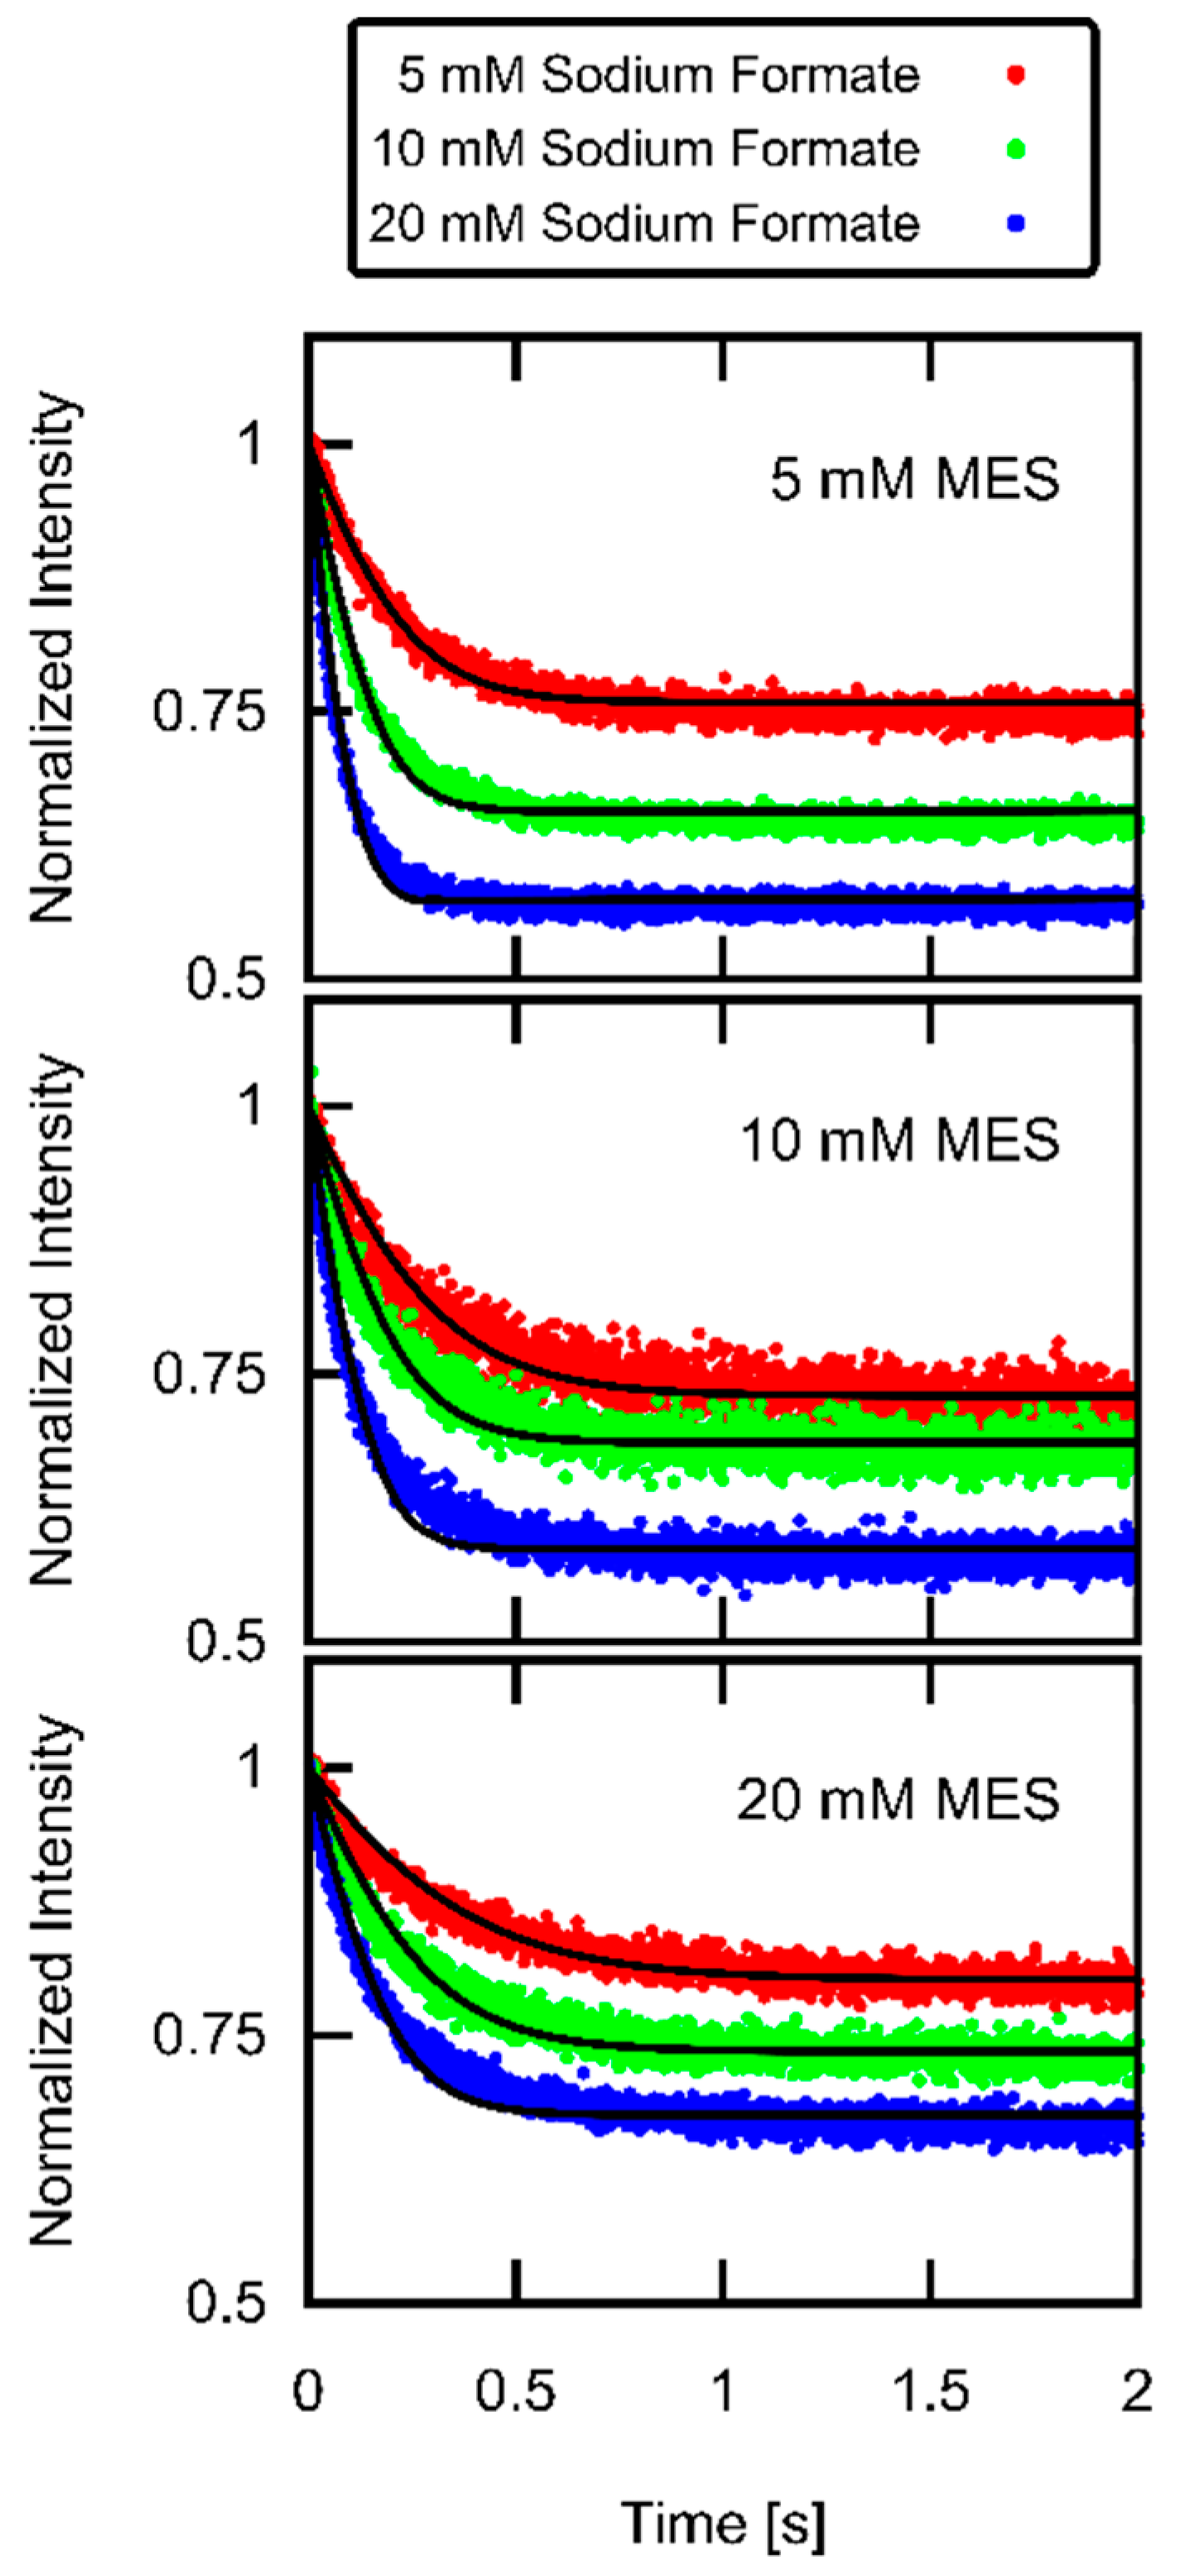
Figure 4.
Weak acid uptake. DOPC vesicles loaded with 100 mM KCl and 0.5 mM CF (pH 7) were objected to gradients of sodium formate in 100 mM KCl (pH7) at time 0. Initial intravesicular and extravesicular MES concentrations amounted to the values indicated in the panels. Global (per panel) fits of (black lines) to (colored lines) resulted in formic acid permeabilities of 29.1, 34.9, and 33.3 µm/s for the upper, middle, and lower panels, respectively.
3.3. Formic Acid Membrane Permeability of DOPC
Objecting CF loaded vesicles to a jump of external formic acid concentration leads to a drop in (Figure 4). For each buffer concentration, we obtained by globally fitting (Equation (18)) to (single panels in Figure 4). The average (n = 4) of all values at different buffer concentrations results in .
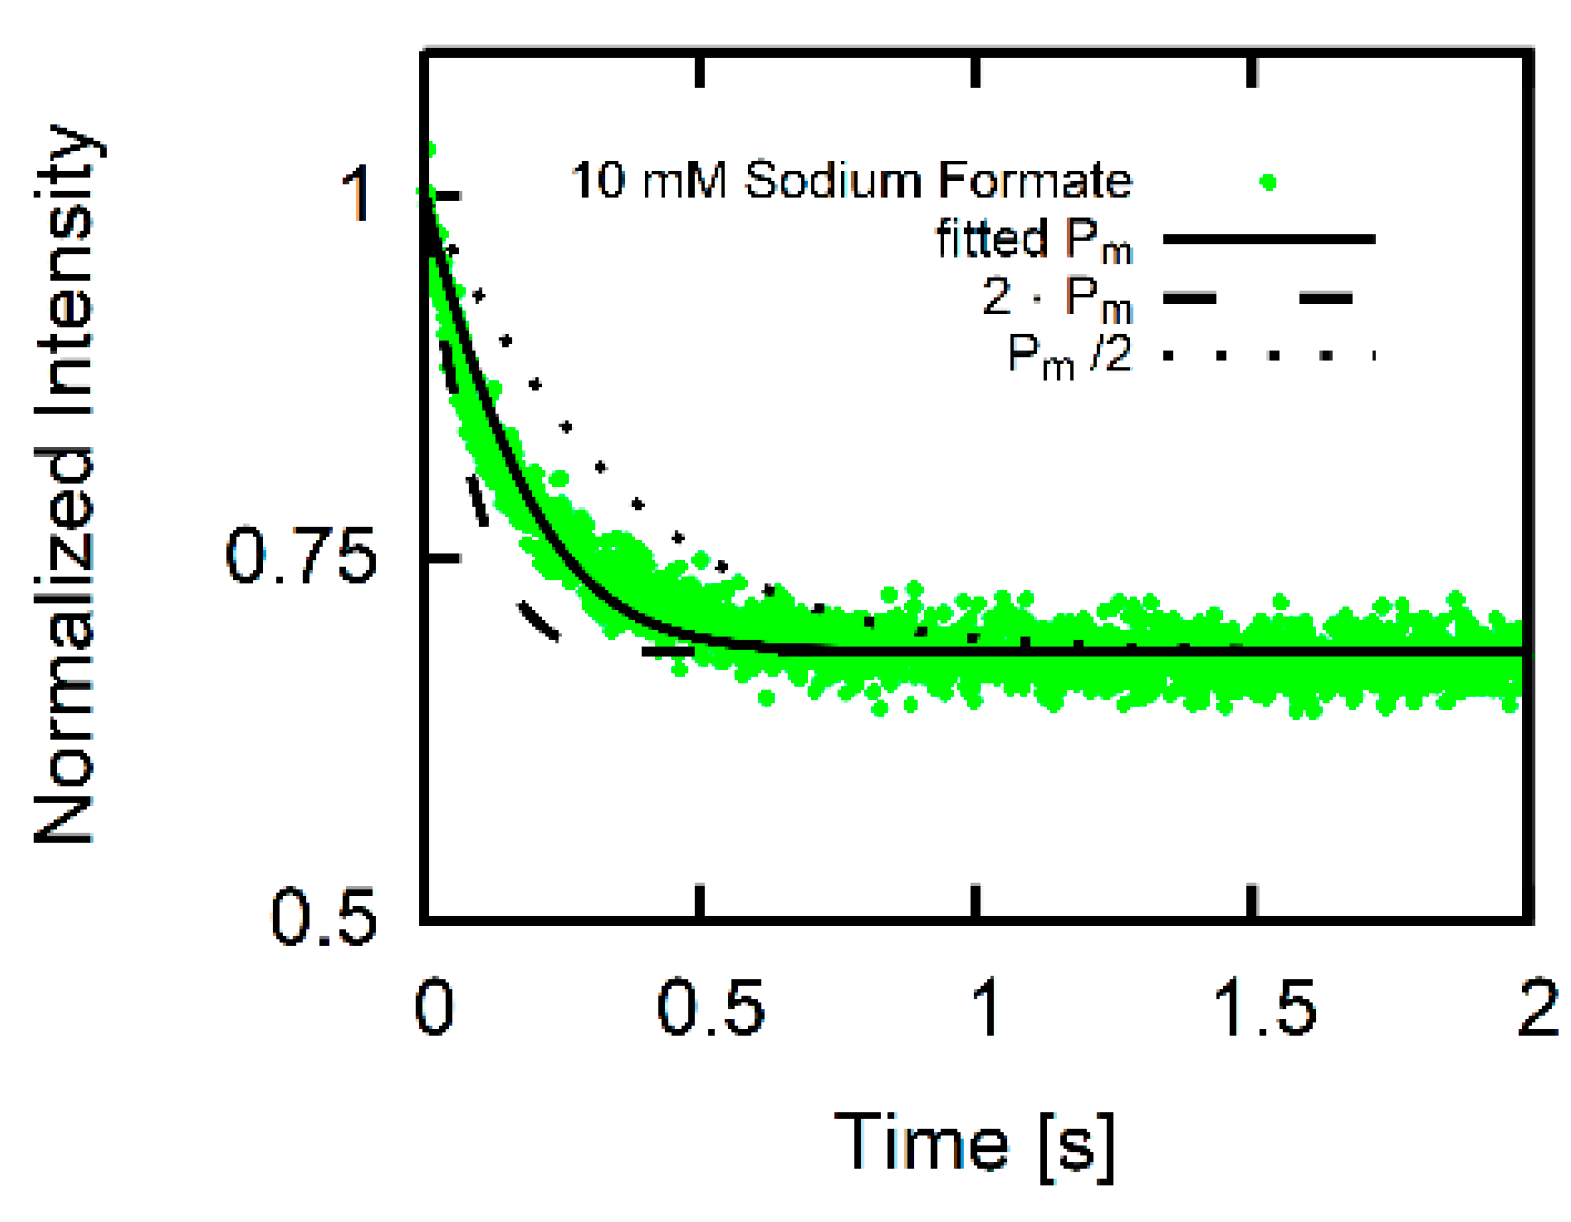
In order for our value to be correct, AH membrane translocation must be rate limiting. In other words, proton uptake and release must occur at higher rates [8]. Model calculations confirm that the time constant of ’s decay is sensitive to . That is, doubling or cutting it in half results in an obvious misfit of to (Figure 5).
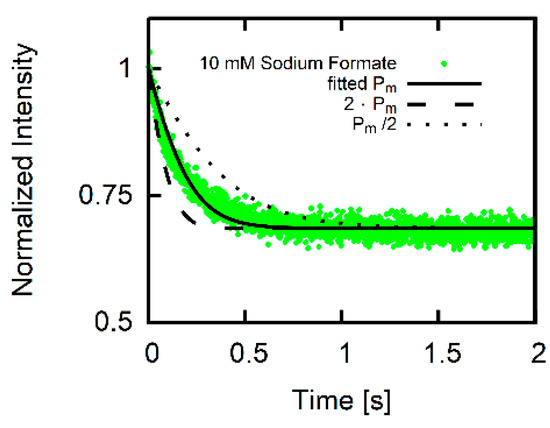
Figure 5.
Sensitivity of the fit to Fluorescence trace for 10 mM sodium formate and 10 mM MES (middle trace of middle panel in Figure 4) together with the result of the fitting procedure (solid black line). Curves for double (dashed black line) or half (dotted black line) the fitted reveals that the algorithm calculates traces sensitive for changes in .
Our value agrees very well with that was obtained for solvent depleted planar bilayers [42]. But it tenfold exceeds the one reported by an imaging study of acid uptake into cholesterol containing giant unilamellar vesicles (GUVs) [43]. Conceivably, the tenfold difference has to be attributed to peculiarities of the imaging study. Differences in the membrane compositions are likely to make a minor contribution. We came to that conclusion because to acetic acid also differed by an order of magnitude between the imaging study [43] and a previous scanning electrochemical microscopy study [9], although cholesterol was present in both studies.
The neglect of buffers in the imaging study [43] may provide a clue. In contrast to the theoretical analysis of that study, we observed slower kinetics for higher ratios of buffer concentration to in our experiment (Figure 4). We have previously observed a similar dependence of the acid/base flux on buffer concentration in our scanning electrochemical microscopy studies [9,10].
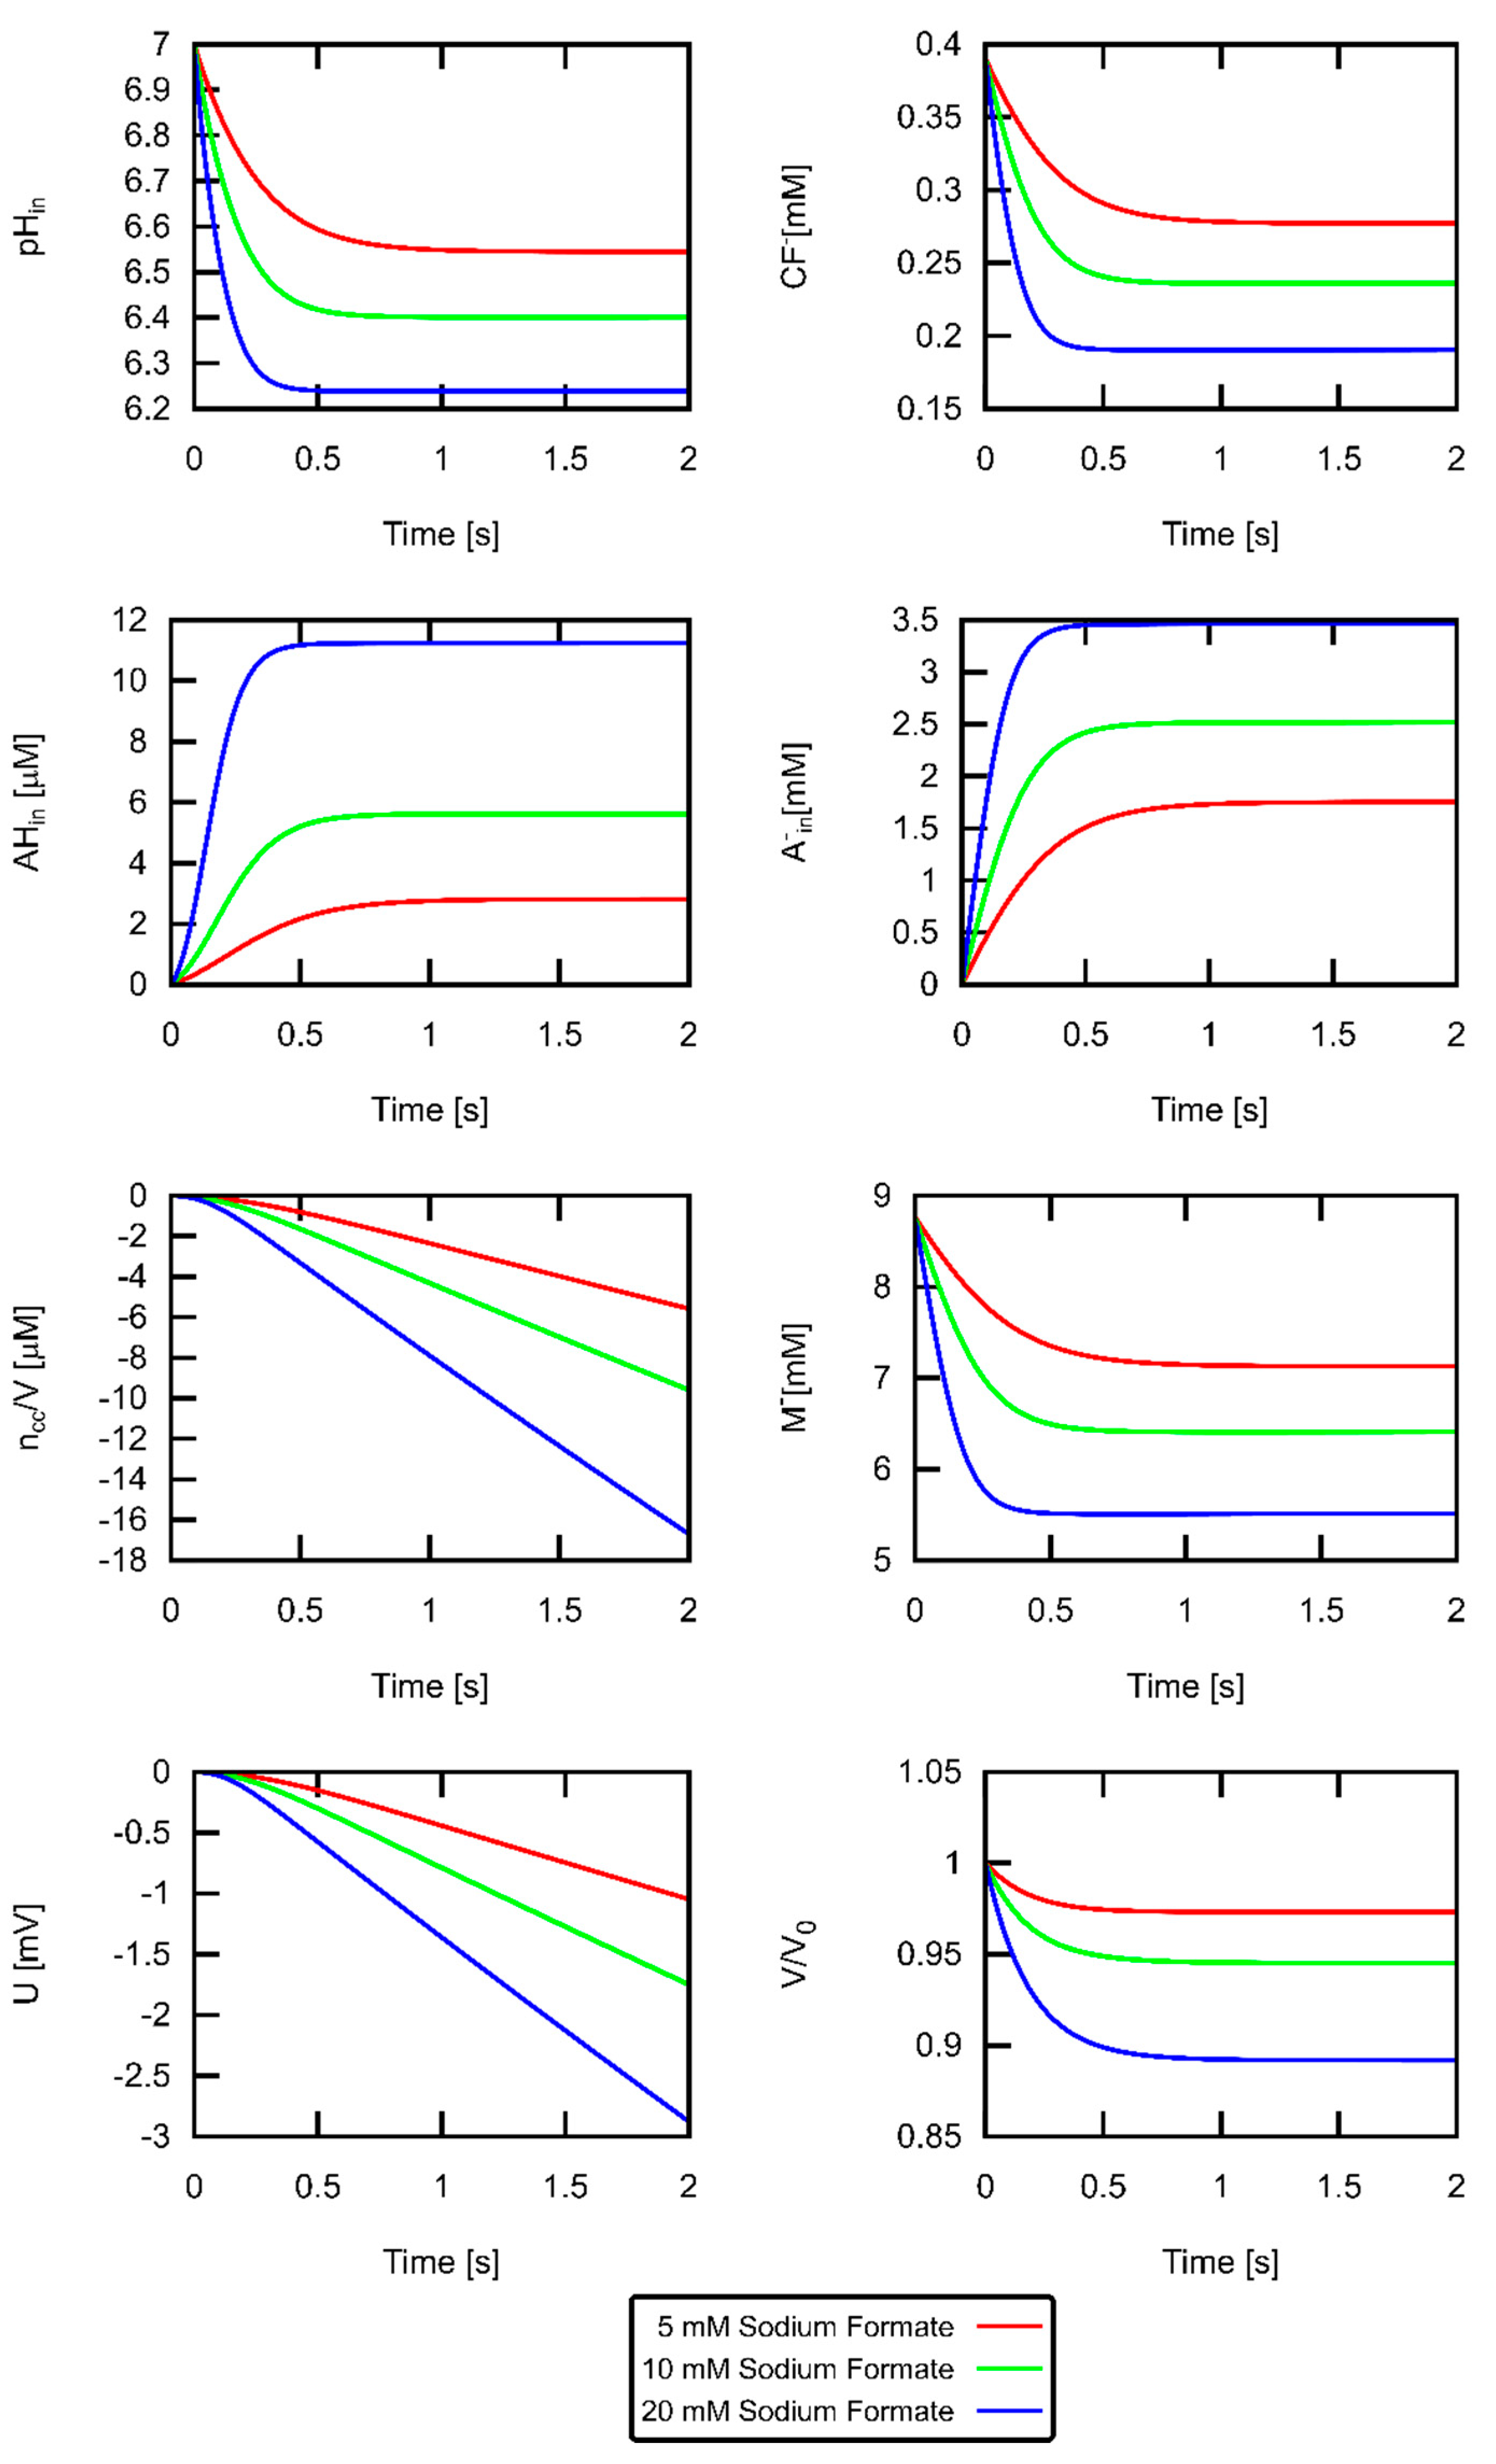
To illustrate the importance of buffer effects, we plotted the large changes of intravesicular pH for different weak acid concentrations (Figure 6). For the highest acid concentration (conditions of middle panel of Figure 4), the pH drop halved . The fluorescence signal is proportional to that also changes with the same time constant. It is important to note that the chemical reactions of , , and are not rate limiting in our experiments—as Figure 5 confirms. They take place much faster than the permeation of formic acid. The 10% decrease in volume occurred with a somewhat slower time constant as the pH drop due to the limited water permeability. The changes of the impermeable are much more pronounced than those of the permeable . Finally, we show the time course of how (here depicted as ) charges the membrane, thereby giving rise to .
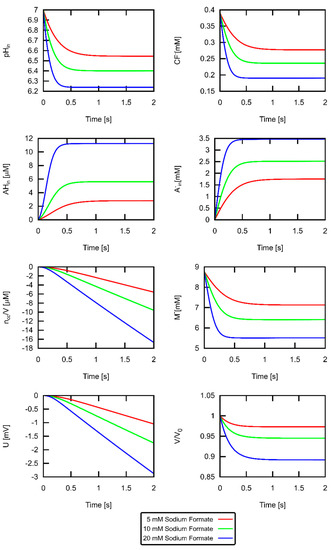
Figure 6.
The effect of external weak acid concentration on acid uptake, vesicle volume and membrane voltage. Quantities (, concentration of unprotonated dye , relative vesicle volume , concentration of protonated and deprotonated acid , , net concentration of protons that have permeated , concentration of unprotonated buffer , and the transmembrane potential ) extracted from the fit of to in Figure 4 (middle panel, 10 mM MES). The sodium formate gradient is denoted in the key.
In contrast, protons do not reach their electrochemical equilibrium. They leak too slowly across the membrane to significantly affect (and thus ) on the experimental timescale. Consequently, is much smaller than proton’s Nernst potential of 30–60 mV (Figure 6). Even a tenfold higher would result in only an insignificant decrease of as revealed by our model calculations. To illustrate this fact, Figures S2 and S3 show the corresponding fitting results for the experiment displayed in the middle panel of Figure 4. The tenfold elevated would decrease the calculated from 34.9 µm/s to 34.3 µm/s.
Small deviations between the experimental traces and the calculated traces (Figure 4) may be accounted for by vesicle polydispersity. This view is supported by vesicle volume distribution (Figure 2) that shows the presence of vesicles with diameters >100 nm.
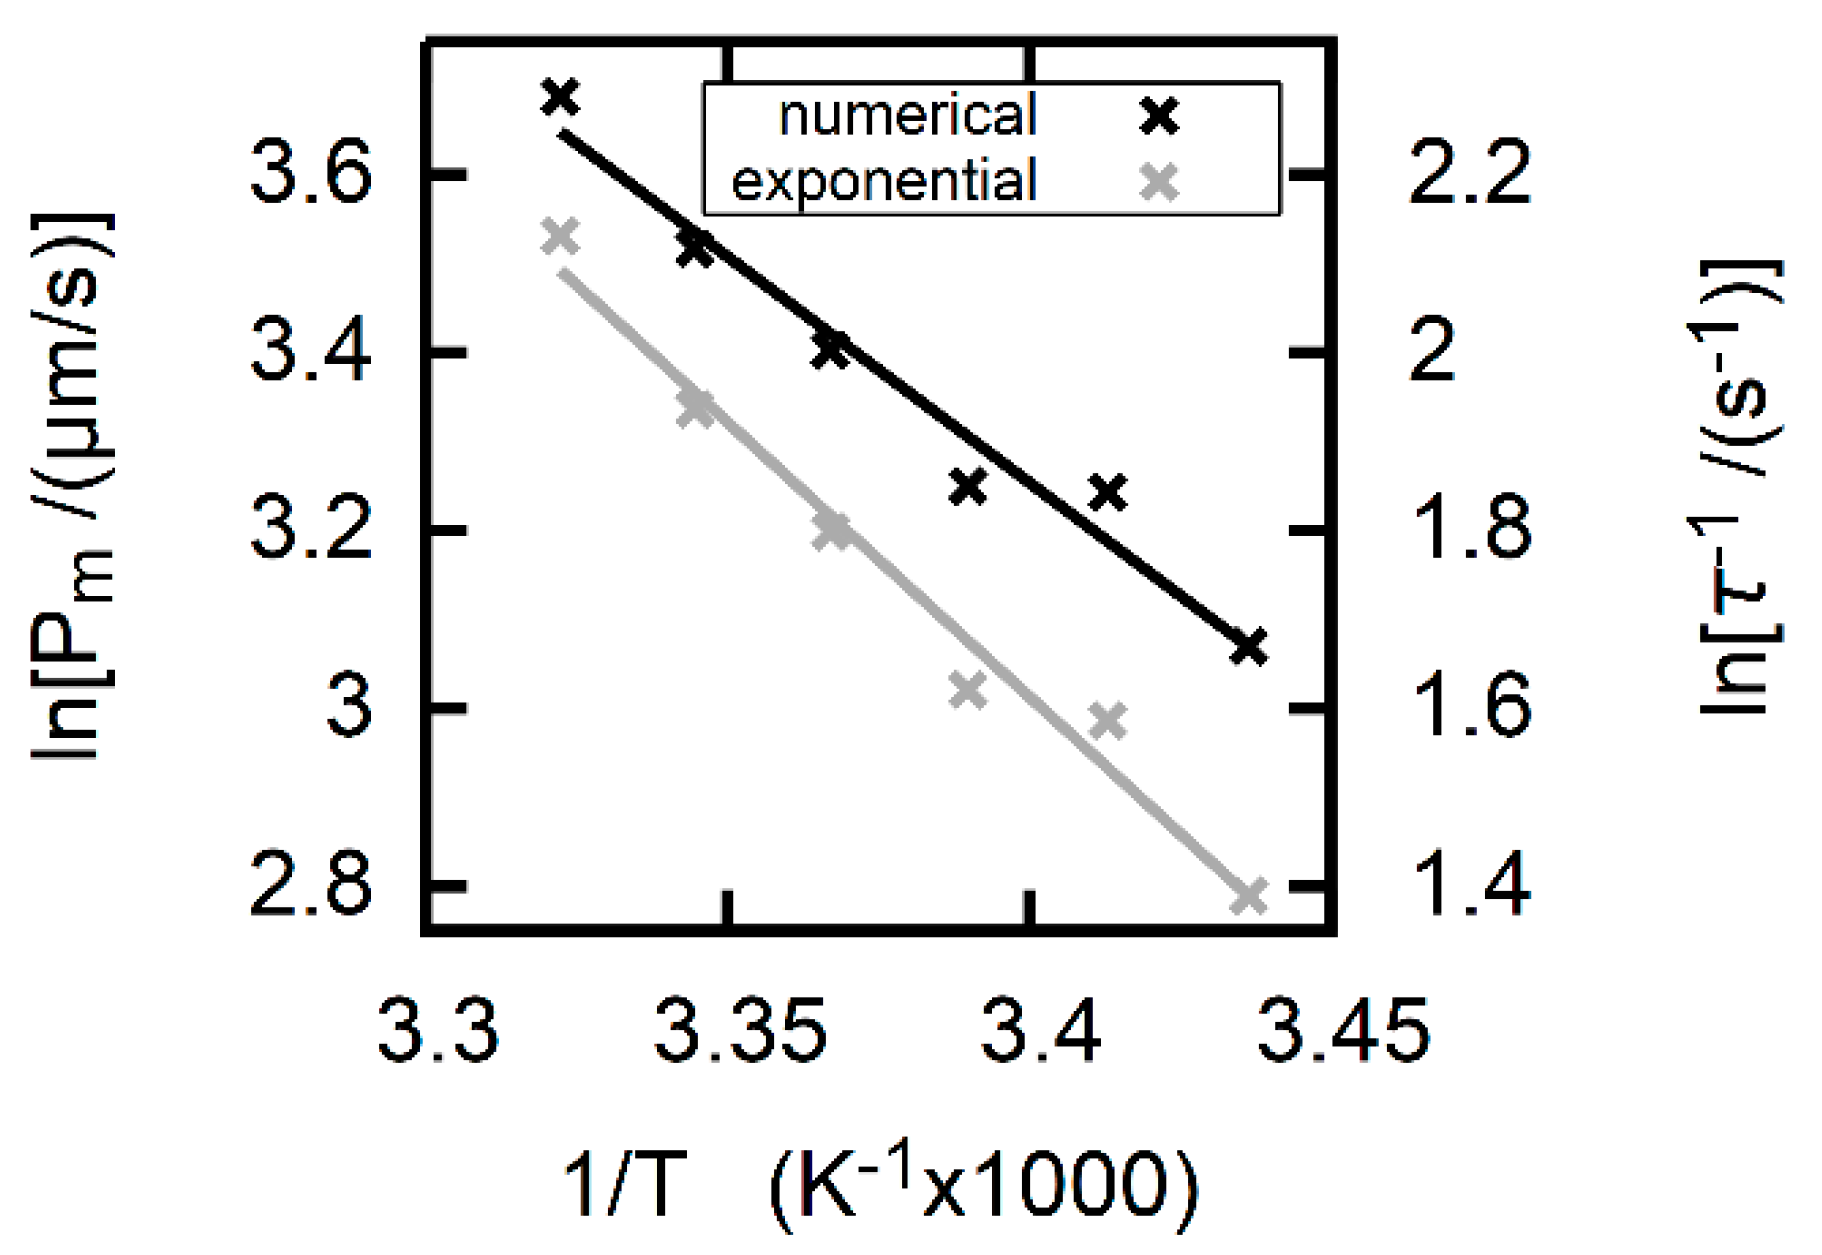
The Arrhenius plot of (Figure 7) revealed for formic acid permeation through DOPC bilayers. In contrast, the Arrhenius plot of yielded . We obtained by fitting the simple mono-exponential function to (Figure S4). The time dependence of and (Equation (6)) must be identical if (i) buffer capacity is time invariant (as assumed for the derivation of Equation (6)) and (ii) the CF fluorescence intensity is proportional to pH.
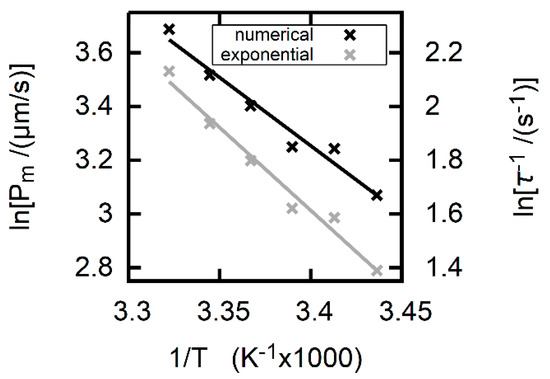
Figure 7.
Arrhenius plots for the uptake of formic acid into DOPC vesicles. The temperature increased from 18 °C to 28 °C in steps of 2 °C. The temperature dependence of (obtained from fitting to ) indicates an activation energy . If calculated from (Equation (6)), EA amounts to (gray, right axis). The different values indicate that the time constant τ of an exponential fit to is not proportional to , and thus Equation (6) cannot be used to calculate . The traces and fits are shown in Figure S4. The external concentration of sodium formate was equal to 20 mM. For the remaining experimental conditions please see the legend to the lower panel of Figure 4.
The different values indicate that is not proportional to . This observation is in sharp contrast to Equation (6). We conclude that Equation (6) represents an inadequate approximation to the system of Equations (10)–(16), i.e., should not be used for calculations of .
4. Discussion
Our study advances the current methodology of determining of weak acids by proposing an analytical model that accounts for the significant impact of buffer molecules on acid influx into large unilamellar vesicles. In contrast to previous models, it allows for intravesicular buffer expenditure. This is a “conditio-sine-qua-non” of extracting from the time course of intravesicular pH, because buffer molecules are ubiquitously present, e.g., in terms of (i) fluorescent pH indicators, (ii) the permeating weak acid itself, and (iii) additionally added proton acceptors or donors. Our model also accounts for the effects that both the uptake driven decrease in and variations in exert on intravesicular buffer capacity.
Most importantly, the model exposes the often assumed proportionality between and (Equations (6)) as a misconception. Other processes appear to contribute to in addition to membrane permeation. In consequence, the values of EA that can be derived from the temperature dependencies of and differ significantly from each other (Figure 7).
An illustrative example for the ill use of a proportionality between and is provided by investigations of CO2 membrane permeability. The corresponding attempts to determine CO2 membrane permeability by stopped-flow experiments [7,44] resulted in severe underestimations, i.e., in Pm values that were orders of magnitude smaller than those determined in experiments under steady state conditions on planar lipid bilayers [45,46,47]. Neither cholesterol-free nor cholesterol-containing bilayers provide a barrier to CO2 under the conditions that were chosen for the stopped flow experiments. Calculations to the contrary were flawed by the assumption of a time invariant buffer capacity [44]. Accordingly, a non-realistic delay in CO2 uptake kinetics beyond the dead time of the device was predicted. However, in the actual experiment, the buffer was rapidly exhausted. As illustrated by Figure 4, a decreased buffer capacity acts to accelerate uptake kinetics. Accordingly, pH must have dropped much faster than anticipated by the CO2 uptake calculations. Our analysis is supported by the observation that cholesterol decreases the permeability to other small molecules like O2 [48] and H2O [35] less than tenfold. Thus, the thousand-fold decrease in CO2 permeability as derived from the stopped flow experiments is unreasonable, unless cholesterol were to act specifically on CO2 permeation.
Figure 6 reports that V reaches steady state slower than does. That is, the osmotic response would not provide a proper read-out for acid uptake kinetics in our experiments. Even if Pf was enhanced (e.g., by aquaporin reconstitution) to render osmosis non-rate limiting, τ was to remain the sole readout parameter. As outlined above, τ (Equation (6)) cannot be used to calculate , because buffer effects on acid flux kinetics are not properly taken into account. Thus, values deduced from osmotic measurements [12,49] may not be accurate. Our analysis does not question estimates for solutes that do not undergo chemical reactions (e.g., urea [50])
Deprotonation rates of buffer molecules and fluorophores may represent another caveat of vesicular uptake studies. That is, in case of fast permeating acids, the accompanying chemical reactions cannot always be regarded as instantaneous. They may limit the kinetics for substances with neutral or basic pK values, because proton release takes tens or hundreds of milliseconds [18]. In consequence, uptake studies of drugs like propranolol or verapamil (with pK values of 9.5 and 8.9, respectively) [51] may not reveal , because deprotonation occurs much slower than membrane transport [8]. Our theoretical model explicitly accounts for the reaction rates. That is, the impact of on the acidification kinetics may easily be verified (Figure 5).
5. Conclusions
Kinetics and extent of the fluorescence intensity response of dye-loaded vesicles to acid gradients depend on luminal buffer concentration (Figure 6). Since fast uptake kinetics requires fast acquisition, filtering and averaging of noisy fluorescent signals is of limited value. In consequence, comparatively large pH changes are induced to detect the signal behind the fluorescence noise. In turn, buffer exhaustion must be taken into account. In addition, calculation of Pm must generally be performed with respect to (i) the protonation and deprotonation rates of the substance of interest, (ii) proton leak, (iii) osmotic volume flow, and (iv) water self-dissociation.
The formalism presented in this paper is applicable to the permeation of weak acids and beyond. It can easily be expanded to the permeation of other solutes: (α) weak bases and (β) solutes that do not undergo chemical reactions but induce measureable volume changes instead.
Supplementary Materials
The following are available online at http://www.mdpi.com/2218-273X/9/2/63/s1. Figure S1: pH titration of carboxyfluorescein (CF) at 22 °C and 4 °C; Figure S2: Evaluation of acid influx with varying proton permeability; Figure S3: Quantities underlying the evaluation of Figure S2. Figure S4: Temperature dependent acid influx traces;
Author Contributions
Data curation, C.H.; Investigation, C.H.; Formal Analysis, C.H.; Software, C.H.; Data curation, T.B.; Data curation, H.P.; Project administration, P.P.; Resources, P.P.; Writing—original draft, C.H.; Writing—review & editing, P.P.
Funding
This research received no external funding.
Acknowledgments
Supported by Johannes Kepler University Linz Open Access Publishing Fund.
Conflicts of Interest
The authors declare no conflict of interest.
References
- Schanker, L.S.; Shore, P.A.; Brodie, B.B.; Hogben, C.A. Absorption of drugs from the stomach. I. The rat. J. Pharmacol. Exp. Ther. 1957, 120, 528–539. [Google Scholar] [PubMed]
- Schanker, L.S.; Tocco, D.J.; Brodie, B.B.; Hogben, C.A. Absorption of drugs from the rat small intestine. J. Pharmacol. Exp. Ther. 1958, 123, 81–88. [Google Scholar] [PubMed]
- Saparov, S.M.; Antonenko, Y.N.; Pohl, P. A new model of weak acid permeation through membranes revisited: Does overton still rule? Biophys. J. 2006, 90, L86–L88. [Google Scholar] [CrossRef] [PubMed]
- Madden, T.D.; Harrigan, P.R.; Tai, L.C.; Bally, M.B.; Mayer, L.D.; Redelmeier, T.E.; Loughrey, H.C.; Tilcock, C.P.; Reinish, L.W.; Cullis, P.R. The accumulation of drugs within large unilamellar vesicles exhibiting a proton gradient: A survey. Chem. Phys. Lipids 1990, 53, 37–46. [Google Scholar] [CrossRef]
- Missner, A.; Kugler, P.; Antonenko, Y.N.; Pohl, P. Passive transport across bilayer lipid membranes: Overton continues to rule. Proc. Natl. Acad. Sci. USA 2008, 105, E123. [Google Scholar] [CrossRef] [PubMed]
- Lande, M.B.; Priver, N.A.; Zeidel, M.L. Determinants of apical membrane permeabilities of barrier epithelia. Am. J. Physiol. Cell Physiol. 1994, 267, C367–C374. [Google Scholar] [CrossRef]
- Yang, B.; Fukuda, N.; van Hoek, A.; Matthay, M.A.; Ma, T.; Verkman, A.S. Carbon dioxide permeability of aquaporin-1 measured in erythrocytes and lung of aquaporin-1 null mice and in reconstituted proteoliposomes. J. Biol. Chem. 2000, 275, 2686–2692. [Google Scholar] [CrossRef]
- Sezer, D.; Oruc, T. Protonation kinetics compromise liposomal fluorescence assay of membrane permeation. J. Phys. Chem. B 2017, 121, 5218–5227. [Google Scholar] [CrossRef]
- Antonenko, Y.N.; Denisov, G.A.; Pohl, P. Weak acid transport across bilayer lipid membrane in the presence of buffers. Theoretical and experimental pH profiles in the unstirred layers. Biophys. J. 1993, 64, 1701–1710. [Google Scholar] [CrossRef]
- Antonenko, Y.N.; Pohl, P.; Denisov, G.A. Permeation of ammonia across bilayer lipid membranes studied by ammonium ion selective microelectrodes. Biophys. J. 1997, 72, 2187–2195. [Google Scholar] [CrossRef]
- Hannesschlaeger, C.; Pohl, P. Membrane permeabilities of ascorbic acid and ascorbate. Biomolecules 2018, 8, 73. [Google Scholar] [CrossRef] [PubMed]
- Rothert, M.; Ronfeldt, D.; Beitz, E. Electrostatic attraction of weak monoacid anions increases probability for protonation and passage through aquaporins. J. Biol. Chem. 2017, 292, 9358–9364. [Google Scholar] [CrossRef] [PubMed]
- Nichols, J.W.; Deamer, D.W. Net proton-hydroxyl permeability of large unilamellar liposomes measured by an acid-base titration technique. Proc. Natl. Acad. Sci. USA 1980, 77, 2038–2042. [Google Scholar] [CrossRef] [PubMed]
- Deamer, D.W.; Nichols, J.W. Proton-hydroxide permeability of liposomes. Proc. Natl. Acad. Sci. USA 1983, 80, 165–168. [Google Scholar] [CrossRef] [PubMed]
- Goldman, D.E. Potential, impedance, and rectification in membranes. J. Gen. Physiol. 1943, 27, 37–60. [Google Scholar] [CrossRef] [PubMed]
- Hodgkin, A.L.; Katz, B. The effect of sodium ions on the electrical activity of giant axon of the squid. J. Physiol. 1949, 108, 37–77. [Google Scholar] [CrossRef] [PubMed]
- Hille, B. Ionic Channels of Excitable Membranes; Sinauer Associates: Franklin County, MA, USA, 1984; p. 230. [Google Scholar]
- Gutman, M.; Nachliel, E. The dynamic aspects of proton-transfer processes. Biochim. Biophys. Acta 1990, 1015, 391–414. [Google Scholar] [CrossRef]
- Chen, R.F.; Knutson, J.R. Mechanism of fluorescence concentration quenching of carboxyfluorescein in liposomes—Energy-transfer to nonfluorescent dimers. Anal. Biochem. 1988, 172, 61–77. [Google Scholar] [CrossRef]
- Wolfram Research, I. Mathematica, version 11.2; Wolfram Research, Inc.: Champaign, IL, USA, 2017. [Google Scholar]
- Hindmarsh, A.C.; Taylor, A.G. User documentation for IDA, a differential-algebraic equation solver for sequential and parallel computers. In Lawrence Livermore National Laboratory Report; UCRL-MA-136910; Center for Applied Scientific Computing, University of California: Okland, CA, USA, 1999. [Google Scholar]
- Agmon, N. Hydrogen bonds, water rotation and proton mobility. J. Chim. Phys. Phys. Chim. Biol. 1996, 93, 1714–1736. [Google Scholar] [CrossRef]
- Sengers, J.V.; Watson, J.T.R. Improved international formulations for the viscosity and thermal-conductivity of water substance. J. Phys. Chem. Ref. Data 1986, 15, 1291–1314. [Google Scholar] [CrossRef]
- Mathai, J.C.; Sprott, G.D.; Zeidel, M.L. Molecular mechanisms of water and solute transport across archaebacterial lipid membranes. J. Biol. Chem. 2001, 276, 27266–27271. [Google Scholar] [CrossRef] [PubMed]
- Crank, J. The Mathematics of Diffusion, 2nd ed.; Clarendon Press: Oxford, UK, 1975; p. 51. [Google Scholar]
- Bittermann, K.; Goss, K.U. Predicting apparent passive permeability of Caco-2 and MDCK cell-monolayers: A mechanistic model. PLoS ONE 2017, 12, e0190319. [Google Scholar] [CrossRef] [PubMed]
- Pan, J.; Tristram-Nagle, S.; Kucerka, N.; Nagle, J.F. Temperature dependence of structure, bending rigidity, and bilayer interactions of dioleoylphosphatidylcholine bilayers. Biophys. J. 2008, 94, 117–124. [Google Scholar] [CrossRef] [PubMed]
- Missner, A.; Pohl, P. 110 years of the Meyer-Overton rule: Predicting membrane permeability of gases and other small compounds. Chemphyschem 2009, 10, 1405–1414. [Google Scholar] [CrossRef] [PubMed]
- Walter, A.; Hastings, D.; Gutknecht, J. Weak acid permeability through lipid bilayer-membranes—Role of chemical-reactions in the unstirred layer. J. Gen. Physiol. 1982, 79, 917–933. [Google Scholar] [CrossRef] [PubMed]
- Padro, J.M.; Acquaviva, A.; Tascon, M.; Gagliardi, L.G.; Castells, C.B. Effect of temperature and solvent composition on acid dissociation equilibria, i: Sequenced (s)(s)pKa determination of compounds commonly used as buffers in high performance liquid chromatography coupled to mass spectroscopy detection. Anal. Chim. Acta 2012, 725, 87–94. [Google Scholar] [CrossRef] [PubMed]
- Gutman, M. Application of the laser-induced proton pulse for measuring the protonation rate constants of specific sites on proteins and membranes. Method Enzymol. 1986, 127, 522–538. [Google Scholar]
- Good, N.E.; Winget, G.D.; Winter, W.; Connolly, T.N.; Izawa, S.; Singh, R.M.M. Hydrogen ion buffers for biological research. Biochemistry 1966, 5, 467–477. [Google Scholar] [CrossRef]
- Stillinger, F.H. Proton transfer reactions and kinetics in water. In Theoretical Chemistry: Advances and Perspectives; Eyring, H., Henderson, D., Eds.; Academic: New York, NY, USA, 1978; Volume 3, pp. 177–234. [Google Scholar]
- Marshall, W.L.; Franck, E.U. Ion product of water substance, 0–1000 °C, 1–10,000 bars—New international formulation and its background. J. Phys. Chem. Ref. Data 1981, 10, 295–304. [Google Scholar] [CrossRef]
- Tristram-Nagle, S.; Kim, D.J.; Akhunzada, N.; Kucerka, N.; Mathai, J.C.; Katsaras, J.; Zeidel, M.; Nagle, J.F. Structure and water permeability of fully hydrated diphytanoylPC. Chem. Phys. Lipids 2010, 163, 630–637. [Google Scholar] [CrossRef]
- Montal, M.; Mueller, P. Formation of bimolecular membranes from lipid monolayers and a study of their electrical properties. Proc. Natl. Acad. Sci. USA 1972, 69, 3561–3566. [Google Scholar] [CrossRef] [PubMed]
- Pohl, P.; Saparov, S.M.; Borgnia, M.J.; Agre, P. Highly selective water channel activity measured by voltage clamp: Analysis of planar lipid bilayers reconstituted with purified AqpZ. Proc. Natl. Acad. Sci. USA 2001, 98, 9624–9629. [Google Scholar] [CrossRef] [PubMed]
- Horner, A.; Pohl, P. Comment on “Enhanced water permeability and tunable ion selectivity in subnanometer carbon nanotube porins”. Science 2018, 359. [Google Scholar] [CrossRef] [PubMed]
- Papahadjopoulos, D.; Nir, S.; Oki, S. Permeability properties of phospholipid membranes: Effect of cholesterol and temperature. Biochim. Biophys. Acta 1972, 266, 561–583. [Google Scholar] [CrossRef]
- Vecer, J.; Herman, P.; Holoubek, A. Diffusion membrane potential in liposomes: Setting by ion gradients, absolute calibration and monitoring of fast changes by spectral shifts of diS-C3(3) fluorescence maximum. Biochim. Biophys. Acta 1997, 1325, 155–164. [Google Scholar] [CrossRef]
- Gutknecht, J. Proton conductance through phospholipid-bilayers—Water wires or weak acids. J. Bioenerg. Biomembr. 1987, 19, 427–442. [Google Scholar] [PubMed]
- Walter, A.; Gutknecht, J. Monocarboxylic acid permeation through lipid bilayer membranes. J. Membr. Biol. 1984, 77, 255–264. [Google Scholar] [CrossRef]
- Li, S.; Hu, P.C.; Malmstadt, N. Imaging molecular transport across lipid bilayers. Biophys. J. 2011, 101, 700–708. [Google Scholar] [CrossRef]
- Tsiavaliaris, G.; Itel, F.; Hedfalk, K.; Al-Samir, S.; Meier, W.; Gros, G.; Endeward, V. Low CO2 permeability of cholesterol-containing liposomes detected by stopped-flow fluorescence spectroscopy. FASEB J. 2015, 29, 1780–1793. [Google Scholar] [CrossRef]
- Missner, A.; Kugler, P.; Saparov, S.M.; Sommer, K.; Mathai, J.C.; Zeidel, M.L.; Pohl, P. Carbon dioxide transport through membranes. J. Biol. Chem. 2008, 283, 25340–25347. [Google Scholar] [CrossRef]
- Zocher, F.; Zeidel, M.L.; Missner, A.; Sun, T.T.; Zhou, G.; Liao, Y.; von Bodungen, M.; Hill, W.G.; Meyers, S.; Pohl, P.; et al. Uroplakins do not restrict CO2 transport through urothelium. J. Biol. Chem. 2012, 287, 11011–11017. [Google Scholar] [CrossRef] [PubMed]
- Gutknecht, J.; Bisson, M.A.; Tosteson, F.C. Diffusion of carbon dioxide through lipid bilayer membranes: Effects of carbonic anhydrase, bicarbonate, and unstirred layers. J. Gen. Physiol. 1977, 69, 779–794. [Google Scholar] [CrossRef] [PubMed]
- Widomska, J.; Raguz, M.; Subczynski, W.K. Oxygen permeability of the lipid bilayer membrane made of calf lens lipids. Biochim. Biophys. Acta (BBA)—Biomembr. 2007, 1768, 2635–2645. [Google Scholar] [CrossRef]
- Werber, J.R.; Elimelech, M. Permselectivity limits of biomimetic desalination membranes. Sci. Adv. 2018, 4, eaar8266. [Google Scholar] [CrossRef] [PubMed]
- Verkman, A.S.; Dix, J.A.; Seifter, J.L. Water and urea transport in renal microvillus membrane vesicles. Am. J. Physiol. 1985, 248, F650–F655. [Google Scholar] [CrossRef] [PubMed]
- Eyer, K.; Paech, F.; Schuler, F.; Kuhn, P.; Kissner, R.; Belli, S.; Dittrich, P.S.; Kramer, S.D. A liposomal fluorescence assay to study permeation kinetics of drug-like weak bases across the lipid bilayer. J. Control Release 2014, 173, 102–109. [Google Scholar] [CrossRef] [PubMed]

© 2019 by the authors. Licensee MDPI, Basel, Switzerland. This article is an open access article distributed under the terms and conditions of the Creative Commons Attribution (CC BY) license (http://creativecommons.org/licenses/by/4.0/).