Significant Changes in Metabolic Profiles after Intervention with Selenium and Coenzyme Q10 in an Elderly Population


 ,
,  , and
, and
Abstract
1. Introduction
2. Results
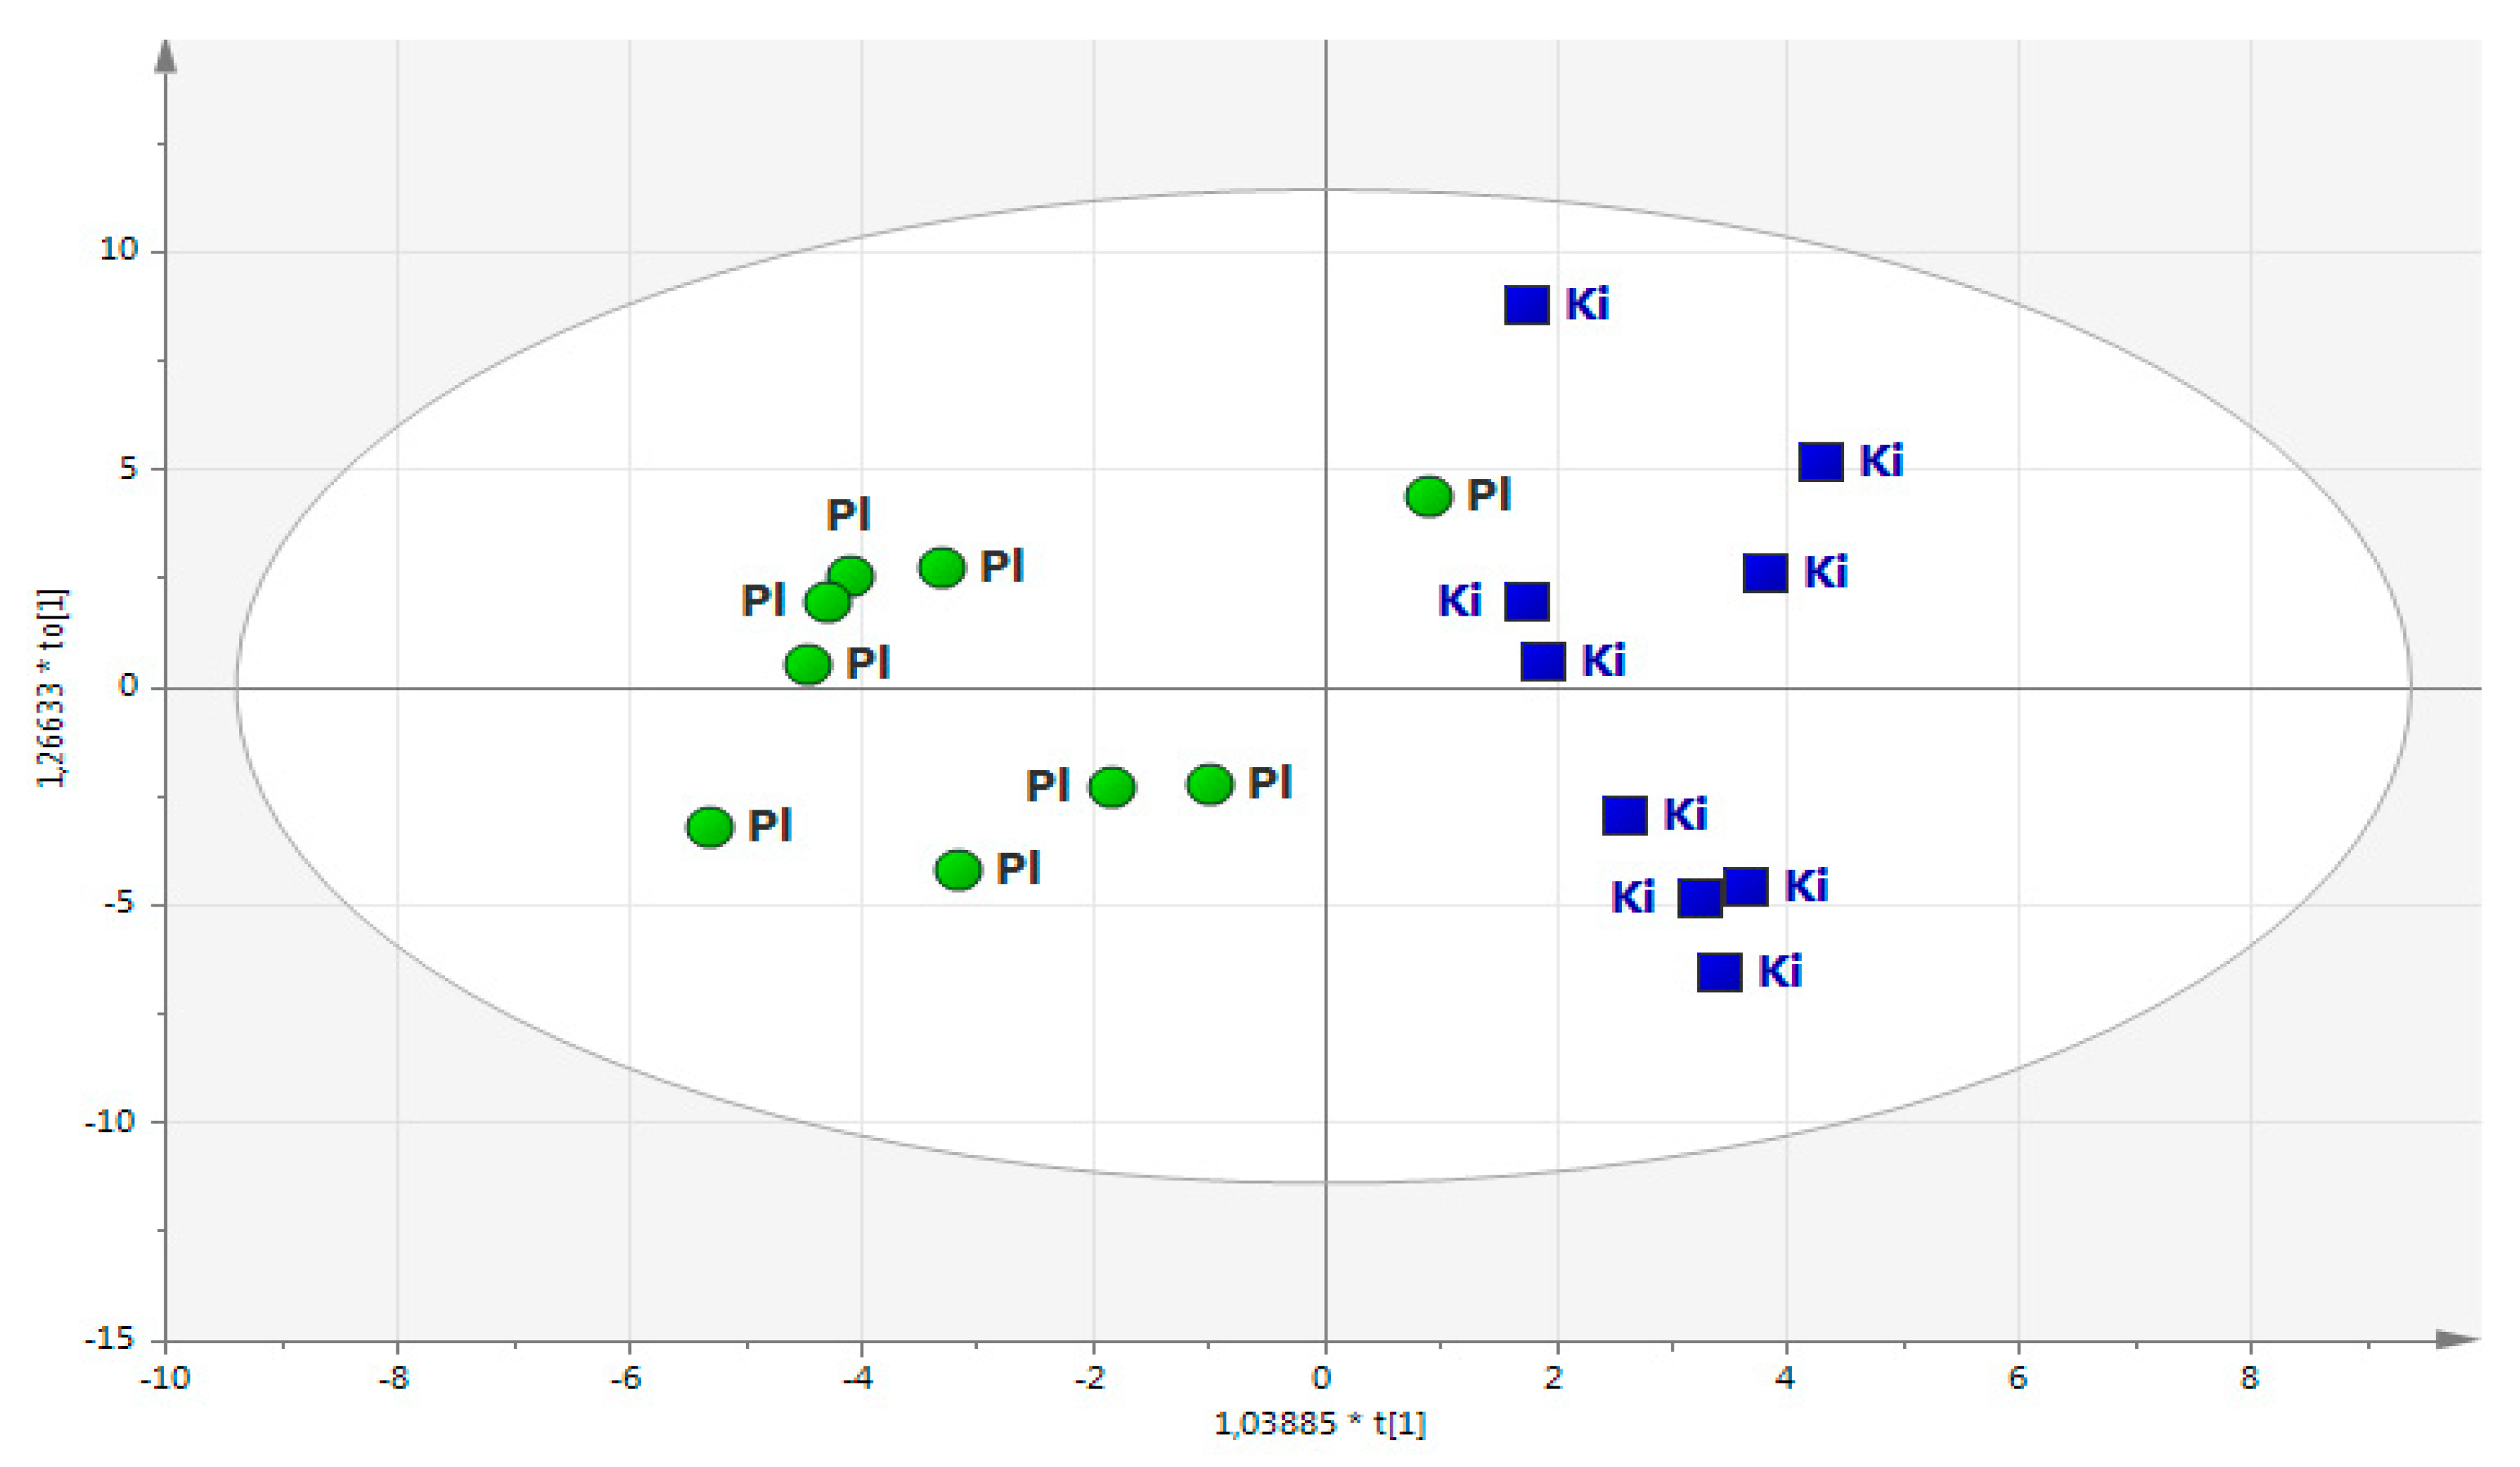
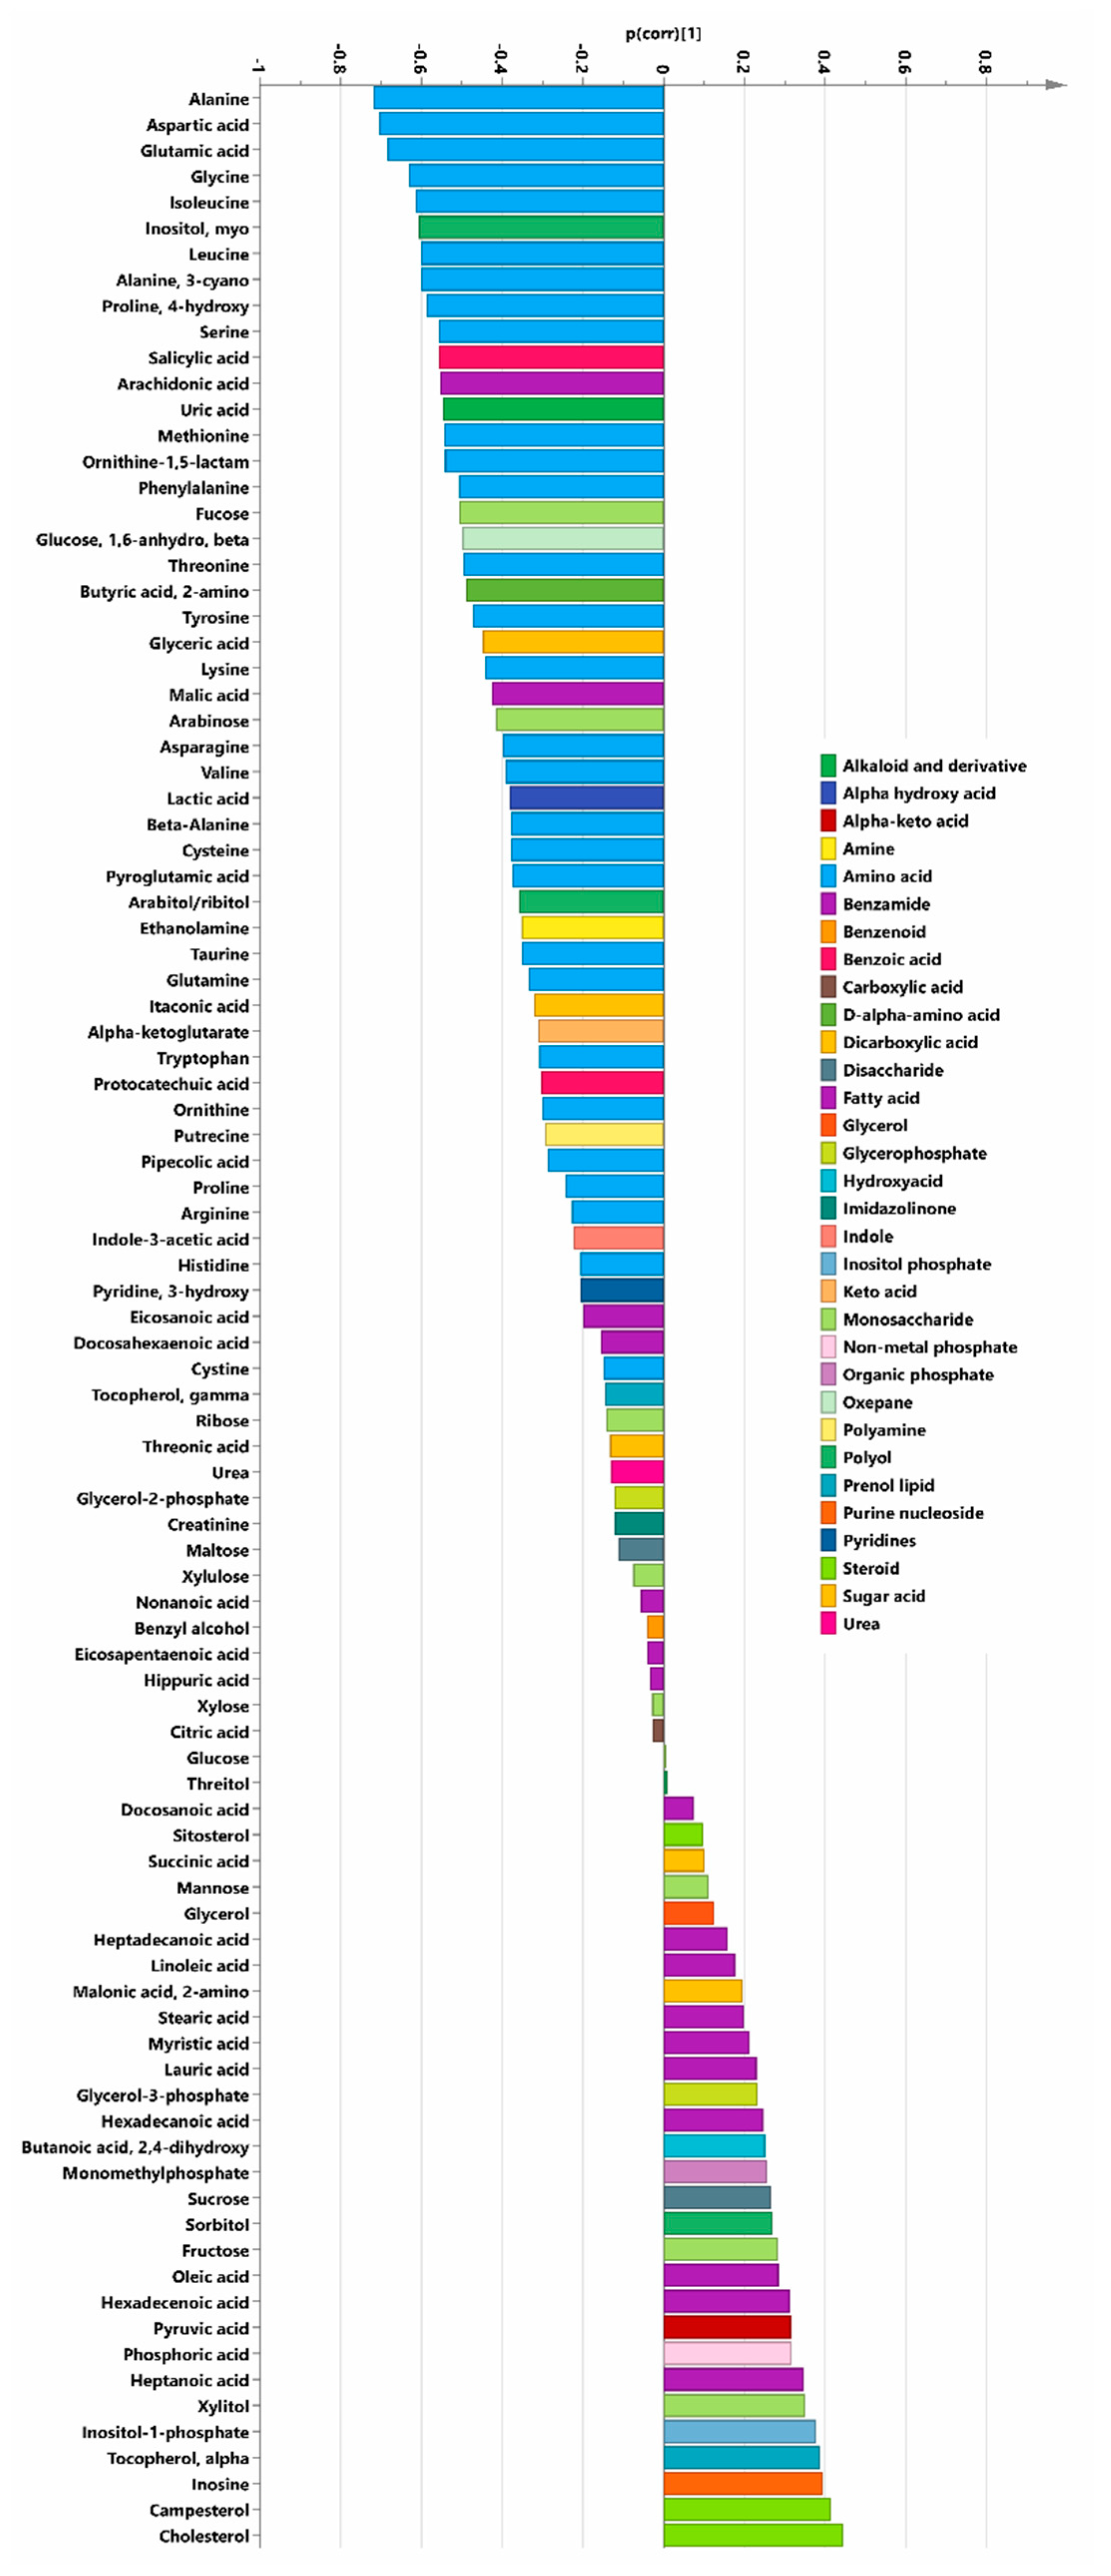
2.1. Main Study
2.2. Projection of Deceased Participants
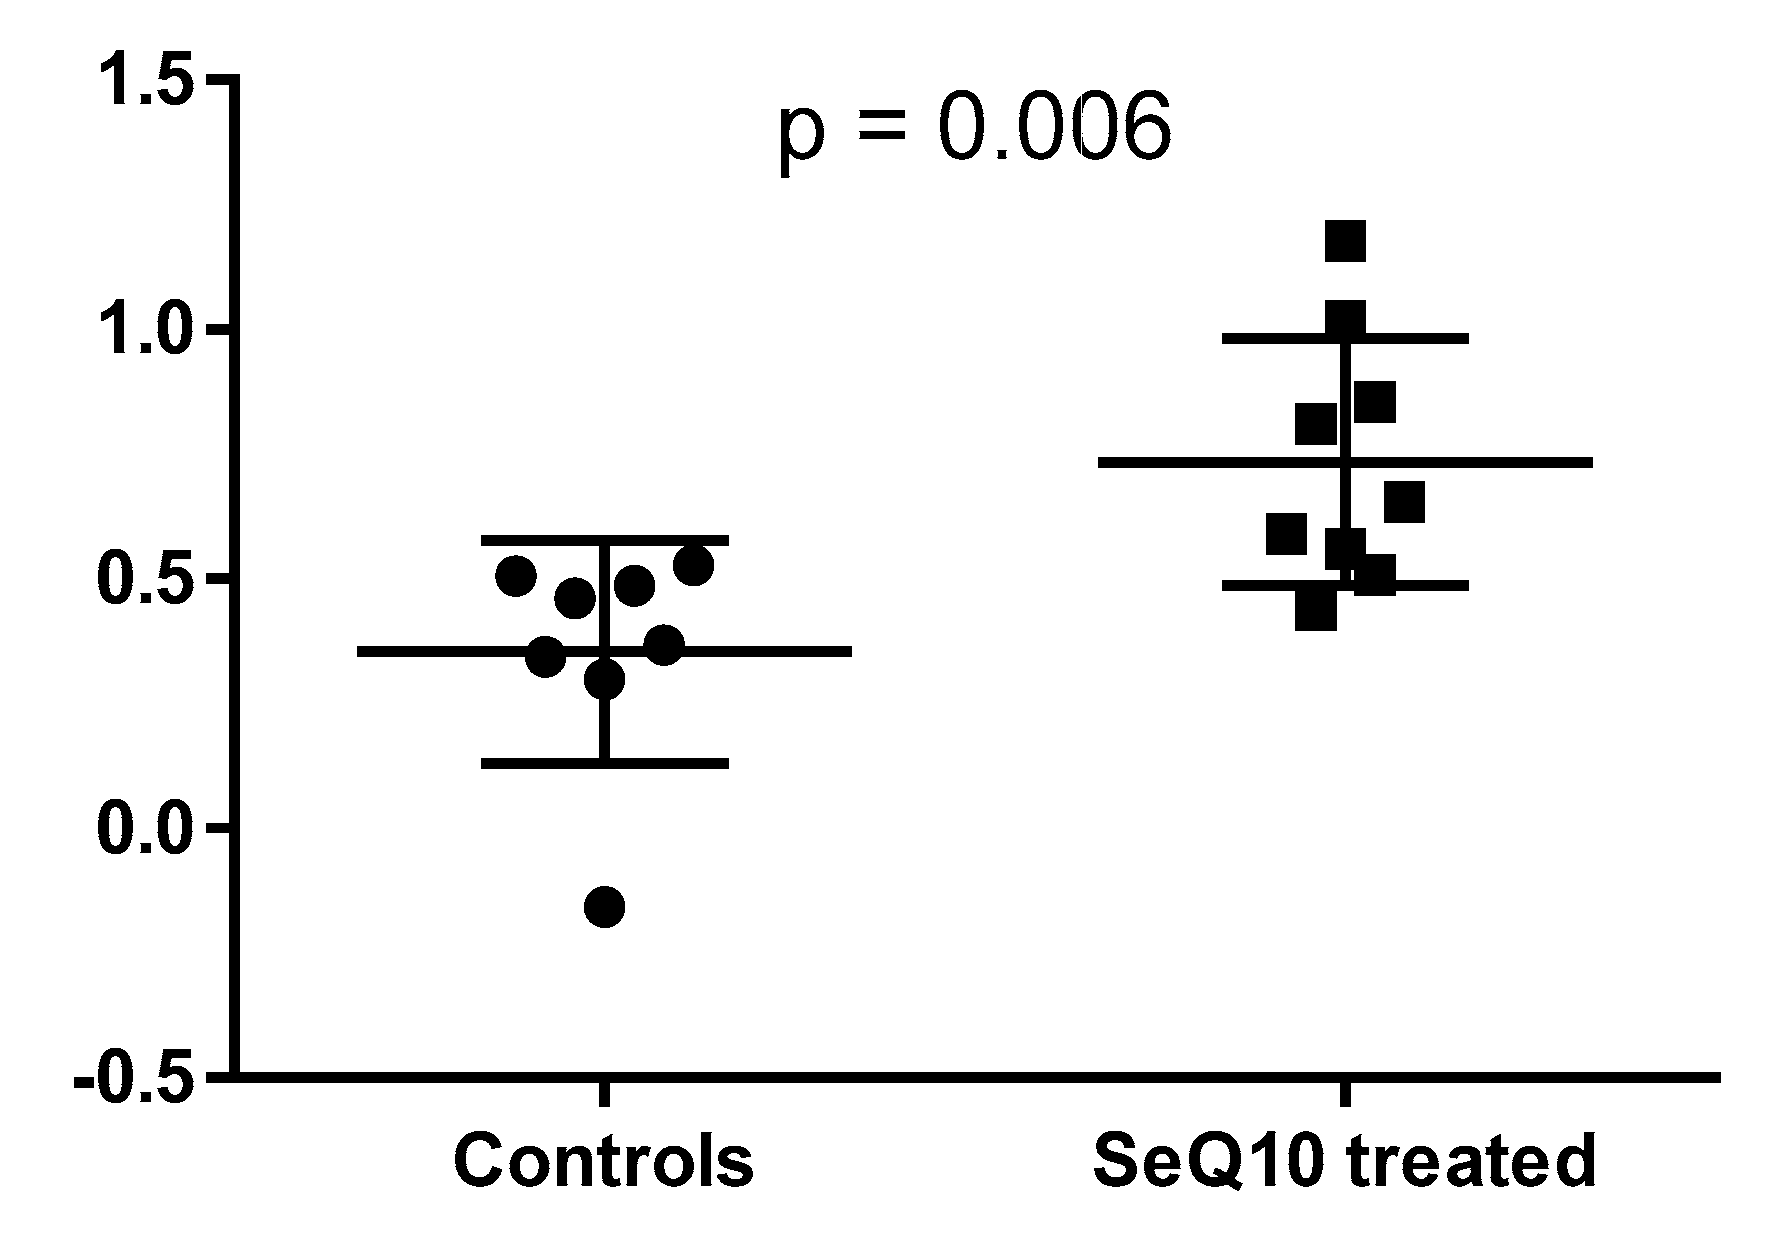
2.3. Validation Studies
2.4. Validation Studies 1 and 2
3. Discussion
3.1. Biochemical Pathways Altered by the Intervention with SeQ10
3.2. General Effects of SeQ10 Treatment
4. Material
4.1. Aim
4.2. Design
5. Methods
5.1. Echocardiography
5.2. Blood Samples
5.3. Sample Selection
5.4. Main Study
5.5. Validation Studies
5.5.1. Validation Study 1
5.5.2. Validation Study 2
5.6. Metabolomic Profiling
5.6.1. Metabolite Analysis (Extraction, Quantification and Identification)
5.6.2. Statistical Analysis
Univariate Statistics
Multivariate Data Analysis
OPLS-DA Models
Data Normalisation
6. Conclusions
Author Contributions
Funding
Conflicts of Interest
References
- Rayman, M.P. Selenium and human health. Lancet 2012, 379, 1256–1268. [Google Scholar] [CrossRef]
- Selenius, M.; Rundlöf, A.K.; Olm, E.; Fernandes, A.P.; Björnstedt, M. Selenium and the Selenoprotein Thioredoxin Reductase in the Prevention, Treatment and Diagnostics of Cancer. Antioxid. Redox Signal. 2010, 12, 867–880. [Google Scholar] [CrossRef] [PubMed]
- Huang, Z.; Rose, A.H.; Hoffmann, P.R. The Role of Selenium in Inflammation and Immunity: From Molecular Mechanisms to Therapeutic Opportunities. Antioxid. Redox Signal. 2012, 16, 705–743. [Google Scholar] [CrossRef] [PubMed]
- Fairweather-Tait, S.J.; Bao, Y.; Broadley, M.R.; Collings, R.; Ford, D.; Hesketh, J.E.; Hurst, R. Selenium in Human Health and Disease. Antioxid. Redox Signal. 2011, 14, 1337–1383. [Google Scholar] [CrossRef]
- Yang, G.; Zhou, R. Further observations on the human maximum safe dietary selenium intake in a seleniferous area of China. J. Trace Elem. Electrolytes Health Dis. 1994, 8, 159–165. [Google Scholar]
- Cheng, Y.Y.; Qian, P.C. The effect of selenium-fortified table salt in the prevention of Keshan disease on a population of 1.05 million. Biomed. Environ. Sci. 1990, 3, 422–428. [Google Scholar]
- Akbaraly, N.T.; Arnaud, J.; Hininger-Favier, I.; Gourlet, V.; Roussel, A.-M.; Berr, C. Selenium and Mortality in the Elderly: Results from the EVA Study. Clin. Chem. 2005, 51, 2117–2123. [Google Scholar] [CrossRef]
- Adame, E.M.; Florea, D.; Pérez, L.S.; López, J.M.; López-González, B.; De La Cruz, A.P.; Del Pozo, E.P. Deficient selenium status of a healthy adult Spanish population. Nutrición Hospitalaria 2012, 27, 524–528. [Google Scholar]
- Letsiou, S.; Nomikos, T.; Panagiotakos, D.; Pergantis, S.A.; Fragopoulou, E.; Antonopoulou, S.; Pitsavos, C.; Stefanadis, C. Serum total selenium status in Greek adults and its relation to age. The ATTICA study cohort. Biol. Trace Elem. Res. 2009, 128, 8–17. [Google Scholar] [CrossRef]
- Benes, B.; Spevácková, V.; Smíd, J.; Batáriová, A.; Cejchanová, M.; Zítková, L. Effects of age, BMI, smoking and contraception on levels of Cu, Se and Zn in the blood of the population in the Czech Republic. Central Eur. J. Public Health 2005, 13, 202–207. [Google Scholar]
- Reszka, E.; Wieczorek, E.; Jablonska, E.; Janasik, B.; Fendler, W.; Wasowicz, W. Association between plasma selenium level and NRF2 target genes expression in humans. J. Trace Elem. Med. Biol. 2015, 30, 102–106. [Google Scholar] [CrossRef] [PubMed]
- Xia, Y.; Hill, K.E.; Li, P.; Xu, J.; Zhou, D.; Motley, A.K.; Wang, L.; Byrne, D.W.; Burk, R.F. Optimization of selenoprotein P and other plasma selenium biomarkers for the assessment of the selenium nutritional requirement: A placebo-controlled, double-blind study of selenomethionine supplementation in selenium-deficient Chinese subjects. Am. J. Clin. Nutr. 2010, 92, 525–531. [Google Scholar] [CrossRef] [PubMed]
- Hurst, R.; Armah, C.N.; Dainty, J.R.; Hart, D.J.; Teucher, B.; Goldson, A.J.; Broadley, M.R.; Motley, A.K.; Fairweather-Tait, S.J. Establishing optimal selenium status: Results of a randomized, double-blind, placebo-controlled trial. Am. J. Clin. Nutr. 2010, 91, 923–931. [Google Scholar] [CrossRef] [PubMed]
- Gao, H.; Hägg, S.; Sjögren, P.; Lambert, P.C.; Ingelsson, E.; Van Dam, R.M. Serum selenium in relation to measures of glucose metabolism and incidence of Type 2 diabetes in an older Swedish population. Diabet. Med. 2014, 31, 787–793. [Google Scholar] [CrossRef] [PubMed]
- Harris, H.R.; Bergkvist, L.; Wolk, A. Selenium intake and breast cancer mortality in a cohort of Swedish women. Breast Cancer Res. Treat. 2012, 134, 1269–1277. [Google Scholar] [CrossRef] [PubMed]
- Alehagen, U.; Johansson, P.; Björnstedt, M.; Rosén, A.; Post, C.; Aaseth, J. Relatively high mortality risk in elderly Swedish subjects with low selenium status. Eur. J. Clin. Nutr. 2016, 70, 91–96. [Google Scholar] [CrossRef] [PubMed]
- Kafai, M.R.; Ganji, V. Sex, age, geographical location, smoking, and alcohol consumption influence serum selenium concentrations in the USA: Third national health and nutrition examination survey, 1988–1994. J. Trace Elements Med. Boil. 2003, 17, 13–18. [Google Scholar] [CrossRef]
- Bleys, J.; Navas-Acien, A.; Laclaustra, M.; Pastor-Barriuso, R.; Menke, A.; Ordovas, J.; Stranges, S.; Guallar, E. Serum Selenium and Peripheral Arterial Disease: Results From the National Health and Nutrition Examination Survey, 2003–2004. Am. J. Epidemiol. 2009, 169, 996–1003. [Google Scholar] [CrossRef] [PubMed]
- Alehagen, U.; Alexander, J.; Aaseth, J. Supplementation with Selenium and Coenzyme Q10 Reduces Cardiovascular Mortality in Elderly with Low Selenium Status. A Secondary Analysis of a Randomised Clinical Trial. PLoS ONE 2016, 11, e0157541. [Google Scholar] [CrossRef]
- Xia, L.; Nordman, T.; Olsson, J.M.; Damdimopoulos, A.; Björkhem-Bergman, L.; Nalvarte, I.; Eriksson, L.C.; Arnér, E.S.; Spyrou, G.; Björnstedt, M. The mammalian cytosolic selenoenzyme thioredoxin reductase reduces ubiquinone. A novel mechanism for defense against oxidative stress. J. Biol. Chem. 2003, 278, 2141–2146. [Google Scholar] [CrossRef]
- Acosta, M.J.; Fonseca, L.V.; Desbats, M.A.; Cerqua, C.; Zordan, R.; Trevisson, E.; Salviati, L. Coenzyme Q biosynthesis in health and disease. Biochim. Biophys. Acta 2016, 1857, 1079–1085. [Google Scholar] [CrossRef] [PubMed]
- Kalén, A.; Appelkvist, E.-L.; Dallner, G. Age-related changes in the lipid compositions of rat and human tissues. Lipids 1989, 24, 579–584. [Google Scholar] [CrossRef] [PubMed]
- Folkers, K.; Moesgaard, S.; Morita, M. A one year bioavailability study of coenzyme Q10 with 3 months withdrawal period. Mol. Asp. Med. 1994, 15, s281–s285. [Google Scholar] [CrossRef]
- Molyneux, S.L.; Florkowski, C.M.; George, P.M.; Pilbrow, A.P.; Frampton, C.M.; Lever, M.; Richards, A.M. Coenzyme Q10: An independent predictor of mortality in chronic heart failure. J. Am. Coll. Cardiol. 2008, 52, 1435–1441. [Google Scholar] [CrossRef]
- Alehagen, U.; Johansson, P.; Björnstedt, M.; Rosén, A.; Dahlström, U. Cardiovascular mortality and N-terminal-proBNP reduced after combined selenium and coenzyme Q10 supplementation: A 5-year prospective randomized double-blind placebo-controlled trial among elderly Swedish citizens. Int. J. Cardiol. 2013, 167, 1860–1866. [Google Scholar] [CrossRef]
- Madsen, R.K.; Lundstedt, T.; Gabrielsson, J.; Sennbro, C.-J.; Alenius, G.-M.; Moritz, T.; Rantapää-Dahlqvist, S.; Trygg, J. Diagnostic properties of metabolic perturbations in rheumatoid arthritis. Arthritis Res. Ther. 2011, 13, R19. [Google Scholar] [CrossRef]
- Madsen, R.; Lundstedt, T.; Trygg, J. Chemometrics in metabolomics—A review in human disease diagnosis. Anal. Chim. Acta 2010, 659, 23–33. [Google Scholar] [CrossRef]
- Nordstrom, A.; Lewensohn, R. Metabolomics: Moving to the clinic. J. Neuroimmune Pharmacol. 2010, 5, 4–17. [Google Scholar] [CrossRef]
- Vinayavekhin, N.; Homan, E.A.; Saghatelian, A. Exploring disease through metabolomics. ACS Chem. Biol. 2010, 5, 91–103. [Google Scholar] [CrossRef]
- Scholz, S.; Fischer, S.; Gündel, U.; Küster, E.; Luckenbach, T.; Voelker, D. The zebrafish embryo model in environmental risk assessment—applications beyond acute toxicity testing. Environ. Sci. Pollut. Res. 2008, 15, 394–404. [Google Scholar] [CrossRef]
- Yamanouchi, T.; Minoda, S.; Yabuuchi, M.; Akanuma, Y.; Akanuma, H.; Miyashita, H.; Akaoka, I. Plasma 1,5-anhydro-D-glucitol as new clinical marker of glycemic control in NIDDM patients. Diabetes 1989, 38, 723–729. [Google Scholar] [CrossRef] [PubMed]
- Fujiwara, T.; Yoshida, M.; Yamada, H.; Tsukui, T.; Nakamura, T.; Sakakura, K.; Wada, H.; Arao, K.; Katayama, T.; Funayama, H.; et al. Lower 1,5-anhydroglucitol is associated with denovo coronary artery disease in patients at high cardiovascular risk. Heart Vessels 2015, 30, 469–476. [Google Scholar] [CrossRef]
- Ouchi, S.; Shimada, K.; Miyazaki, T.; Takahashi, S.; Sugita, Y.; Shimizu, M.; Murata, A.; Kadoguchi, T.; Kato, T.; Aikawa, T.; et al. Low 1,5-anhydroglucitol levels are associated with long-term cardiac mortality in acute coronary syndrome patients with hemoglobin A1c levels less than 7.0. Cardiovasc. Diabetol. 2017, 16, 151. [Google Scholar] [CrossRef] [PubMed]
- Münzel, T.; Camici, G.G.; Maack, C.; Bonetti, N.R.; Fuster, V.; Kovacic, J.C. Impact of Oxidative Stress on the Heart and Vasculature: Part 2 of a 3-Part Series. J. Am. Coll. Cardiol. 2017, 70, 212–229. [Google Scholar] [CrossRef] [PubMed]
- Siti, H.N.; Kamisah, Y.; Kamsiah, J. The role of oxidative stress, antioxidants and vascular inflammation in cardiovascular disease (a review). Vasc. Pharmacol. 2015, 71, 40–56. [Google Scholar] [CrossRef] [PubMed]
- Alehagen, U.; Aaseth, J.; Johansson, P. Less increase of copeptin and MR-proADM due to intervention with selenium and coenzyme Q10 combined: Results from a 4-year prospective randomized double-blind placebo-controlled trial among elderly Swedish citizens. BioFactors 2015, 41, 443–452. [Google Scholar] [CrossRef]
- Holstein, S.A.; Hohl, R.J. Isoprenoids: Remarkable diversity of form and function. Lipids 2004, 39, 293–309. [Google Scholar] [CrossRef]
- Shaghaghi, M.A.; AbuMweis, S.S.; Jones, P.J. Cholesterol-Lowering Efficacy of Plant Sterols/Stanols Provided in Capsule and Tablet Formats: Results of a Systematic Review and Meta-Analysis. J. Acad. Nutr. Diet. 2013, 113, 1494–1503. [Google Scholar] [CrossRef]
- Marangoni, F.; Poli, A. Phytosterols and cardiovascular health. Pharmacol. Res. 2010, 61, 193–199. [Google Scholar] [CrossRef]
- Dumolt, J.H.; Rideout, T.C. The Lipid-lowering Effects and Associated Mechanisms of Dietary Phytosterol Supplementation. Curr. Pharm. Des. 2017, 23, 5077–5085. [Google Scholar] [CrossRef]
- Cabral, C.E.; Klein, M.R.S.T. Phytosterols in the Treatment of Hypercholesterolemia and Prevention of Cardiovascular Diseases. Arq. Bras. Cardiol. 2017, 109, 475–482. [Google Scholar] [CrossRef] [PubMed]
- Shandilya, U.K.; Sharma, A. Functional Foods and Their Benefints: An Overview. J. Nutr. Health Food Eng. 2017, 7, 247. [Google Scholar]
- Speckmann, B.; Schulz, S.; Hiller, F.; Hesse, D.; Schumacher, F.; Kleuser, B.; Geisel, J.; Obeid, R.; Grune, T.; Kipp, A.P. Selenium increases hepatic DNA methylation and modulates one-carbon metabolism in the liver of mice. J. Nutr. Biochem. 2017, 48, 112–119. [Google Scholar] [CrossRef] [PubMed]
- Alehagen, U.; Lindahl, T.L.; Aaseth, J.; Svensson, E.; Johansson, P. Levels of sP-selectin and hs-CRP Decrease with Dietary Intervention with Selenium and Coenzyme Q10 Combined: A Secondary Analysis of a Randomized Clinical Trial. PLoS ONE 2015, 10, e0137680. [Google Scholar] [CrossRef] [PubMed]
- Walker, K.A.; Power, M.C.; Hoogeveen, R.C.; Folsom, A.R.; Ballantyne, C.M.; Knopman, D.S.; Windham, B.G.; Selvin, E.; Jack, C.R.; Gottesman, R.F. Midlife Systemic Inflammation, Late-Life White Matter Integrity, and Cerebral Small Vessel Disease: The Atherosclerosis Risk in Communities Study. Stroke 2017, 48, 3196–3202. [Google Scholar] [CrossRef] [PubMed]
- Harrington, R.A. Targeting Inflammation in Coronary Artery Disease. N. Engl. J. Med. 2017, 377, 1197–1198. [Google Scholar] [CrossRef] [PubMed]
- Würtz, P.; Soininen, P.; Kangas, A.J.; Rönnemaa, T.; Lehtimäki, T.; Kähönen, M.; Viikari, J.S.; Raitakari, O.T.; Ala-Korpela, M. Branched-Chain and Aromatic Amino Acids Are Predictors of Insulin Resistance in Young Adults. Diabetes Care 2013, 36, 648–655. [Google Scholar] [CrossRef] [PubMed]
- Tillin, T.; Hughes, A.D.; Wang, Q.; Würtz, P.; Ala-Korpela, M.; Sattar, N.; Forouhi, N.G.; Godsland, I.F.; Eastwood, S.V.; McKeigue, P.M.; et al. Diabetes risk and amino acid profiles: Cross-sectional and prospective analyses of ethnicity, amino acids and diabetes in a South Asian and European cohort from the SABRE (Southall And Brent REvisited) Study. Diabetologia 2015, 58, 968–979. [Google Scholar] [CrossRef]
- Zhenyukh, O.; Civantos, E.; Ruiz-Ortega, M.; Sánchez, M.S.; Vázquez, C.; Peiró, C.; Egido, J.; Mas, S. High concentration of branched-chain amino acids promotes oxidative stress, inflammation and migration of human peripheral blood mononuclear cells via mTORC1 activation. Free Radic. Boil. Med. 2017, 104, 165–177. [Google Scholar] [CrossRef] [PubMed]
- Johansson, P.; Dahlstrom, O.; Dahlstrom, U.; Alehagen, U. Improved health-related quality of life, and more days out of hospital with supplementation with selenium and coenzyme Q10 combined. Results from a double blind, placebo-controlled prospective study. J. Nutr. Health Aging 2015, 19, 870–877. [Google Scholar] [CrossRef] [PubMed]
- Iwase, S.; Kawaguchi, T.; Yotsumoto, D.; Doi, T.; Miyara, K.; Odagiri, H.; Kitamura, K.; Ariyoshi, K.; Miyaji, T.; Ishiki, H.; et al. Efficacy and safety of an amino acid jelly containing coenzyme Q10 and L-carnitine in controlling fatigue in breast cancer patients receiving chemotherapy: A multi-institutional, randomized, exploratory trial (JORTC-CAM01). Support. Care Cancer 2016, 24, 637–646. [Google Scholar] [CrossRef] [PubMed]
- Sanoobar, M.; Dehghan, P.; Khalili, M.; Azimi, A.; Seifar, F. Coenzyme Q10 as a treatment for fatigue and depression in multiple sclerosis patients: A double blind randomized clinical trial. Nutr. Neurosci. 2016, 19, 138–143. [Google Scholar] [CrossRef] [PubMed]
- Bengtsson, A.A.; Trygg, J.; Wuttge, D.M.; Sturfelt, G.; Theander, E.; Donten, M.; Moritz, T.; Sennbro, C.-J.; Torell, F.; Lood, C.; et al. Metabolic Profiling of Systemic Lupus Erythematosus and Comparison with Primary Sjögren’s Syndrome and Systemic Sclerosis. PLoS ONE 2016, 11, 0159384. [Google Scholar] [CrossRef] [PubMed]
- Di Pierro, F.; Rossi, A.; Consensi, A.; Giacomelli, C.; Bazzichi, L. Role for a water-soluble form of CoQ10 in female subjects affected by fibromyalgia. A preliminary study. Clin. Exp. Rheumatol. 2017, 35 (Suppl. 105), 20–27. [Google Scholar]
- Zhang, Y.P.; Eber, A.; Yuan, Y.; Yang, Z.; Rodriguez, Y.; Levitt, R.C.; Takacs, P.; Candiotti, K.A. Prophylactic and Antinociceptive Effects of Coenzyme Q10 on Diabetic Neuropathic Pain in a Mouse Model of Type 1 Diabetes. Anesthesiology 2013, 118, 945–954. [Google Scholar] [CrossRef]
- Zhang, Y.P.; Mei, S.; Yang, J.; Rodriguez, Y.; Candiotti, K.A. Acute Hypoglycemia Induces Painful Neuropathy and the Treatment of Coenzyme Q10. J. Diabetes Res. 2016, 2016, 1–7. [Google Scholar] [CrossRef] [PubMed]
- Jackson, M.I.; Cao, J.; Zeng, H.; Uthus, E.; Combs, G.F. S-Adenosylmethionine-dependent Protein Methylation Is Required for Expression of Selenoprotein P and Gluconeogenic Enzymes in HepG2 Human Hepatocytes. J. Boil. Chem. 2012, 287, 36455–36464. [Google Scholar] [CrossRef]
- Jung, M.; Pfeifer, G.P. Aging and DNA methylation. BMC Biol. 2015, 13, 7. [Google Scholar] [CrossRef]
- Alehagen, U.; Aaseth, J.; Alexander, J.; Svensson, E.; Johansson, P.; Larsson, A. Less fibrosis in elderly subjects supplemented with selenium and coenzyme Q10-A mechanism behind reduced cardiovascular mortality? BioFactors 2017, 44, 137–147. [Google Scholar] [CrossRef]
- Johansson, P.; Dahlström, Ö; Dahlström, U.; Alehagen, U. Effect of selenium and Q10 on the cardiac biomarker NT-proBNP. Scand. Cardiovasc. J. 2013, 47, 281–288. [Google Scholar] [CrossRef]
- Jensen-Urstad, K.; Bouvier, F.; Höjer, J.; Ruiz, H.; Hulting, J.; Samad, B.; Thorstrand, C.; Jensen-Urstad, M. Comparison of Different Echocardiographic Methods With Radionuclide Imaging for Measuring Left Ventricular Ejection Fraction During Acute Myocardial Infarction Treated by Thrombolytic Therapy. Am. J. Cardiol. 1998, 81, 538–544. [Google Scholar] [CrossRef]
- van Royen, N.; Jaffe, C.C.; Krumholz, H.M.; Johnson, K.M.; Lynch, P.J.; Natale, D.; Atkinson, P.; Deman, P.; Wackers, F.J. Comparison and reproducibility of visual echocardiographic and quantitative radionuclide left ventricular ejection fractions. Am. J. Cardiol. 1996, 77, 843–850. [Google Scholar] [CrossRef]
- Surowiec, I.; Johansson, E.; Torell, F.; Idborg, H.; Gunnarsson, I.; Svenungsson, E.; Jakobsson, P.-J.; Trygg, J. Multivariate strategy for the sample selection and integration of multi-batch data in metabolomics. Metabolomics 2017, 13, 114. [Google Scholar] [CrossRef] [PubMed]
- Surowiec, I.; Vikström, L.; Hector, G.; Johansson, E.; Vikström, C.; Trygg, J. Generalized Subset Designs in Analytical Chemistry. Anal. Chem. 2017, 89, 6491–6497. [Google Scholar] [CrossRef] [PubMed]
- A, J.; Trygg, J.; Gullberg, J.; Johansson, A.I.; Jonsson, P.; Antti, H.; Marklund, S.L.; Moritz, T. Extraction and GC/MS analysis of the human blood plasma metabolome. Anal. Chem. 2005, 77, 8086–8094. [Google Scholar] [CrossRef] [PubMed]
- Jonsson, P.; Johansson, A.I.; Gullberg, J.; Trygg, J.; A, J.; Grung, B.; Marklund, S.; Sjöström, M.; Antti, H.; Moritz, T. High-Throughput Data Analysis for Detecting and Identifying Differences between Samples in GC/MS-Based Metabolomic Analyses. Anal. Chem. 2005, 77, 5635–5642. [Google Scholar] [CrossRef] [PubMed]
- Trygg, J.; Wold, S. PLS regressionon waveletcompressed NIR spectra. Chemom. Intell. Lab. Syst. 1998, 42, 209–220. [Google Scholar] [CrossRef]
- Wold, S.; Trygg, J.; Berglund, A.; Antti, H. Some recent developments in PLS modeling. Chemom. Intell. Lab. Syst. 2001, 58, 131–150. [Google Scholar] [CrossRef]
- Wold, S. Pattern-Recognition by Means of Disjoint Principal Component Analysis. Pattern Recognit. 1976, 8, 127–139. [Google Scholar] [CrossRef]
- Redestig, H.; Fukushima, A.; Stenlund, H.; Moritz, T.; Arita, M.; Saito, K.; Kusano, M. Compensation for Systematic Cross-Contribution Improves Normalization of Mass Spectrometry Based Metabolomics Data. Anal. Chem. 2009, 81, 7974–7980. [Google Scholar] [CrossRef]
- Wold, S.; Esbensen, K.; Geladi, P. Principal Component Analysis. Chemom. Intell. Lab. Syst. 1987, 2, 37–52. [Google Scholar] [CrossRef]
- Trygg, J.; Wold, S. Orthogonal projections to latent structures (O-PLS). J. Chemom. 2002, 16, 119–128. [Google Scholar] [CrossRef]
- Bylesjo, M.; Rantalainen, M.; Cloarec, O.; Nicholson, J.K.; Holmes, E.; Trygg, J. OPLS discriminant analysis: Combiningthe strengths of PLS-DA and SIMCA classification. J. Chemom. 2006, 20, 341–351. [Google Scholar] [CrossRef]
- Wiklund, S.; Johansson, E.; Sjöström, L.; Mellerowicz, E.J.; Edlund, U.; Shockcor, J.P.; Gottfries, J.; Moritz, T.; Trygg, J. Visualization of GC/TOF-MS-Based Metabolomics Data for Identification of Biochemically Interesting Compounds Using OPLS Class Models. Anal. Chem. 2008, 80, 115–122. [Google Scholar] [CrossRef] [PubMed]
- Efron, B.; Gong, G. A Leisurely Look at the Bootstrap, the Jackknife, and Cross-Validation. Am. Stat. 1983, 37, 36–48. [Google Scholar]


| Active | Placebo | p Value | |
|---|---|---|---|
| N | 55 | 44 | |
| Age (years) | 76.1 (2.9) | 76.3 (2.9) | |
| History | |||
| Smokers (present) n (%) | 5 (7.3) | 6 (13.6) | 0.47 |
| Diabetes n (%) | 11 (20.0) | 8 (18.2) | 0.82 |
| Hypertension n (%) | 34 (61.8) | 31 (70.5) | 0.91 |
| IHD n (%) | 12 (21.8) | 10 (22.7) | 0.91 |
| NYHA class I n (%) | 37 (67.3) | 22 (50.0) | 0.08 |
| NYHA class II n (%) | 12 (21.8) | 18 (40.9) | 0.04 |
| NYHA class III n (%) | 6 (10.9) | 4 (9.1) | 0.77 |
| NYHA class IV n (%) | 0 | 0 | |
| Unclassified NYHA n (%) | 0 | 0 | |
| Medications | |||
| ACEI or ARBn (%) | 11 (20.0) | 12 (27.3) | 0.39 |
| Beta-blockers n (%) | 20 (36.4) | 17 (38.6) | 0.82 |
| Digitalis n (%) | 3 (5.5) | 0 (0) | n/a |
| Diuretics n (%) | 13 (23.6) | 13 (29.5) | 0.51 |
| Statins n (%) | 13 (23.6) | 7 (15.9) | 0.34 |
| Examinations | |||
| EF < 40% n (%) | 6 (10.9) | 2 (4.5) | 0.25 |
| Metabolite | p-Value | VIP (OPLS-DA) |
|---|---|---|
| Decreased in SeQ10 group | ||
| Alanine | 0.001 | 1.79 |
| Alanine-3-cyano | 0.016 | 1.62 |
| Arachidonic acid | NS | 1.30 |
| Aspartic acid | 0.017 | 1.65 |
| Butyric acid, 2-amino | NS | 1.16 |
| Cysteine | 0.048 | 1.05 |
| Fucose | NS | 1.21 |
| Glutamic acid | 0.022 | 1.60 |
| Glycine | 0.010 | 1.50 |
| Isoleucine | 0.031 | 1.49 |
| Leucine | NS | 1.45 |
| Methionine | 0.030 | 1.51 |
| Myo-inositol | 0.022 | 1.42 |
| Ornithine-1,5-lactam | 0.013 | 1.29 |
| Phenylalanine | NS | 1.25 |
| Proline-4-hydroxy | 0.026 | 1.39 |
| Salicylic acid | NS | 1.34 |
| Serine | 0.032 | 1.44 |
| Threonine | 0.049 | 1.36 |
| Compound | p Value (95% Confidence Level) | VIP |
|---|---|---|
| Decreased in the SeQ10 group | ||
| Alanine | 0.026 | 1.94 |
| Glycine | 0.025 | 1.95 |
| Isoleucine | 0.016 | 1.93 |
| Leucine | 0.031 | 1.60 |
| Lysine | 0.025 | 1.37 |
| Tryptophan | 0.025 | 0.95 |
| Increased | ||
| 1-monohexadecanoylglycerol | 0.004 | 1.79 |
| Aspartic acid | 0.007 | 2.19 |
| Hexadecanoic acid | 0.013 | 1.71 |
| Hexadecenoic acid | 0.039 | 1.63 |
| Lauric acid | 0.008 | 1.51 |
| Myristic acid | 0.026 | 1.44 |
| Oleic acid | 0.033 | 1.72 |
| Compound | p Value (95% Confidence Level) | VIP |
|---|---|---|
| Decreased in the SeQ10 group | ||
| Arabinose | 0.013 | 1.83 |
| Ribose | 0.014 | 1.76 |
| Sucrose | 0.034 | 1.83 |
| Xylitol | 0.025 | 1.41 |
| Increased | ||
| Fructose | 0.022 | 1.96 |
| 1,5-anhydroglucitol | 0.016 | 1.93 |
| Compound | Main Study | Validation 1 | Validation 2 |
|---|---|---|---|
| 1,5-anhydro-d-glucitol | N | ↑ | ↑ |
| 1-dodecanoyl-sn-glycero-3-phosphocholine | N | N | ↑ |
| 1-Monohexadecanoylglycerol | N | ↑ | ↑ |
| 1-Palmitoyl-sn-glycero-3-phosphocholine | N | ↓ | N |
| 2-aminobutyric acid | N | ↓ | ↓ |
| 3-hydroxybutyric acid | N | ↑ | ↑ |
| Alanine | ↓ | ↓ | ↓ |
| Alanine, 3-cyano | ↓ | N | N |
| Allothreonine | N | ↓ | N |
| Alpha-ketoglutarate | ↓ | N | N |
| Aminomalonic acid | N | N | ↓ |
| Arabinose | ↓ | ↓ | ↓ |
| Arabitol/ribitol | ↓ | N | N |
| Arachidonic acid | ↓ | N | N |
| Arginine | ↓ | ↓ | ↓ |
| Asparagine, DL- | ↓ | ↓ | ↓ |
| Aspartic acid, DL | ↓ | ↓ | ↑ |
| Benzyl alcohol | ↓ | N | N |
| Beta-Alanine | ↓ | N | N |
| Butanoic acid, 2,4-dihydroxy- | ↑ | N | N |
| Butyric acid, 2-amino | ↓ | N | N |
| Campesterol | ↑ | ↑ | ↑ |
| Cholesterol | ↑ | N | N |
| Citric acid | ↓ | ↑ | ↑ |
| Creatinine | ↓ | ↓ | ↑ |
| Cysteine | ↓ | ↓ | ↓ |
| Cystine | ↓ | ↑ | ↓ |
| Docosanoic acid | ↑ | ↑ | N |
| Docosahexaenoic acid, 4,7,10,13,16,19-(Z,Z,Z,Z,Z,Z) | ↓ | N | ↓ |
| Eicosanoic acid, n- | ↓ | N | N |
| Eicosapentaenoic acid | ↓ | N | N |
| Ethanolamine | ↓ | ↑ | ↑ |
| Fructose | ↑ | ↑ | ↑ |
| Fucose | ↓ | N | N |
| Glucose | ↑ | N | N |
| Glucose, 1,6-anhydro, beta | ↓ | ↓ | N |
| Glutamic acid | ↓ | ↓ | ↓ |
| Glutamine | ↓ | ↓ | ↑ |
| Glyceric acid | ↓ | ↓ | ↓ |
| Glycerol | ↑ | N | N |
| Glycerol-2-phosphate | ↓ | N | N |
| Glycerol-3-phosphate | ↑ | ↓ | ↓ |
| Glycine | ↓ | ↓ | ↑ |
| Glycolic acid | N | N | ↑ |
| Heptadecanoic acid, n- | ↑ | ↓ | N |
| Heptanoic acid | ↑ | N | N |
| Hexadecanoic acid | ↑ | ↑ | ↑ |
| Hexadecenoic acid | ↑ | ↑ | ↑ |
| Hippuric acid | ↓ | N | N |
| Histidine | ↓ | ↓ | ↓ |
| Indole-3-acetic acid | ↓ | N | N |
| Inosine | ↑ | N | N |
| Inositol, myo | ↓ | ↑ | ↓ |
| Inositol-1-phosphate | ↑ | ↓ | ↑ |
| Isoleucine | ↓ | ↓ | ↓ |
| Itaconic acid | ↓ | N | N |
| Lactic acid, | ↓ | ↓ | ↑ |
| Lauric acid (dodedecanoic acid) | ↑ | ↑ | ↑ |
| Leucine | ↓ | ↓ | ↓ |
| Linoleic acid | ↑ | ↑ | ↑ |
| Lysine | ↓ | ↓ | ↓ |
| Malic acid | ↓ | ↓ | ↑ |
| Malonic acid, 2-amino | ↑ | N | N |
| Maltose | ↓ | ↓ | ↑ |
| Mannitol | N | N | ↓ |
| Mannose | ↑ | N | N |
| Methionine | ↓ | N | N |
| Monomethylphosphate | ↑ | ↑ | ↑ |
| Myristic acid | ↑ | ↑ | ↑ |
| Nonanoic acid,n | ↓ | ↑ | ↓ |
| Oleic acid | ↑ | ↑ | ↑ |
| Ornithine | ↓ | ↓ | ↓ |
| Ornithine-1,5-lactam | ↓ | N | N |
| Oxalic acid | N | N | ↓ |
| Phenylalanine | ↓ | ↓ | ↓ |
| Phosphoric acid | ↑ | N | N |
| Pipecolic acid | ↓ | N | N |
| Proline | ↓ | ↓ | ↓ |
| Proline, 4-hydroxy | ↓ | N | N |
| Protocatechuic acid | ↓ | N | N |
| Pseudouridine | N | ↓ | ↑ |
| Putrescine | ↓ | N | N |
| Pyridine, 3-hydroxy | ↓ | N | N |
| Pyroglutamic acid | ↓ | ↓ | ↑ |
| Pyruvic acid | ↑ | ↓ | ↓ |
| Ribose | ↓ | ↓ | ↓ |
| Salicylic acid | ↓ | ↓ | ↓ |
| Serine | ↓ | ↓ | ↓ |
| Sitosterol | ↑ | ↓ | N |
| Sorbitol | ↑ | N | N |
| Stearic acid | ↑ | ↑ | ↑ |
| Succinic acid | ↑ | N | ↑ |
| Sucrose | ↑ | ↑ | ↑ |
| Taurine | ↓ | ↓ | ↓ |
| Threitol | ↑ | N | N |
| Threonic acid | ↓ | ↑ | ↓ |
| Threonine | ↓ | ↓ | ↓ |
| Tocopherol, alpha- | ↑ | ↑ | ↓ |
| Tocopherol, gamma- | ↓ | ↓ | ↑ |
| Tryptophan | ↓ | ↓ | ↓ |
| Tyrosine | ↓ | ↓ | ↓ |
| Urea | ↓ | N | ↓ |
| Uric acid | ↓ | ↓ | ↑ |
| Valine | ↓ | ↓ | ↓ |
| Xylitol | ↑ | ↓ | ↓ |
| Xylose | ↓ | ↓ | ↑ |
| Xylulose | ↓ | N | ↑ |
© 2019 by the authors. Licensee MDPI, Basel, Switzerland. This article is an open access article distributed under the terms and conditions of the Creative Commons Attribution (CC BY) license (http://creativecommons.org/licenses/by/4.0/).
Share and Cite
Alehagen, U.; Johansson, P.; Aaseth, J.; Alexander, J.; Surowiec, I.; Lundstedt-Enkel, K.; Lundstedt, T. Significant Changes in Metabolic Profiles after Intervention with Selenium and Coenzyme Q10 in an Elderly Population. Biomolecules 2019, 9, 553. https://doi.org/10.3390/biom9100553
Alehagen U, Johansson P, Aaseth J, Alexander J, Surowiec I, Lundstedt-Enkel K, Lundstedt T. Significant Changes in Metabolic Profiles after Intervention with Selenium and Coenzyme Q10 in an Elderly Population. Biomolecules. 2019; 9(10):553. https://doi.org/10.3390/biom9100553
Chicago/Turabian StyleAlehagen, Urban, Peter Johansson, Jan Aaseth, Jan Alexander, Izabella Surowiec, Katrin Lundstedt-Enkel, and Torbjörn Lundstedt. 2019. "Significant Changes in Metabolic Profiles after Intervention with Selenium and Coenzyme Q10 in an Elderly Population" Biomolecules 9, no. 10: 553. https://doi.org/10.3390/biom9100553
APA StyleAlehagen, U., Johansson, P., Aaseth, J., Alexander, J., Surowiec, I., Lundstedt-Enkel, K., & Lundstedt, T. (2019). Significant Changes in Metabolic Profiles after Intervention with Selenium and Coenzyme Q10 in an Elderly Population. Biomolecules, 9(10), 553. https://doi.org/10.3390/biom9100553