Article

Ceramide Synthase 6: Comparative Analysis, Phylogeny and Evolution

by
Roger S. Holmes
1,2,*,
Keri A. Barron
2 and
Natalia I. Krupenko
2,*
1
Griffith Research Institute for Drug Discovery and School of Environment and Science, Griffith University, Nathan, QLD 4111, Australia
2
Department of Nutrition, UNC-Chapel Hill, UNC Nutrition Research Institute, Kannapolis, NC 28081, USA
*
Authors to whom correspondence should be addressed.
Biomolecules 2018, 8(4), 111; https://doi.org/10.3390/biom8040111
Submission received: 30 August 2018 / Revised: 25 September 2018 / Accepted: 1 October 2018 / Published: 8 October 2018

Abstract

:
Ceramide synthase 6 (CerS6, also known as LASS6) is one of the six members of ceramide synthase gene family in humans. Comparisons of CerS6 amino acid sequences and structures as well as of CerS6 gene structures/locations were conducted using data from several vertebrate genome projects. A specific role for the CerS6 gene and protein has been identified as the endoplasmic reticulum C14- and C16-ceramide synthase. Mammalian CerS6 proteins share 90–100% similarity among different species, but are only 22–63% similar to other CerS family members, suggesting that CerS6 is a distinct gene family. Sequence alignments, predicted transmembrane, lumenal and cytoplasmic segments and N-glycosylation sites were also investigated, resulting in identification of the key conserved residues, including the active site as well as C-terminus acidic and serine residues. Mammalian CerS6 genes contain ten exons, are primarily located on the positive strands and transcribed as two major isoforms. The human CERS6 gene promoter harbors a large CpG island (94 CpGs) and multiple transcription factor binding sites (TFBS), which support precise transcriptional regulation and signaling functions. Additional regulation is conferred by 15 microRNA (miRNA) target sites identified in the CERS6 3′-UTR region. Phylogenetic analysis of the vertebrate CerS1–6 gene families relationships supports a major role for the CerS6 enzyme that is strongly conserved throughout vertebrate evolution.

1. Introduction

Mammalian ceramide synthase (CerS) genes were initially discovered by the homology search of human genome using the Lag1p motif from the yeast LAG1 gene [1]. In yeast, LAG1 was shown to regulate the life span [2] and support ceramide biosynthesis [3], and as such its homolog LAC1 and other homologous genes were dubbed LASSes (longevity associated genes). These genes were found in most species varying in numbers, with both mice and humans having six paralogs: LASS 1–6 [4]. Further studies of the mammalian LASS genes function revealed that the key feature of the proteins encoded by these genes is the ability to synthesize ceramide, and consequently the nomenclature was changed to CerS 1–6 [4]. Importantly, each of the ceramide synthases was shown to utilize a subset of acyl-CoAs, thus producing ceramides with specific acyl chain length [5,6]. Ceramides play a central role in sphingolipid metabolism and function as important components defining biophysical properties of cellular membranes [7]. In the past decades, distinct roles of ceramides as signaling molecules and as mediators of apoptosis and inflammatory responses have also been established [5,6,8]. It should be noted, that though CerSes generate different ceramide species, their genes show similarities in sequence and structure, and the corresponding protein products display similar domain organization, catalytic properties and subcellular localization.
At the same time, different ceramide synthases show different biological properties and play vastly diverse roles in numerous biological processes [5]. CerS1 catalyzes the synthesis of C18 acyl chain ceramides and plays a major role in the development of brain and other neural tissue [1,9]. CerS2 preferentially catalyzes the synthesis of C20–C26 acyl chain ceramides which are essential during development. Accordingly, CerS2 null mice were reported as having chronic alterations of both liver and brain physiology with increased hepatocyte apoptosis and turnover, chronic and progressive myelin degeneration as well as membrane material accumulation in lysosomes [10,11]. CerS3 is predominantly expressed in testis and skin and exhibits a broad acyl chain preference synthesizing C26–C32 acyl chain ceramides. In agreement with very specific function of this enzyme, CerS3 null mice die soon after birth due to the loss of skin barrier function [12,13]. CerS4, which is specific for C18–C22 acyl-CoA, is found at high levels in the skin epidermis, heart, skeletal muscle, liver, lung and white adipose tissue and may play a role in regulating stem cell homeostasis, with Cers4 null mice exhibiting major reductions in C20 acyl chain ceramide levels [14,15]. CerS5 is the major ceramide synthase in lung epithelial cells and in the white and grey matter of brain [5]. It is essential for maintaining C16 ceramide pools and may contribute to the development of diet induced obesity [16,17].
The last member of the mammalian ceramide synthase family, CerS6 was first reported by Weinmann et al. [18] in 2005. This enzyme generates C14- and C16-ceramides and phylogenetically is most closely related to CerS5 [5]. Cers6 knockout mice demonstrated a significant decrease in C16-containing sphingolipids that was accompanied by behavioral abnormalities [19], protection from high-fat diet-induced obesity and glucose intolerance [20], as well as protection from colitis [21,22] and neutrophils activation [23]. Moreover, CerS6 expression was required for optimal T cell activation, proliferation and cytokine production in response to alloantigen and for subsequent induction of graft-versus-host disease [24]. Additionally, activation of CerS6 and subsequent elevation of C16-ceramide were demonstrated in response to folate stress [25], serum starvation [26], deficiency of cytochrome c oxidase [27] and methotrexate [28]. Despite high homology and identical substrate preference of this enzyme to CerS5, which to some extent has been studied with regard to its membrane organization and structural basis of specificity [29,30], the structure and function of CerS6 are still not well investigated. In the present study we used bioinformatic and phylogenetic methods to examine the structures of vertebrate CerS6 genes and enzymes and their evolutionary relationship with the other CerS genes as well as ancestral yeast and invertebrate genes.

2. Results and Discussion

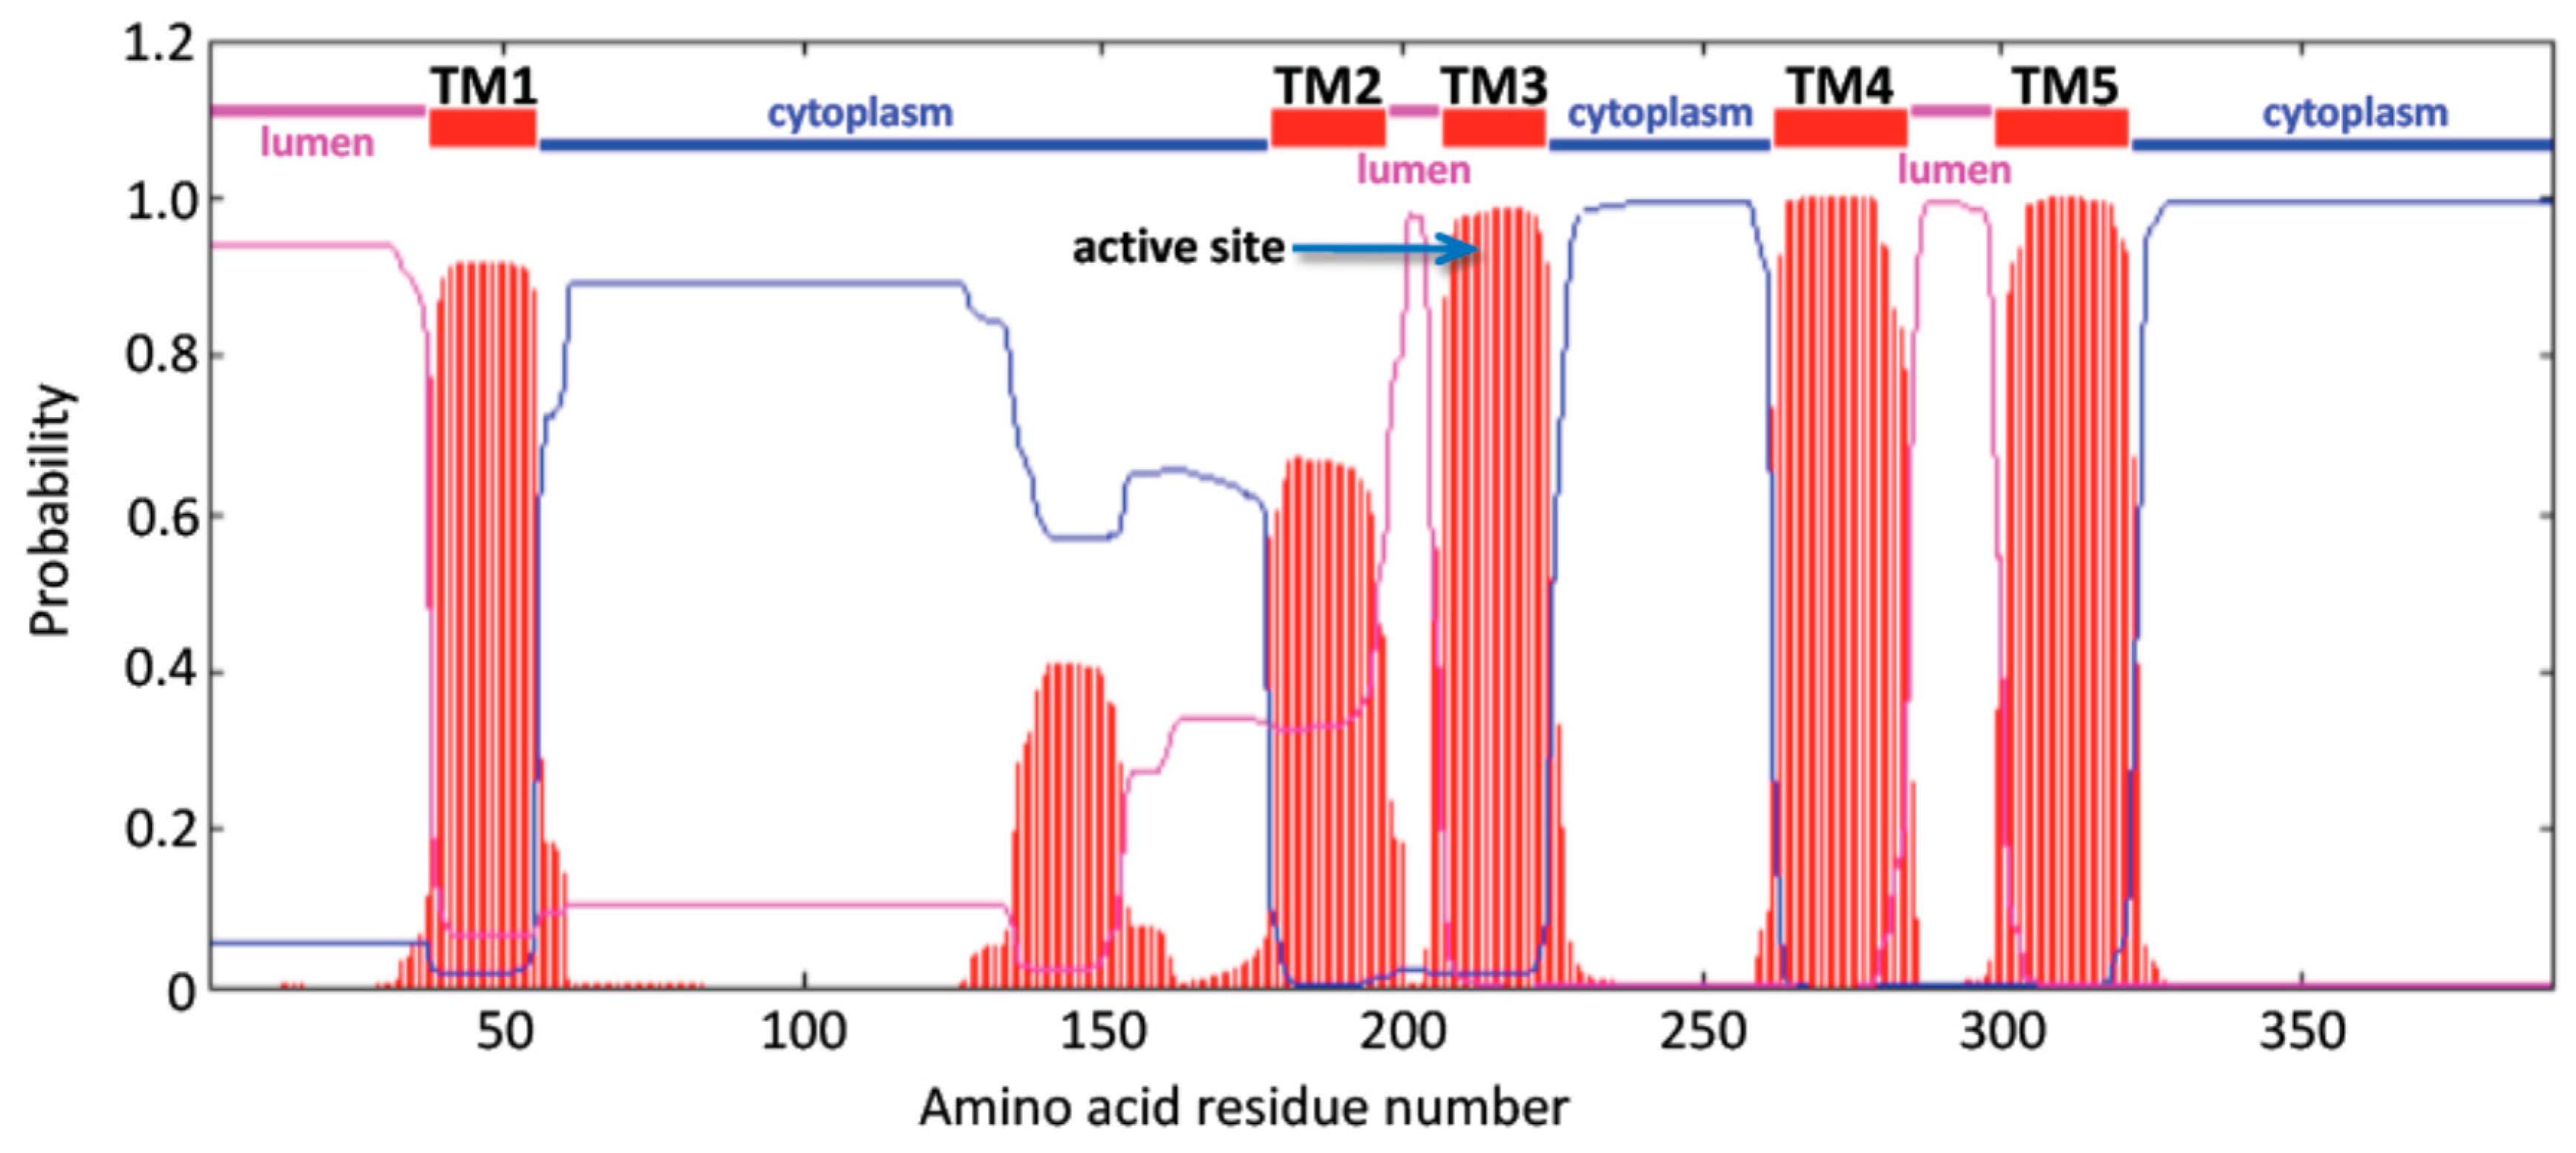
2.1. Comparison of Vertebrate CerS6 Amino Acid Sequences and their Relation to Human CERS1–5 Sequences

Examination of the non-redundant protein sequence databases for several vertebrate genomes using basic local alignment search tool (BLAST) analyses for CerS6 amino acid sequence, as well as BLAST-like alignment tool (BLAT) analyses of the predicted CerS6 sequences using the University of California, Santa Cruz (UCSC) genome browser allowed us to predict locations for these genes, including exon boundary locations and gene sizes. Comparison of predicted gene and protein characteristics to their human and mouse counterparts is presented in Table 1. The human and other mammalian CerS6 sequences examined were 90% or more identical, suggesting that these are the products of the same family of genes.
All primate CerS6 sequences included 392 amino acid residues and were more than 99% identical to human protein. The other eutherian mammalian CerS6 sequences showed the identity to human enzyme of 95–99% and the polypeptide chains were 391–396 amino acid residues long. Alignment of two human transcripts [18,19] baboon (Papio anubis), mouse [19], chicken (Gallus gallus), frog (Xenopus tropicalis) and zebra fish (Danio rerio) CerS6 protein sequences are shown in Figure 1. Baboon, chicken, frog, and zebra fish sequences were deduced by our analyses. Enzyme topology with predicted major domains determined using TMHMM Server v.2.0 [31,32] is shown in Figure 1 and Figure 2.
Our analysis suggests that CERS6 is an integral membrane protein and has three domains located within the lumen of the endoplasmic reticulum (residues 1–37, 199–206, 285–302), five transmembrane regions (designated TM1–5, residues 38–55, 178–198, 207–224, 262–284, 303–323, correspondingly) and three cytoplasmic regions (residues 56–177, 225–261, 324–392). Such domain organization coincides with the predictions made earlier using different bioinformatic tools, TopPredII and UniProt [30,33]. Currently, no experimental evidence for the precise topology of CerS6 has been presented, and no crystal structures for any of the CerS enzymes exist. Thus, it cannot be excluded that the precise topological arrangements of CERS6 may differ from the predicted here. Indeed, alignment of all six human ceramide synthases using PSI/TM-Coffee software predicted six transmembrane domains for CERS6 and quite different distribution of lumenal and cytoplasmic regions (shown in Figure 3). The TMHMM Server v.2 analysis of CERS6 (Figure 1) is included for comparison in the same alignment (rectangular frame) and demonstrates the first cytoplasmic region that is 42 amino acids longer, as well as lumenal orientation of the region homologous to the second cytoplasmic domain of CERSes 1–4. Similar controversy was observed in the membrane topology studies of CERS5 [29]. Four out of fifteen software algorithms used for the topology analyses predicted five transmembrane domains for CERS5, while eleven other predicted six transmembrane domains. It should also be noted that PSI/TM-Coffee analysis (T-Coffee Server, Centre for Genomic Regulation, Barcelona, Spain) indicated direct connection of lumenal and cytoplasmic domains for CERS1, CERS2, CERS3 and CERS6, which are sterically improbable. Experimental interrogation of the mammalian CerSes topology, similar to that published for yeast CerS enzymes [34] could help resolve the prediction inconsistencies.
CerS6 sequence alignment (Figure 1) and analysis have identified a number of specific amino acid residues conserved among the vertebrates: the 52 amino acid conserved sequence (Lag1p motif) shown to be important for the ceramide synthase activity [1,34,35]; the two adjacent histidine residues (His211 and His212) located within TM3 and also important for CerS CERS activity (first reported for CerS1 [35]); Lys134, mutation of which resulted in a 50% loss of activity, as well as residues comprising a functional Hox domain region (66–127) of which 12 terminal residues were shown to be important for enzyme activities in CerS5 and CerS6 only [36]. Recently a 150 residue region in the TLC domain of CerS enzymes (amino acids 159–309 for CerS5) has been identified as a determinant of substrate specificity [29]. Additionally, two putative N-glycosylation sites located within predicted lumenal domains (18NVT, 285NTT) were identified, similar to the previous work where experimental evidence of glycosylation of the N18 only was obtained [30]. Furthermore, C-terminal serine residues were identified as potential sites for CerS6 phosphorylation: S336, S341, S345, S346 and S347. Phosphorylation of these residues has been reported previously for CerS2–6 and was shown to contribute to the maintenance of catalytic activities [37] as well as stimulate Lac1/Lag1 activity and formation of complex sphingolipids in yeast (inositol-phosphate containing) [38].
Additionally, sequence comparison revealed several groups of distinct conserved residues the function of which has not been defined yet. Among these are the three tyrosine’s, 180–182, located within the second transmembrane domain and the strictly conserved stretches of acidic amino acids in C-terminus including Asp346, Asp347, Asp350, Glu352, Asp356, Glu357, Glu358 and Asp359 (Figure 1) which may be important for the CerS6 carboxyl-terminus function within the cytoplasm. Additional residues with unknown function found to be conserved not only between the vertebrate CerS6 sequences but in nematode (LAGR1 and HYL1) and yeast LAC1 sequences as well, are: Phe117 and Glu124 in the first cytoplasmic domain; Tyr182 and Phe188 in TM2; Arg202-Lys203-Asp204 in the second lumenal region; Leu218 and Ser222 located within TM3; Gly231, Asp239, Asp242, Leu244, Lys.249 and Tyr253 in the second cytoplasmic segment; Phe267, Arg275 and Leu284 in TM4; as well as Trp318 and Ile322 in TM5. The future structure-function studies will explain the reason for their conservation in CerS6 evolution.
In agreement with high overall sequence similarity of CerS6 enzymes, comparisons of theoretical isoelectric points for eutherian mammalian proteins showed that a theoretical isoelectric point (pI) value of 8.0 was consistent for all of these enzymes, with the exception of baboon CerS6 (pI = 7.1) (Table 1). This difference is apparently explained by the substitution of a basic amino acid (Lys154, pI = 9.03) in human CERS6 for an acidic Glu154 (pI = 5.03) in baboon enzyme.

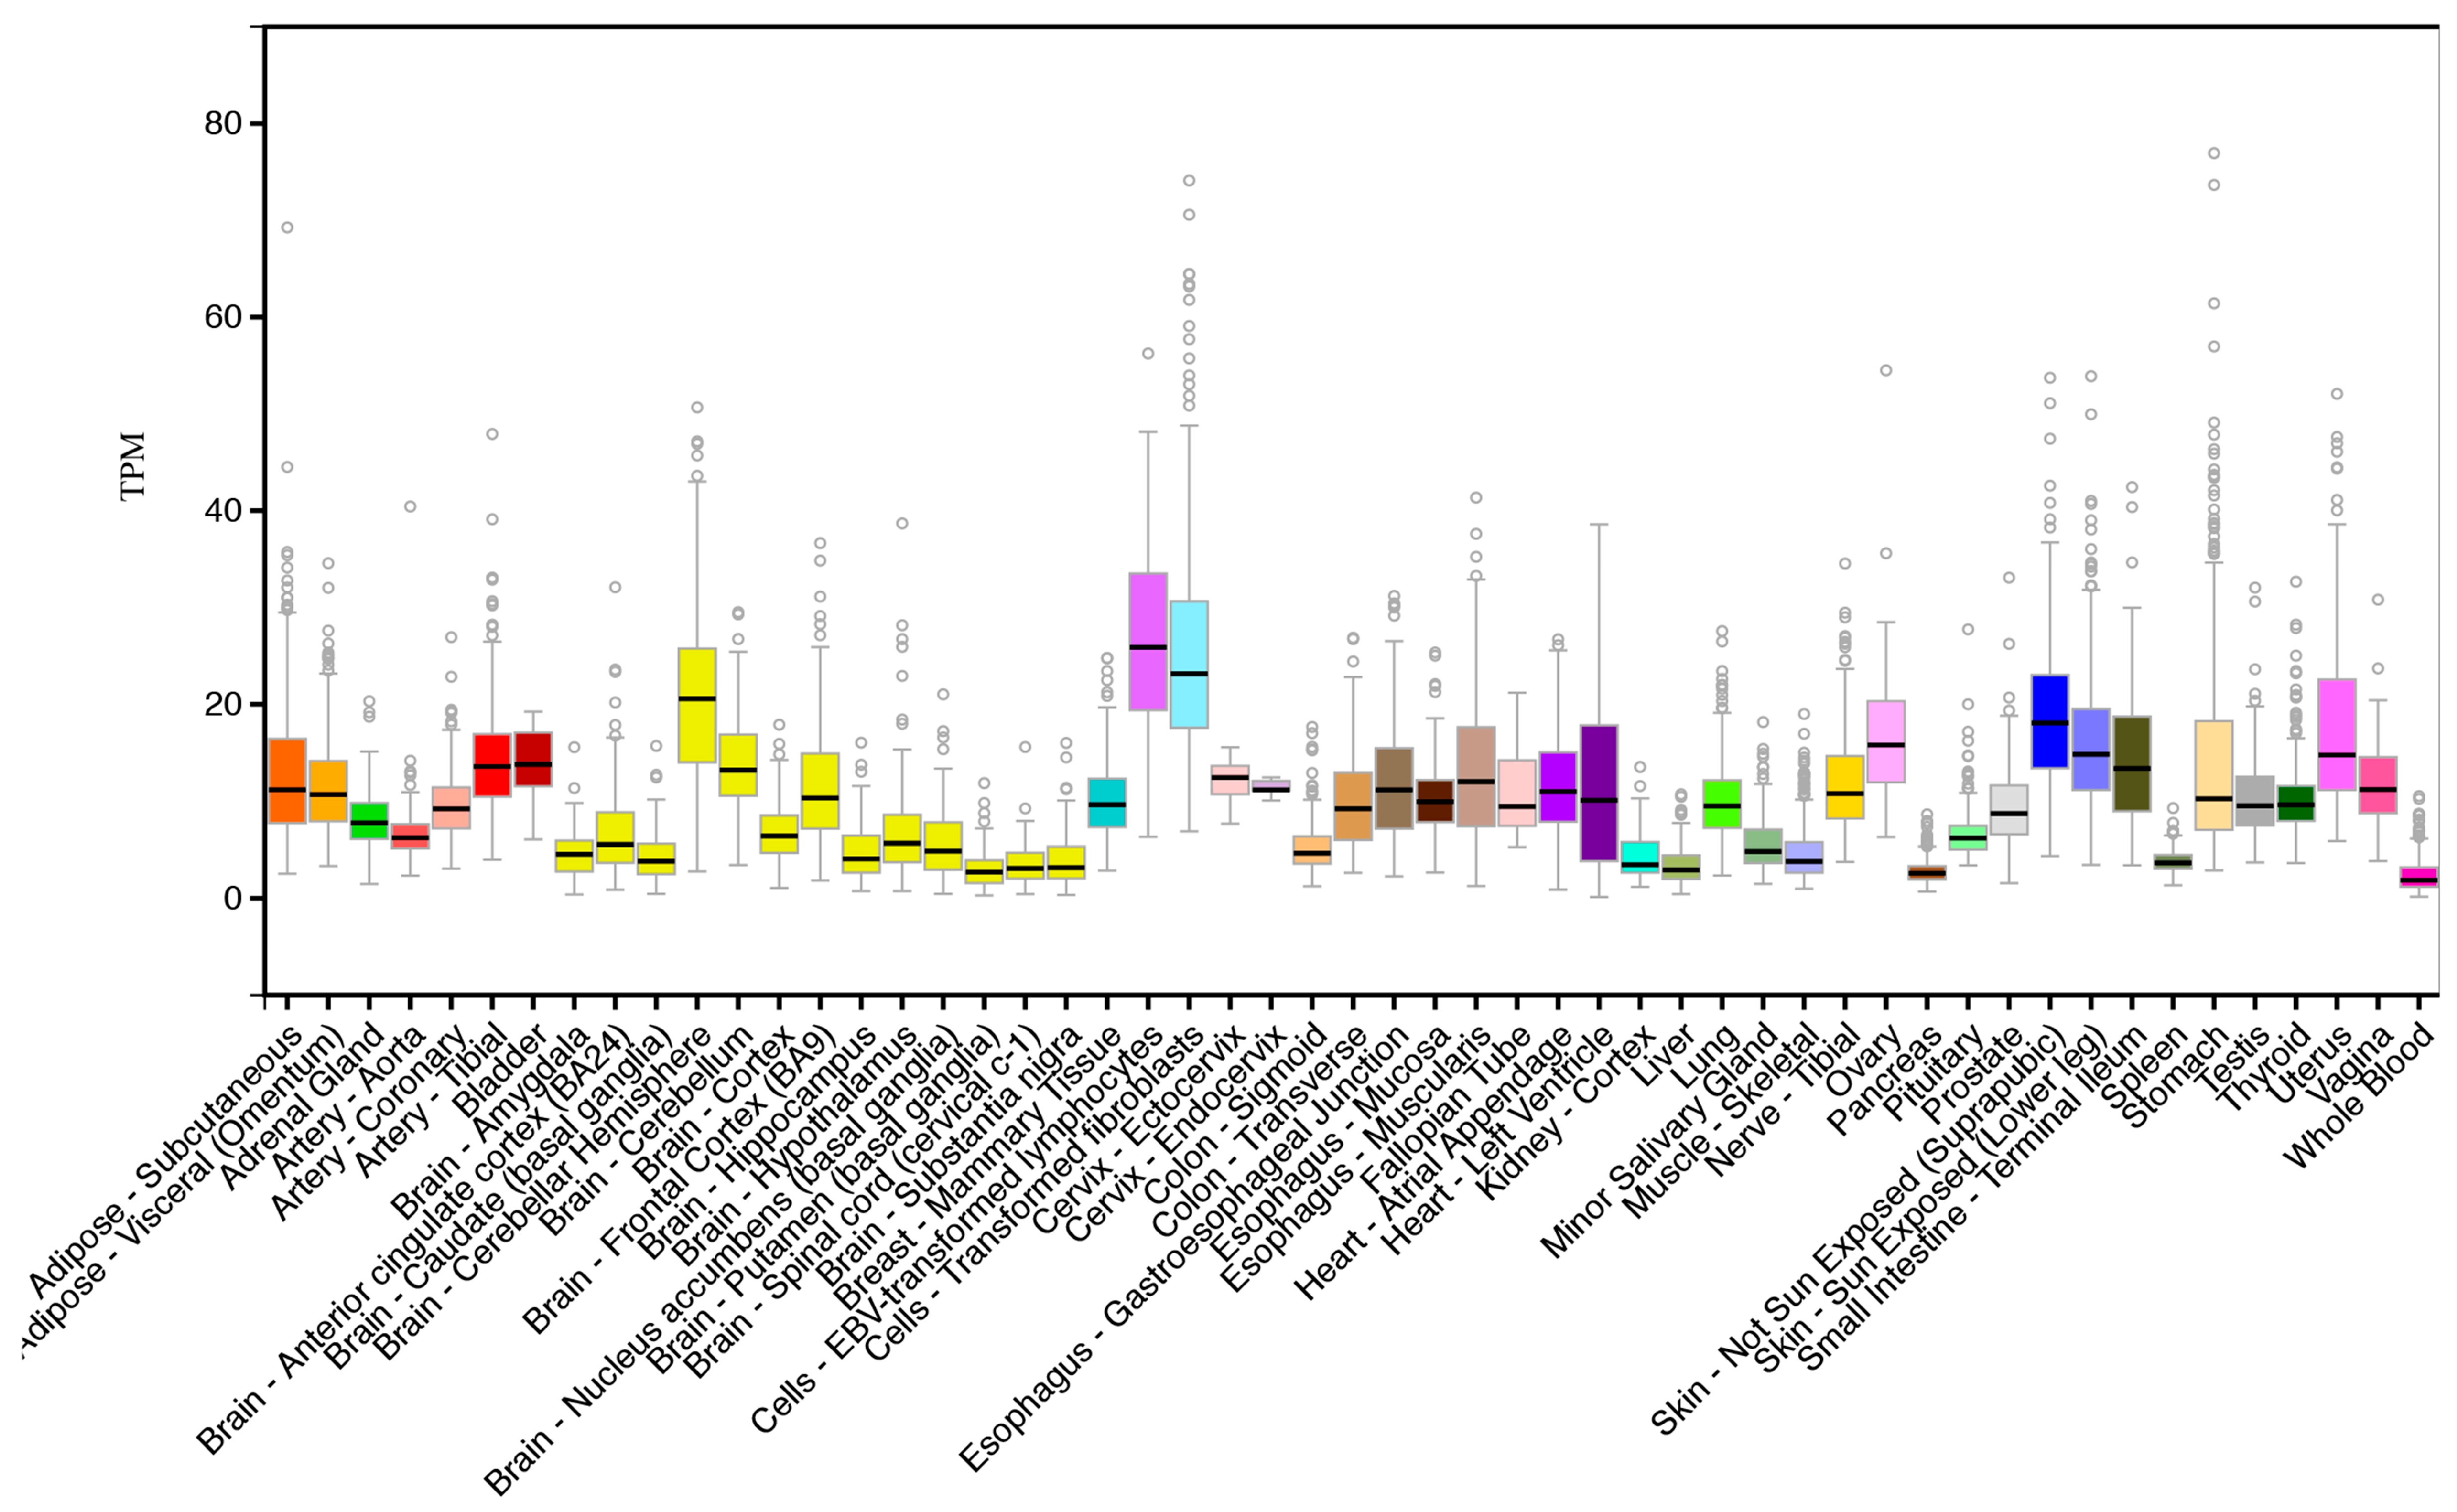
2.2. CERS6 Gene Expression

Two major transcripts have been identified for CERS6, (CERS6.1 and CERS6.2), with the second isoform encoding an enzyme with 384 residues, lacking eight amino acids (Ala335–His342) within the C-terminal cytoplasmic domain, but retaining key active site and transmembrane sequences. Interestingly, only one transcript has been identified previously for CERS6 [33], and the properties and function of the short form identified here are not known at present. The shorter CerS6.2 was routinely observed for all mammalian and chicken BLAST analyses undertaken, suggesting that two CerS6 isoforms were retained throughout mammalian evolution.
Tissue expression analysis of human CERS6 transcripts demonstrated a wide distribution profile, with highest levels observed in transformed lymphocytes and fibroblasts, as well as in skin, small intestine, cerebellar hemispheres and frontal cortex, heart ventricle, ovary, stomach and uterus (Figure 4). This is indicative of a broad role throughout the body for this enzyme in the biosynthesis of C14 and C16 ceramides that are required for maintaining normal membrane function and fluidity and for variety of signaling processes [39].

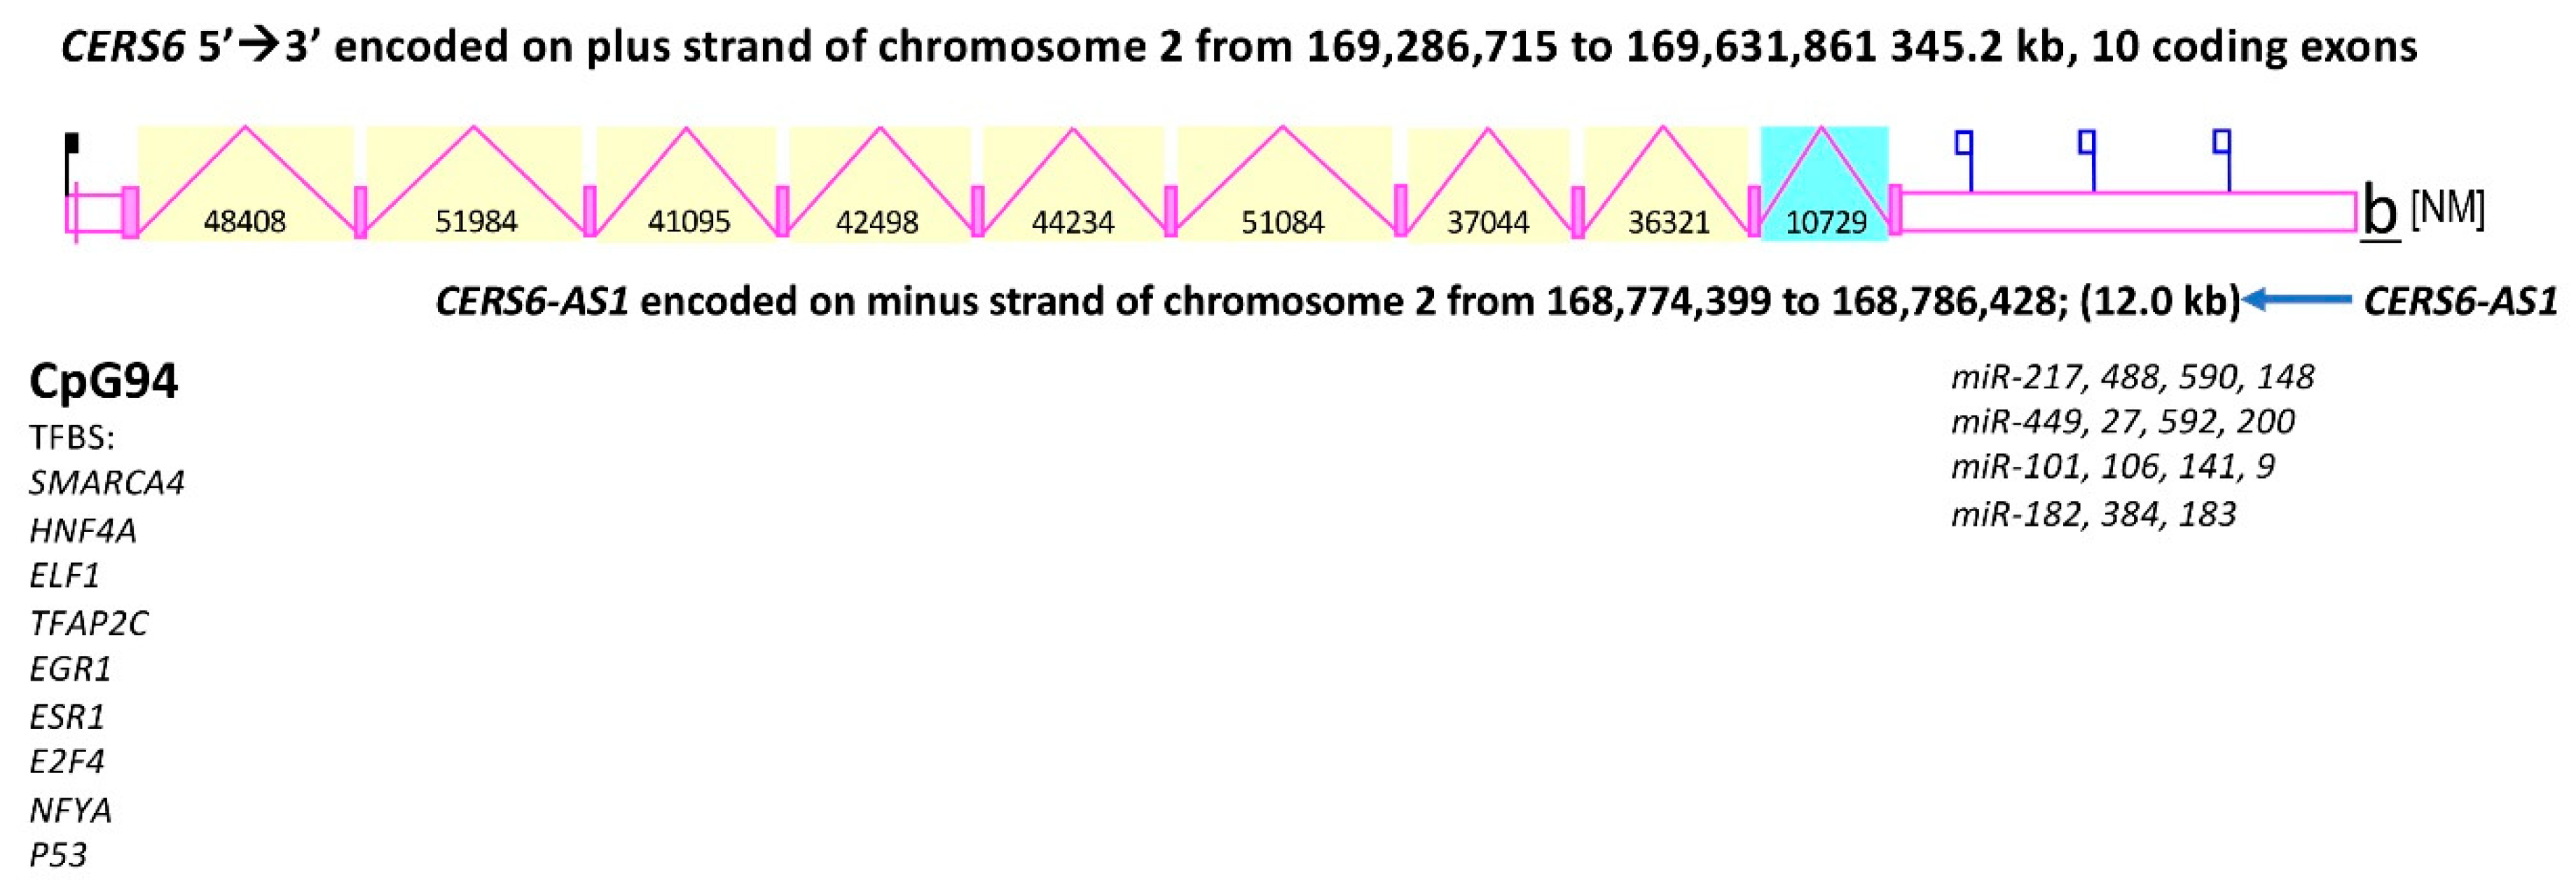
2.3. Comparative Analysis of Vertebrate CerS6 Genes and Human CERS1–5 Genes

Table 1 summarizes comparisons of chromosomal locations, exonic structures and sizes for vertebrate CerS6 genes. The human CERS6 gene is located on the positive strand of human chromosome 2, contains ten exons, and spans > 300 Kbps of DNA (CERS6 gene structure is depicted in Figure 5). It is the largest of the human CERS genes ranging from 9.8 Kbps (CERS2), 27.6 Kbps (CERS1), 37.6 Kbps (CERS5), 50 Kbps (CERS4), 143.9 Kbps (CERS3) to 313.2 Kbps (CERS6) (see Table 1 and Table 2). Interestingly, the mammalian CerS6 genes are 3–5 times larger than the bird, lizard, frog or fish CerS6 genes, though the number of exons and amino acids are preserved (Table 1). The human CERS genes are located on separate chromosomes, with the exception of CERS1 and CERS4 which are distantly located on human chromosome 19 (Table 1 and Table 2), consistent with previous report [5]. While human CERS1 gene has seven exons, the other human CERSes contain nine (CERS2) or ten (CERS3, CERS4, CERS5, CERS6) exons. All of the mammalian CerS6 genes examined also contained ten coding exons, were larger in size (>243 Kbps for rat Cers6) than the other human CERS genes and were encoded on the positive DNA strand (with the exception of marmoset CerS6) (Table 1).
Compared to human CERS6 protein, other human ceramide synthases had slightly varying lengths: CERS1 (350 amino acids, aa), CERS2 (380 aa), CERS3 (383 aa), CERS4 (394 aa) and CERS5 (392 aa) (Table 1 and Table 2). The human and other mammalian CerS6 sequences examined were 90% or more identical, suggesting that these are the products of the same family of genes. However, pair-wise comparisons of sequence identities of the human CERS6 and human CERS1–5 proteins showed identities within 22–63% range (Table 3), indicating that these orthologs are members of distinct CerS gene families (Table 1 and Table 2). The human CERS5 and CERS6 sequences were 62% identical, while the identity to human CERS1–4 enzymes was lower, indicating that CERS5 and 6 are more closely related to each other than to other human CERS enzymes, as previously reported [18]. The human CERS1 sequence was more distantly related with other human CERS homologs (22–27% identity) whereas human CERS2 and CERS3 sequences showed more similarity with each other (51% identity) than with other human CERSes (Table 3). The sequence alignment (Figure 3) of all six human CERS enzymes demonstrates that the first cytoplasmic domain and the last 30 amino acid stretch of the c-terminal cytoplasmic domain show the lowest identity between the family members, while the transmembrane and lumenal domains have higher identities.
Interestingly, a CERS6-AS1 (antisense) gene was located proximate to human CERS6 on the minus strand of chromosome 2 (Figure 5). The non-coding transcription is not rare in biological systems: it takes place in organisms from all kingdoms of life and 25–40% of human expressed sequences are connected to antisense transcription [41,42]. Natural antisense transcripts were shown to function in early embryonic development, healthy growth and disease. For example, p53 tumor suppressor was shown to be regulated by the anti-sense transcript Wrap53 [43]. Thus, presence of CERS6-AS1 indicates that it may play a role in regulating expression of CERS6 in different tissues of the body or during development. Figure 5 also depicts the exonic and intronic structure of the human CERS6 gene, together with the presence of a CpG island containing 94 CpGs and several transcription factor-binding sites within the untranslated 5′ region, as well as binding sites for 15 microRNAs within the 3′ untranslated region of this gene.
It should be noted, that Figure 5 shows the regulatory elements (CpG island, transcription factors and miRNAs) identified by the on-line tools, which may not reflect all regulatory elements. Thus, recent study from our laboratory has experimentally demonstrated that human CERS6 is transcriptionally regulated by the p53 protein via direct binding to a non-canonical site in the CERS6 promoter region [44]. It is apparent that with one experimentally established and eight predicted transcription factor binding sites, a CpG island and 15 miRNA-binding sites, the CERS6 gene has multiple mechanisms for regulation of its transcription and translation. Unfortunately, most of these mechanisms which may play significant roles during development or stress response are not studied.

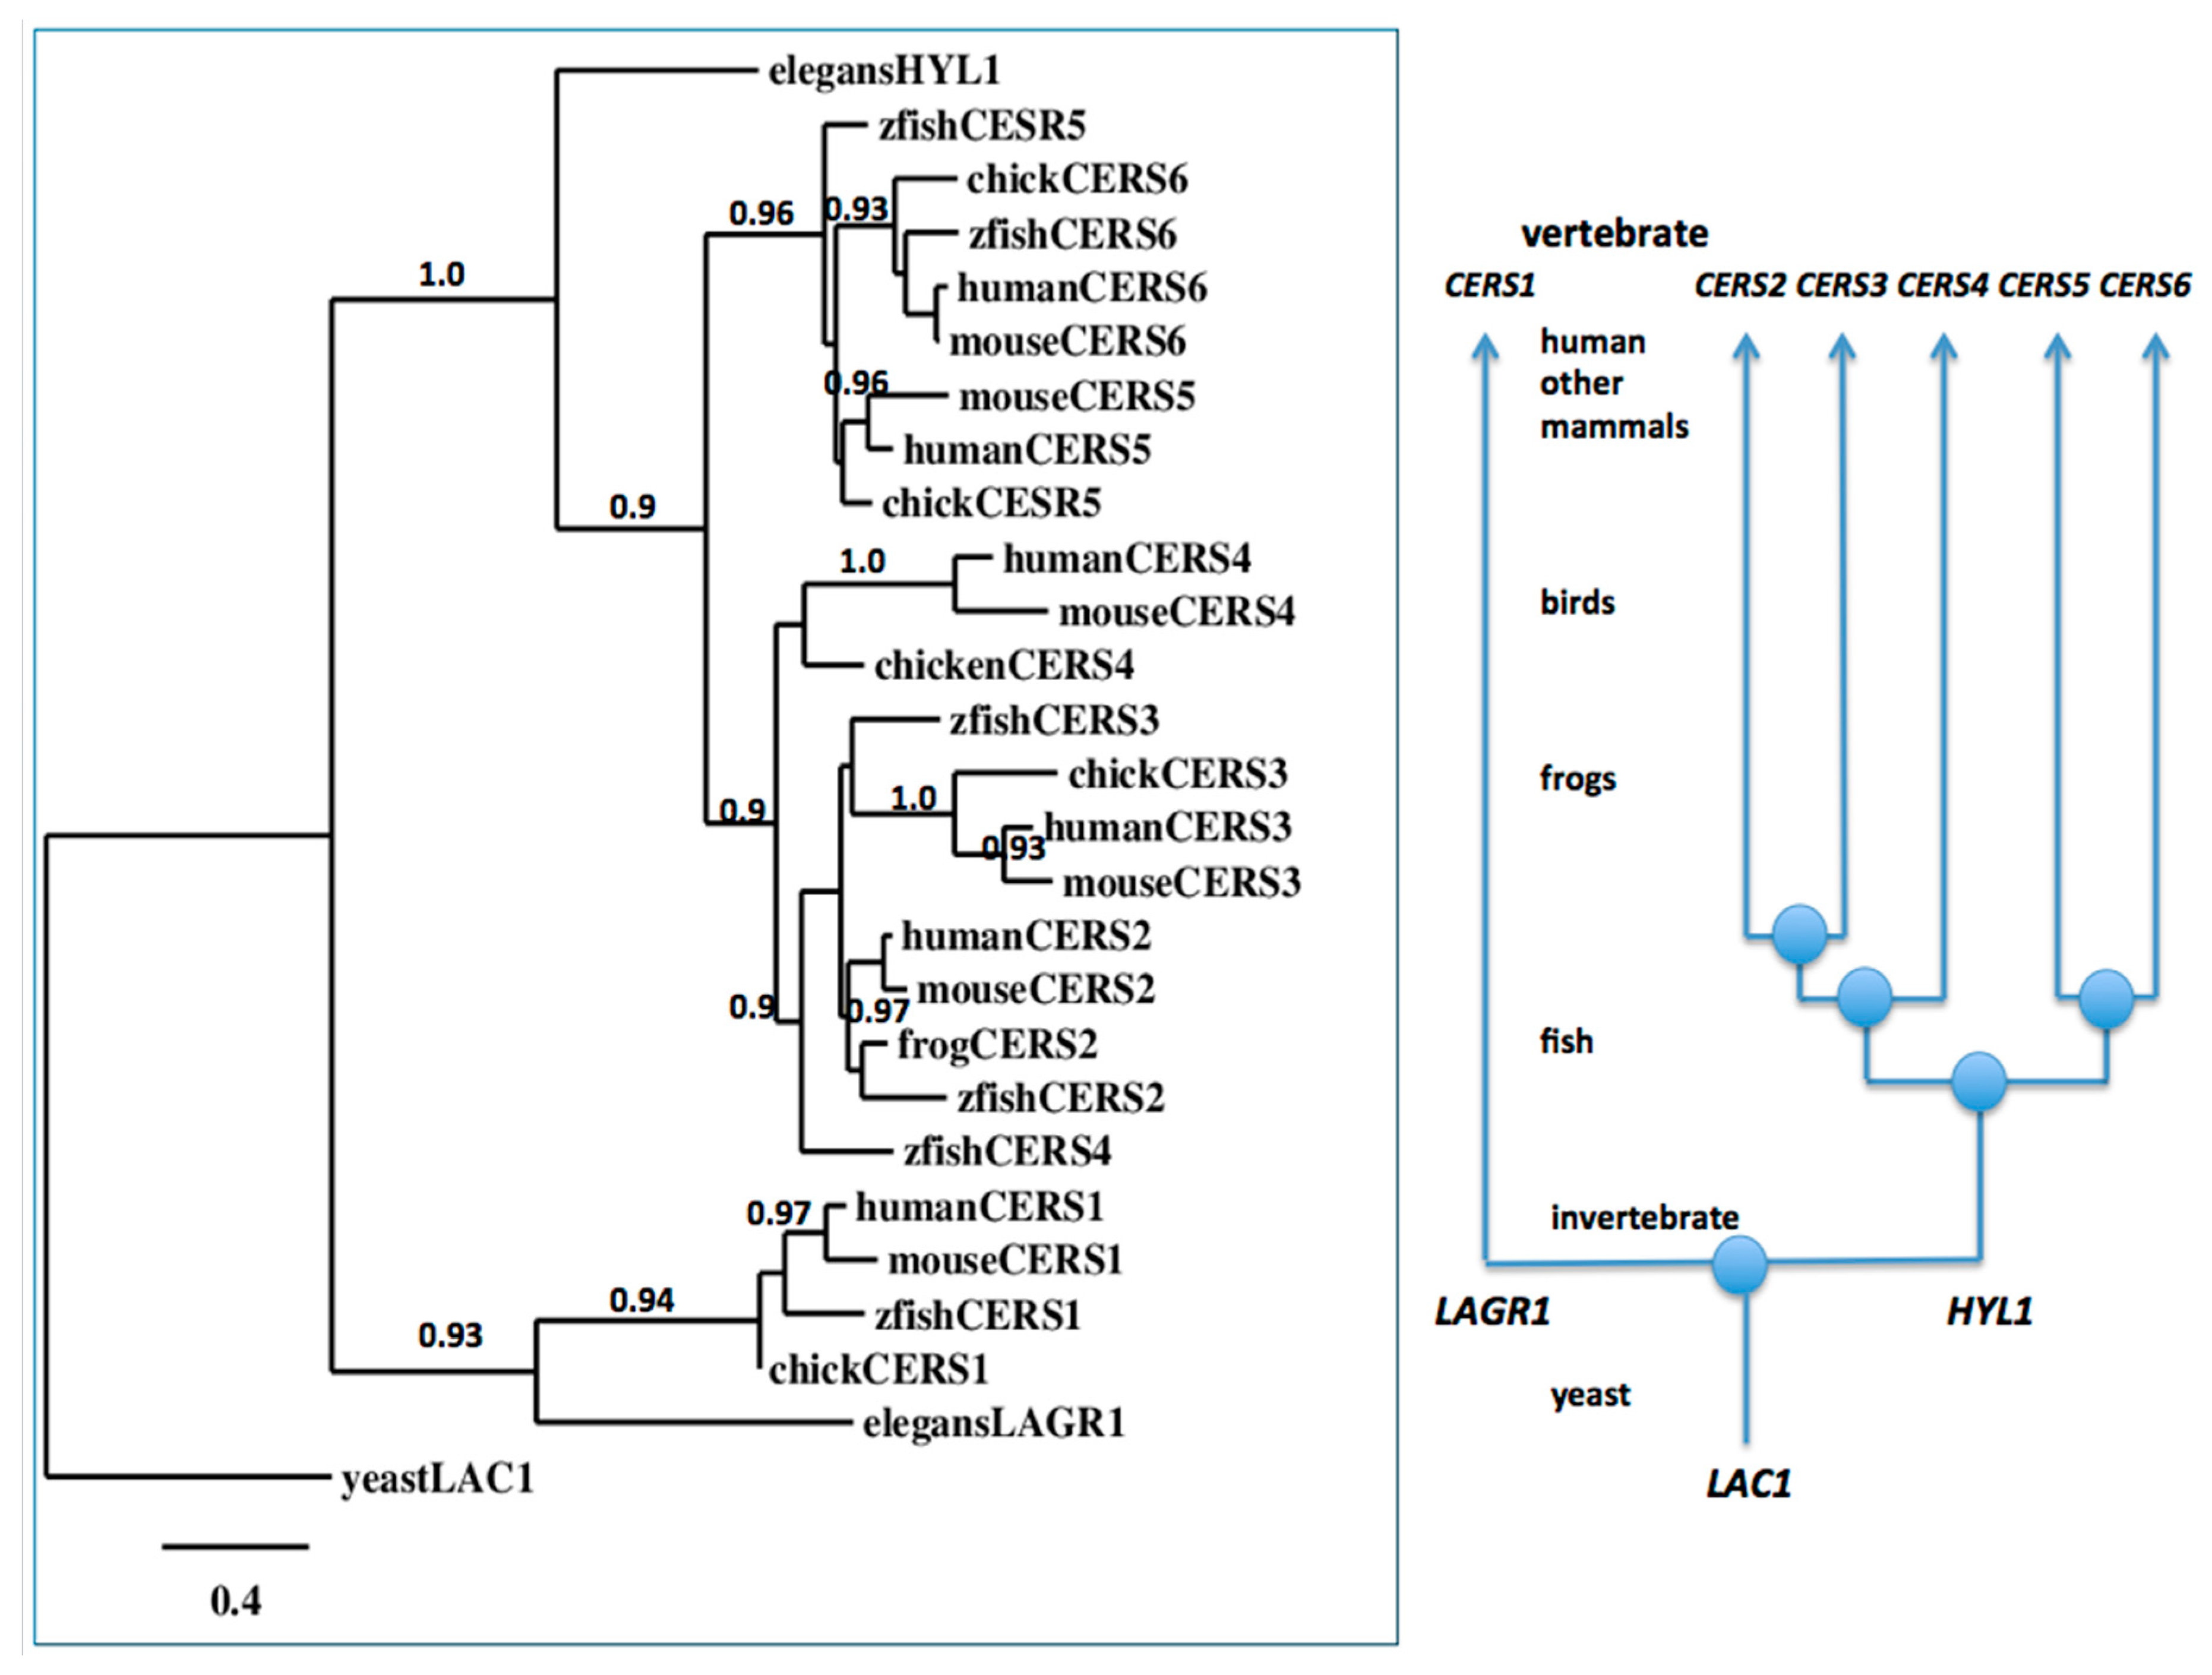
2.4. Evolution of Vertebrate CerS1–6 Genes from the Invertebrate Lagr1 and Hyl1 Genes

A phylogenetic tree (Figure 6) was generated by the progressive alignment of four vertebrate CerS6 sequences, several vertebrate CerS1–5 amino acid sequences and nematode (Caenorhabditis elegans) Hyl1 and Lagr1 sequences, with the baker’s yeast (Saccharomyces cerevisiae) Lac1 sequence [34], which was also used to root the tree. Details of the vertebrate, nematode and yeast CerS-like genes and enzymes are presented in Table 1 and Table 3. Interestingly, the rat CerS5 gene is located on X chromosome, a feature that has not been reported previously. The phylogram (Figure 6) shows clustering of the CerS-like sequences into two groups, which is consistent with their evolutionary relatedness and separate groupings as distinct CerS1-like and CerS2–6-like genes and enzymes. It is apparent that the CerS1 gene evolved from a distinct invertebrate CerS-like gene family LAGR1 which has been retained throughout vertebrate and invertebrate evolution. In contrast, the invertebrate HYL1-like gene family has undergone several gene duplication events prior to the appearance of the ancestral vertebrate genome, forming the CerS2–6 gene families, also retained throughout vertebrate evolution.
Among these gene families, CerS5/CerS6 and CerS2/CerS3 gene families are more closely related to CerS4 than to each other. It is also apparent that the evolution of the mammalian CerS6 genes has occurred at a more conservative rate than of the mammalian CerS5 genes, given the reduced genetic distances observed for the primate CerS6 encoded sequences, in comparison with the primate CerS5 encoded sequences. Stronger conservation of the CerS6 gene family could reflect an important additional role of the enzyme, considering a very similar acyl-CoA specificity of CerS5 and CerS6. The phylogenetic tree also suggests that the invertebrate CerS5 gene may have served as a primordial ancestor for both of the vertebrate CerS5 and CerS6 genes.

3. Methods

3.1. CerS Gene and Protein Identification

Protein BLAST analyses used National Center for Biotechnology Information (NCBI) web tools [45] to examine vertebrate and invertebrate homologs using human and mouse CerS6 amino acid sequences previously described (Table 1) [18,46]. Non-redundant protein sequence databases for the following genomes were examined using the BLASTP algorithm: chimpanzee (Pan troglodytes), gorilla (Gorilla gorilla), gibbon (Nomascus leucogenys), baboon (Papio anubis), rhesus monkey (Macaca mulata), marmoset (Callithrix jacchus), mouse lemur (Miscrocebus murinus), mouse (Mus musculus), rat (Rattus norvegicus), horse (Equus caballus), dog (Cannis familiaris), opossum (Monodelphis domestica), chicken (Gallus gallus), lizard (Anolis carolensis), frog (Xenopus tropicalis) and zebrafish (Danio rerio). The sequences for predicted mRNAs and encoded CerS6-like proteins were recorded and retained in FASTA format. To further study each of the CerS6 genes (predict exon boundary locations and gene sizes (Table 1)), BLAST-like alignment tool (BLAT) analyses using the UCSC Genome Browser [47] were undertaken for each of the predicted CerS6 amino acid sequences. Default settings were applied in each case. Similar BLAT analyses were performed for other ceramide synthases. Structures for the two major human CerS6 splice-variants were obtained using the AceView website and NCBI web tools [40]. CerS6 sequence alignment was completed using CLUSTAL Omega web tools with default settings (EMBL-EBI, Hinxton, Cambridgeshire, UK, https://www.ebi.ac.uk/Tools/msa/clustalo/).

3.2. Predicted Structures and Properties of Mammalian CerS6 Enzymes

Molecular weights, isoelectric points and predicted location of transmembrane, lumenal and cytosolic domains for mammalian and chicken CerS6 proteins were obtained using Expasy web tools [31]. The identification of conserved domains for CerS6 proteins was conducted using NCBI web tools [32]. Analysis of CerS6 domain organization was performed using TMHMM Server v. 2.0 from DTU Bioinformatics (Kongens Lyngby, Denmark, http://www.cbs.dtu.dk/services/TMHMM/). Alignment of human Cers1–6 enzymes and prediction of the membrane, cytoplasmic and lumenal regions in all human CerS enzymes was performed using PSI/TM-Coffee V.11.00.d625267 software (T-Coffee Server, Centre for Genomic Regulation, Barcelona, Spain) with default settings [48].

3.3. Comparative Human Tissue CERS6 Gene Expression

RNA-seq gene expression profiles across 53 selected tissues (or tissue segments) were obtained from the public database for human genes, based on measured expression levels of CERS6 in samples from 175 individuals (GTEx Consortium, 2015). Data Source: GTEx Analysis Release V6p (dbGaP phs000424.v6.p1; https://gtexportal.org).

3.4. Phylogeny Studies and Sequence Alignments

Phylogenetic analyses were performed to reconstruct phylogenetic relationships using free phylogeny.fr software (CNRS, France, http://www.phylogeny.fr/index.cgi) with default settings [49,50] (Figure 7). Sequences were identified as vertebrate and invertebrate CerS-like proteins and aligned using Clustal Omega [51] (Table 1).

4. Conclusions

The results of the present study indicate that vertebrate CerS6 and CerS5 genes and encoded proteins represent two closely related CerS gene families, which are distinct from other vertebrate CerS gene families (CerS1–4), similar to previously reported analyses [5,6]. At least eleven domains were identified for the vertebrate CerS6 proteins examined: three lumenal domains, including an N-terminus lumenal domain containing a conserved N-glycosylation site (Asn18); five predicted transmembrane domains (TM1–5) define organization of this enzyme within the endoplasmic reticulum membrane; and three cytoplasmic domains, with the C-terminus containing conserved acidic residues, that may define the function of this domain in cytoplasm. The active site for CerS6 has not been precisely experimentally defined yet, however conserved amino acids, including a double histidine site (His211-His212) located within TM3; Lys134, mutation of which resulted in a 50% loss in activity [36] and three consecutive tyrosine residues (Tyr180-Tyr181-Tyr182) may serve as elements contributing to the biosynthetic or other key roles for this enzyme.
Mammalian CerS6 enzymes are encoded by a single large gene (>240 Kbps) in all genomes studied, with ten exons located on the positive strand for all mammalian genes examined, with the exception of marmoset CerS6, for which the ten exons were located on the negative strand (Table 1). Phylogenetic studies using vertebrate CerS6 sequences, vertebrate CerS1–5 sequences and nematode LAGR1 and HYL1 sequences, indicated that these genes and enzymes represent two distinct but related gene families which have apparently evolved from a single yeast LAC1 gene.

Author Contributions

Conceptualization, R.S.H. and N.I.K.; Methodology, R.S.H.; Software, R.S.H.; Validation, N.I.K. and K.B.; Formal Analysis, R.S.H. and N.I.K.; Writing—Original Draft Preparation, R.S.H. and N.I.K.; Writing—Review & Editing, N.I.K. and K.B.; Supervision, N.I.K.; Funding Acquisition, N.I.K.

Funding

This research was funded by the NIH grant CA193782 to N.I.K and the APC was funded by CA193782.

Acknowledgments

The authors would like to acknowledge Sebastien Santini (CNRS/AMU IGS UMR7256) who manages the Phylogeny.fr site (https://www.phylogeny.fr) used in this work.

Conflicts of Interest

The authors declare no conflict of interest.

References

  1. Venkataraman, K.; Riebeling, C.; Bodennec, J.; Riezman, H.; Allegood, J.C.; Sullards, M.C.; Merrill, A.H., Jr.; Futerman, A.H. Upstream of growth and differentiation factor 1 (uog1), a mammalian homolog of the yeast longevity assurance gene 1 (LAG1), regulates N-stearoyl-sphinganine (C18-(dihydro)ceramide) synthesis in a fumonisin B1-independent manner in mammalian cells. J. Biol. Chem. 2002, 277, 35642–35649. [Google Scholar] [CrossRef] [PubMed]
  2. D’Mello, N.P.; Childress, A.M.; Franklin, D.S.; Kale, S.P.; Pinswasdi, C.; Jazwinski, S.M. Cloning and characterization of LAG1, a longevity-assurance gene in yeast. J. Biol. Chem. 1994, 269, 15451–15459. [Google Scholar] [PubMed]
  3. Guillas, I.; Kirchman, P.A.; Chuard, R.; Pfefferli, M.; Jiang, J.C.; Jazwinski, S.M.; Conzelmann, A. C26-CoA-dependent ceramide synthesis of Saccharomyces cerevisiae is operated by Lag1p and Lac1p. EMBO J. 2001, 20, 2655–2665. [Google Scholar] [CrossRef] [PubMed]
  4. Pewzner-Jung, Y.; Ben-Dor, S.; Futerman, A.H. When do Lasses (longevity assurance genes) become CerS (ceramide synthases)?: Insights into the regulation of ceramide synthesis. J. Biol. Chem. 2006, 281, 25001–25005. [Google Scholar] [CrossRef] [PubMed]
  5. Levy, M.; Futerman, A.H. Mammalian ceramide synthases. IUBMB Life 2010, 62, 347–356. [Google Scholar] [CrossRef] [PubMed]
  6. Schiffmann, S.; Ferreiros, N.; Birod, K.; Eberle, M.; Schreiber, Y.; Pfeilschifter, W.; Ziemann, U.; Pierre, S.; Scholich, K.; Grösch, S.; et al. Ceramide synthase 6 plays a critical role in the development of experimental autoimmune encephalomyelitis. J. Immunol. 2012, 188, 5723–5733. [Google Scholar] [CrossRef] [PubMed]
  7. Castro, B.M.; Prieto, M.; Silva, L.C. Ceramide: A simple sphingolipid with unique biophysical properties. Prog. Lipid Res. 2014, 54, 53–67. [Google Scholar] [CrossRef] [PubMed]
  8. Hannun, Y.A.; Obeid, L.M. Many ceramides. J. Biol. Chem. 2011, 286, 27855–27862. [Google Scholar] [CrossRef] [PubMed]
  9. Ginkel, C.; Hartmann, D.; vom Dorp, K.; Zlomuzica, A.; Farwanah, H.; Eckhardt, M.; Sandhoff, R.; Degen, J.; Rabionet, M.; Dere, E.; et al. Ablation of neuronal ceramide synthase 1 in mice decreases ganglioside levels and expression of myelin-associated glycoprotein in oligodendrocytes. J. Biol. Chem. 2012, 287, 41888–41902. [Google Scholar] [CrossRef] [PubMed]
  10. Zigdon, H.; Kogot-Levin, A.; Park, J.W.; Goldschmidt, R.; Kelly, S.; Merrill, A.H., Jr.; Scherz, A.; Pewzner-Jung, Y.; Saada, A.; Futerman, A.H. Ablation of ceramide synthase 2 causes chronic oxidative stress due to disruption of the mitochondrial respiratory chain. J. Biol. Chem. 2013, 288, 4947–4956. [Google Scholar] [CrossRef] [PubMed]
  11. Park, W.J.; Brenner, O.; Kogot-Levin, A.; Saada, A.; Merrill, A.H., Jr.; Pewzner-Jung, Y.; Futerman, A.H. Development of pheochromocytoma in ceramide synthase 2 null mice. Endocr. Relat. Cancer 2015, 22, 623–632. [Google Scholar] [CrossRef] [PubMed] [Green Version]
  12. Mizutani, Y.; Kihara, A.; Igarashi, Y. LASS3 (longevity assurance homologue 3) is a mainly testis-specific (dihydro)ceramide synthase with relatively broad substrate specificity. Biochem. J. 2006, 398, 531–538. [Google Scholar] [CrossRef] [PubMed]
  13. Jennemann, R.; Rabionet, M.; Gorgas, K.; Epstein, S.; Dalpke, A.; Rothermel, U.; Bayerle, A.; van der Hoeven, F.; Imgrund, S.; Kirsch, J.; et al. Loss of ceramide synthase 3 causes lethal skin barrier disruption. Hum. Mol. Genet. 2012, 21, 586–608. [Google Scholar] [CrossRef] [PubMed]
  14. Veret, J.; Coant, N.; Berdyshev, E.V.; Skobeleva, A.; Therville, N.; Bailbe, D.; Gorshkova, I.; Natarajan, V.; Portha, B.; Le Stunff, H. Ceramide synthase 4 and de novo production of ceramides with specific N-acyl chain lengths are involved in glucolipotoxicity-induced apoptosis of INS-1 β-cells. Biochem. J. 2011, 438, 177–189. [Google Scholar] [CrossRef] [PubMed]
  15. Peters, F.; Vorhagen, S.; Brodesser, S.; Jakobshagen, K.; Brüning, J.C.; Niessen, C.M.; Krönke, M. Ceramide synthase 4 regulates stem cell homeostasis and hair follicle cycling. J. Investig. Dermatol. 2015, 135, 1501–1509. [Google Scholar] [CrossRef] [PubMed]
  16. Lahiri, S.; Futerman, A.H. LASS5 is a bona fide dihydroceramide synthase that selectively utilizes palmitoyl-CoA as acyl donor. J. Biol. Chem. 2005, 280, 33735–33738. [Google Scholar] [CrossRef] [PubMed]
  17. Gosejacob, D.; Jäger, P.S.; Vom Dorp, K.; Frejno, M.; Carstensen, A.C.; Köhnke, M.; Degen, J.; Dörmann, P.; Hoch, M. Ceramide Synthase 5 Is Essential to Maintain C16:0-Ceramide Pools and Contributes to the Development of Diet-induced Obesity. J. Biol. Chem. 2016, 291, 6989–7003. [Google Scholar] [CrossRef] [PubMed]
  18. Weinmann, A.; Galle, P.R.; Teufel, A. LASS6, an additional member of the longevity assurance gene family. Int. J. Mol. Med. 2005, 16, 905–910. [Google Scholar] [CrossRef] [PubMed]
  19. Ebel, P.; Vom Dorp, K.; Petrasch-Parwez, E.; Zlomuzica, A.; Kinugawa, K.; Mariani, J.; Minich, D.; Ginkel, C.; Welcker, J.; Degen, J.; et al. Inactivation of ceramide synthase 6 in mice results in an altered sphingolipid metabolism and behavioral abnormalities. J. Biol. Chem. 2013, 288, 21433–21447. [Google Scholar] [CrossRef] [PubMed]
  20. Turpin, S.M.; Nicholls, H.T.; Willmes, D.M.; Mourier, A.; Brodesser, S.; Wunderlich, C.M.; Mauer, J.; Xu, E.; Hammerschmidt, P.; Brönneke, H.S.; et al. Obesity-induced CerS6-dependent C16:0 ceramide production promotes weight gain and glucose intolerance. Cell Metab. 2014, 20, 678–686. [Google Scholar] [CrossRef] [PubMed]
  21. Scheffel, M.J.; Helke, K.; Lu, P.; Bowers, J.S.; Ogretmen, B.; Garrett-Mayer, E.; Paulos, C.M.; Voelkel-Johnson, C. Adoptive Transfer of Ceramide Synthase 6 Deficient Splenocytes Reduces the Development of Colitis. Sci. Rep. 2017, 7, 15552. [Google Scholar] [CrossRef] [PubMed] [Green Version]
  22. Helke, K.; Angel, P.; Lu, P.; Garrett-Mayer, E.; Ogretmen, B.; Drake, R.; Voelkel-Johnson, C. Ceramide Synthase 6 Deficiency Enhances Inflammation in the DSS model of Colitis. Sci. Rep. 2018, 8, 1627. [Google Scholar] [CrossRef] [PubMed]
  23. Eberle, M.; Ebel, P.; Mayer, C.A.; Barthelmes, J.; Tafferner, N.; Ferreiros, N.; Ulshöfer, T.; Henke, M.; Foerch, C.; Männer de Bazo, A.; et al. Exacerbation of experimental autoimmune encephalomyelitis in ceramide synthase 6 knockout mice is associated with enhanced activation/migration of neutrophils. Immunol. Cell Biol. 2015, 93, 825–836. [Google Scholar] [CrossRef] [PubMed]
  24. Sofi, M.H.; Heinrichs, J.; Dany, M.; Nguyen, H.; Dai, M.; Bastian, D.; Schutt, S.; Wu, Y.; Daenthanasanmak, A.; Gencer, S.; et al. Ceramide synthesis regulates T cell activity and GVHD development. JCI Insight 2017, 2, 91701. [Google Scholar] [CrossRef] [PubMed]
  25. Hoeferlin, L.A.; Fekry, B.; Ogretmen, B.; Krupenko, S.A.; Krupenko, N.I. (2013) Folate stress induces apoptosis via p53-dependent de novo ceramide synthesis and up-regulation of ceramide synthase 6. J. Biol. Chem. 2013, 288, 12880–12890. [Google Scholar] [CrossRef] [PubMed]
  26. Fekry, B.; Jeffries, K.A.; Esmaeilniakooshkghazi, A.; Szulc, Z.M.; Knagge, K.J.; Kirchner, D.R.; Horita, D.A.; Krupenko, S.A.; Krupenko, N.I. C16-ceramide is a natural regulatory ligand of p53 in cellular stress response. Nat. Commun 2018, in press. [Google Scholar] [CrossRef]
  27. Schüll, S.; Günther, S.D.; Brodesser, S.; Seeger, J.M.; Tosetti, B.; Wiegmann, K.; Pongratz, C.; Diaz, F.; Witt, A.; Andree, M.; et al. Cytochrome c oxidase deficiency accelerates mitochondrial apoptosis by activating ceramide synthase 6. Cell Death Dis. 2015, 6, e1691. [Google Scholar] [CrossRef] [PubMed]
  28. Fekry, B.; Esmaeilniakooshkghazi, A.; Krupenko, S.A.; Krupenko, N.I. Ceramide Synthase 6 Is a Novel Target of Methotrexate Mediating Its Antiproliferative Effect in a p53-Dependent Manner. PLoS ONE 2016, 11, e0146618. [Google Scholar] [CrossRef] [PubMed]
  29. Tidhar, R.; Ben-Dor, S.; Wang, E.; Kelly, S.; Merrill, A.H., Jr.; Futerman, A.H. Acyl chain specificity of ceramide synthases is determined within a region of 150 residues in the Tram-Lag-CLN8 (TLC) domain. J. Biol. Chem. 2012, 287, 3197–3206. [Google Scholar] [CrossRef] [PubMed]
  30. Mizutani, Y.; Kihara, A.; Igarashi, Y. Mammalian Lass6 and its related family members regulate synthesis of specific ceramides. Biochem. J. 2005, 390, 263–271. [Google Scholar] [CrossRef] [PubMed]
  31. Krogh, A.; Larsson, B.; von Heijne, G.; Sonnhammer, E.L. Predicting transmembrane protein topology with a hidden Markov model: Application to complete genomes. J. Mol. Biol. 2001, 305, 567–580. [Google Scholar] [CrossRef] [PubMed]
  32. Marchler-Bauer, A.; Lu, S.; Anderson, J.B.; Chitsaz, F.; Derbyshire, M.K.; DeWeese-Scott, C.; Fong, J.H.; Geer, L.Y.; Geer, R.C.; Gonzales, N.R.; et al. CDD: A Conserved Domain Database for the functional annotation of proteins. Nucleic Acids Res. 2011, 39, D225–D229. [Google Scholar] [CrossRef] [PubMed]
  33. Mullen, T.D.; Hannun, Y.A.; Obeid, L.M. Ceramide synthases at the centre of sphingolipid metabolism and biology. Biochem. J. 2012, 441, 789–802. [Google Scholar] [CrossRef] [PubMed] [Green Version]
  34. Kageyama-Yahara, N.; Riezman, H. Transmembrane topology of ceramide synthase in yeast. Biochem. J. 2006, 398, 585–593. [Google Scholar] [CrossRef] [PubMed] [Green Version]
  35. Spassieva, S.; Seo, J.G.; Jiang, J.C.; Bielawski, J.; Alvarez-Vasquez, F.; Jazwinski, S.M.; Hannun, Y.A.; Obeid, L.M. Necessary role for the Lag1p motif in (dihydro)ceramide synthase activity. J. Biol. Chem. 2006, 281, 33931–33938. [Google Scholar] [CrossRef] [PubMed]
  36. Mesika, A.; Ben-Dor, S.; Laviad, E.L.; Futerman, A.H. A new functional motif in Hox domain-containing ceramide synthases: Identification of a novel region flanking the Hox and TLC domains essential for activity. J. Biol. Chem. 2007, 282, 27366–27373. [Google Scholar] [CrossRef] [PubMed]
  37. Sassa, T.; Hirayama, T.; Kihara, A. Enzyme Activities of the Ceramide Synthases CERS2-6 Are Regulated by Phosphorylation in the C-terminal Region. J. Biol. Chem. 2016, 291, 7477–7487. [Google Scholar] [CrossRef] [PubMed] [Green Version]
  38. Muir, A.; Ramachandran, S.; Roelants, F.M.; Timmons, G.; Thorner, J. TORC2-dependent protein kinase Ypk1 phosphorylates ceramide synthase to stimulate synthesis of complex sphingolipids. eLife 2014, 3, e03779. [Google Scholar] [CrossRef] [PubMed]
  39. Hernandez-Corbacho, M.J.; Canals, D.; Adada, M.M.; Liu, M.; Senkal, C.E.; Yi, J.K.; Mao, C.; Luberto, C.; Hannun, Y.A.; Obeid, L.M. Tumor Necrosis Factor-α (TNFα)-induced Ceramide Generation via Ceramide Synthases Regulates Loss of Focal Adhesion Kinase (FAK) and Programmed Cell Death. J. Biol. Chem. 2015, 290, 25356–25373. [Google Scholar] [CrossRef] [PubMed]
  40. Thierry-Mieg, D.; Thierry-Mieg, J. AceView: A comprehensive cDNA-supported gene and transcripts annotation. Genome Biol. 2006, 7, 11–14. [Google Scholar] [CrossRef] [PubMed]
  41. Chen, J.; Sun, M.; Kent, W.J.; Huang, X.; Xie, H.; Wang, W.; Zhou, G.; Shi, R.Z.; Rowley, J.D. Over 20% of human transcripts might form sense-antisense pairs. Nucleic Acids Res. 2004, 32, 4812–4820. [Google Scholar] [CrossRef] [PubMed] [Green Version]
  42. Engström, P.G.; Suzuki, H.; Ninomiya, N.; Akalin, A.; Sessa, L.; Lavorgna, G.; Brozzi, A.; Luzi, L.; Tan, S.L.; Yang, L.; et al. Complex Loci in human and mouse genomes. PLoS Genet. 2006, 2, e47. [Google Scholar] [CrossRef] [PubMed] [Green Version]
  43. Mahmoudi, S.; Henriksson, S.; Corcoran, M.; Mendez-Vidal, C.; Wiman, K.G.; Farnebo, M. Wrap53, a natural p53 antisense transcript required for p53 induction upon DNA damage. Mol. Cell 2009, 33, 462–471. [Google Scholar] [CrossRef] [PubMed]
  44. Fekry, B.; Jeffries, K.A.; Esmaeilniakooshkghazi, A.; Ogretmen, B.; Krupenko, S.A.; Krupenko, N.I. CerS6 Is a Novel Transcriptional Target of p53 Protein Activated by Non-genotoxic Stress. J. Biol. Chem. 2016, 291, 16586–16596. [Google Scholar] [CrossRef] [PubMed]
  45. Camacho, C.; Coulouris, G.; Avagyan, V.; Ma, N.; Papadopoulos, J.; Bealer, K.; Madden, T.L. BLAST+: Architecture and applications. BMC Bioinform. 2009, 10, 421. [Google Scholar] [CrossRef] [PubMed]
  46. Separovic, D.; Breen, P.; Joseph, N.; Bielawski, J.; Pierce, J.S.; VAN Burren, E.; Gudz, T.I. Ceramide synthase 6 knockdown suppresses apoptosis after photodynamic therapy in human head and neck squamous carcinoma cells. Anticancer Res. 2012, 32, 753–760. [Google Scholar] [PubMed]
  47. Kent, W.J.; Sugnet, C.W.; Furey, T.S.; Roskin, K.M.; Pringle, T.H.; Zahler, A.M.; Haussler, D. The human genome browser at UCSC. Genome Res. 2002, 12, 996–1006. [Google Scholar] [CrossRef] [PubMed]
  48. Chang, J.M.; Di Tommaso, P.; Taly, J.F.; Notredame, C. Accurate multiple sequence alignment of transmembrane proteins with PSI-Coffee. BMC Bioinform. 2002, 13, S1. [Google Scholar] [CrossRef] [PubMed]
  49. Dereeper, A.; Guignon, V.; Blanc, G.; Audic, S.; Buffet, S.; Chevenet, F.; Dufayard, J.F.; Guindon, S.; Lefort, V.; Lescot, M.; et al. Phylogeny.fr: Robust phylogenetic analysis for the non-specialist. Nucleic Acids Res. 2008, 36, W465–W469. [Google Scholar] [CrossRef] [PubMed] [Green Version]
  50. Dereeper, A.; Audic, S.; Claverie, J.M.; Blanc, G. BLAST-EXPLORER helps you building datasets for phylogenetic analysis. BMC Evol. Biol. 2010, 10, 8. [Google Scholar] [CrossRef] [PubMed]
  51. Sievers, F.; Higgins, D.G. Clustal Omega for making accurate alignments of many protein sequences. Protein Sci. 2018, 27, 135–145. [Google Scholar] [CrossRef] [PubMed]
Figure 1. Amino acid sequence alignments for vertebrate CerS6 enzymes: See Table 1 for sources of sequences; * shows identical residues for polypeptides; - similar alternate residues; - dissimilar alternate residues; exon start sites are underlined and in bold; predicted lumenal sites are shown in blue; predicted transmembrane sequences are in pink and numbered TM1–5 from N-terminal end; predicted cytoplasmic regions are in yellow; a predicted homeobox DNA binding domain (residues 66–127) is shown by black arrows; the Lag 1p motif (residues 202–253) is denoted by violet arrows; two predicted N-glycosylation sites in lumenal regions are shown in red; the two adjacent histidine residues (His) in the active site are in magenta; the acidic C-terminal domain is indicated, with acidic amino acid residues marked in brown and C-terminal serine (Ser) residues subject to phosphorylation shown in grey; 21 conserved residues for all CerS1–6 and yeast LAC1 sequences are shown in cyan; zfish refers to the zebra fish sequence. Note differences in sequences between human CERS6.1 and CERS6.2 isoforms. Sequence alignment has been completed using CLUSTAL Omega (EMBL-EBI, Hinxton, Cambridgeshire, UK, https://www.ebi.ac.uk/Tools/msa/clustalo/).
Biomolecules 08 00111 g001
Figure 2. Predicted transmembrane organization for human CERS6 enzyme. Regions of hydrophobicity are shown as striped red segments, with five transmembrane domains (TM1–5) identified (TMHMM Server v. 2.0, DTU Bioinformatics, Kongens Lyngby, Denmark). Predicted lumenal and cytoplasmic regions are shown in magenta and blue lines; the His211-His212 residues of the active site were positioned within TM3. Y-axis: probability (0–1) of forming a transmembrane helix; X-axis: amino acid position within human CERS6.
Biomolecules 08 00111 g002
Figure 3. Amino acid sequence alignment of human CERS enzymes. Sequence sources are listed in Table 1 and Table 3. The PSI/TM-Coffee software was used to align sequences and map membrane domains. Predicted lumenal sites are shown in blue; predicted transmembrane sequences are in pink and predicted cytoplasmic regions are in yellow; *, shows identical residues for all polypeptides; : - similar alternate residues; . - dissimilar alternate residues. Rectangular frame shows the same CerS6 sequence with the alternative domain topology prediction (TMHMM Server 2).
Biomolecules 08 00111 g003
Figure 4. Comparative tissue expression levels for human CERS6. RNA-seq gene expression profiles across 53 selected tissues (or tissue segments) were obtained from the public database for human CERS6, based on expression levels for 175 individuals (Data Source: GTEx Portal, GTEx Analysis Release V6p (dbGaP, accession number phs000424.v6.p1; https://gtexportal.org/home/gene/ENSG00000172292.10). TPM, Transcripts per million, calculated from a gene model with isoforms collapsed to a single gene. Box plots show a median and 25th and 75th percentiles; points are shown as the outliers if they are above or below 1.5 times the interquartile range.
Biomolecules 08 00111 g004
Figure 5. Structure of the human CERS6 gene. Derived from the AceView website [40]; the major isoform variant is shown with capped 5′- and 3′-ends for the predicted mRNA sequences; introns (pink lines) and exons (pink boxes) are shown; the length of the messenger RNA (mRNAs) (as kilobases or kb) are shown; a CpG island (CpG94) is shown for the CERS6 promoter; 15 miRNA binding sites were identified for the 3′UTR of the human CERS6 gene; the direction for transcription is shown; TFBS refers to transcription factor binding sites located within the CERS6 promoter; CERS6-AS1 refers to an antisense gene located proximal to CERS6.
Biomolecules 08 00111 g005
Figure 6. Phylogenetic tree of vertebrate CerS1-6 amino acid sequences and nematode LAGR1 and HYL1 sequences rooted with the yeast Lac1 sequence. The tree is labelled with the ceramide synthase names and the names of the animal or organism and is rooted with the yeast (Saccharomyces cerevisiae) LAC1 sequence. See Table 1 and Table 2 for details. Note the clusters corresponding to the CerS1–6 gene families. A genetic distance scale is shown. The number of times a clade (sequences common to a node or branch) occurred in the bootstrap replicates are shown. Replicate values of 0.9 or more, which are highly significant, are shown with 100 bootstrap replicates performed in each case. A proposed sequence of gene evolution events is shown arising from ancestral yeast LAC1 and invertebrate LAGR1 and HYL1 genes.
Biomolecules 08 00111 g006
Table 1. Vertebrate CerS6 genes and proteins.
GeneOrganismSpeciesChromosome ^
location
Coding Exons
(strand)
Gene Size
bps
GenBank
ID *
UNIPROT
ID
Amino
Acids
Subunit
MW (pI)
Similarity to
Human CerS6, %
CERS6HumanHomo Sapiens2:168,456,249–168,775,13410 (+strand)313,211NM_001256126Q6ZMG9-239245,794 (8.0)100
CerS6ChimpPan troglodytes2B:172,816,690–173,137,73210 (+strand)321,043* XP_001154789H2RCH739245,794 (8.0)100
CerS6GorillaGorilla gorilla2B:60,802,122–61,119,87210 (+strand)317,751* XP_004032792A0A2I2YTR239245,794 (8.0)100
CerS6GibbonNomascus leucogenys22A:58,027,154–58,354,05710 (+strand)321,406* XP_004092010G1QX9039245,767 (8.0)99.7
CerS6BaboonPapio anubis12:30,381,688–30,694,73610 (+strand)313,049* XP_017802114A0A2I3NGN039245,824 (7.1)99.9
CerS6Rhesus monkeyMacaca mulatta12:55,419,737–55,731,33310 (+strand)311,597* XP_014965738> H9Z7B439245,824 (8.0)99.5
CerS6Green monkeyChlorocebus sabaeus10:53,972,990–54,294,22110 (+strand)321,232* XP_007963450A0A0D9RS3739245,797 (8.0)99.2
CerS6MarmosetCallithrix jacchus6:49,862,083–50,206,29110 (−strand)344,209* XP_002749346F7I44239245,812 (8.0)99.0
CerS6Mouse lemurMicrocebus murinus^ KQ055119v1:198,292–459,44810 (+strand)261,157* XP_012637321na39245,736 (7.1)99.0
CerS6MouseMus musculus2:68,861,636–69,108,59110 (+strand)246,956NM_001347161H3BL0839245,717 (8.0)95.4
CerS6RatRattus norvegicus3:55,094,637–55,338,44510 (+strand)242,941* XP_006224534F1LTP839245,749 (8.0)95.2
CerS6HorseEquus caballus18:48,176,490–48,465,34610 (+strand)288,857NM_001301183> F7BVU239245,773 (8.0)97.4
CerS6DogCanis familiaris36:13,308,109–13,602,67710 (+strand)294,569> * XP_025315848F1P6P439145,585 (8.0)95.4
CerS6OpossumMonodelphis domestica4:177,901,296–178,232,21110 (+strand)330,304* XP_001375412K7E68239646,206 (8.5)90.0
CerS6ChickenGallus gallus7:18,442,947–18,552,42110 (−strand)109,475* XP_025008400E1C4X938745,079 (8.50)77.6
CerS6LizardAnolis carolinensis1:245,388,446–245,518,41510 (−strand)129,970* XP_008124100G1K9E638644,737 (8.8)75.5
CerS6FrogXenopus tropicalis9:63,975,031–64,070,81010 (+strand)93,133* XP_004917763>F6ZS8039346,096 (8.5)78.8
CerS6ZebrafishDanio rerio9:49,172,637–49,239,75510 (−strand)67,119* XP_693283F1QPF339145,860 (8.6)79.5
UNIPROT IDs (Swiss Institute of Bioinformatics, http://kr.expasy.org) and GenBank IDs (NIH, Bethesda, MD, USA, http://www.ncbi.nlm.nih.gov/genbank/) provide the sources for the gene and protein sequence data; gene sizes are given as base pairs of nucleotides; +strand and −strand refer to the transcribed strand; exons refer to coding exons; MW refers to predicted molecular weight; pI refers to theoretical isoelectric point; * predicted gene sequences; ^ chromosome location not available; > sequence is slightly different from another database sequence.
Table 2. Vertebrate, nematode and yeast CerS-like genes and proteins.
GeneOrganismSpeciesChromosome ^
Location
Coding Exons
(strand)
Gene Size
bps
GenBank
ID *
UNIPROT
KD
Amino
Acids
Subunit
MW (pI)
CERS1HumanH. sapiens19:18,868,552-18,896,0727 (−strand)27,593NP_067090P2754435039,536 (9.2)
CerS1MouseM. musculus8:70,315,775–70,331,5877 (+strand)15,812NP_619588P2754535040,100 (8.7)
CerS1ChickenGallus gallus28:3,502,179–3,512,6347 (+strand)10,456NP_001264694F1N9S035441,235 (9.2)
CerS1ZebrafishD. rerio22:4,791,880–4,847,7247 (+strand)55,845* XP_009294228F1Q5B135842,229 (5.5)
CERS2HumanH. sapiens1:150,965,173–150,975,00310 (−strand)9830NM_022075Q96G2338044,876 (9.0)
CerS2MouseM. musculus3:95,320,063–95,322,78910 (+strand)2727NM_001320492Q924Z438045,024 (8.9)
CerS2ChickenG. gallus25:2,627,873–2,630,26810 (−strand)2396* XP_003642714> A0A1D5PKE937744,621 (8.9)
CerS2ZebrafishD. rerio16:1,360,026–1,370,90710 (+strand)10,882* XP_693668Q90YY738345,191 (8.6)
CERS3HumanH. sapiens15:100,400,395–100,544,28610 (−strand)143,892NM_001290342Q8IU8938346,316 (7.6)
CerS3MouseM. musculus7:66,733,234–66,823,69210 (+strand)90,459* XP_011249179Q1A3B038346,081 (8.3)
CerS3ChickenG. gallus10:17,297,468–17,326,58710 (−strand)29,120* XP_424275F1N8P238045,302 (8.9)
CerS3ZebrafishD. rerio7:9,904,627–9,961,72710 (+strand)35,391* XP_002662790A0A140LFW438045,066 (7.2)
CERS4HumanH. sapiens19:8,209,353–8,262,42110 (+strand)50,069NM_024552Q9HA8239446,399 (9.2)
CerS4MouseM. musculus8:4,493,405–4,526,07910 (+strand)32,675NM_026058Q9D6J139346,017 (8.7)
CerS4ChickenG. gallus28:100,066–130,61010 (−strand)30,545* XP_015155290A0A1D5P15939847,408 (8.5)
CerS4ZebrafishD. rerio22:4,707,655–4,733,10610 (+strand)25,452NM_153670Q90YY640647,636 (8.4)
CERS5HumanH. sapiens12:50,129,798–50,167,42210 (−strand)37,625NM_147190Q8N5B739245,752 (8.2)
CerS5MouseM. musculus15:99,735,592–99,772,51510 (−strand)36,924NM_028015Q9D6K941448,167 (8.4)
CerS5ChickenG. gallus^268,433–285,58610 (+strand)17,154* XP_424486A0A1D5NZ4339145,516 (8.9)
CerS5ZebrafishD. rerio22:5,758,094–5,821,73310 (−strand)63,640NM_199628A8E7D438745,541 (9.2)
LAGR1NematodeCaenorhabditis elegansI:13,724,671–13,731,9907 (−strand)7317NM_061002Q9XWE936042,743 (8.5)
HYL1NematodeC. elegansIV:8,540,663–8,544,0558 (+strand)2958NM_069058G5ED4536843,851 (8.9)
LAC1YeastSaccharomyces cerevisiaeXI:427,295–428,55111256NM_001179574P2849641848,992 (9.5)
UNIPROT IDs (Swiss Institute of Bioinformatics, http://kr.expasy.org) and GenBank IDs (NIH, Bethesda, MD, USA, http://www.ncbi.nlm.nih.gov/genbank/) provide the sources for the gene and protein sequence data; gene sizes are given as base pairs of nucleotides; +strand and −strand refer to the transcribed strand; exons refer to coding exons; pI refers to theoretical isoelectric points; * predicted gene sequences; ^ chromosome location not available; > sequence slightly different from another database.
Table 3. Sequence identities (%) for human CERS1–6 enzymes. Three distinct human CERS sub-families were identified based on amino acid sequence comparison: CERS1, (22–27%); CERS2–4, (37–51%); and CERS5–6, (62%).
Human
CerSes
CerS1, Identity (%)CerS2, Identity (%)CerS3, Identity (%)CerS4, Identity (%)CerS5, Identity (%)CerS6, Identity (%)
CerS11002725312729
CerS22710053494141
CerS32553100454039
CerS43149451004342
CerS52741404310063
CerS61941394263100

