
The Effect of Alcohol and Hydrogen Peroxide on Liver Hepcidin Gene Expression in Mice Lacking Antioxidant Enzymes, Glutathione Peroxidase-1 or Catalase

Abstract
:1. Introduction
2. Results and Discussion
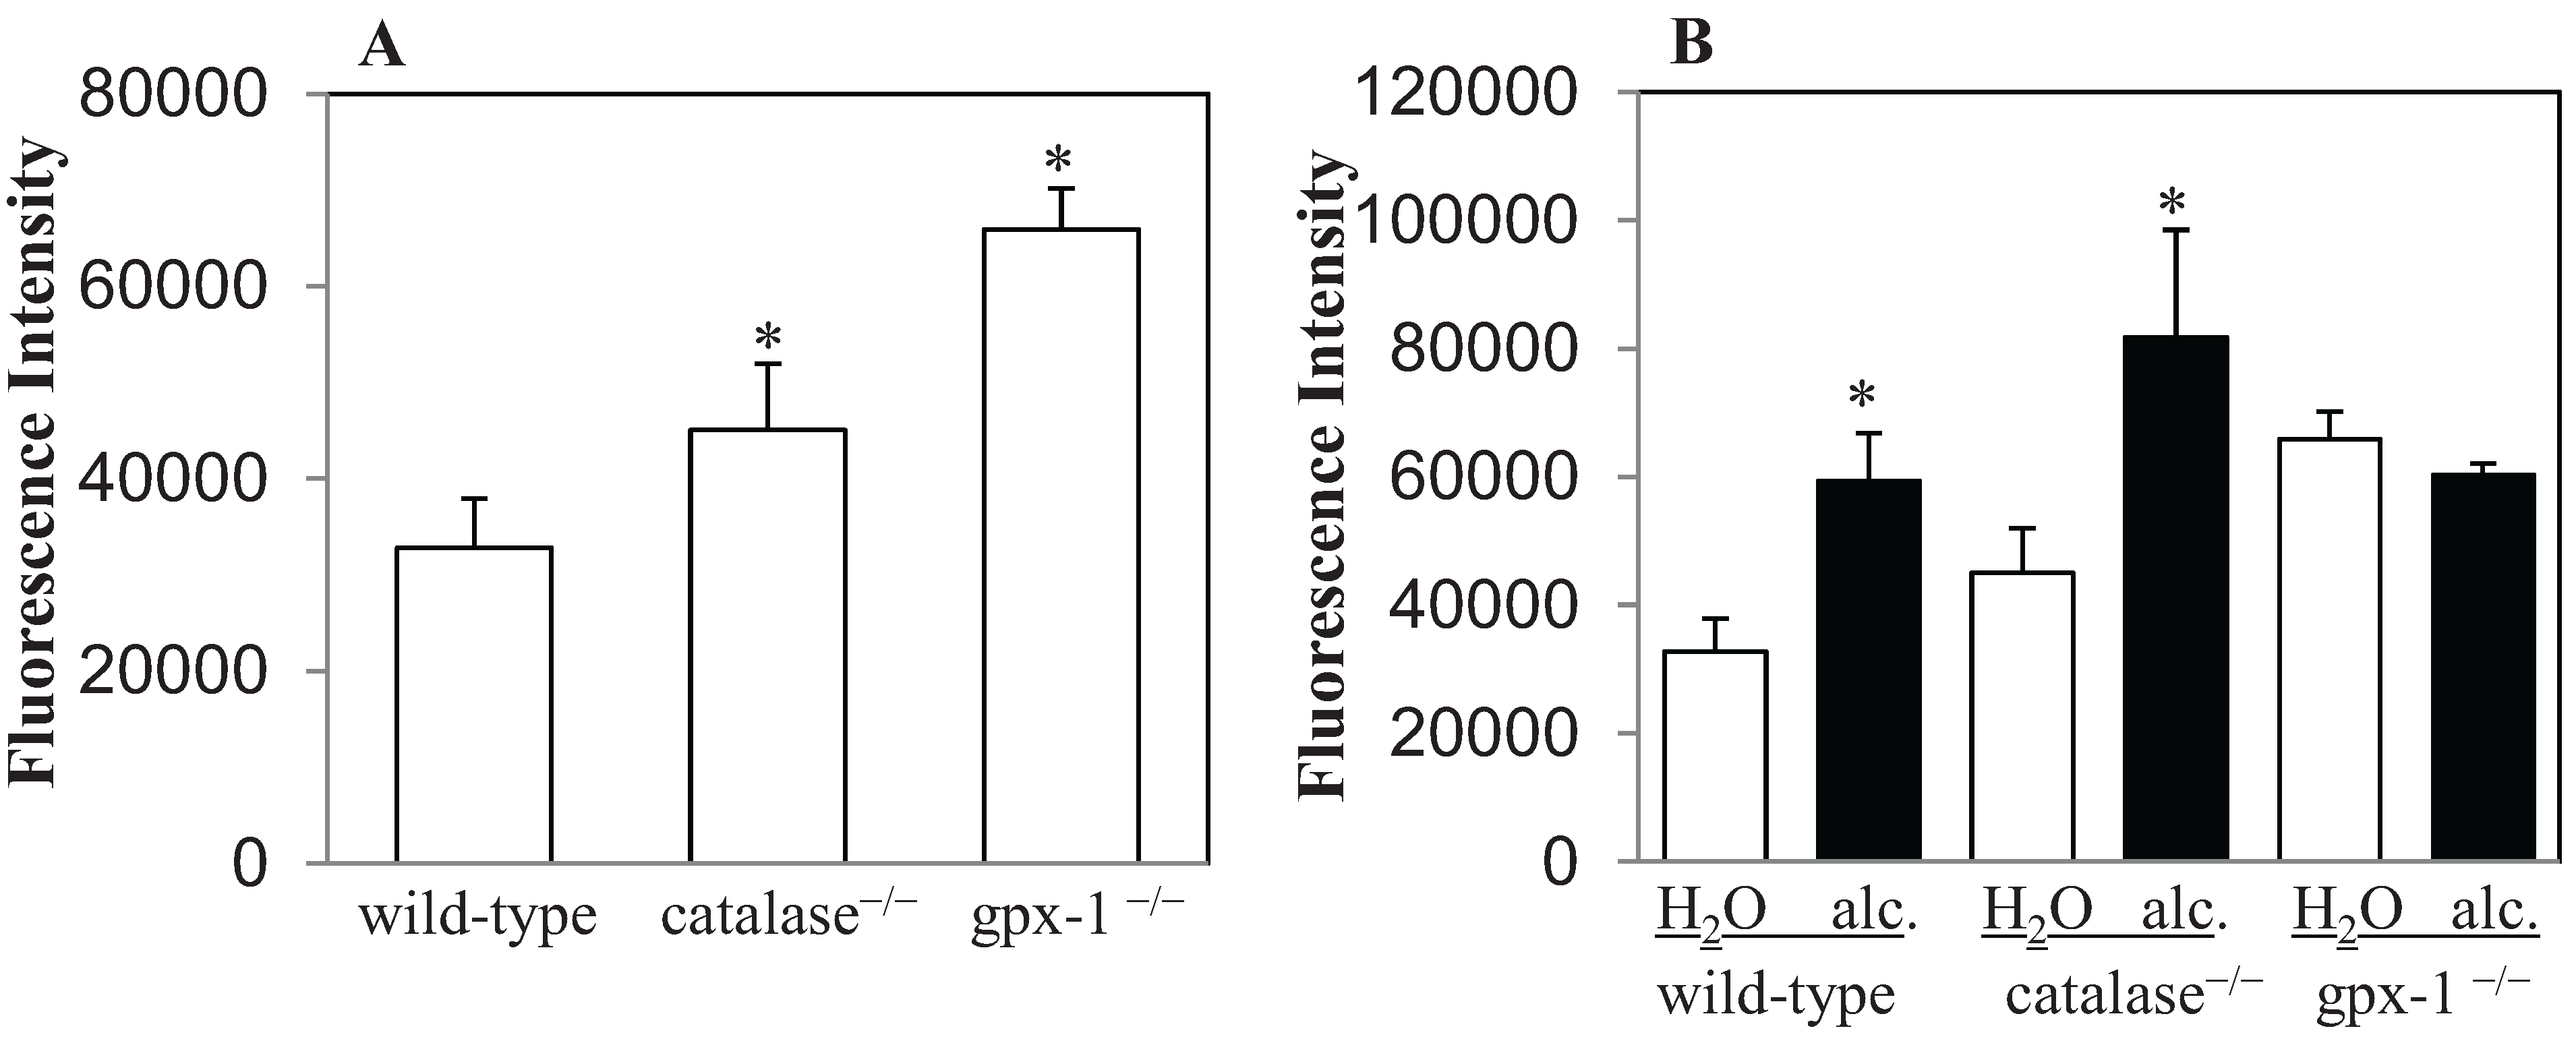
2.1. The Effect of Alcohol on H2O2 Production and Hepcidin Expression in Catalase−/− and Gpx-1−/− Mice

| Mouse identity | Blood alcohol (mg/dL) | CYP2E1 activity (nmole 4-nc/h/mg protein) |
|---|---|---|
| Wild-type water-fed | N.D. | 57 ± 3 |
| Wild-type alcohol-fed | 123 ± 16 | 92 ± 3.9 |
| Catalase−/− water-fed | N.D. | 61 ± 6 |
| Catalase−/− alcohol-fed | 125 ± 13 | 100 ± 2 |
| Gpx-1−/− water-fed | N.D. | 62 ± 4 |
| Gpx-1−/− alcohol-fed | 127 ± 14 | 100 ± 3 |

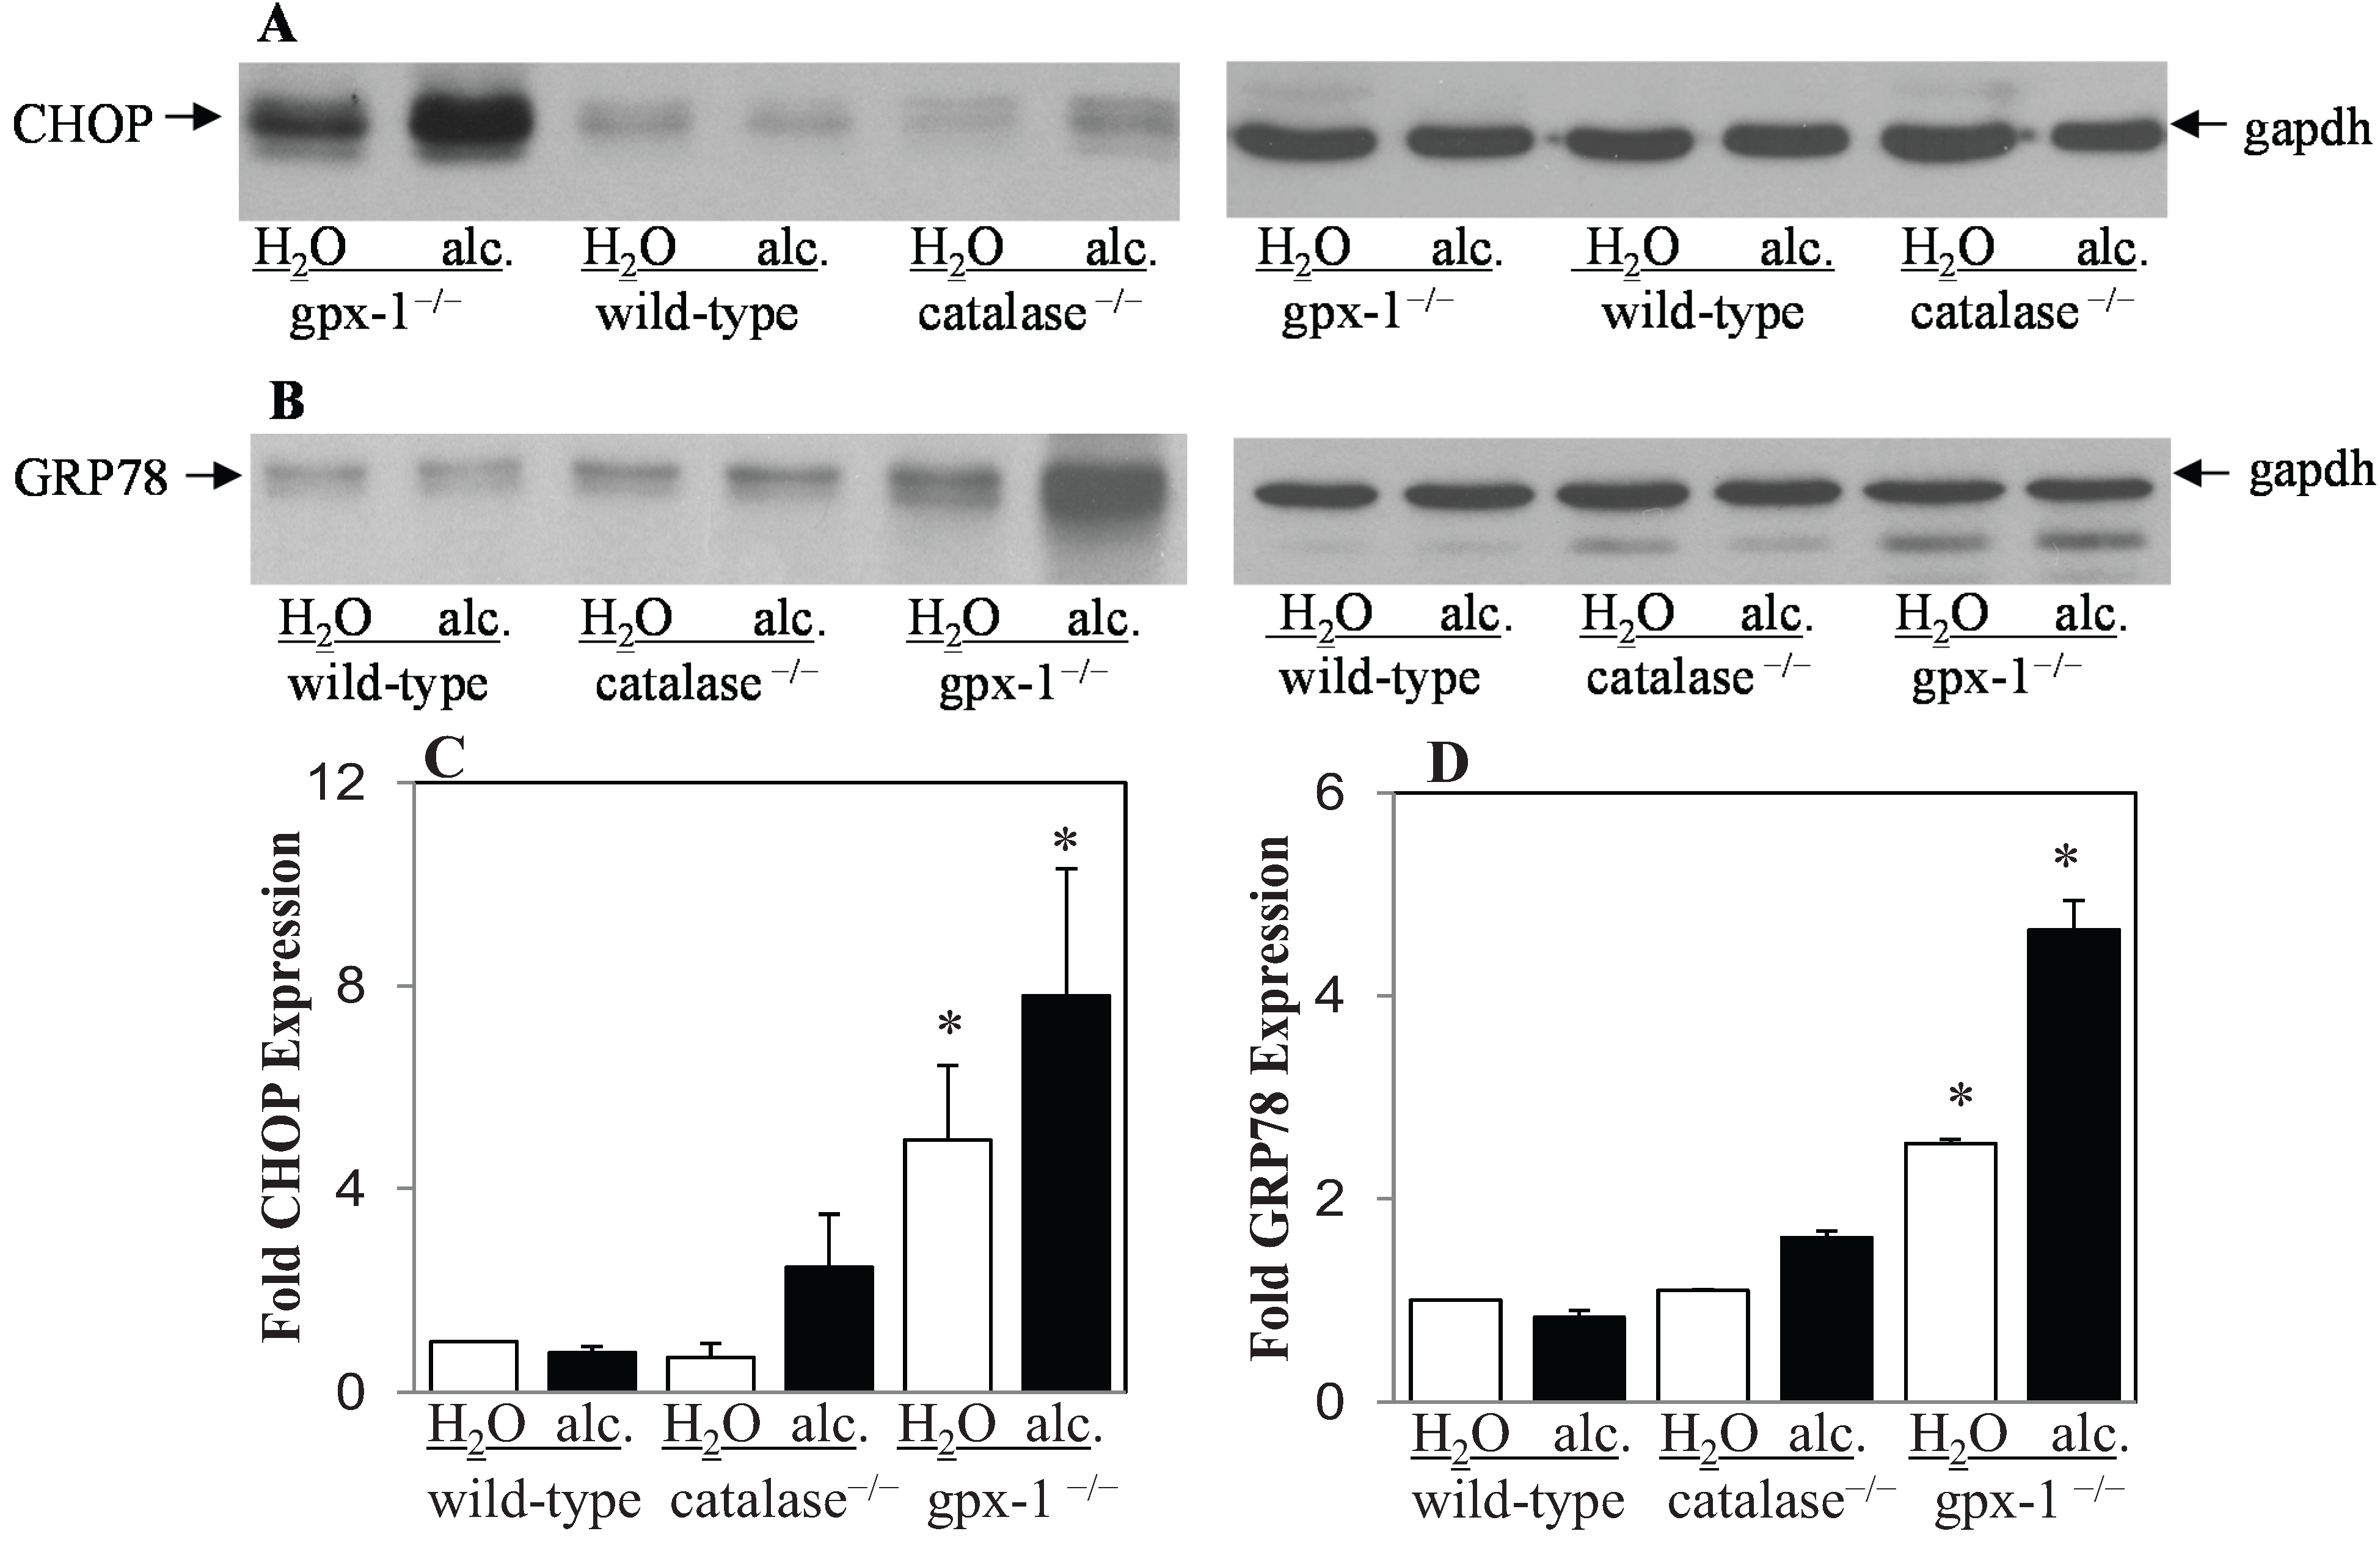
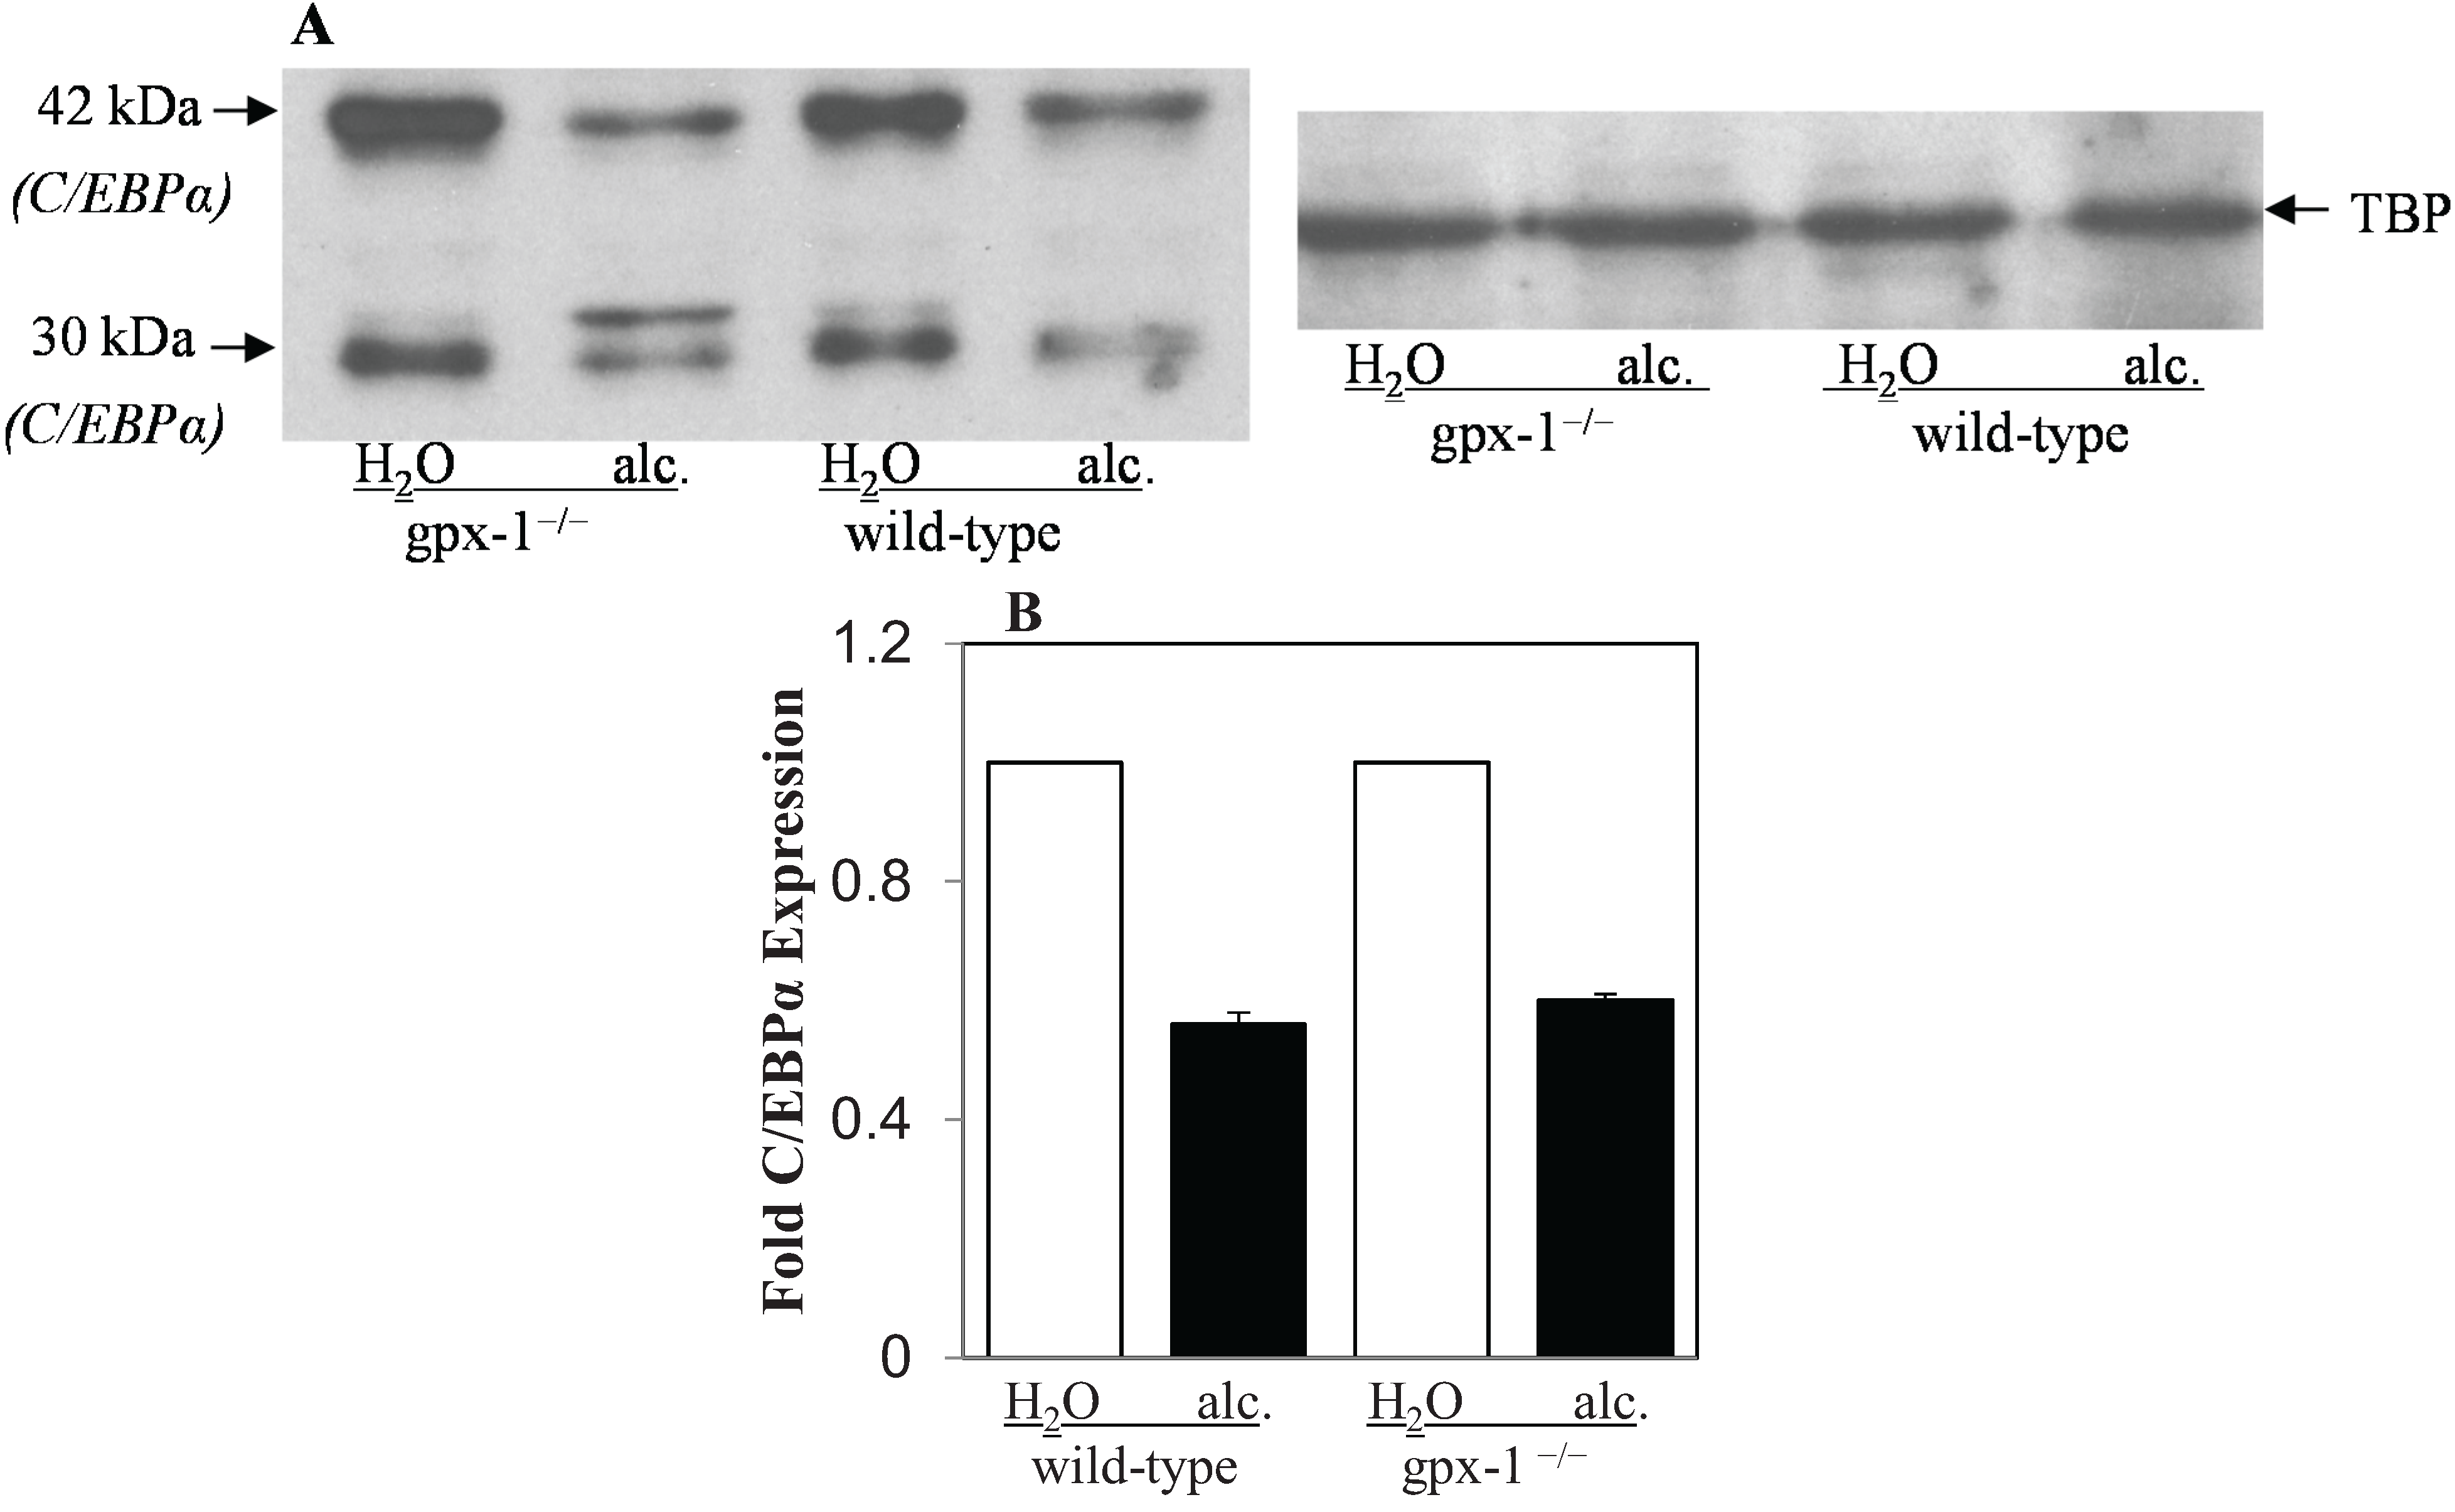
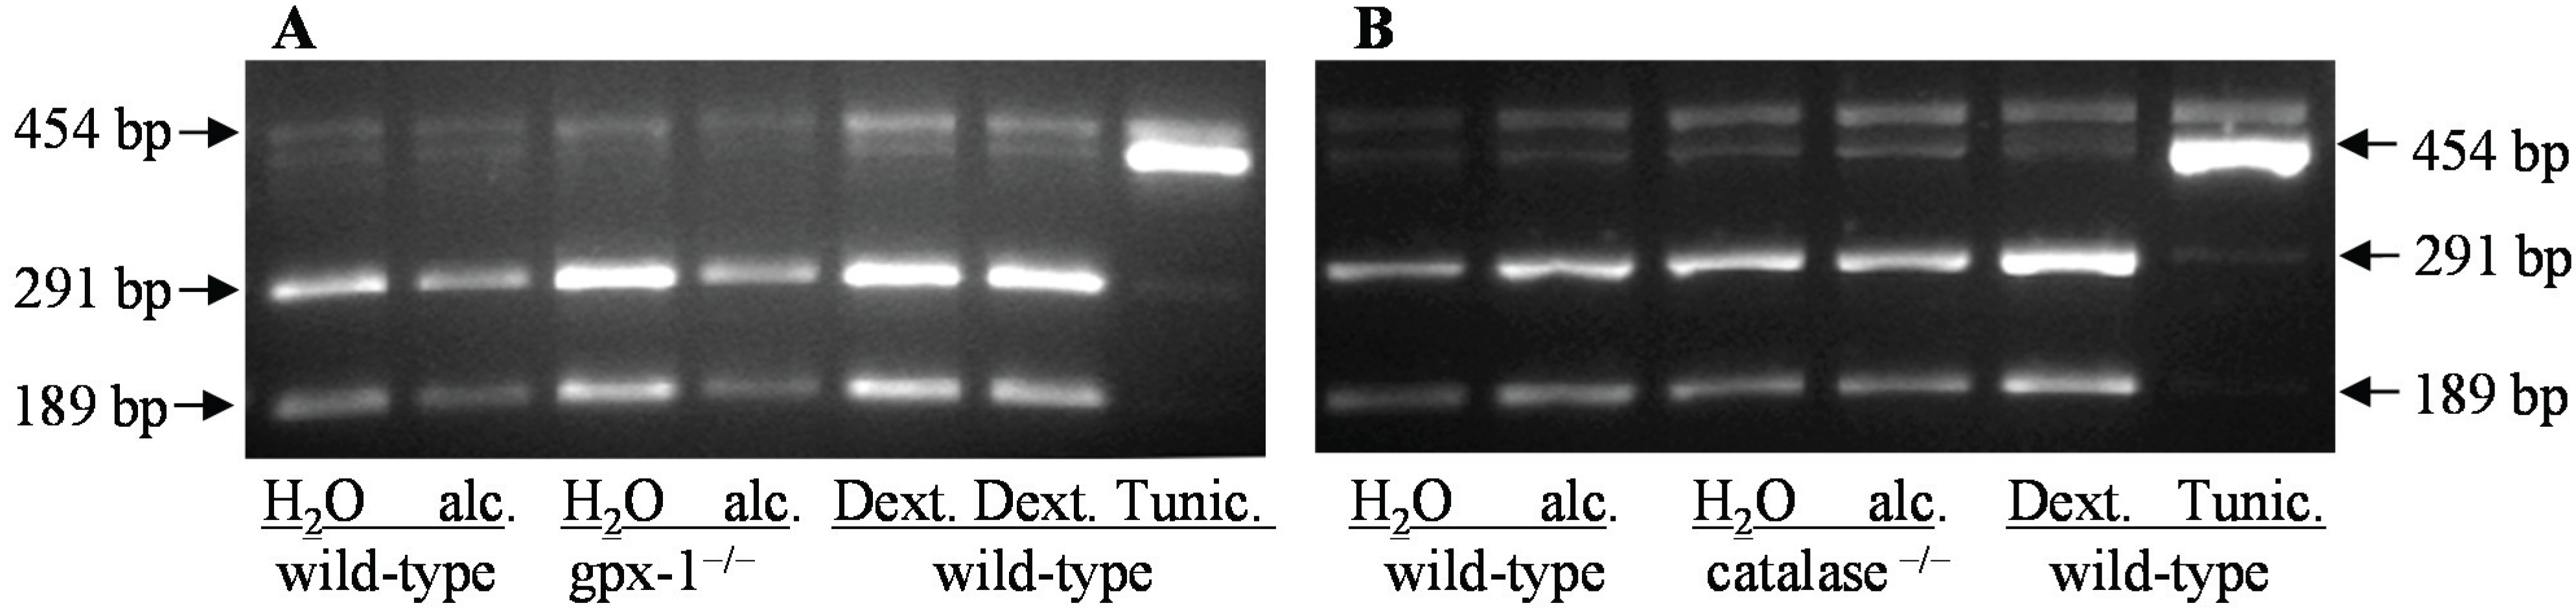
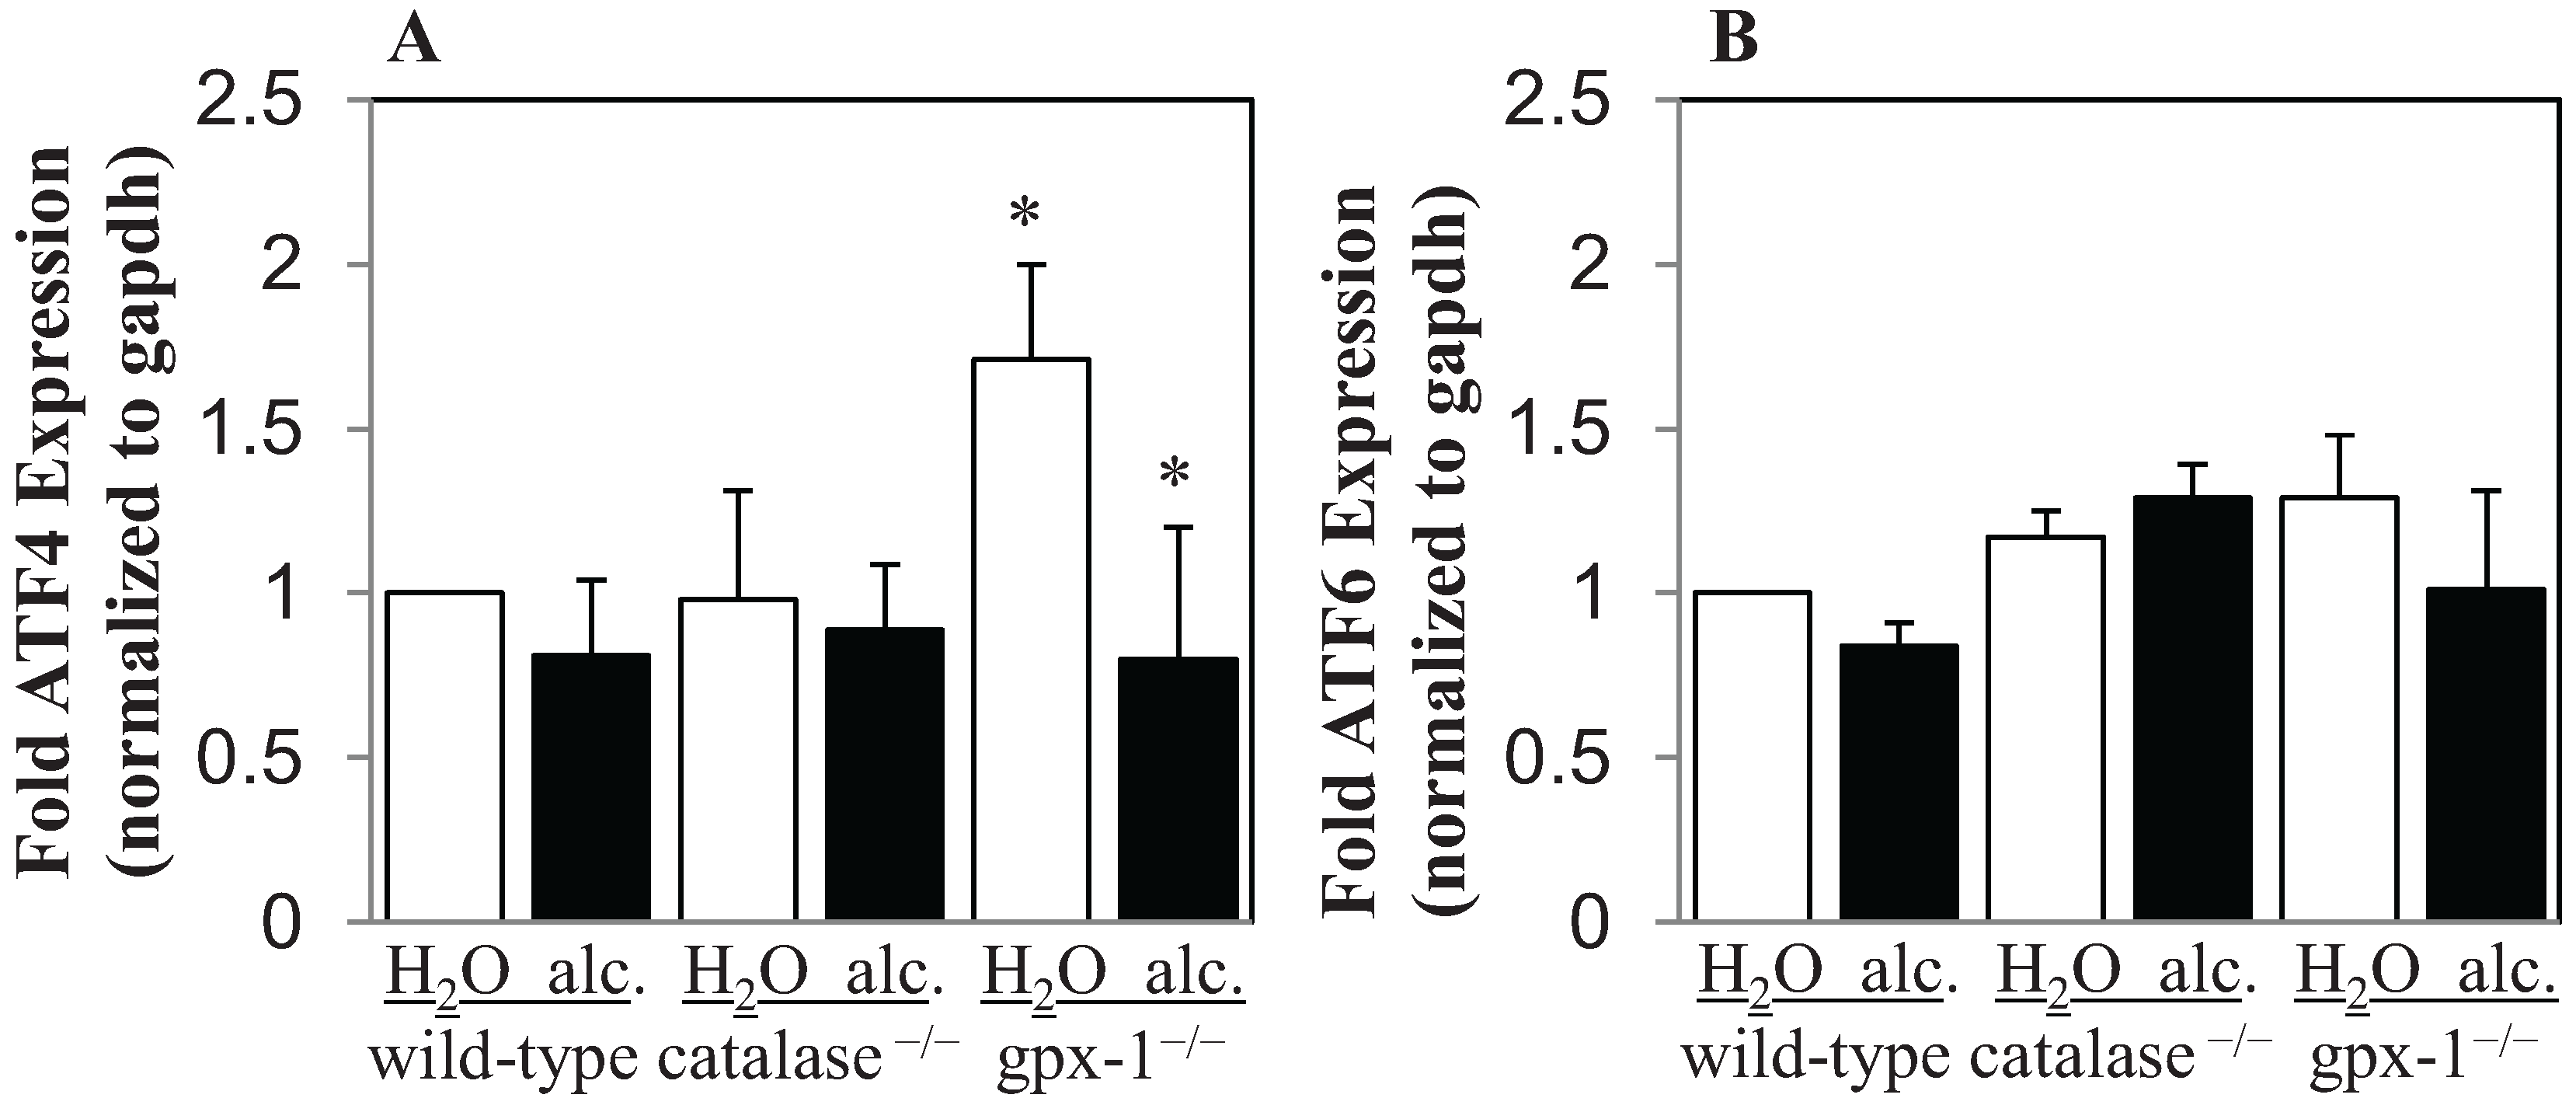
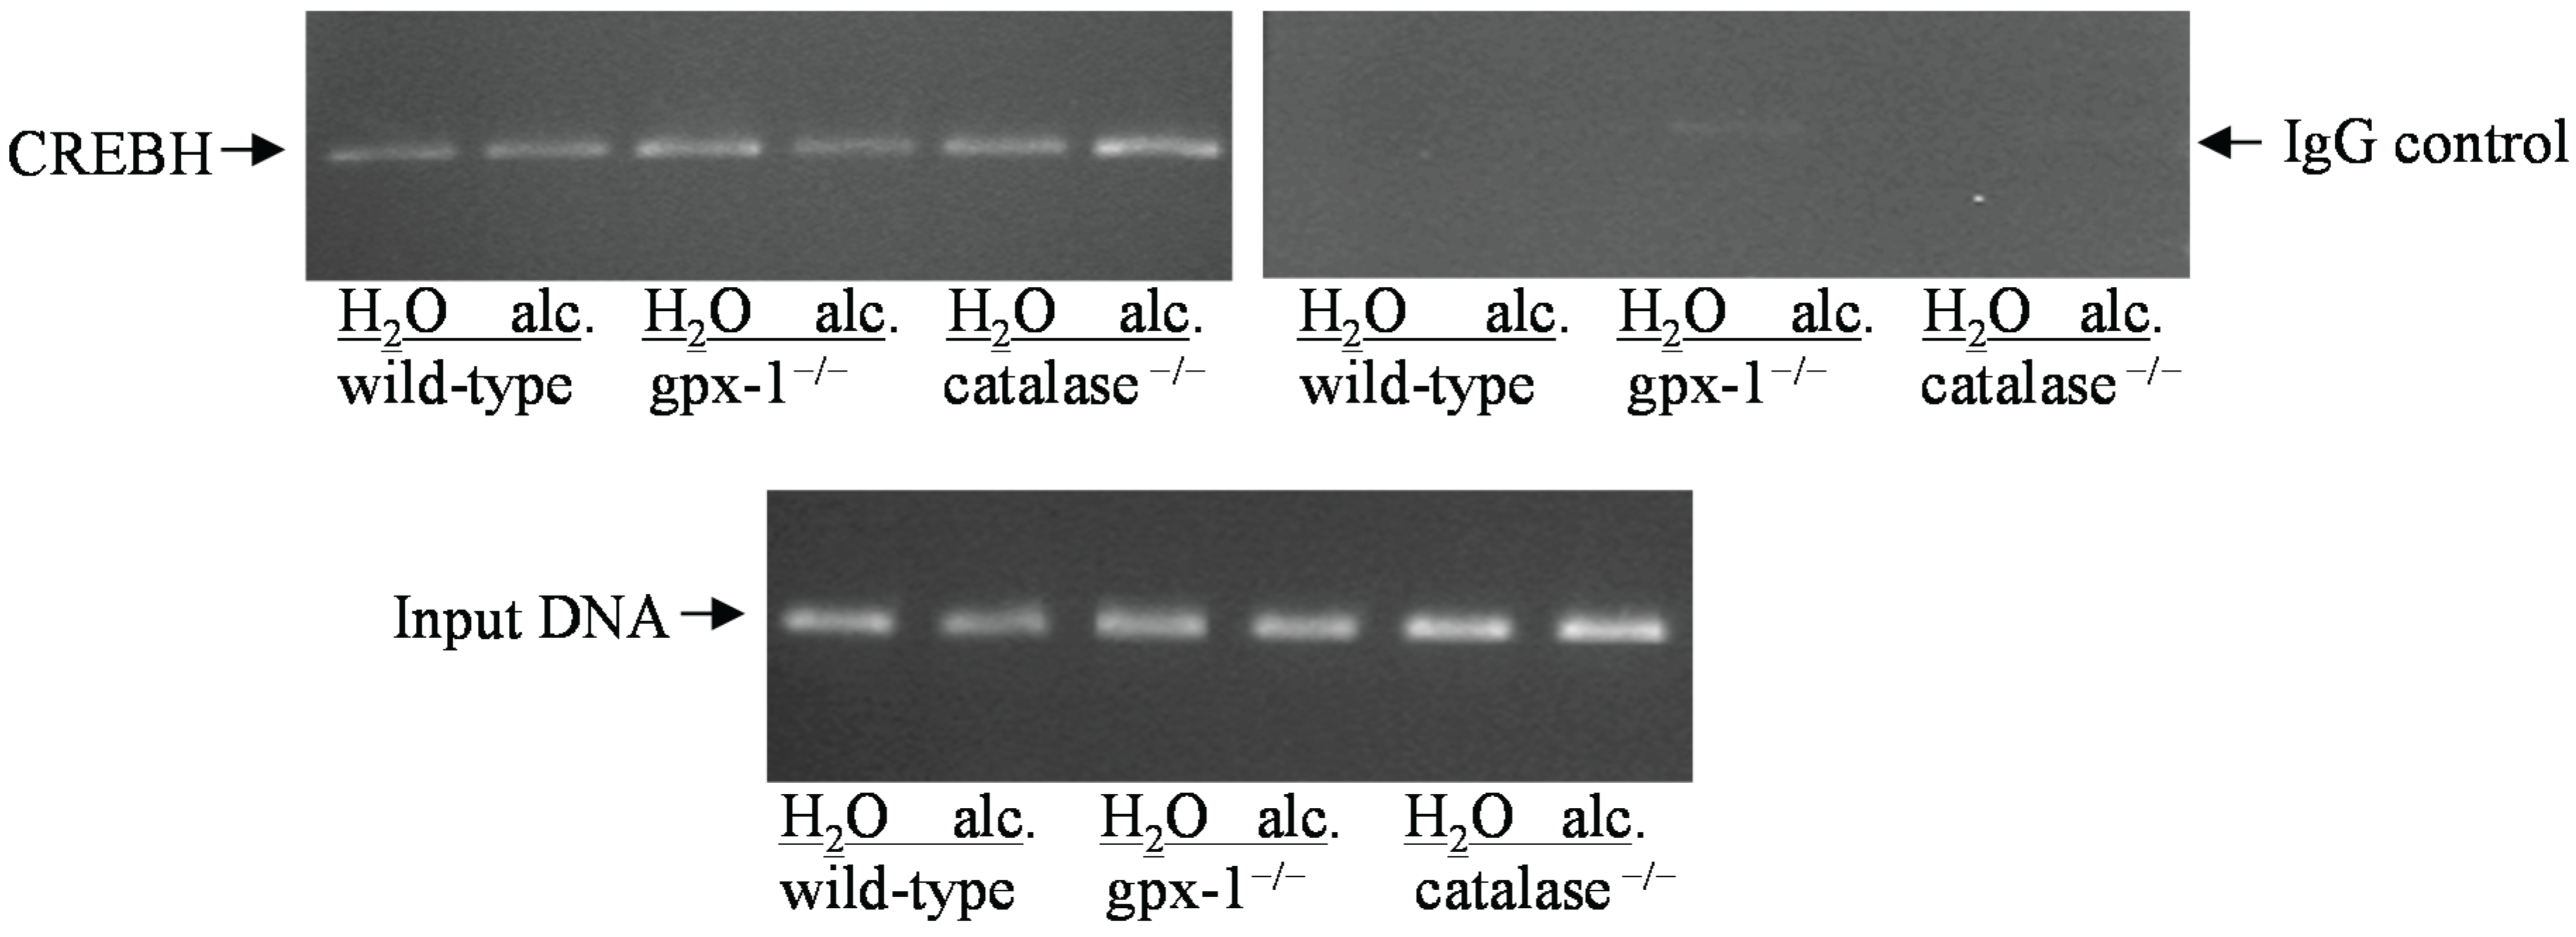
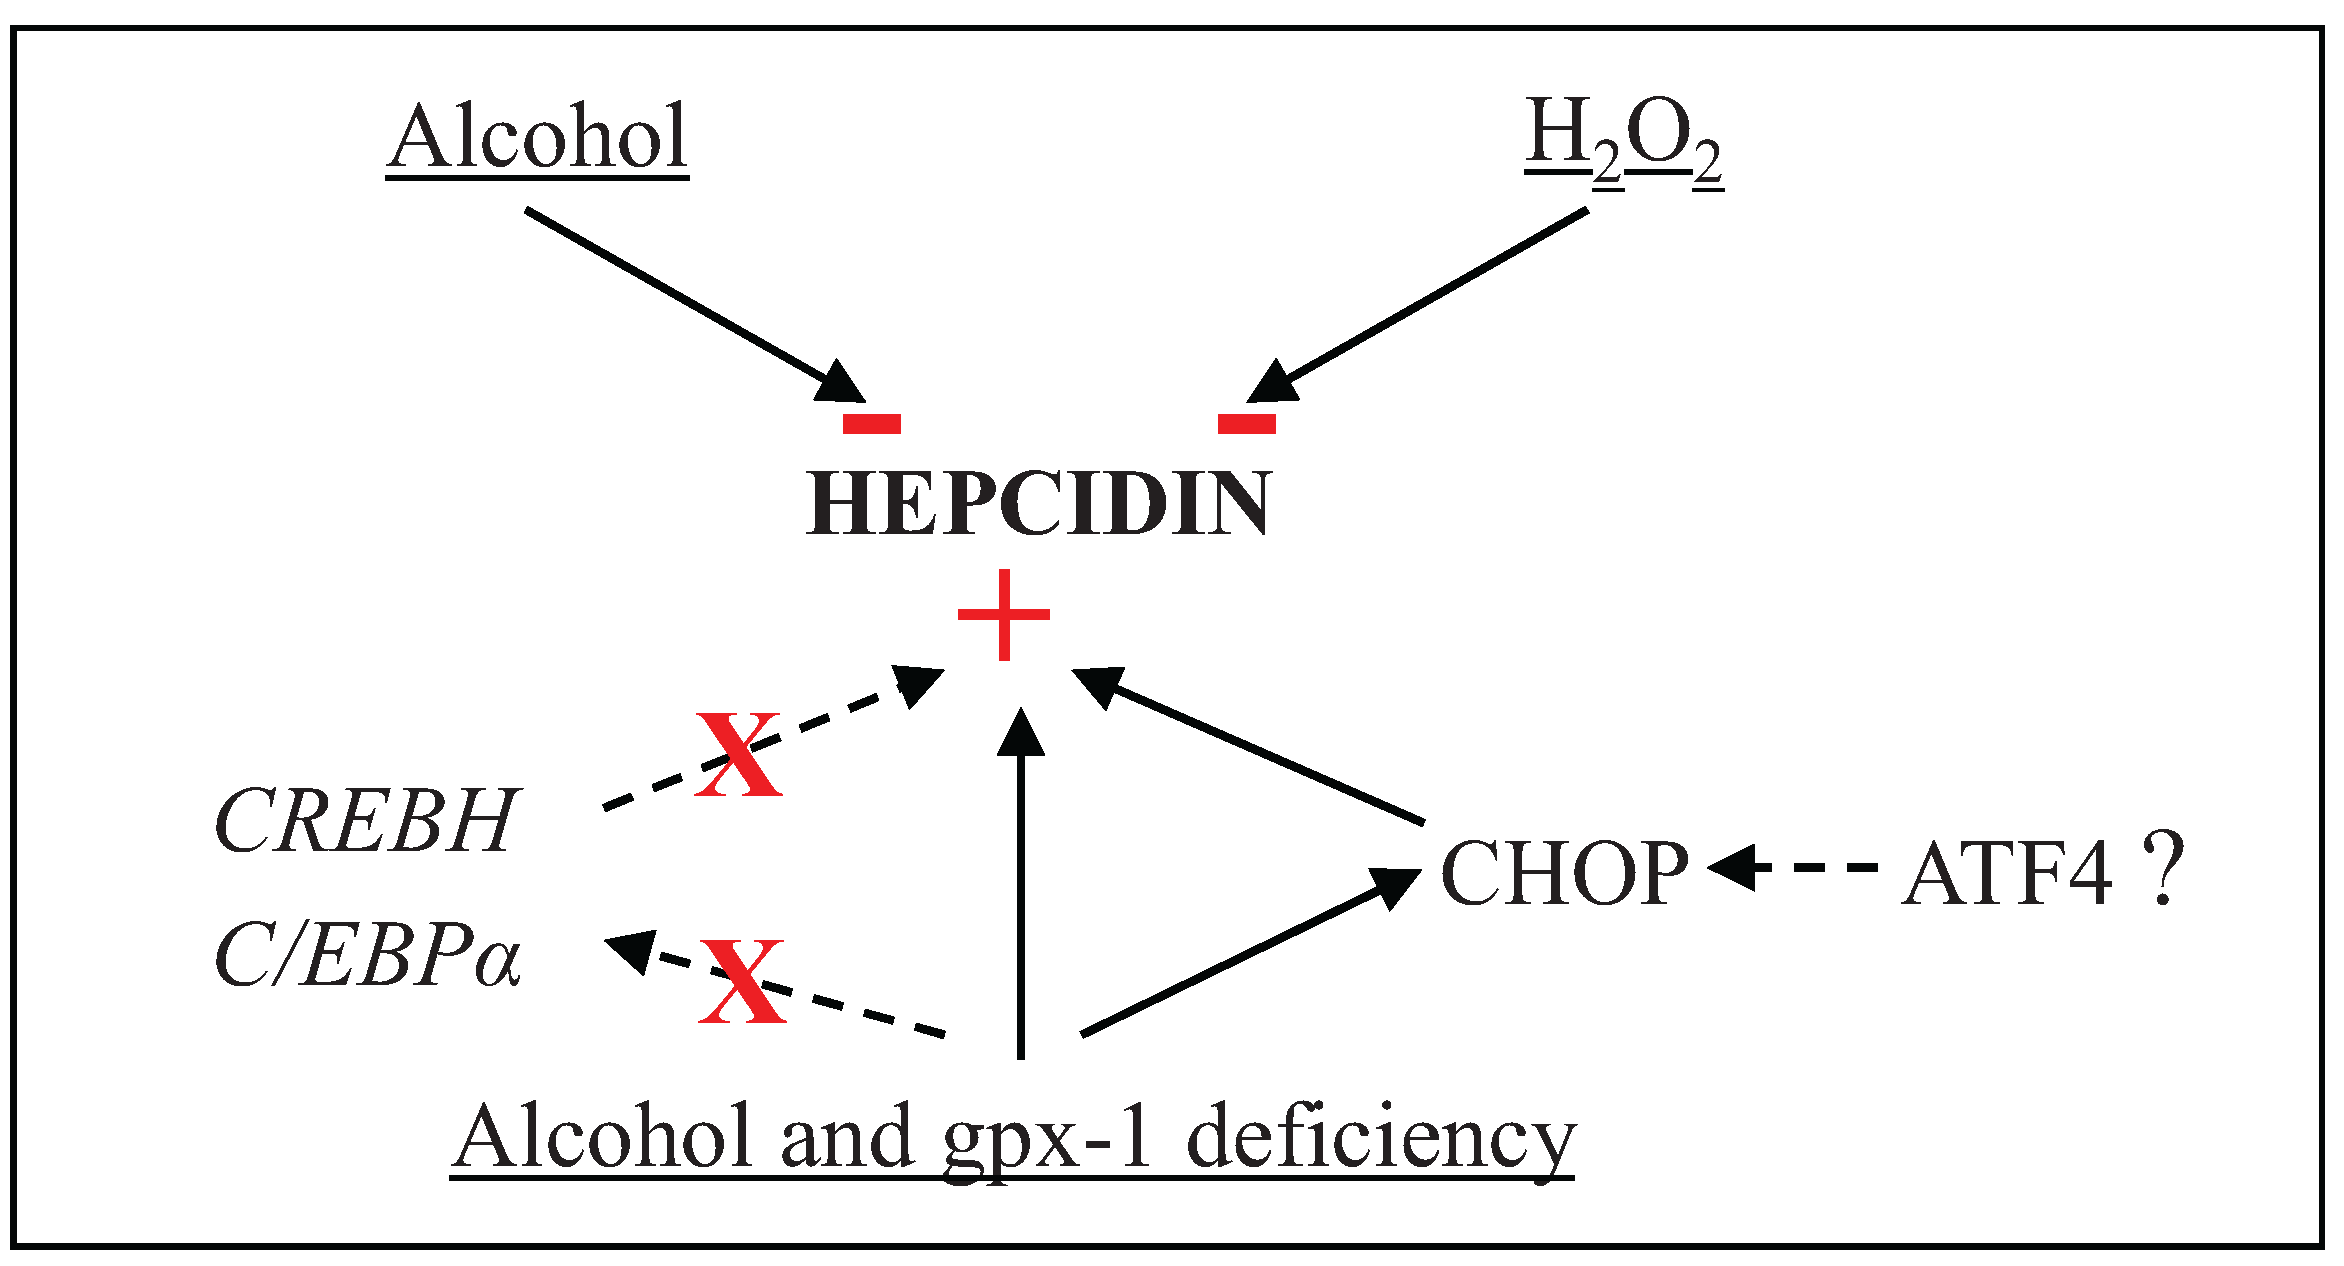
2.2. The Effect of Alcohol and H2O2 on ER Stress in the Liver


3. Experimental Section
3.1. Animal Experiments
3.2. Cytochrome P4502E1 (CYP2E1) Activity
3.3. Liver Perfusion
3.4. Measurement of Intracellular H2O2 Levels
3.5. RNA Isolation, cDNA Synthesis and Real-time Quantitative PCR Analysis
3.6. Analysis of X-Box Binding Protein 1 Splicing
3.7. Chromatin Immunoprecipitation (CHIP)
3.8. Western Blotting
3.9. Statistical Analysis
4. Conclusions
Acknowledgments
Author Contributions
Conflicts of Interest
References
- Ioannou, G.N.; Dominitz, J.A.; Weiss, N.S.; Heagerty, P.J.; Kowdley, K.V. The effect of alcohol consumption on the prevalence of iron overload, iron deficiency, and iron deficiency anemia. Gastroenterology 2004, 126, 1293–1301. [Google Scholar] [CrossRef] [PubMed]
- Tavill, A.S.; Qadri, A.M. Alcohol and iron. Semin. Liver Dis. 2004, 24, 317–325. [Google Scholar] [CrossRef] [PubMed]
- Nemeth, E.; Ganz, T. Regulation of iron metabolism by hepcidin. Annu. Rev. Nutr. 2006, 26, 323–342. [Google Scholar] [CrossRef] [PubMed]
- Harrison-Findik, D.D. Is the iron regulatory hormone hepcidin a risk factor for alcoholic liver disease? World J. Gastroenterol. 2009, 15, 1186–1193. [Google Scholar] [CrossRef] [PubMed]
- Bridle, K.; Cheung, T.K.; Murphy, T.; Walters, M.; Anderson, G.; Crawford, D.G.; Fletcher, L.M. Hepcidin is down-regulated in alcoholic liver injury: Implications for the pathogenesis of alcoholic liver disease. Alcohol Clin. Exp. Res. 2006, 30, 106–112. [Google Scholar] [CrossRef] [PubMed]
- Ohtake, T.; Saito, H.; Hosoki, Y.; Inoue, M.; Miyoshi, S.; Suzuki, Y.; Fujimoto, Y.; Kohgo, Y. Hepcidin is down-regulated in alcohol loading. Alcohol Clin. Exp. Res. 2007, 31, S2–S8. [Google Scholar] [CrossRef] [PubMed]
- Harrison-Findik, D.D.; Klein, E.; Crist, C.; Evans, J.; Timchenko, N.; Gollan, J. Iron-mediated regulation of liver hepcidin expression in rats and mice is abolished by alcohol. Hepatology 2007, 46, 1979–1985. [Google Scholar] [CrossRef] [PubMed]
- Harrison-Findik, D.D.; Schafer, D.; Klein, E.; Timchenko, N.A.; Kulaksiz, H.; Clemens, D.; Fein, E.; Andriopoulos, B.; Pantopoulos, K.; Gollan, J. Alcohol metabolism-mediated oxidative stress down-regulates hepcidin transcription and leads to increased duodenal iron transporter expression. J. Biol. Chem. 2006, 281, 22974–22982. [Google Scholar] [CrossRef] [PubMed]
- Wu, D.; Cederbaum, A.I. Oxidative stress and alcoholic liver disease. Semin. Liver Dis. 2009, 29, 141–154. [Google Scholar] [CrossRef] [PubMed]
- Graf, E.; Mahoney, J.R.; Bryant, R.G.; Eaton, J.W. Iron-catalyzed hydroxyl radical formation. Stringent requirement for free iron coordination site. J. Biol. Chem. 1984, 259, 3620–3624. [Google Scholar] [PubMed]
- Sies, H. Strategies of antioxidant defense. Eur. J. Biochem. 1993, 215, 213–219. [Google Scholar] [CrossRef] [PubMed]
- Rhee, S.G.; Chang, T.S.; Bae, Y.S.; Lee, S.R.; Kang, S.W. Cellular regulation by hydrogen peroxide. J. Am. Soc. Nephrol. 2003, 14, S211–S215. [Google Scholar] [CrossRef] [PubMed]
- Lubos, E.; Loscalzo, J.; Handy, D.E. Glutathione peroxidase-1 in health and disease: From molecular mechanisms to therapeutic opportunities. Antioxid. Redox Signal. 2011, 15, 1957–1997. [Google Scholar] [CrossRef] [PubMed]
- Polavarapu, R.; Spitz, D.R.; Sim, J.E.; Follansbee, M.H.; Oberley, L.W.; Rahemtulla, A.; Nanji, A.A. Increased lipid peroxidation and impaired antioxidant enzyme function is associated with pathological liver injury in experimental alcoholic liver disease in rats fed diets high in corn oil and fish oil. Hepatology 1998, 27, 1317–1323. [Google Scholar] [CrossRef] [PubMed]
- Bailey, S.M.; Patel, V.B.; Young, T.A.; Asayama, K.; Cunningham, C.C. Chronic ethanol consumption alters the glutathione/glutathione peroxidase-1 system and protein oxidation status in rat liver. Alcohol Clin. Exp. Res. 2001, 25, 726–733. [Google Scholar] [CrossRef] [PubMed]
- Malhotra, J.D.; Kaufman, R.J. Endoplasmic reticulum stress and oxidative stress: a vicious cycle or a double-edged sword? Antioxid. Redox Signal. 2007, 9, 2277–2293. [Google Scholar] [CrossRef] [PubMed]
- Ji, C.; Kaplowitz, N. Betaine decreases hyperhomocysteinemia, endoplasmic reticulum stress, and liver injury in alcohol-fed mice. Gastroenterology 2003, 124, 1488–1499. [Google Scholar] [CrossRef] [PubMed]
- Ji, C. Mechanisms of alcohol-induced endoplasmic reticulum stress and organ injuries. Biochem. Res. Int. 2012. [Google Scholar] [CrossRef]
- Tsedensodnom, O.; Vacaru, A.M.; Howhart, L.D.; Yin, C.; Sadler, K.C. Ethanol metabolism and oxidative stress are required for unfolded protein response activation and steatosis in zebrafish with alcoholic liver disease. Dis. Models Mech. 2013, 6, 1213–1226. [Google Scholar] [CrossRef]
- Wang, C.; Li, H.; Meng, Q.; Du, Y.; Xiao, F.; Zhang, Q.; Yu, J.; Li, K.; Chen, S.; Huang, Z.; et al. ATF4 deficiency protects hepatocytes from oxidative stress via inhibiting CYP2E1 expression. J. Cell Mol. Med. 2014, 18, 80–90. [Google Scholar] [CrossRef] [PubMed]
- Oyadomari, S.; Mori, M. Roles of CHOP/GADD153 in endoplasmic reticulum stress. Cell Death Differ. 2004, 11, 381–389. [Google Scholar] [CrossRef] [PubMed]
- Ron, D.; Habener, J.F. CHOP, a novel developmentally regulated nuclear protein that dimerizes with transcription factors C/EBP and LAP and functions as a dominant-negative inhibitor of gene transcription. Genes Dev. 1992, 6, 439–453. [Google Scholar] [CrossRef] [PubMed]
- McCullough, K.D.; Martindale, J.L.; Klotz, L.O.; Aw, T.Y.; Holbrook, N.J. Gadd153 sensitizes cells to endoplasmic reticulum stress by down-regulating Bcl2 and perturbing the cellular redox state. Mol. Cell Biol. 2001, 21, 1249–1259. [Google Scholar] [CrossRef] [PubMed]
- Oliveira, S.J.; Pinto, J.P.; Picarote, G.; Costa, V.M.; Carvalho, F.; Rangel, M.; de Sousa, M.; de Almeida, S.F. ER stress-inducible factor CHOP affects the expression of hepcidin by modulating C/EBPalpha activity. PLOS ONE 2009, 4, e6618. [Google Scholar] [CrossRef] [PubMed]
- Vecchi, C.; Montosi, G.; Zhang, K.; Lamberti, I.; Duncan, S.A.; Kaufman, R.J.; Pietrangelo, A. ER stress controls iron metabolism through induction of hepcidin. Science 2009, 325, 877–880. [Google Scholar] [CrossRef] [PubMed]
- Miura, K.; Taura, K.; Kodama, Y.; Schnabl, B.; Brenner, D.A. Hepatitis C virus-induced oxidative stress suppresses hepcidin expression through increased histone deacetylase activity. Hepatology 2008, 48, 1420–1429. [Google Scholar] [CrossRef] [PubMed]
- Millonig, G.; Ganzleben, I.; Peccerella, T.; Casanovas, G.; Brodziak-Jarosz, L.; Breitkopf-Heinlein, K.; Dick, T.P.; Seitz, H.K.; Muckenthaler, M.U.; Mueller, S. Sustained submicromolar H2O2 levels induce hepcidin via signal transducer and activator of transcription 3 (STAT3). J. Biol. Chem. 2012, 287, 37472–37482. [Google Scholar] [CrossRef] [PubMed]
- LeBel, C.P.; Ischiropoulos, H.; Bondy, S.C. Evaluation of the probe 2',7'-dichlorofluorescin as an indicator of reactive oxygen species formation and oxidative stress. Chem. Res. Toxicol. 1992, 5, 227–231. [Google Scholar] [CrossRef] [PubMed]
- Harrison-Findik, D.D.; Lu, S.; Zmijewski, E.M.; Jones, J.; Zimmerman, M.C. Effect of alcohol exposure on hepatic superoxide generation and hepcidin expression. World J. Biol. Chem. 2013, 4, 119–130. [Google Scholar] [PubMed]
- Harrison-Findik, D.D.; Klein, E.; Evans, J.; Gollan, J. Regulation of liver hepcidin expression by alcohol in vivo does not involve Kupffer cell activation or TNF-α signaling. Am. J. Physiol. Gastrointest. Liver Physiol. 2009, 296, G112–G118. [Google Scholar] [CrossRef] [PubMed]
- Zmijewski, E.; Lu, S.; Harrison-Findik, D.D. TLR4 signaling and the inhibition of liver hepcidin expression by alcohol. World J. Gastroenterol. 2014, 20, 12161–12170. [Google Scholar] [CrossRef] [PubMed]
- You, K.R.; Liu, M.J.; Han, X.J.; Lee, Z.W.; Kim, D.G. Transcriptional regulation of the human transferrin gene by GADD153 in hepatoma cells. Hepatology 2003, 38, 745–755. [Google Scholar] [CrossRef] [PubMed]
- Courselaud, B.; Pigeon, C.; Inoue, Y.; Inoue, J.; Gonzalez, F.J.; Leroyer, P.; Gilot, D.; Boudjema, K.; Guguen-Guillouzo, C.; Brissot, P.; et al. C/EBPα regulates hepatic transcription of hepcidin, an antimicrobial peptide and regulator of iron metabolism. Cross-talk between C/EBP pathway and iron metabolism. J. Biol. Chem. 2002, 277, 41163–41170. [Google Scholar] [CrossRef] [PubMed]
- Malhi, H.; Kaufman, R.J. Endoplasmic reticulum stress in liver disease. J. Hepatol. 2011, 54, 795–809. [Google Scholar] [CrossRef] [PubMed]
- Dey, S.; Baird, T.D.; Zhou, D.; Palam, L.R.; Spandau, D.F.; Wek, R.C. Both transcriptional regulation and translational control of ATF4 are central to the integrated stress response. J. Biol. Chem. 2010, 285, 33165–33174. [Google Scholar] [CrossRef] [PubMed]
- Bruhat, A.; Jousse, C.; Wang, X.Z.; Ron, D.; Ferrara, M.; Fafournoux, P. Amino acid limitation induces expression of CHOP, a CCAAT/enhancer binding protein-related gene, at both transcriptional and post-transcriptional levels. J. Biol. Chem. 1997, 272, 17588–17593. [Google Scholar] [CrossRef] [PubMed]
- Ho, Y.S.; Magnenat, J.L.; Bronson, R.T.; Cao, J.; Gargano, M.; Sugawara, M.; Funk, C.D. Mice deficient in cellular glutathione peroxidase develop normally and show no increased sensitivity to hyperoxia. J. Biol. Chem. 1997, 272, 16644–16651. [Google Scholar] [CrossRef] [PubMed]
- Ho, Y.S.; Xiong, Y.; Ma, W.; Spector, A.; Ho, D.S. Mice lacking catalase develop normally but show differential sensitivity to oxidant tissue injury. J. Biol. Chem. 2004, 279, 32804–32812. [Google Scholar] [CrossRef] [PubMed]
- Donohue, T.M.; Curry-McCoy, T.V.; Todero, S.L.; White, R.L.; Kharbanda, K.K.; Nanji, A.A.; Osna, N.A. L-Buthionine (S,R) sulfoximine depletes hepatic glutathione but protects against ethanol-induced liver injury. Alcohol Clin. Exp. Res. 2007, 31, 1053–1060. [Google Scholar] [CrossRef] [PubMed]
- Cederbaum, A.I. Methodology to assay CYP2E1 mixed function oxidase catalytic activity and its induction. Redox Biol. 2014, 2C, 1048–1054. [Google Scholar] [CrossRef]
- Seglen, P.O. Preparation of isolated rat liver cells. Methods Cell Biol. 1976, 13, 29–83. [Google Scholar] [PubMed]
- Gerjevic, L.N.; Liu, N.; Lu, S.; Harrison-Findik, D.D. Alcohol activates TGF-β but inhibits BMP receptor-mediated Smad signaling and Smad4 binding to hepcidin promoter in the liver. Int. J. Hepatol. 2012. [Google Scholar] [CrossRef]
© 2015 by the authors; licensee MDPI, Basel, Switzerland. This article is an open access article distributed under the terms and conditions of the Creative Commons Attribution license (http://creativecommons.org/licenses/by/4.0/).
Share and Cite
Harrison-Findik, D.D.; Lu, S. The Effect of Alcohol and Hydrogen Peroxide on Liver Hepcidin Gene Expression in Mice Lacking Antioxidant Enzymes, Glutathione Peroxidase-1 or Catalase. Biomolecules 2015, 5, 793-807. https://doi.org/10.3390/biom5020793
Harrison-Findik DD, Lu S. The Effect of Alcohol and Hydrogen Peroxide on Liver Hepcidin Gene Expression in Mice Lacking Antioxidant Enzymes, Glutathione Peroxidase-1 or Catalase. Biomolecules. 2015; 5(2):793-807. https://doi.org/10.3390/biom5020793
Chicago/Turabian StyleHarrison-Findik, Duygu Dee, and Sizhao Lu. 2015. "The Effect of Alcohol and Hydrogen Peroxide on Liver Hepcidin Gene Expression in Mice Lacking Antioxidant Enzymes, Glutathione Peroxidase-1 or Catalase" Biomolecules 5, no. 2: 793-807. https://doi.org/10.3390/biom5020793
APA StyleHarrison-Findik, D. D., & Lu, S. (2015). The Effect of Alcohol and Hydrogen Peroxide on Liver Hepcidin Gene Expression in Mice Lacking Antioxidant Enzymes, Glutathione Peroxidase-1 or Catalase. Biomolecules, 5(2), 793-807. https://doi.org/10.3390/biom5020793