Article

Isolation and Characterization of a Novel Rebaudioside M Isomer from a Bioconversion Reaction of Rebaudioside A and NMR Comparison Studies of Rebaudioside M Isolated from Stevia rebaudiana Bertoni and Stevia rebaudiana Morita

1
The Coca-Cola Company, Atlanta, GA 30313, USA
2
AMRI-Albany, Analytical Development, Albany, NY 12212, USA
3
PureCircle Limited, Lengkuk Teknologi, Bandar Enstek, Negeri Sembilan 71760, Malaysia
*
Author to whom correspondence should be addressed.
Biomolecules 2014, 4(2), 374-389; https://doi.org/10.3390/biom4020374
Submission received: 30 January 2014 / Revised: 12 March 2014 / Accepted: 13 March 2014 / Published: 31 March 2014

Abstract

:
A minor product, rebaudioside M2 (2), from the bioconversion reaction of rebaudioside A (4) to rebaudioside D (3), was isolated and the complete structure of the novel steviol glycoside was determined. Rebaudioside M2 (2) is considered an isomer of rebaudioside M (1) and contains a relatively rare 16 sugar linkage. It was isolated and characterized with NMR (1H, 13C, COSY, HSQC-DEPT, HMBC, 1D-TOCSY, and NOESY) and mass spectral data. Additionally, we emphasize the importance of 1D and 2D NMR techniques when identifying complex steviol glycosides. Numerous NMR spectroscopy studies of rebaudioside M (1), rebaudioside D (3), and mixture of 1 and 3 led to the discovery that SG17 which was previously reported in literature, is a mixture of rebaudioside D (3), rebaudioside M (1), and possibly other related steviol glycosides.

1. Introduction

Sweetness is universally regarded as pleasant and preferred taste for beverages, food, pharmaceuticals, and oral hygiene/cosmetic products. To provide sweet taste to consumer products the most commonly used natural caloric sugars are sucrose, fructose, and glucose. Since these natural sugars provide calories, alternative sources must be utilized when the consumer desires a sweet taste with low to no calories. Artificial and natural sweeteners have been developed to fulfill both criteria [1,2]. It is not a simple task to create a non-caloric or low calorie sweetener because they exhibit a temporal profile, maximal response, flavor profile, mouth feel, and/or adaptation behavior that differ from sugar [3,4]. Steviol glycosides isolated from Stevia rebaudiana Bertoni have been explored to produce an ideal sweetener (sweet, low to no calorie, and natural) [5,6,7,8,9,10,11,12].
Stevia rebaudiana Bertoni is a perennial shrub of the Asteraceae (Compositae) family native to certain regions of South America. Extracts of the leaves have been traditionally used for hundreds of years in Paraguay and Brazil to sweeten local teas and medicines [13,14]. The plant is commercially cultivated in Japan, Singapore, Taiwan, Malaysia, South Korea, China, Israel, India, Brazil, Australia and Paraguay. The leaves of S. rebaudiana contain several naturally sweet steviol glycoside such as steviolbioside, stevioside, rebaudioside A–F, dulcoside A and rubusoside [15,16,17,18,19,20]. Most recently we reported the isolation (from S. rebaudiana Bertoni), characterization and sensory evaluation for sweetness properties of rebaudioside M (also known as rebaudioside X) (1) (Figure 1) [21,22]. Recently Rebaudioside M has received a Letter of No Objection concerning its Generally Recognized as Safe (GRAS) status from the U.S. FDA [23].
Figure 1. Structure of rebaudioside M (1).
Biomolecules 04 00374 g001
In the present study we report the isolation and characterization of a novel isomer of rebaudioside M, also called rebaudioside M2 (2) from the bioconversion reaction of rebaudioside A (4) to rebaudioside D (3) (Scheme 1). The bioconversion reaction mixture was analyzed by HPLC on Phenomenex Kinetex C18 100A (Phenomenex, Torrance, CA, USA), 4.6 mm × 150 mm, 2.6 µm; Column Temp: 55 °C; Mobile Phase A: 0.1% HCOOH in water; Mobile Phase B: Acetonitrile (MeCN); Flow Rate: 1.0 mL/min; Injection volume: 2 µL. Detection was by UV (210 nm) and MSD (SIM). Gradient: 0–8.5 min (75A:25B), 10.0 min (71A:29B), 10.0–16.5 (70A:30B), 25 min (70A:30B). Rebaudioside M2 was determined as a minor product (6.0% based on integrated area percent of the HPLC-MS chromatograph) (Figure 2).
Scheme 1. Bioconversion of rebaudioside A (4) to rebaudioside D (3) and minor product rebaudioside M2 (2).
Biomolecules 04 00374 g004
Figure 2. HPLC Chromatograph for the bioconversion of rebaudioside A (4) to rebaudioside D (3) and minor product rebaudioside M2 (2).
Biomolecules 04 00374 g002

CompoundRetention TimeMWPeak Area
Rebaudioside M2 (2) 3.5501291151,414
Rebaudioside D (3) 5.6331129593,709
Unknown I 7.6381129530,836
Rebaudioside A (4) 13.7829671,225,970
The structure of rebaudioside M2 (2) was determined by 1D and 2D NMR experiments together with mass spectral data. Further, a detailed NMR study was performed with rebaudioside M (Reb M) (1), rebaudioside D (Reb D) (3) and mixtures of rebaudioside M and rebaudioside D (all isolated from S. rebaudiana Bertoni) and the data compared with that previously reported for SG17 isolated from S. rebaudiana Morita [24,25].

2. Results and Discussion

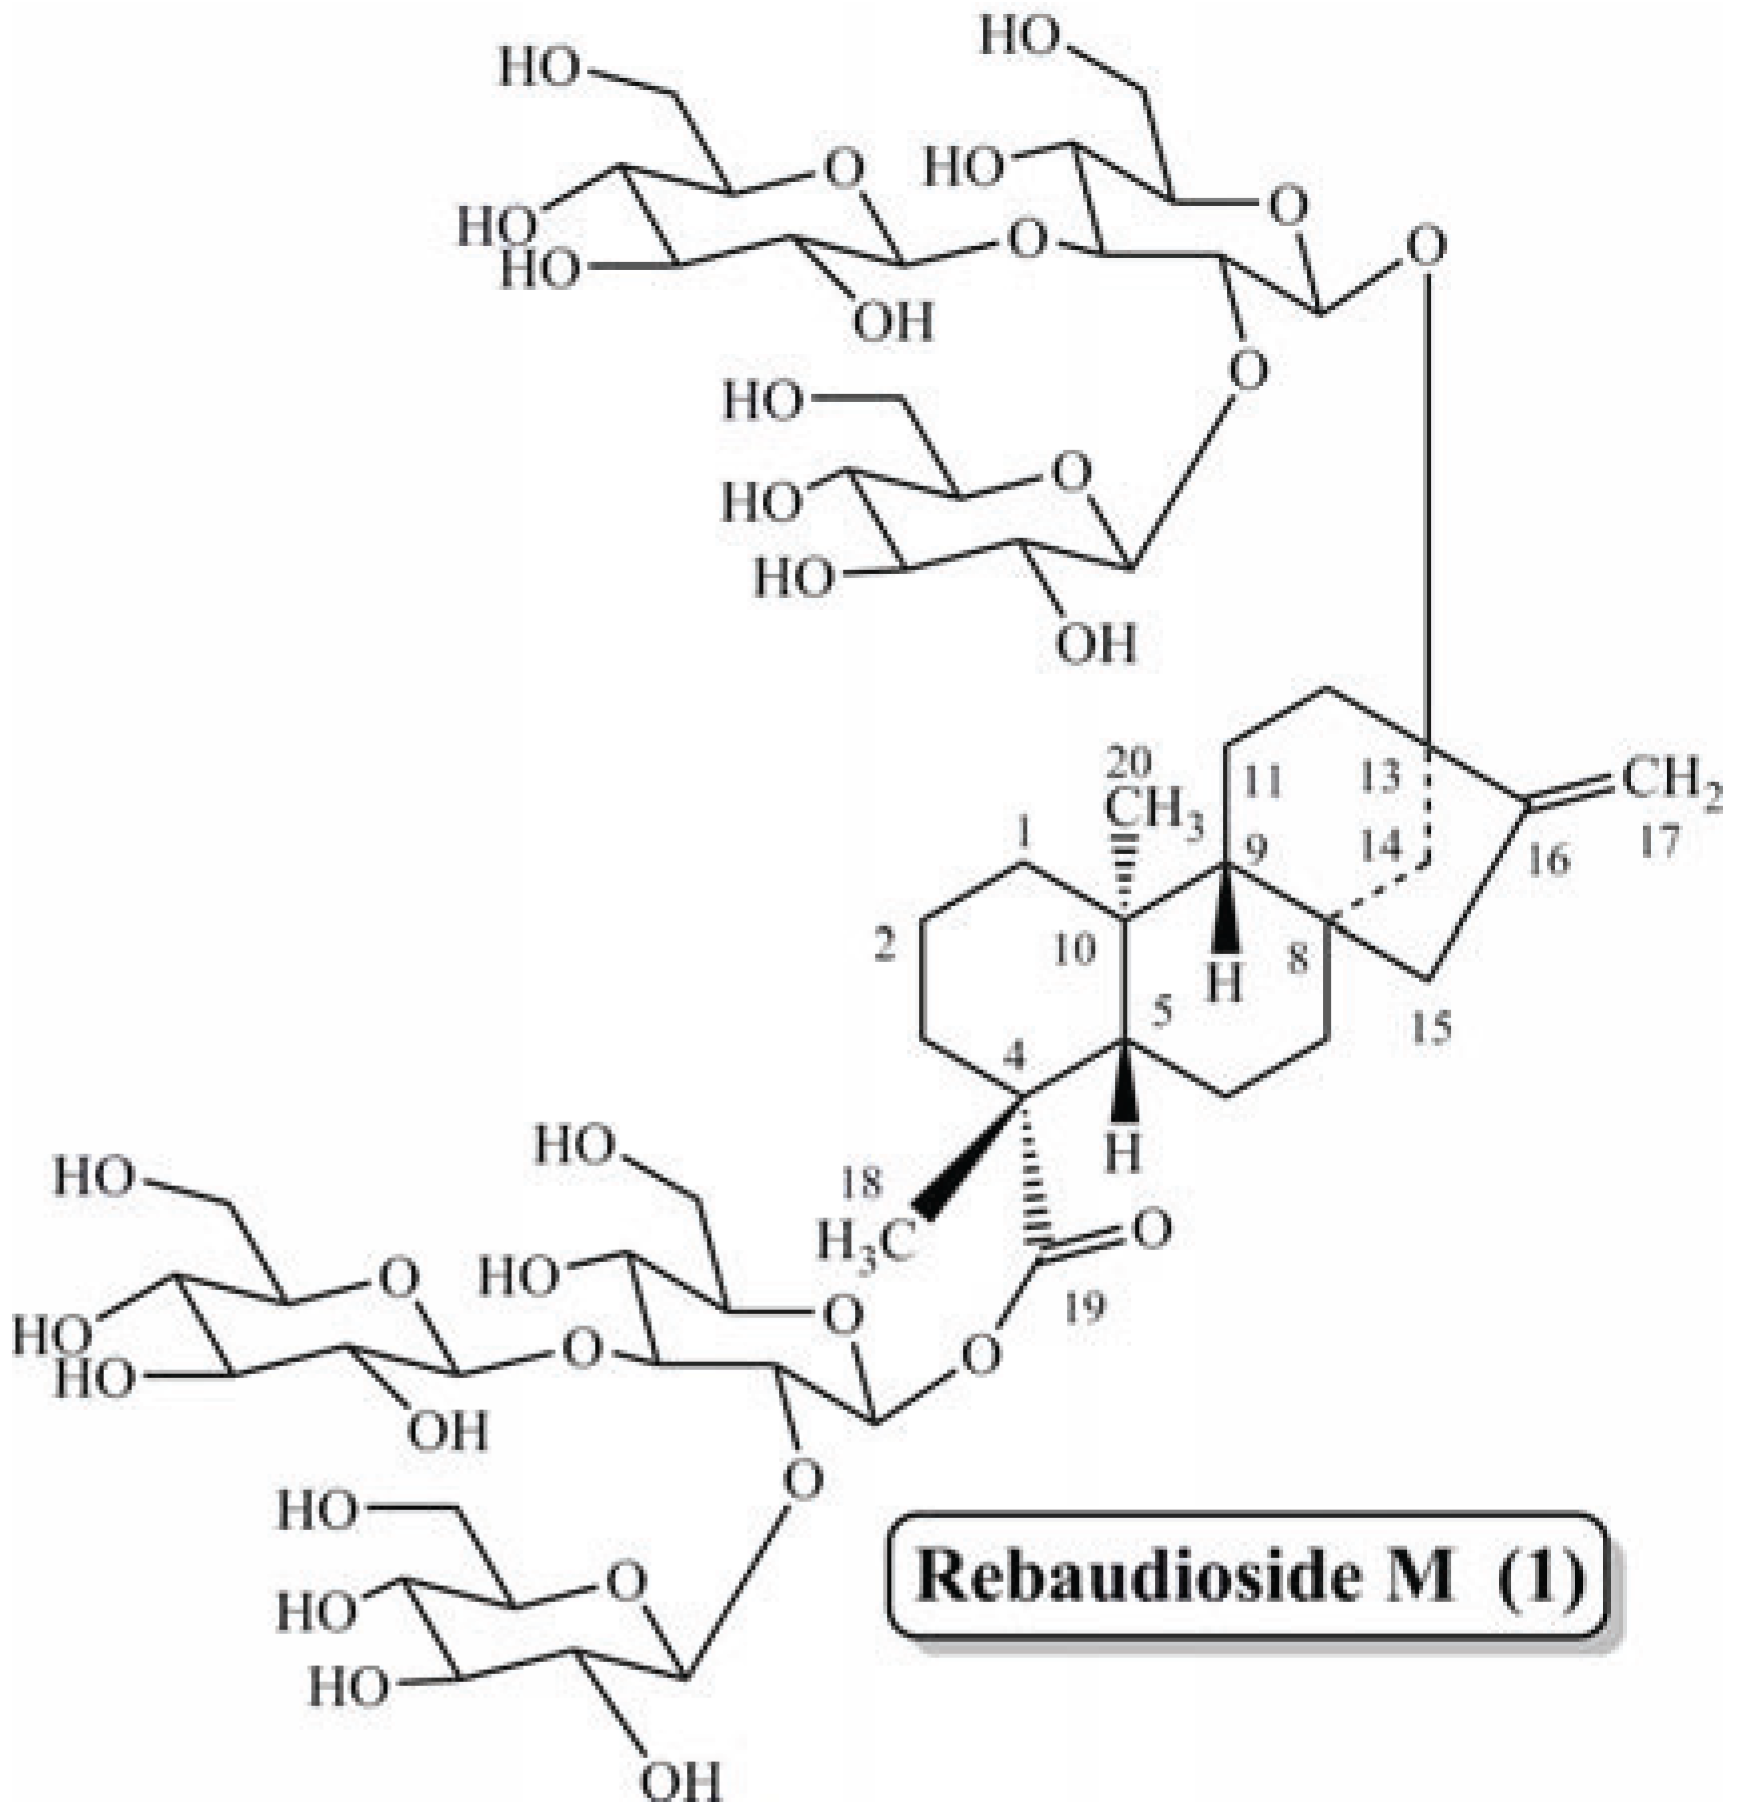
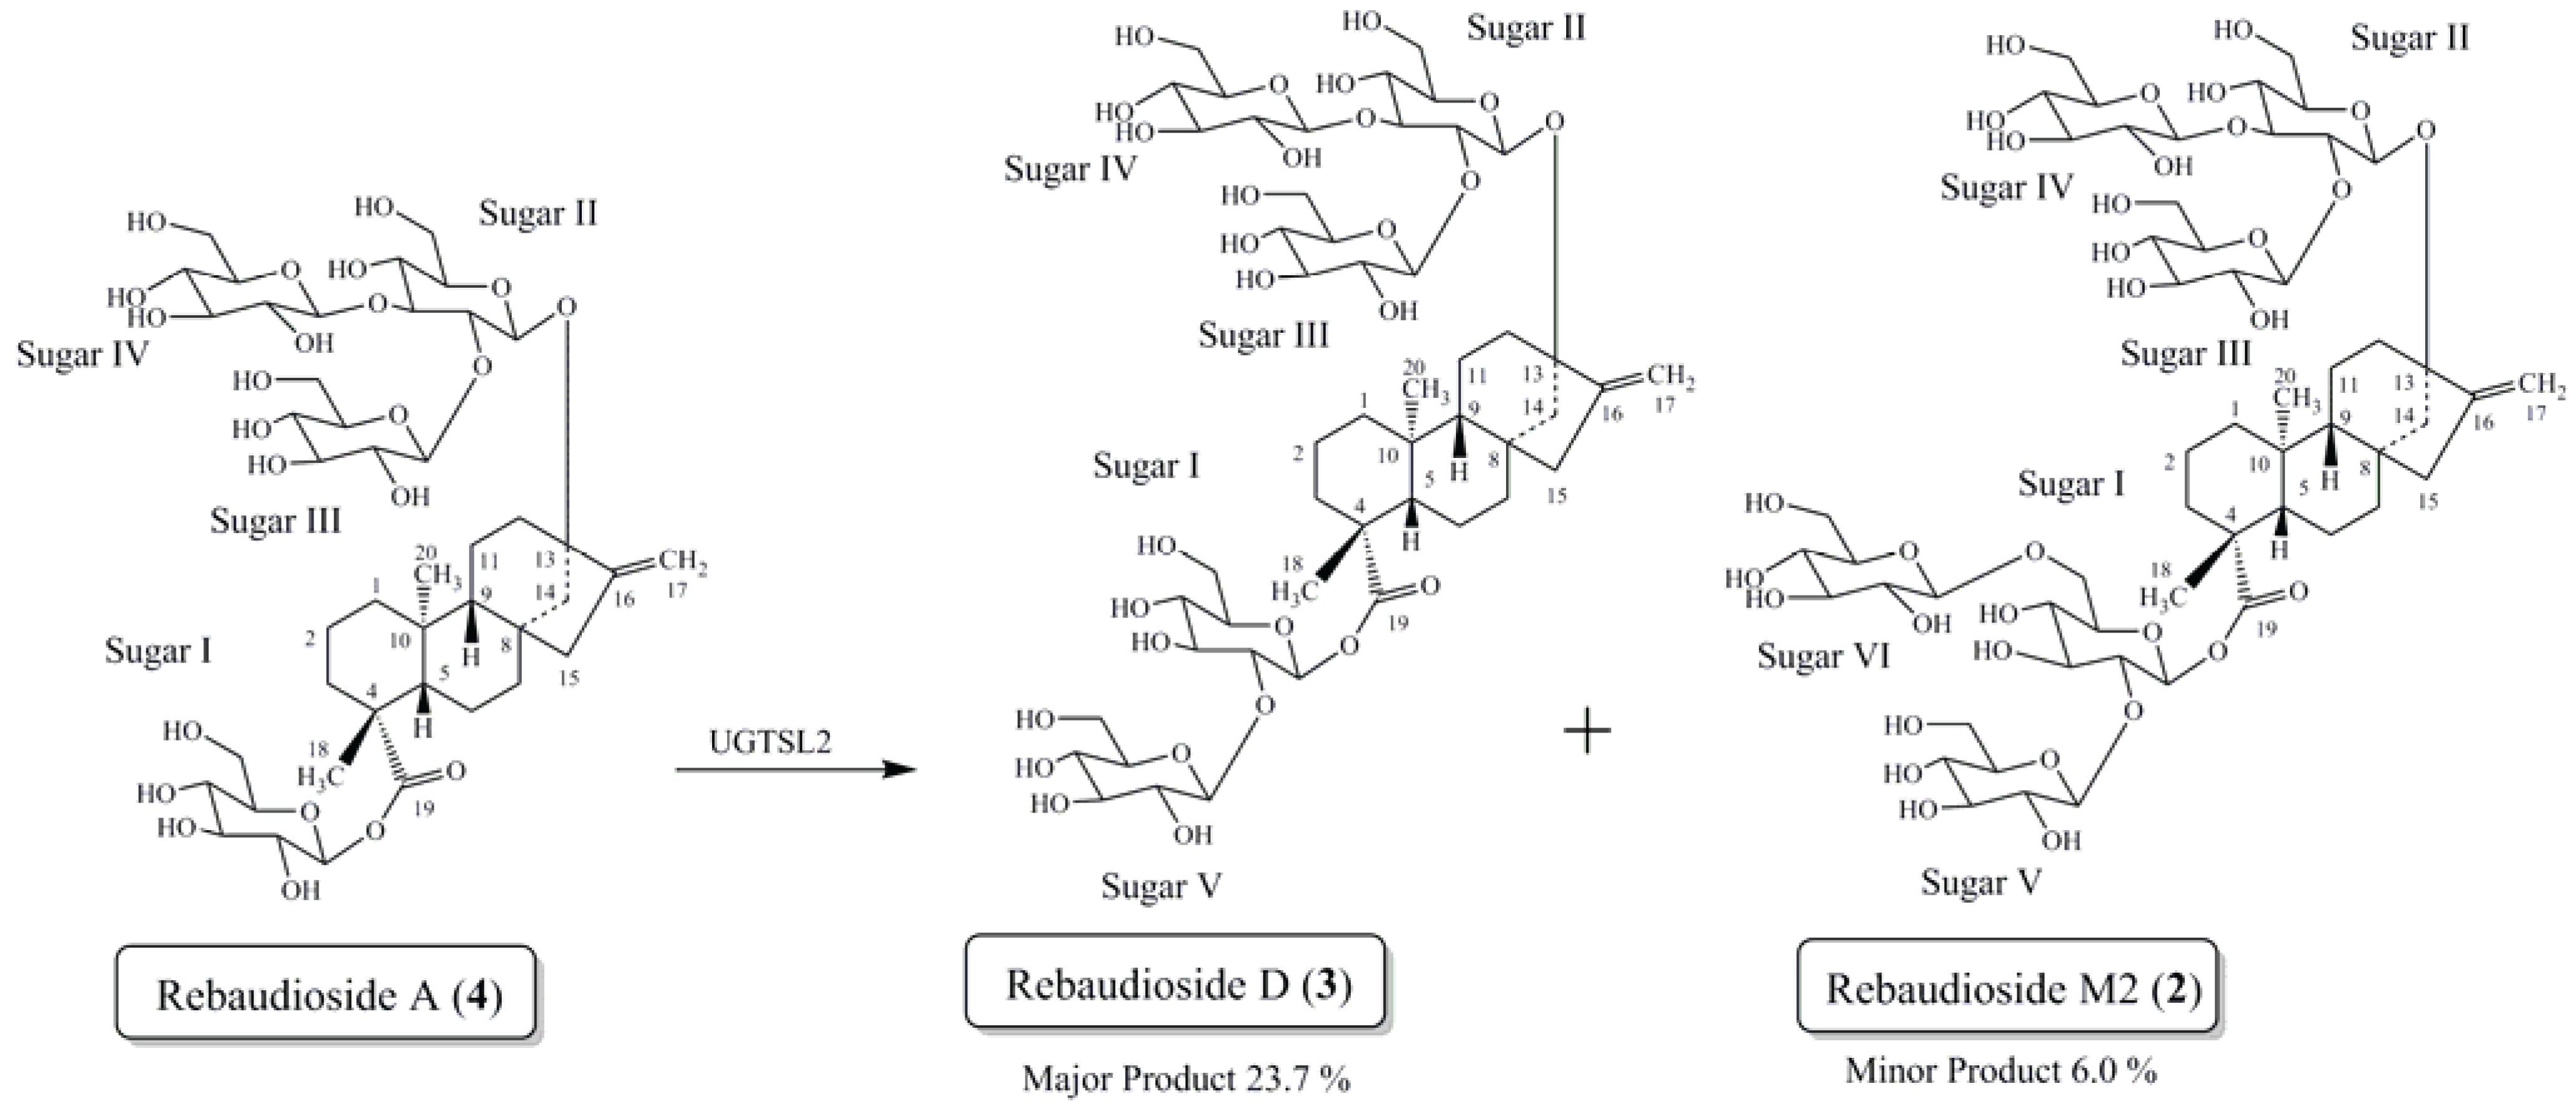
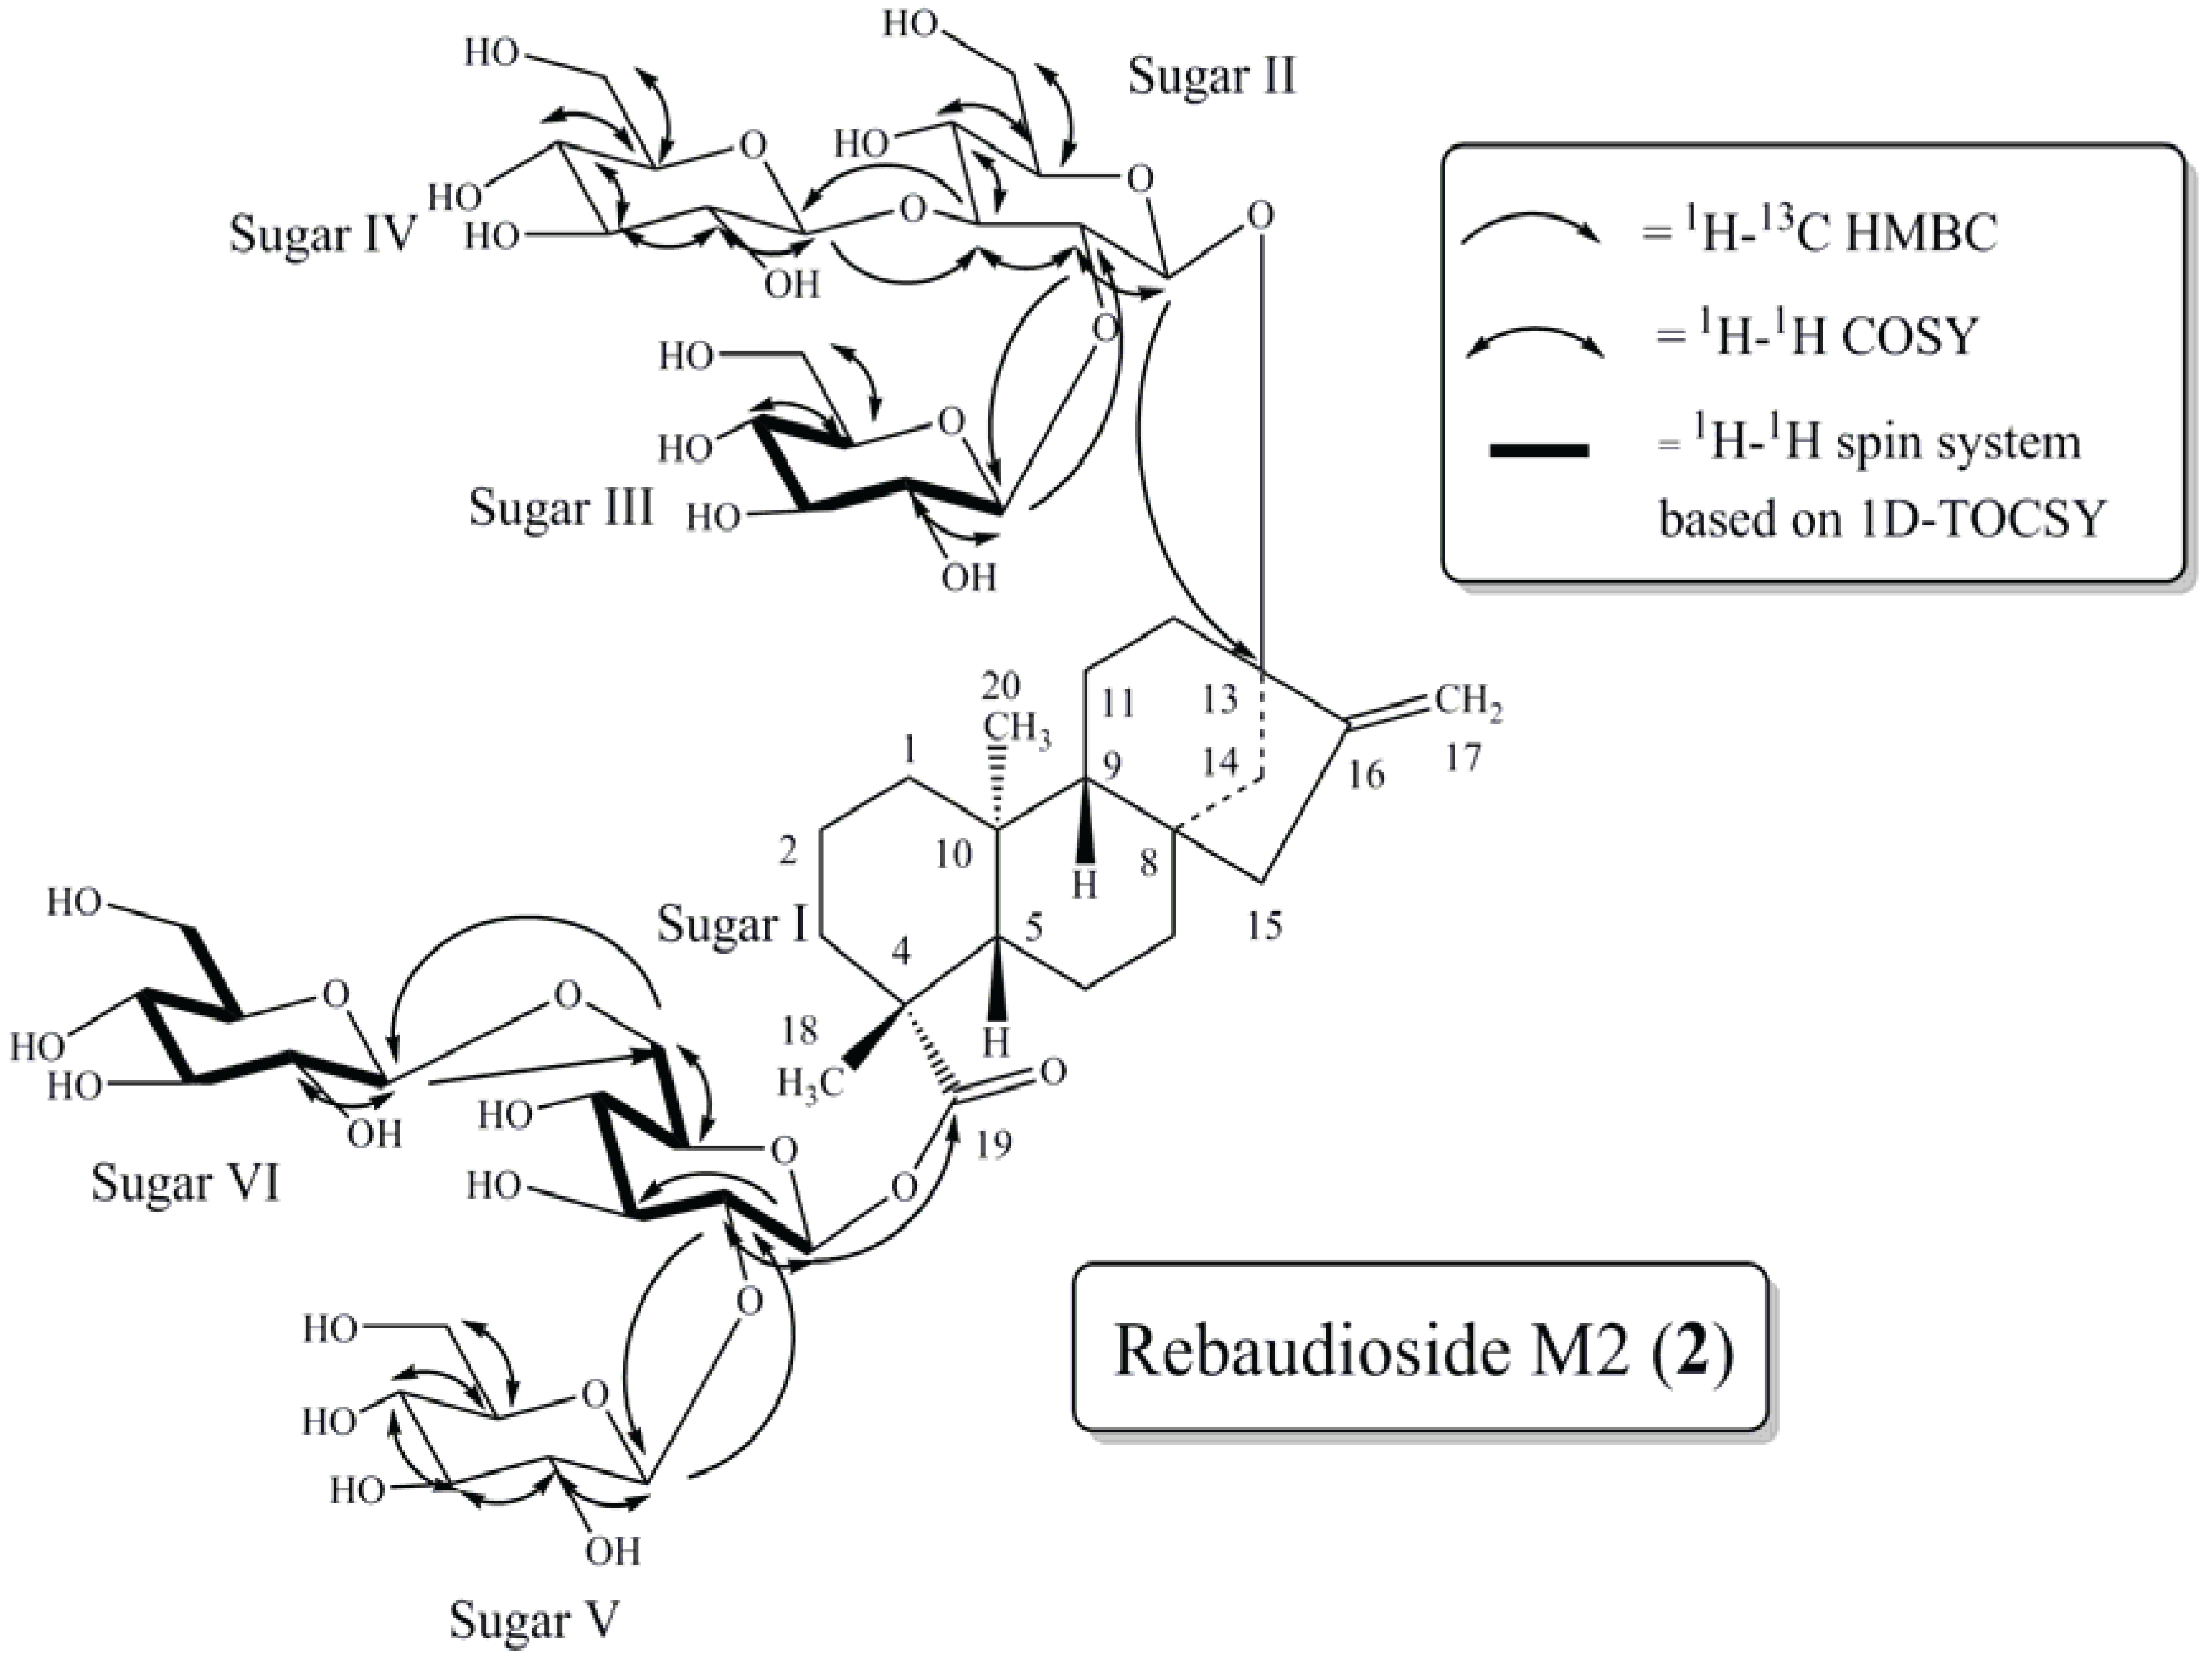
2.1. Rebaudioside M2 (2)

To our knowledge this is the first report of isolation and complete characterization using NMR (1H, 13C, COSY, HSQC-DEPT, HMBC, 1D-TOCSY and NOESY) (Supplementary, Figure S1) and high resolution mass spectral data of rebaudioside M2 (2). Compound 2 was isolated as a white powder and accurate mass measurement using High Resolution Mass Spectrometry (HRMS) provided the exact mass m/z of 1289.5299, [M–H], in it’s negative ESI-TOF mass spectrum corresponding to a molecular formula of C56H90O33.
Examination of the 1D and 2D NMR data indicated the presence of a glycoside structure with a central diterpene core for compound 2. The 1H-NMR spectrum and the HSQC-DEPT data of rebaudioside M2 (2) indicated the presence of two methyl singlets at δ 1.29 and 0.92, two olefinic proton singlets corresponding to an exocyclic double bond at δ 4.98 and at 5.16, nine methylene and two methine protons between δ 0.92–2.28 characteristic for the ent-kaurane diterpenoid isolated from other Stevia extracts [5,6,7,8,9,10,11,12]. The ent-kaurane diterpenoid aglycone central core was supported by 1H-1H COSY correlations of H-1/H-2; H-2/H-3; H-5/H-6; H-6/H-7; H-9/H-11; H-11/H-12 and 1H-13C HMBC correlations of H-5/C-1, C-20; H-9/C-1, C-7, C-14; H-17/C-13; H-18/C-3, C-5, C-19 and H-20/C-1, C-5, C-9, C-10. The complete 1H and 13C assignments of the central diterpene core are provided in Table 1 (positions 1–20).
Correlations observed in the NOESY spectrum were used to assign the relative stereochemistry of the central diterpene core. In the NOESY spectrum, NOE correlations were observed between H-14 and H-20 indicating that H-14 and H-20 are on the same face. Additionally, NOE correlations were observed between H-5 and H-9 but NOE correlations were not clearly observed between H-9 and H-14 indicating that H-5 and H-9 were on the opposite face of the rings compared to H-20 and H-14 as presented in Figure 3. Due to data overlap NOE correlations between H-5 and H-18 could not be confirmed, however the carbon chemical shifts support the relative stereochemistry as presented in Figure 3 [9,10,21]. These data thus indicated that the relative stereochemistry was retained during the glycosylation step.
Table 1. 1H-NMR (500 MHz, D2O) and 13C-NMR (125 MHz, D2O/TSP) assignments of rebaudioside M2 (2) a.
SugarPosition1H-NMR13C-NMR
10.93 m,1.93 m41.9
21.49 m, 1.86 m21.8
31.16 m, 2.28 d (13.4)39.8
4-43.7
51.24 d (12.1)59.2
61.73 m, 1.94 m24.4
71.49 m, 1.56 m 44.2
8-46.9
91.09 d (7.7)55.5
10-42.4
111.66 m, 1.70 m22.6
121.60 m, 2.00 m39.9
13-90.9
141.53 d (12.6), 2.21 d (13.6)46.9
152.15 d (17.2), 2.18 d (18.1)49.4
16-164.0
174.98 s, 5.16 s107.0
181.29 s31.0
19-181.5
200.92 s19.1
I1'5.65 d (7.6)95.5
2'3.96 m80.5
3'3.89 m79.0
4'3.71 m71.5
5'3.73 m79.0
6'4.00 m, 4.15 d (11.7)70.9
II1''4.85 d (7.8)98.4
2''3.75 m81.7
3''3.98 m88.0
4''3.54 m71.3
5''3.96 m80.5
6''3.45 m, 3.77 m63.6
III1'''4.92 d (7.9)104.9
2'''3.32 m76.3
3'''3.51 m78.8
4'''3.26 t (9.5)73.3
5'''3.44 m78.8
6'''3.75 m, 3.94 m64.4
IV1''''4.84 * d (7.8)105.0 *
2''''3.41 m76.1
3''''3.46 m78.8
4''''3.45 m72.5
5''''3.75 m81.7
6''''3.55 m, 3.78 m65.8
V1'''''4.83 * d (8.0)105.3 *
2'''''3.32 m78.5
3'''''3.51 m78.7
4'''''3.38 m72.9
5'''''3.55 m78.8
6'''''3.76 m, 3.97 m63.6
VI1''''''4.50 d (7.9)105.7
2''''''3.33 m78.1
3''''''3.49 m78.6
4''''''3.45 m72.3
5''''''3.48 m78.8
6''''''3.92 m, 3.94 m64.1
a Assignments were made on the basis of COSY, HSQC-DEPT, HMBC, and 1D-TOCSY correlations; chemical shift (δ) values are in ppm; and coupling constants are in Hz; * 1H and 13C values can be exchangeable.
Figure 3. Key COSY, HMBC and 1D-TOCSY correlations of rebaudioside M2 (2).
Biomolecules 04 00374 g003
The ESI HRMS/MS spectrum of compound 2 showed ions at m/z 803.3688, 641.3165, 479.2633 and 317.2082 corresponding to the loss of three hexose sugars followed by sequential loss of three additional hexose sugar moieties from it’s [M–H] ion at m/z 1289.5. The presence of six anomeric protons evident from the 1H and 1H-13C HSQC-DEPT spectra [δH 5.65 (δC 95.5), 4.92 (δC 104.9), 4.85 (δC 98.4), 4.83/4.84 (δC 105.0/105.3), 4.83/4.84 (δC 105.3/105.0) and 4.50 (δC 105.7)], confirmed the presence of six sugar units in the structure. The complete assembly of the glycoside structure was done on the basis of correlations observed in the 2D and 1D-TOCSY NMR data. Thus, long range 1H-13C correlations observed in the HMBC experiment from the anomeric proton at δH 5.65 to a carbonyl carbon at δC 181.5 (C-19) allowed its assignment as the anomeric proton (H-1') of sugar I. Similarly, HMBC correlation from the anomeric proton observed at δH 4.85 to a quaternary carbon at δC 90.9 (C-13) allowed it to be assigned as the anomeric proton (H-2'') of sugar II (Figure 3).
Further analysis of the 1D and 2D NMR data allowed the assignment of the remaining four sugars in 2. The relatively downfield chemical shift of C-2' (δC 80.5) and C-6' (δC 70.9) in sugar I suggested a 2,6-branched-d-glucotriosyl substituent at C-19. Long range 1H-13C correlations observed in the HMBC experiment from the anomeric proton observed at δH 4.83/4.84 (H-1''''') to the carbon at δC 80.5 (C-2') and from H-2' at δH 3.96 to an anomeric carbon at δC 105.3/105.0 (C-1''''') confirmed the substitution at C-2' in sugar I. Additionally, HMBC correlations observed from the anomeric proton at δH 4.50 (H-1'''''') to the carbon at δC 70.9 (C-6') and from the methylene protons of sugar I at δH 4.00 and 4.15 to the anomeric carbon (δC 105.7) of C-1'''''' confirmed the presence of a 16 sugar linkage between sugar VI and sugar I.
The remaining two glucose moieties were assigned in a similar manner. The relatively downfield chemical shift of C-2'' (δC 81.7) and C-3'' (δC 88.0) in sugar II suggested a 2,3-branched-d-glucotriosyl substituent at C-13. Long range 1H-13C correlations observed in the HMBC experiment from the anomeric proton observed at δH 4.92 (H-1''') to the carbon at δC 81.7 (C-2'') and from H-2'' at δH 3.75 to an anomeric carbon at δC 104.9 (C-1''') confirmed the sugar substitution at C-2' in sugar II. Similarly, the sugar substituent at C-3'' in sugar II was also corroborated by HMBC correlations observed from the anomeric proton at δH 4.84/4.83 (H-1'''') to the carbon at δC 88.0 (C-3'') and from H-3'' at δH 3.98 to the anomeric carbon (δC 105.3/105.0) of sugar IV confirmed the presence of a 13 sugar linkage between sugar IV and sugar II.
The large coupling constants observed for the anomeric protons of the glucose moieties at δH 5.65 (d, J = 7.6 Hz), 4.92 (d, J = 7.9 Hz) and 4.50 (d, J = 7.9 Hz) suggested their β-orientation. While the remaining three anomeric protons, at δH 4.83 (d, J = 7.8 Hz), 4.84 (d, J = 7.8 Hz) and 4.85 (d, J = 8.0 Hz), were not completely resolved their apparent coupling constants also indicated β-orientation.
The 1H and 13C chemical shifts for the glycoside at C-13 and C-19 are found in Table 1 and a summary of the key HMBC, COSY, and 1D-TOCSY correlations used to assign the glycoside are provided in Figure 3.
Thus the structure of rebaudioside M2 (2), containing a relatively rare 16 sugar linkage, was established as (13-[(2-O-β-d-glucopyranosyl-3-O-β-d-glucopyranosyl-β-d-glucopyranosyl)oxy] ent-kaur-16-en-19-oic acid-[(2-O-β-d-glucopyranosyl-6-O-β-d-glucopyranosyl-β-d-glucopyranosyl) ester].

2.2. NMR Study of Rebaudioside M, Rebaudioside D and SG17

During isolation (HPLC-MS) of compounds 1 and 2 it was revealed that more than one peak provided the molecular weight of 1290, and thus NMR studies were critical for complete structure determination. To determine the complete structure of rebaudioside M2 (2) we compared the NMR spectral data of rebaudioside M (1) (reported in Prakash et al. 2013) [21] and the NMR spectral data for SG17 (reported in Ohta et al. 2010) [24]. Unfortunately rebaudioside M2 (2) was not soluble in any of the solvents screened except for D2O and thus its data could not be directly compared to previously reported data which were acquired in different solvent systems. This led to further examination of the two reported NMR spectral data for rebaudioside M, Ohta et al. [21] and Prakash et al. [24], and noticeable differences in spectral data, acquired in the same solvent system (Pyridine-d5 + TMS) were observed.
Thus, a series of NMR experiments including 1H, 13C, 1H-1H COSY, 1H-13C HSQC-DEPT, and 1H-13C HMBC were performed in pyridine-d5 + TMS (Supplementary, Figure S2) to allow assignment of >95% rebaudioside M (1) in this solvent system. The 1H- and 13C-NMR data of >95% rebaudioside M (1) in pyridine-d5 + TMS, were compared to the data of SG17 (isolated from S. rebaudiana Morita) in pyridine-d5 + TMS, which was previously reported by Ohta et al. [24]. As presented in Table 2 and Table 3, more than half of the reported 1H and 13C chemical shifts of SG17 are not consistent with the 1H and 13C chemical shifts of compound 1 indicating that the data presented for SG17 by Ohta et al. [24] are most likely for a mixture of steviol glycosides. Therefore, NMR analysis of related samples such as >95% rebaudioside D (3) (Exp. 2), 80% rebaudioside M (1) (Exp. 5), and mixture of >95% rebaudioside M and >95% rebaudioside D (Exp. 3 and Exp. 4) were carried out (Supplementary, Figures S3–S6) to compare their data to the data of SG17. The 13C- and 1H-NMR assignments for compounds 1 and 3 in experiments 3 and 4 (Table 2 and Table 3) were confirmed on the basis of HSQC-DEPT and HMBC data. All compounds used in this NMR study were isolated from S. rebaudiana Bertoni.
The data presented by an asterisk for SG17 in Table 2 (with the exception of assignments for C9, C11 and C12) differ by about 1 ppm from the data of rebaudioside M (1) clearly indicate that these data do not belong to rebaudioside M. Instead, the NMR data of SG17 presented by an asterisk are consistent with the data of rebaudioside D (3). Some of the data of SG17, however, match with the data of compound 1 but some do not match with either the data of rebaudioside M (1) or rebaudioside D (3). Similarly, in the 1H-NMR spectrum of SG17 (Table 3), the data of sugar III H-1' and sugar IV H-1' are most likely swapped, otherwise are consistent with the data of rebaudioside D (3).
Furthermore, as reported in Ohta et al. [24], the structure characterization of SG17 was performed in part by partial hydrolysis of the glycoside rather than using the modern 1D and 2D NMR techniques which are very commonly and widely used methods for structure elucidation of unknown compounds such as rebaudioside M. As reported in Morita et al. [25], rebaudioside M and rebaudioside D were separated by HPLC as a combined peak, and the rebaudioside M structure was deduced from mass spectrometry data, rather than using purified rebaudioside M for characterization by the modern 1D and 2D NMR techniques. Further, complete 1H- and 13C-NMR spectral assignments of the glycoside SG17 is not provided in the paper or patent application [24,25]. For a compound as complex as rebaudioside M (1), 2D NMR data is needed to establish the specific sugar linkages and complete assignment of the structure, however in the publications of Ohta et al. [24], and Morita et al. [25] there was no indication of any 2D NMR or advance 1D NMR experiments utilized. In the absence of such NMR data, complex structures such as rebaudioside M can be misidentified.
In summary, based on the numerous NMR studies it was inferred that SG17 could be a mixture of rebaudioside D (3), rebaudioside M (1), and possibly related steviol glycosides, with rebaudioside D (3) as the major compound. This work not only uncovers a novel steviol glycoside (2), containing a relatively rare 16 sugar linkage, it also illustrates how critical 1D and 2D NMR techniques are when identifying complex steviol glycosides.
Table 2. Comparison of 13C-NMR data (125 MHz, pyridine-d5 + TMS) of Rebaudioside M (1), Rebaudioside D (3), mixtures of (1) and (3) and SG17 (75 MHz, pyridine-d5 + TMS).
Position No.Exp. 1 13C Assignment for >95% Reb M (1) in Pyr-d5 + TMSExp. 2 13C Assignment for >95% Reb D (3) in Pyr-d5 + TMSExp. 3 13C Assignment for (1) 82% + (3) (18%) in Pyr-d5 + TMSExp. 4 13C Assignment for (3) 82% + (1) 18% in Pyr-d5 + TMSExp. 5 13C Assignment for 80% Reb M (1) in Pyr-d5 + TMS13C Assignment [24] in Pyr-d5 + TMS for SG17
Reb MReb DReb DReb M
140.340.640.340.640.640.340.340.5
219.620.019.620.020.019.619.619.8
338.437.838.437.837.838.438.438.3
444.244.344.244.344.344.344.244.3
557.357.457.357.457.457.357.357.3
623.422.2 *23.422.222.223.423.422.2 *
742.542.242.542.242.242.542.541.1 *
841.241.841.141.841.841.141.242.1 *
954.253.9 *54.253.953.954.254.253.9 *
1039.739.739.739.739.739.739.739.7
1120.220.5 *20.220.520.520.220.220.5 *
1238.437.8 *38.437.837.838.438.437.8 *
1387.686.7 *87.686.786.787.587.686.6 *
1443.344.1 *43.344.144.143.343.344.2 *
1546.547.7 *46.547.747.746.446.547.6 *
16153.2154.0 *153.3154.0154.0153.3153.2154.0 *
17104.9104.8104.9104.8104.8104.9104.9104.0
1828.229.2 *28.229.229.228.228.229.3 *
19176.9175.8 *176.9175.8175.8176.8176.9175.7 *
2016.716.816.716.816.816.716.716.8
C-1'94.993.6 *94.993.693.694.994.993.6 *
C-1''96.297.8 *96.297.897.896.296.297.8 *
C-1'''104.7104.5104.8104.5104.5104.8104.7104.6
C-1''''103.9104.7 *103.9104.5104.7103.9103.9104.7 *
C-1'''''104.1105.7104.1105.7105.7104.2104.1104.1
C-1''''''104.1NA104.1NANA104.1104.1105.1
Reb D = Rebaudioside D; Reb M = Rebaudioside M; NR: Not reported; NA: Not applicable for Reb D; * = Similar spectral data.
Table 3. Comparison of 1H-NMR data (500 MHz, pyridine-d5 + TMS) for 1, 3 and SG17 (300 MHz, pyridine-d5 + TMS).
Position No.Exp. 1 1H Assignment for >95% Rebaudioside M (1) in Pyr-d5 + TMSExp. 2 1H Assignment for >95% Rebaudioside D (3) in Pyr-d5 + TMS1H Assignment [24] in Pyr-d5 + TMS for SG17
10.77 t (11.5)0.75 t (11.4)NR
1.78 m1.72 m
21.39 m1.44 mNR
2.27 m2.16 m
31.04 m1.10 mNR
2.32 d (13.7)2.72 d (13.0)
4--NR
51.08 d (13.4)1.00 d (13.0)NR
62.25 m1.90 mNR
2.42 q (12.9)2.18 m
71.44 m1.29 mNR
1.82 m1.42 m
8--NR
90.93 d (7.8)0.90 d (6.9)NR
10--NR
111.67 m1.67 mNR
1.78 m1.70 m
121.88 m1.91 mNR
2.74 m2.24 m
13--NR
142.04 m1.79 d (12.3)NR
2.75 m2.53 d (10.9)
151.91 d (17.7)2.02 mNR
2.06 m2.06 m
16--NR
174.92 s5.05 sNR
5.71 s5.68 s
181.35 s1.42 sNR
19--NR
201.39 s1.17 sNR
H-1'6.40 d (8.3)6.32 d (7.6) *6.33 d (7.4) *
H-1''5.47 d (7.9)5.10 d (7.5) *5.07 d (7.8) *
H-1'''5.50 d (7.5)5.58 d (7.8)5.41 d (7.8)
H-1''''5.47 d (7.9)5.40 d (7.9)5.59 d (7.5)
H-1'''''5.82 d (7.4)5.48 d (7.7) *5.48 d (7.7) *
H-1''''''5.33 d (8.0)NA5.33 d (7.7)
NR: Not reported; NA: Not applicable for Reb D; * = Similar spectral data.

3. Experimental

3.1. General Experimental Procedures for Rebaudioside M2 (2)

3.1.1. Isolation and Purification

Preliminary HPLC analyses of samples were performed using a Waters 2695 Alliance System (Waters Corp., Milford, MA, USA) equipped with a Waters 2996 Photodiode Array (PDA, Waters Corp.) and Dionex Corona Charged Aerosol (CAD Plus, Dionex, Sunnyvale, CA, USA) detectors by the following method: Phenomenex Synergi Hydro-RP, 4.6 × 250 mm, 4 µm (p/n 00G-4375-E0); Column Temp: 55 °C; Mobile Phase A: 0.0284% NH4OAc and 0.0116% HOAc in water; Mobile Phase B: Acetonitrile (MeCN); Flow Rate: 1.0 mL/min; Injection volume: 10 µL. Detection was by UV (210 nm) and CAD. Gradient: 0–8.5 min (75A:25B), 10 min (71A:29B), 16.5 min (70A:30B), 18.5–24.5 (66A:34B), 26.5–29.0 min (48A:52B), 31–37 min (30A:70B), 38 min (75A:25B).
Analyses of the semi-preparative purification fractions were performed using the following method: Waters Atlantis dC18, 4.6 × 100 mm, 5 μm (p/n 186001340); Mobile Phase A: 25% MeCN in water; Mobile Phase B: 30% MeCN in water; Flow rate: 1.0 mL/min; Injection volume: 10 μL, Detection by CAD. Gradient: 0–5 min (100A), 20 min (20A:80B), 25 min (20A:80B), 30 min (100A).
LC-MS: Preliminary analysis of the steviol glycoside mixture from S. rebaudiana Bertoni was carried out on either a Waters Auto Purification HPLC/MS System with a Waters 3100 Mass Detector or a Waters 2695 Alliance System equipped with a Waters 2996 PDA and Waters QToF Micro detectors operating in negative ion mode. Analysis of the sample was performed using the following method: Phenomenex Synergi Hydro-RP, 4.6 × 250 mm, 4 µm (p/n 00G-4375-E0); Column Temp: 55 °C; Mobile Phase A: 0.0284% NH4OAc and 0.0116% HOAc in water; Mobile Phase B: MeCN; Flow Rate: 1.0 mL/min; Injection volume: 10 µL. Detection was by UV (210 nm), and MSD (−ESI m/z 500–2000). Gradient: 0–8.5 min (75A: 25B), 10 min (71 A:29B), 16.5 min (70A: 30B), 18.5–24.5 min (66A:34B), 26.5–29.0 min (48A:52B), 31–37 min (30A:70B), 38 min (75A:25B).
Isolation of 2 by HPLC: The purification was performed in two chromatographic steps. The first method used for the semi-preparative purification is summarized below. Column: Waters Atlantis dC18, 30 × 100 mm, 5 µm (p/n 186001375); Mobile Phase A: 25% MeCN in water; Mobile Phase B: 30% MeCN in water; Flow Rate: 45 mL/min; Injection load: 160 mg dissolved in 20 mL of water. Detection was by UV (205 nm). Gradient: 0–5 min (100A), 20 min (20A:80B), 25 min (20A:80B), 30 min (100A). The secondary purification used the same column and conditions, but isocratic mobile phase: 20% MeCN in water.

3.1.2. Mass Spectrometry

The ESI-TOF mass spectra and MS/MS data were generated by a Waters QTof Premier mass spectrometer (Waters Corp., Manchester, UK) equipped with an electrospray ionization source. Samples were analyzed by negative ESI. Samples were diluted with H2O:MeCN (1:1) by 50-fold and introduced via infusion using the onboard syringe pump.

3.1.3. Nuclear Magnetic Resonance

The sample of Rebaudioside M2 (2) (~1.0 mg in 150 µL of D2O) was prepared and NMR data were acquired on Bruker Avance 500 MHz instrument (Bruker BioSpin Corp., Billerica, MA, USA) with a 2.5 mm inverse detection probe and 5 mm broad band probe. The 1H-NMR and 13C-NMR spectra were referenced to the residual solvent signal HDO (δH 4.79 ppm) and TSP (δC 0.00 ppm), respectively.
NMR Studies for rebaudioside M (1), rebaudioside D (3), and (1) + (3) mixtures
The sample of >95% Rebaudioside M (1) (10.6 mg in 0.2 mL of pyridine-d5 + TMS), 80% Rebaudioside M (1) (10.1 mg in 0.2 mL of pyridine-d5 + TMS), >95% Rebaudioside D (3) (10.7 mg in 0.2 mL of pyridine-d5 + TMS), 82% of >95% Rebaudioside M (1) and 18% of >95% Rebaudioside D (3) (8.2 mg and 1.8 mg, respectively in 0.2 mL of pyridine-d5 + TMS), and 18% of >95% Rebaudioside M (1) and 82% of >95% Rebaudioside D (3) (1.8 mg and 8.2 mg, respectively in 0.2 mL of pyridine-d5 + TMS), were prepared and NMR data were acquired on Bruker Avance 500 MHz instrument utilizing 5 mm probe except for >95% Rebaudioside M (1) and >95% Rebaudioside D (3), for which 2.5 mm and 5 mm probes were used. The spectra were referenced to the residual solvent signals, δH 0.00, δC 0.0 for TMS present in pyridine-d5 + TMS, chemical shifts (δH and δC are given in ppm, and coupling constant reported in Hertz.

3.2. Material Sources

For the NMR studies rebaudioside M (1), rebaudioside D (3) and mixtures of (1) and (3) were all isolated from S. rebaudiana Bertoni extract (PureCircle Lot# C4-001-1012-0001, PureCircle Ltd., Bandar Enstek, Negeri Sembilan, Malaysia).

3.3. Bioconversion Reaction

Rebaudioside M2 (2) was isolated from bioconversion reaction of rebaudioside A (4) to rebaudioside D (3) by a proprietary glucosyltransferase from PureCircle Ltd. In vivo production of glycosylation enzymes were expressed in yeast.
Rebaudioside A to rebaudioside D conversion with glucosyltransferase UGTSL2 experiment condition are as follows: 430 μL of a reaction mixture containing 0.5 mM rebaudioside A, 3 mM MgCl2, 50 mM sodium phosphate buffer at pH 7.2 and 2.5 mM of UDP-Glucose was added to a 1.5 mL sterile microtube. 52 μL of the enzyme expressed medium was added and the resulting mixture was allowed to react at 30 °C for 24 h. 125 μL samples were taken after 2 h, 16 h, and 24 h and added to a 115 μL of 60% methanol and 10 μL of 2 N sulfuric acid. The quenched sample was centrifuged at 18,000× g for 2 min at room temperature. 200 μL was transferred to a HPLC vial and analyzed by the method described below.
HPLC analyses of samples were performed using an Agilent 1200 series HPLC system equipped with a binary pump (G1312B), autosampler (G1367D), thermostatted compartment (G13136B) and DAD detector (G1315C), connected with Agilent 6110 A MSD, and interfaced with “LC/MSD Chemstation” software. The conditions used were Phenomenex Kinetex, 2.6 μm C18 100A, 4.6 mm × 150 mm, 2.6 μm; Column Temp: 55 °C; Mobile Phase A: 0.1% formic acid in water; Mobile Phase B: Acetonitrile (MeCN); Flow Rate: 1.0 mL/min; Injection volume: 2 µL. Detection was by DAD (210 nm) and MSD (Scan and SIM mode, ES-API, negative polarity). Gradient: 0–8.5 min (75A:25B), 10 min (71A:29B), 16.5 min (70A:30B).

3.4. General Experimental Procedures for Rebaudioside D (3)

Rebaudioside D (3), bioconversion desired product, was isolated and characterized by NMR and MS which allowed a full assignment confirmation.

3.4.1. Isolation and Purification

Preliminary HPLC analyses of samples were performed using a Waters 2695 Alliance System using the following method: Phenomenex Synergi Hydro-RP, 4.6 × 250 mm, 4 µm (p/n 00G-4375-E0); Column Temp: 55 °C; Mobile Phase A: 0.0284% NH4OAc and 0.0116% HOAc in water; Mobile Phase B: Acetonitrile (MeCN); Flow Rate: 1.0 mL/min; Injection volume: 10 µL. Detection was by UV (210 nm) and CAD. Gradient: 0–8.5 min (75A:25B), 10 min (71A:29B), 16.5 min (70A:30B), 18.5–24.5 (66A:34B), 26.5–29.0 min (48A:52B), 31–37 min (30A:70B), 38 min (75A:25B).
Analyses of the bioconversion steviol glycoside mixture were performed by the following method: Waters AutoPurification HPLC/MS System with a Waters 3100 mass Decector operating in the negative ion mode. Analysis of the sample was performed using the following method: Phenomenex Synergi Hydro-RP, 4.6 × 250 mm, 4 µm (p/n 00G-4375-E0); Column Temp: 55 °C; Mobile Phase A: 0.0284% NH4OAc and 0.0116% HOAc in water; Mobile Phase B: MeCN; Flow Rate: 1.0 mL/min; Injection volume: 10 µL. Detection was by UV (210 nm), and MSD (−ESI m/z 500–2000). Gradient: 0–8.5 min (75A:25B), 10 min (71A:29B), 16.5 min (70A:30B), 18.5–24.5 (66A:34B), 26.5–29.0 min (48A:52B), 31–37 min (30A:70B), 38 min (75A:25B).
Isolation of 3 by HPLC: The secondary purification used the same column and conditions, but isocratic mobile phase: 20% MeCN in water. The purification conditions are summarized below. Column: Waters Atlantis T3, 10 × 250 mm, 5 µm (p/n 186003694); Mobile Phase A: DI Water; Mobile Phase B: Acetonitrile; Flow Rate: 5 mL/min; Injection load: 1mL of 74 mg/mL solution. Detection was by mass spectrometry, single ion response detection. Gradient: 0 min (70A:30B), 15 min (60A:40B), 25 min (46A:54B), 30 min (20A:80B), 30.1–40 min (70A:30B).

3.4.2. Mass Spectrometry

The ESI-TOF mass spectra and MS/MS data were generated with a Waters Q-Tof Premier mass spectrometer equipped with an electrospray ionization source. Samples were analyzed by negative ESI. Samples were diluted with H2O:MeCN (1:1) by 50-fold and introduced via infusion using the onboard syringe pump.

3.4.3. Nuclear Magnetic Resonance

The sample of rebaudioside D (3) was prepared by dissolving 10.7 mg in 200 µL of pyridine-d5 + TMS and NMR data were acquired on Bruker Avance 500 MHz instruments with a 2.5 mm inverse detection and 5 mm broad band probes. The 1H-NMR and 13C-NMR spectra were referenced to TMS resonance (δH 0.00 ppm and δC 0.00 ppm).

4. Conclusions

To the best of our knowledge this is the first report of full isolation and spectral characterization of (13-[(2-O-β-d-glucopyranosyl-3-O-β-d-glucopyranosyl-β-d-glucopyranosyl)oxy]ent-kaur-16-en-19-oic acid-[(2-O-β-d-glucopyranosyl-6-O-β-d-glucopyranosyl-β-d-glucopyranosyl)ester]), rebaudioside M2 (2), from a bioconversion reaction of rebaudioside A (4) to rebaudioside D (3). Rebaudioside M2 (2) possesses a 16 sugar linkage between sugar VI and sugar I, making its structural properties unique. Continued discovery in the area of novel steviol glycosides provides great opportunity to find novel sweeteners or sweetener enhancers that can improve sweet taste. In addition to the discovery of rebaudioside M2 (2), we have reiterated the importance of multiple 1D and 2D NMR techniques when identifying complex steviol glycosides. Thus extensive NMR studies of rebaudioside M (1), rebaudioside D (3), and mixtures of 1 and 3 led to the discovery that SG17 is not a single compound but is a mixture of rebaudioside D (3), rebaudioside M (1), and possibly other related steviol glycosides.

Supplementary Materials

Supplementary File 1

Acknowledgements

We wish to thank PureCircle (Malaysia) for providing Stevia extract.

Author Contributions

Indra Prakash, Cynthia Bunders and Romila D. Charan wrote the manuscript and did interpretation of NMR data. Krishna P. Devkota ran NMR experiments and did interpretation of NMR data. Catherine Rameriz and Christopher Priedemann isolated rebaudioside D, rebaudioside M and rebaudioside M2. Avetik Markosyan performed bioconversion reactions.

Conflicts of Interest

The authors declare no conflict of interest.

References

  1. Ahmed, J.; Preissner, S.; Dunkel, M.; Worth, C.L.; Eckert, A.; Preissner, R. SuperSweet—A resource on natural and artificial sweetening agents. Nucleic Acid Res. 2011, 39, D377–D382. [Google Scholar]
  2. Priya, K.; Gupta, V.R.M.; Srikanth, K. Natural sweeteners: A complete review. J. Pharm. Res. 2011, 4, 2034–2039. [Google Scholar]
  3. Weerasinghe, D.P.; DuBois, G.E. Sweetener and sweetness modulators: Requirements for commercial viability. In Sweetness and Sweeteners: Biology, Chemistry, and Psychophysics; Weerasinghe, D.P., DuBois, G.E., Eds.; Oxford University Press: Danvers, MA, USA, 2008; pp. 444–462. [Google Scholar]
  4. DuBois, G.E.; Prakash, I. Non-caloric sweeteners, sweetness modulators, and sweetener enhancers. Annu. Rev. Food Sci. Technol. 2012, 3, 353–380. [Google Scholar] [CrossRef]
  5. Prakash, I.; DuBois, G.E.; Clos, J.F.; Wilkens, K.L.; Fosdick, L.E. Development of rebiana, a natural, non-caloric sweetener. Food Chem. Toxicol. 2008, 46, S75–S82. [Google Scholar] [CrossRef]
  6. Chaturvedula, V.S.P.; Prakash, I. A new diterpene glycoside from Stevia rebaudiana. Molecules 2011, 15, 2937–2943. [Google Scholar] [CrossRef]
  7. Chaturvedula, V.S.P.; Prakash, I. Structures of the novel diterpene glycosides from Stevia rebaudiana. Carbohydr. Res. 2011, 34, 1057–1060. [Google Scholar] [CrossRef]
  8. Chaturvedula, V.S.P.; Rhea, J.; Milanowski, D.; Mocek, U.; Prakash, I. Two minor diterpenoid glycosides from the leaves of Stevia rebaudiana. Nat. Prod. Commun. 2011, 6, 175–178. [Google Scholar]
  9. Chaturvedula, V.S.P.; Clos, J.F.; Rhea, J.; Milanowski, D.; Mocek, U.; DuBois, G.E.; Prakash, I. Minor diterpene glycosides from the leaves of Stevia rebaudiana. Phytochem. Lett. 2011, 4, 209–212. [Google Scholar] [CrossRef]
  10. Chaturvedula, V.S.P.; Mani, U.; Prakash, I. Structures of the novel α-glucosyl linked diterpene glycosides from Stevia rebaudiana. Carbohydr. Res. 2011, 346, 2034–2038. [Google Scholar] [CrossRef]
  11. Prakash, I.; Campbell, M.; San Miguel, R.I.; Chaturvedula, V.S.P. Synthesis and sensory evaluation of ent-Kaurane diterpene glycosides. Molecules 2012, 17, 8908–8916. [Google Scholar] [CrossRef]
  12. Prakash, I.; Campbell, M.; San Miguel, R.I.; Chaturvedula, V.S.P. Catalytic hydrogenation of the sweet principles of Stevia rebaudiana, rebaudiosde B, rebaudioside C and rebaudioside D and sensory evaluation of their reduced derivatives. Int. J. Mol. Sci. 2013, 13, 15126–15136. [Google Scholar]
  13. Brandle, J.E.; Starratt, A.N.; Gijzen, M. Stevia rebaudiana: Its agricultural, biological, and chemical properties. Can. J. Plant Sci. 1998, 78, 527–536. [Google Scholar] [CrossRef]
  14. Lewis, W.H. Early uses of Stevia rebaudiana (Asteraceae) leaves as a sweetener in Paraguay. Econ. Bot. 1992, 46, 336–337. [Google Scholar] [CrossRef]
  15. Madan, S.; Ahmad, S.; Singh, G.N.; Kohli, K.; Kumar, Y.; Singh, R.; Garg, M. Stevia rebaudiana (Bert.) Bertoni—A review. Indian J. Nat. Prod. Resour. 2010, 1, 267–286. [Google Scholar]
  16. Kinghorn, A.A.D.; Soejarto, D.D.; Nanayakkara, N.P.D.; Compadre, C.M.; Makapugay, H.C.; Hovanec-Brown, J.M.; Medon, P.J.; Kamath, S.K. A phytochemical screening procedure for sweet ent-Kaurene glycosides in the genus Stevia. J. Nat. Prod. 1984, 47, 439–444. [Google Scholar] [CrossRef]
  17. Staratt, A.N.; Kirby, C.W.; Pocs, R.; Brandle, J.E. Rebaudioside F, a diterepene glycoside from Stevia rebaudiana. Photochemistry 2002, 59, 367–370. [Google Scholar] [CrossRef]
  18. Sakamoto, I.; Yamasaki, K.; Tanaka, O. Application of 13C-NMR spectroscopy to chemistry of natural glycosides: Rebaudioside-C, a new sweet diterpene glycosides of Stevia rebaudiana. Chem. Pharm. Bull. 1977, 25, 844–846. [Google Scholar] [CrossRef]
  19. Sakamoto, I.; Yamasaki, K.; Tanaka, O. Application of 13C-NMR spectroscopy to chemistry of plant glycosides: Rebaudioside-D and -E, new sweet diterpene-glucosides of Stevia rebaudiana Bertoni. Chem. Pharm. Bull. 1977, 25, 3437–3439. [Google Scholar] [CrossRef]
  20. Steinmetz, W.E.; Lin, A. NMR studies of the confirmation of the natural sweetener rebaudioside A. Carbohydr. Res. 2009, 344, 2533–2538. [Google Scholar] [CrossRef]
  21. Prakash, I.; Chaturvedula, V.S.P.; Markosyan, A. Isolation, characterization and sensory evaluation of a Hexa β-d-glucopyranosyl diterpene from Stevia rebaudiana. Nat. Prod. Commun. 2013, 8, 1523–1526. [Google Scholar]
  22. Prakash, I.; Markosyan, A.; Chaturvedula, V.S.P.; Campbell, M.; San Miguel, R.I.; Purkayastha, S.; Johnson, M. Methods for purifying steviol glycosides. PCT Patent Application WO 2013/096420, 27 June 2013. [Google Scholar]
  23. Agency Response Letter GRAS Notice No. GRN 000473. Purified Steviol Glycosides with Rebaudioside X (also Known as Rebaudioside M) as the Principal Component. Available online: http://www.fda.gov/Food/IngredientsPackagingLabeling/GRAS/NoticeInventory/ucm382202 (accessed on 1 June 2013).
  24. Ohta, M.; Sasa, S.; Inoue, A.; Tamai, T.; Fujita, I.; Morita, K.; Matsuura, F. Characterization of novel steviol glycosides from leaves of Stevia rebaudiana Morita. J. Appl. Glycosci. 2010, 57, 199–209. [Google Scholar] [CrossRef]
  25. Morita, T.; Isao, F.; Fumito, M.; Masaya, O. New Steviol Glycoside. U.S. Patent Application No. 2011/0183056, 28 July 2011. [Google Scholar]

