3.1. Molecular Context of Pallial Amygdalar Neurons in the Telencephalic Temporal Pole
To verify pallial amygdalar radial subdivisions by transcriptomic analysis (snRNAseq, 10× Genomics), we first built a single-nuclei map of this region in the context of neighboring pallial and subpallial areas. We microdissected the amygdala region from the entire brains of adult mice (two males, two females; dissection schema in
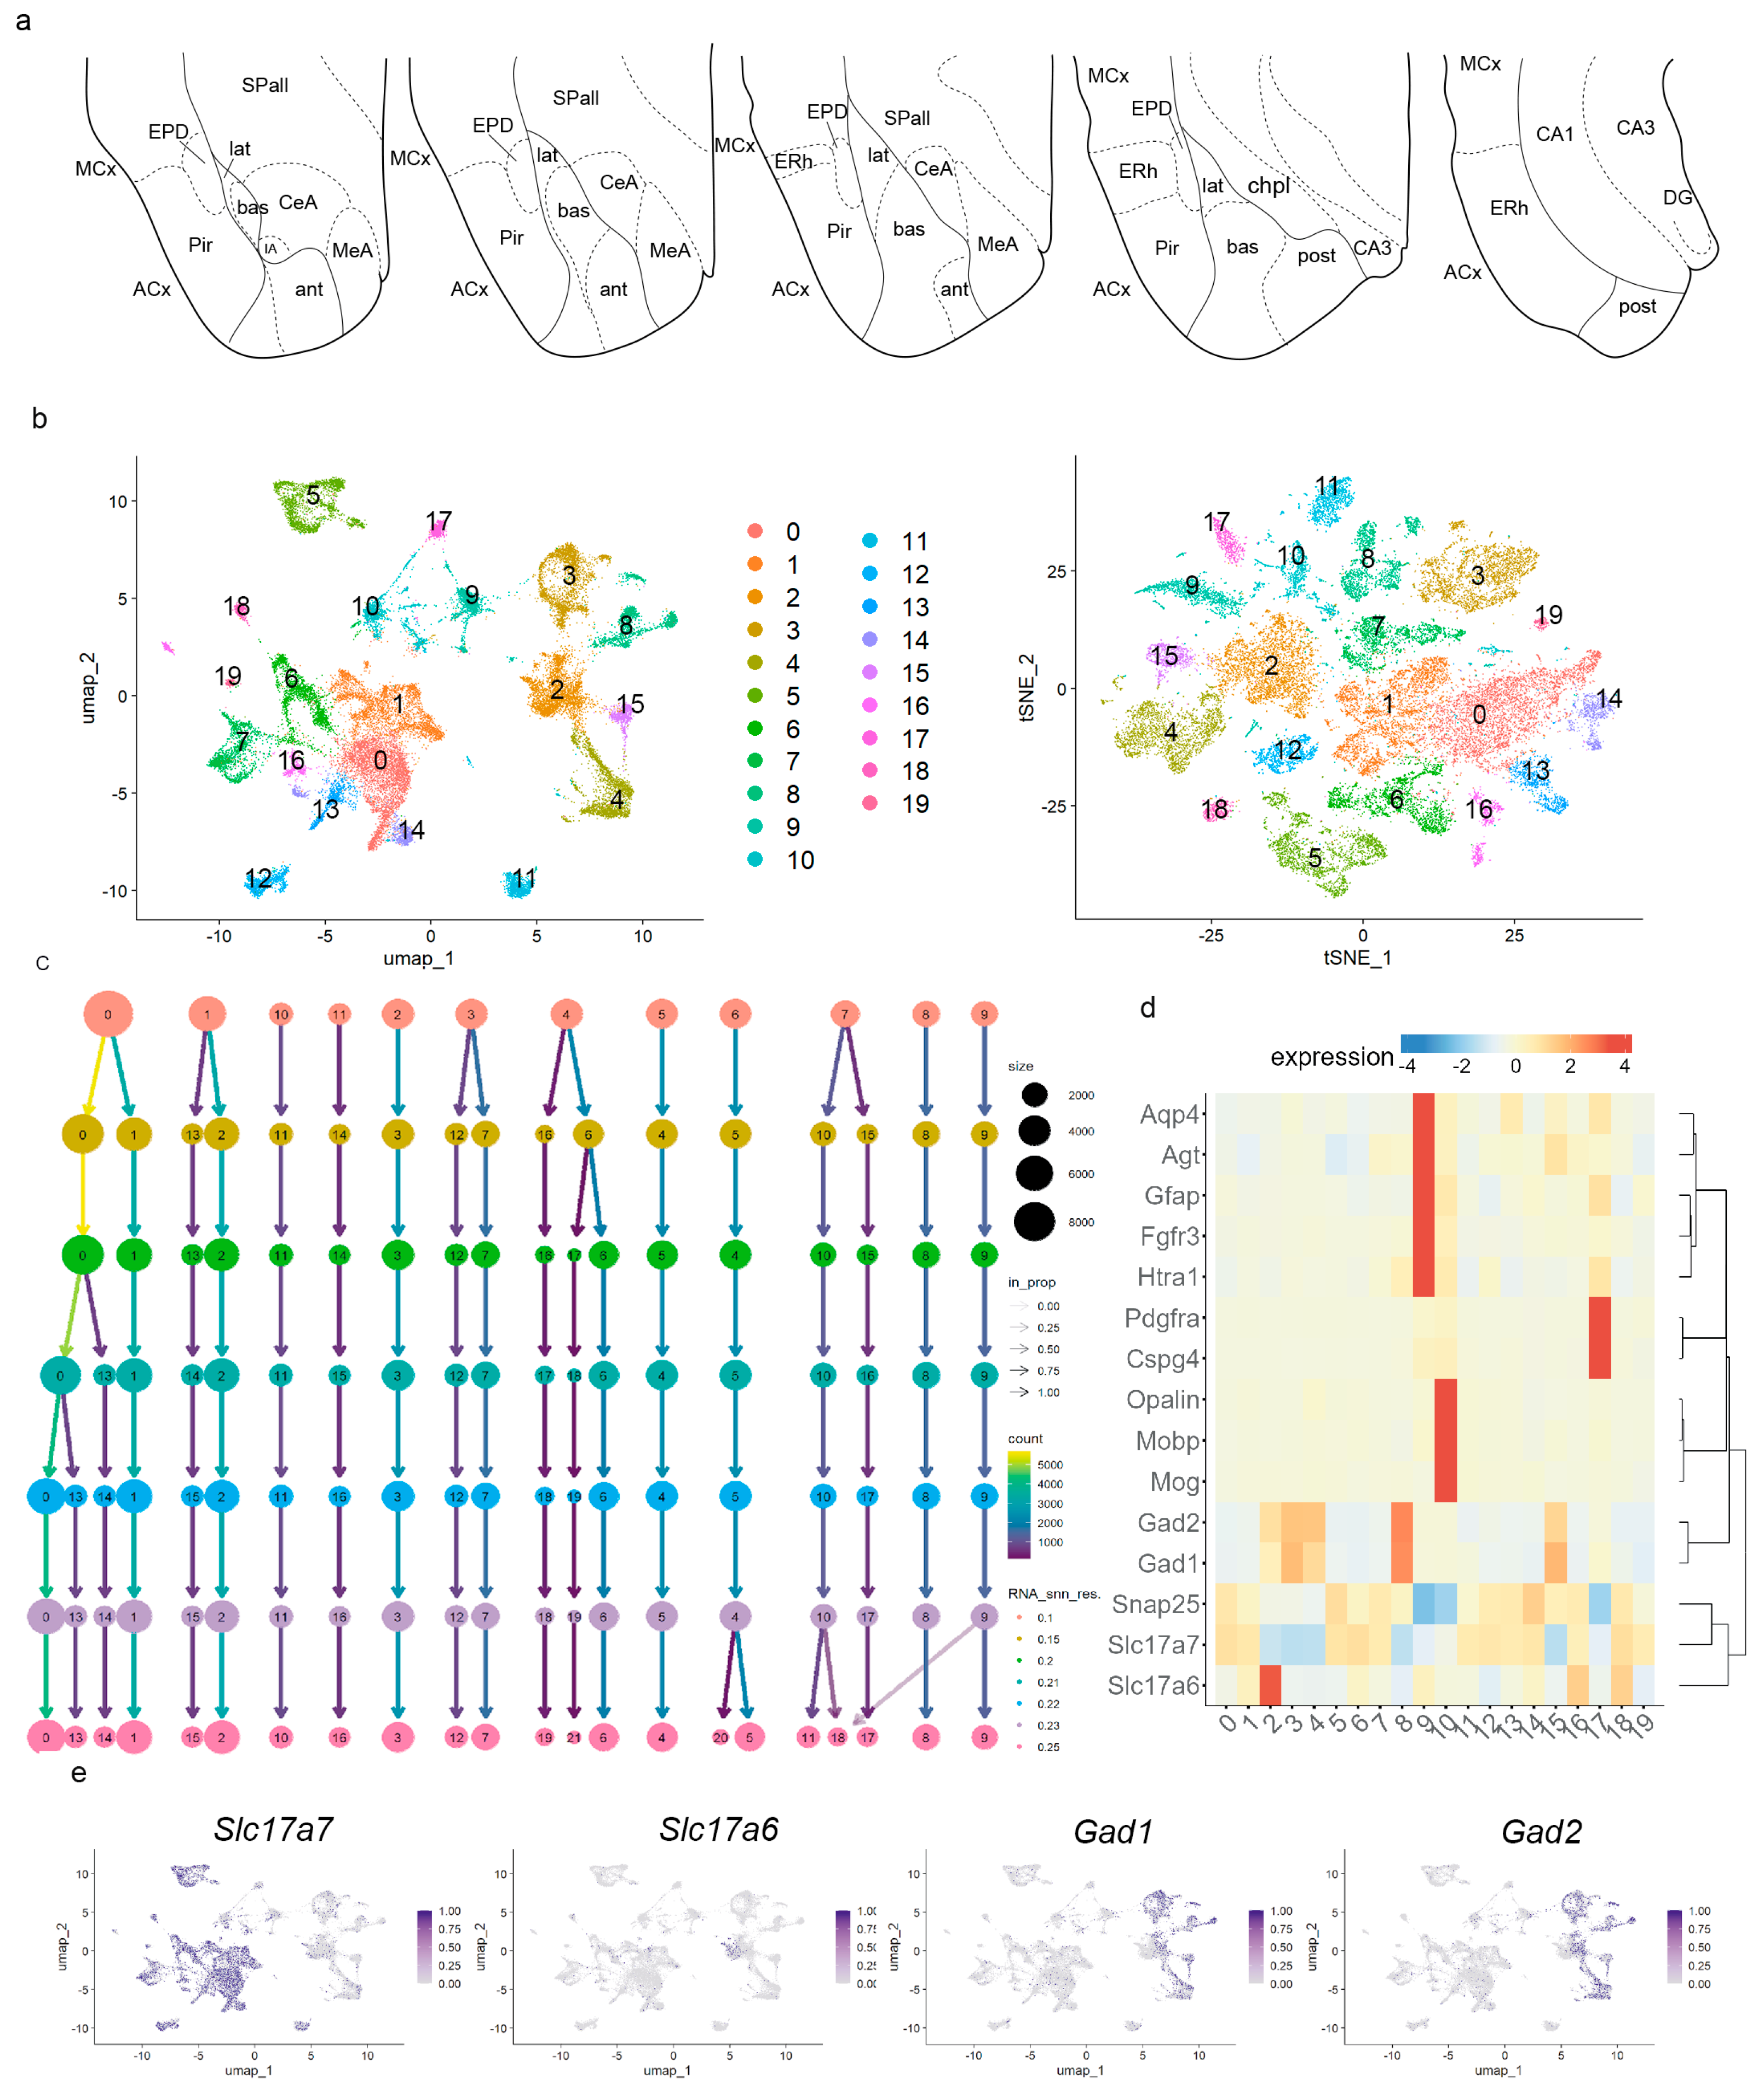
Figure 1a). The selected area included the pallial amygdala, schematized in our figures by its four radial subdivisions:
anterior (ant),
lateral (lat),
basal (bas), and
posterior (post) (
Figure 1a) [
22]. Neighboring pallial and subpallial territories present in the dissected tissue included parts of the allocortical ring, composed of the piriform cortex, entorhinal cortex, and hippocampal region (
Figure 1a; ACx, Pir, ERh, CA1, CA3, DG). Adjacent parts of mesocortex were also included, containing, for instance, the dorsal endopiriform nucleus lying deep to piriform cortex (
Figure 1a; MCx, EPD). Subpallial regions partially present in our material include the subpallial amygdala (medial, central, and intercalated amygdalar nuclei;
Figure 1a; MeA, CeA, IA); striatal and pallidal areas were scarcely represented, if at all (
Figure 1a; SPall). The hypothalamus was not included in our dissections.
Figure 1.
Pallial amygdala in the context of neighboring pallial and subpallial areas. (a) Schematic of the regions dissected in our four adult samples, including the pallial amygdala and other neighboring regions of the pallium and subpallium. (b) Uniform Manifold Approximation and Projection for Dimension Reduction (UMAP) and t-distributed stochastic neighbor embedding (t-SNE) plots of the adult Seurat object (merge of 4 samples; 31,848 nuclei), colored by clusters. (c) Clustree-0.5.1 package to visualize clustering of the adult Seurat object at resolutions 0.1, 0.15, 0.2, 0.21, 0.22, 0.23, and 0.25. (d) Heatmap of markers for cell type differentially expressed between clusters with gene hierarchical clustering. (e) UMAP plots showing expressions of Slc17a7, Slc17a6, Gad, and Gad2 transcripts in the adult dataset. ACx, allocortical ring; ant, anterior radial domain; bas, basal radial domain; CA1, CA1 field; CA3, CA3 field; CeA, central amygdala; chpl, choroidal plexus; dentate gyrus, DG; ERh, entorhinal cortex; EPD, dorsal endopiriform nucleus; IA, intercalated amygdalar nucleus; lat, lateral radial domain; MCx, mesocortex; MeA, medial amygdala; Pir, piriform cortex; post, posterior radial domain; SPall, subpallium.
![Biomolecules 15 01160 g001 Biomolecules 15 01160 g001]()
After satisfactory high-quality control and filtering, we obtained a dataset of 31,848 high-quality single nuclei from our adult Seurat object (merge of four samples;
Figures S1 and S2). For cluster resolution, we evaluated seven potential resolutions. We chose cluster resolution of 0.22 as the optimal one for differentiating the main cell types (astroglia, oligodendroglia, and neurons) and the main anatomical areas (pallial amygdala, subpallium, piriform cortex, lateral, and medial entorhinal cortex, hippocampal areas, mesocortical regions; see Uniform Manifold Approximation and Projection for Dimension Reduction, UMAP plot, and T-distributed Stochastic Neighbor Embedding, tSNE plot at cluster resolution 0.22 in
Figure 1b; Clustree in
Figure 1c). At cluster resolution 0.22, we observed 19 transcriptomic cell clusters, which were distributed among the four main cell types detected in our material by well-established markers (heatmap in
Figure 1d) [
13,
14,
31,
32,
33]: astroglia (
Fgfr3,
Aqp4,
Agt,
Gfap,
Htra1; cluster 9); immature and mature oligodendroglia (
Cspg4,
Pdgfra,
Mog,
Opalin,
Mobp; clusters 10 and 17); neurons were labelled with the pan-neural marker
Snap25 (clusters 0–8, 11–16, 18–19). We distinguished excitatory neurons expressing
Slc17a6 (cluster 2) and/or
Slc17a7 (clusters 0, 1, 5–7, 11–14, 16, 18, 19;
Figure 1d;
Figure 1e shows the UMAP plots for
Slc17a7 and
Slc17a6). Inhibitory neurons express the markers
Gad1 and
Gad2 and correspond to clusters 3, 4, 8, and 15 (
Figure 1d,e shows the UMAP plots for
Gad1 and
Gad2).
To differentiate pallial amygdala from other glutamatergic regions, clusters enriched in the excitatory neuron markers
Slc17a7 and
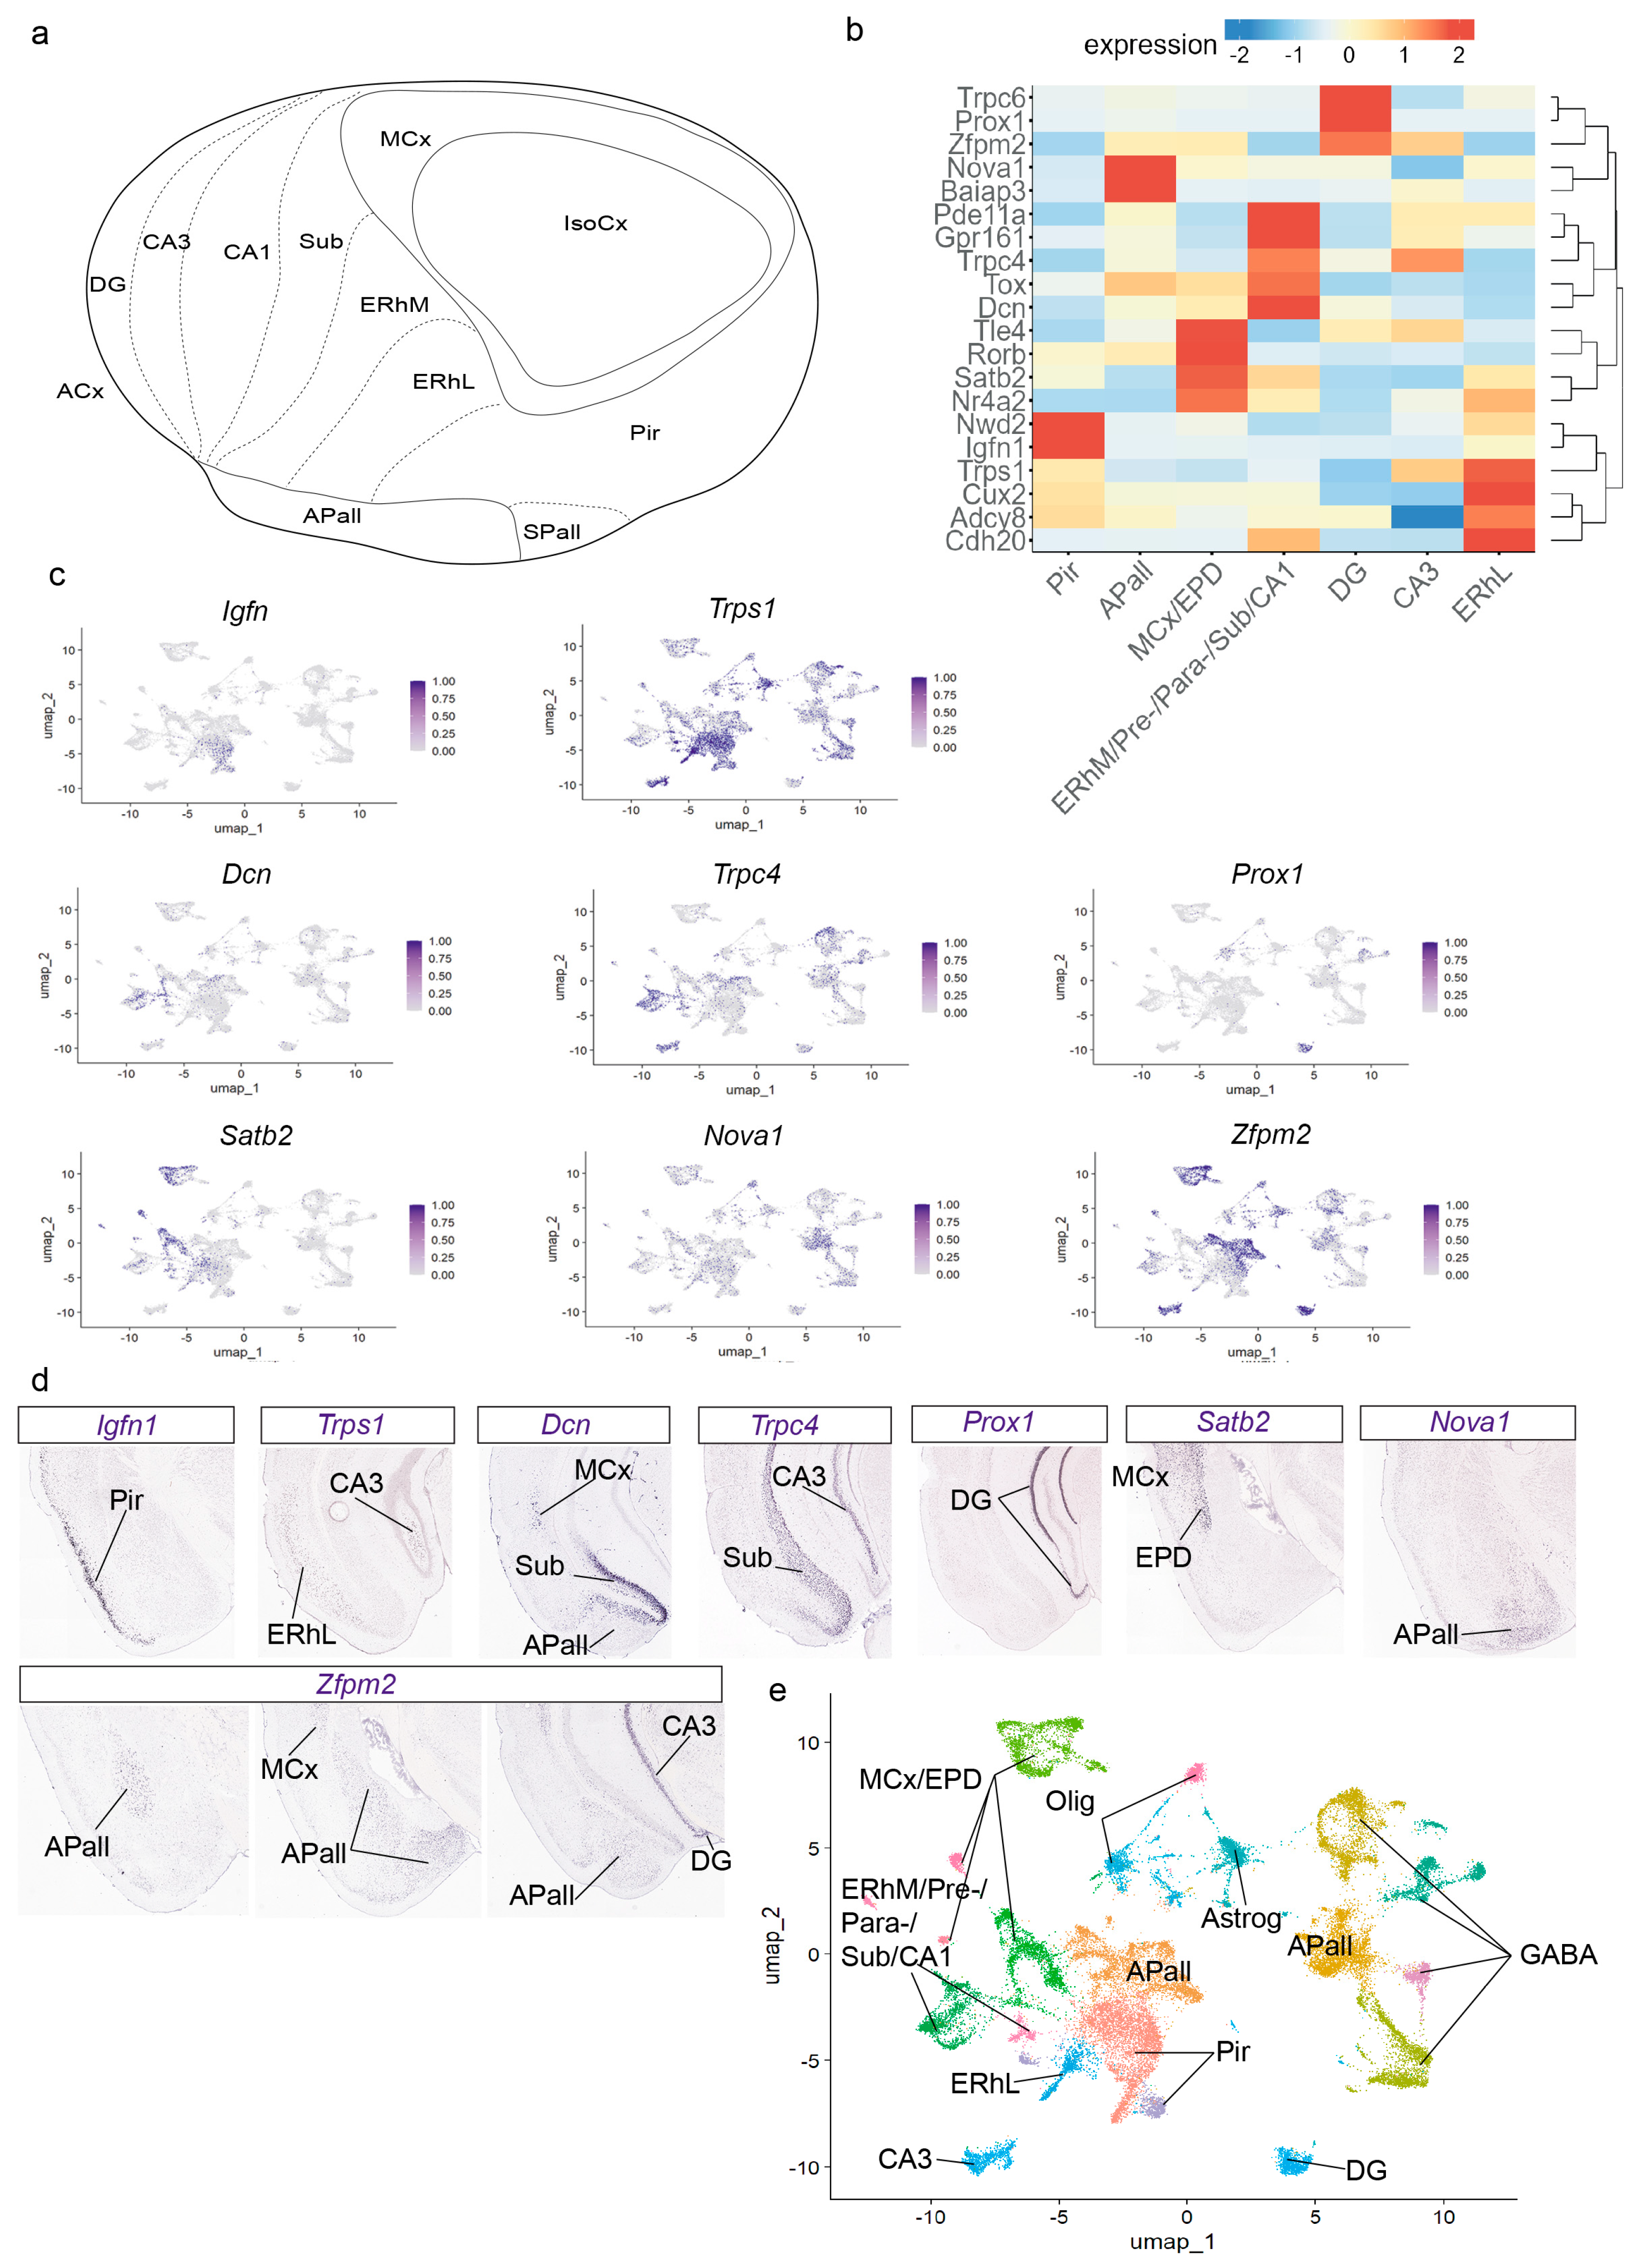
Slc17a6 (clusters 0–2, 5–7, 11–14, 16, 18, and 19) were analyzed in the context of the cortical ring model (
Figure 2a) [
35,
36]. In this model, the pallial amygdala lies outside the cortical area but is in close contact with the allocortical external ring, mainly at the levels of the posterior piriform cortex, entorhinal cortex, and the hippocampus (from subiculum to dentate gyrus) (
Figure 2a). The perirhinal sector of the mesocortical ring lies beyond the entorhinal area, and thus is not in close contact with the pallial amygdala, but the periamygdalar dorsal endopiriform nucleus migrates from the depth of the perirhinal (mesocortical) area to the depth of the periamygdalar piriform cortex. Combinatorial genic profiles were analyzed to identify distinct cortical glutamatergic areas and pallial amygdala nuclei. We applied the “FindAllMarkers” function from Seurat-5.1.0 and the AGEA tool from Allen Mouse Brain Atlas (AMBA) to find these markers (
Figure 2b). The piriform cortex (Pir) expressed
Igfn1,
Trps1,
Nwd2,
Adcy8, and
Cux2 (clusters 0 and 14 in
Figure 1b; heatmap in
Figure 2b; UMAP plots for
Igfn1,
Trps1 in
Figure 2c;
Igfn1,
Trps1,
Nwd2,
Adcy8, and
Cux2 expression analysis by in situ hybridization from AMBA in
Figure 2d and
Figure S3; Pir in
Figure 2e). The lateral entorhinal area (ERhL) showed
Cdh20,
Trps1,
Adcy8,
Pde11a,
Cux2,
Nwd2,
Nr4a2, and
Satb2 expression (cluster 13 in
Figure 1b; heatmap in
Figure 2b; UMAP plots for
Trps1 and
Satb2 in
Figure 2c;
Cdh20,
Trps1,
Adcy8,
Pde11a,
Cux2,
Nwd2,
Satb2, and
Nr4a2, expression analysis by in situ hybridization from AMBA in
Figure 2d and
Figure S3; ERhL in
Figure 2e). The markers
Dcn,
Trpc4,
Grp161,
Pde11a,
Tox,
Cdh20,
Cux2,
Adcy8,
Nr4a2, and
Satb2 characterized the medial entorhinal area, pre-/para-subiculum, subiculum, and CA1 field (ERhM/Pre-/Para-/Sub/CA1; clusters 7, 16 in
Figure 1b; heatmap in
Figure 2b; UMAP plots for
Dcn,
Trpc4, and
Satb2 in
Figure 2c;
Dcn,
Trpc4,
Grp161,
Pde11a,
Tox,
Cdh20,
Adcy8,
Cux2,
Satb2, and
Nr4a2 expression analysis by in situ hybridization from AMBA in
Figure 2d and
Figure S3; ERhM/Pre-/Para-/Sub/CA1 in
Figure 2e). The CA3 field was labelled with
Tle4,
Trpc4,
Gpr161,
Zfpm2,
Pd11a, and
Trps1 markers, and the dentate gyrus (DG) by
Prox1,
Trpc6,
Tle4, and
Zfpm2 (clusters 12 and 11, respectively, in
Figure 1b; heatmap in
Figure 2b; UMAP plots for
Trpc4,
Prox1,
Trps1, and
Zfpm2 in
Figure 2c;
Tle4,
Trpc4,
Gpr161,
Zfpm2,
Trps1,
Prox1, and
Trpc6 expression analysis by in situ hybridization from AMBA in
Figure 2d and
Figure S3; CA3 and DG in
Figure 2e). The perirhinal mesocortex and the migrated dorsal endopiriform nucleus (MCx/EPD) expressed
Satb2,
Nr4a2,
Tle4,
Rorb,
Tox,
Zfpm2, and
Dcn (clusters 5, 6, 18, and 19 in
Figure 1b; heatmap in
Figure 2b; UMAP plots for
Satb2,
Zfpm2, and
Dcn in
Figure 2c;
Satb2,
Nr4a2,
Tle4,
Tox,
Zfpm2, and
Dcn expression analysis by in situ hybridization from AMBA in
Figure 2d and
Figure S3; MCx/EPD in
Figure 2e). The pallial amygdala (APall) expresses few genes that mark it as a whole (e.g.,
Tbr1, which is shared by all the pallium). The clusters observed via transcriptomics detect different gene combinations in different radial parts of the pallial amygdala, which collectively characterize the whole. Namely,
Zfpm2,
Tox, and
Rorb are found in one cluster, while the
Nova1 and
Baiap3 markers appear in another distant cluster (clusters 1 and 2 in
Figure 1b; compare APall in
Figure 2e; UMAP plots for
Zfpm2 and
Nova1 in
Figure 2c;
Nova1 and
Zfpm2 expression analysis by in situ hybridization from AMBA in
Figure 2d). Cluster 2 is located molecularly close to GABAergic populations but is enriched in the glutamatergic marker
Slc17a6 (
Figure 1b,e; APall in
Figure 2e). Cluster 1 is molecularly adjacent to cortical areas and is enriched in the glutamatergic marker
Slc17a7, as is the telencephalic cortex (
Figure 1b,e; APall in
Figure 2e). In addition, we observed that at low resolution, the piriform cortex, the amygdalar cluster 1, and the lateral entorhinal cortex cluster together (Clustree in
Figure 1c). This result suggests a considerable molecular similarity between these three areas. Although the pallial amygdala lies outside the cortical field [
35], it is located next to the piriform and lateral entorhinal cortex. Allocortical areas were not the focus of our study, but the present results also suggest some molecular similarity between medial entorhinal cortex and the hippocampal pre-/para-subiculum/subiculum and CA1 field, in contrast to the lateral entorhinal cortex, whose molecular profile resembles that of the piriform cortex, consistent with conclusions of Abellan et al. [
37].
3.2. Glutamatergic Pallial Amygdala Populations Are Subdivided into Four Clusters Representing the Postulated Four Main Radial Domains
The data from the previous section showed the existence of two main pallial amygdalar clusters, identified as clusters 1 and 2 in
Figure 1b, and as APall in
Figure 2e. Next, we subclustered these two components out of the main Seurat object and removed GABAergic populations (
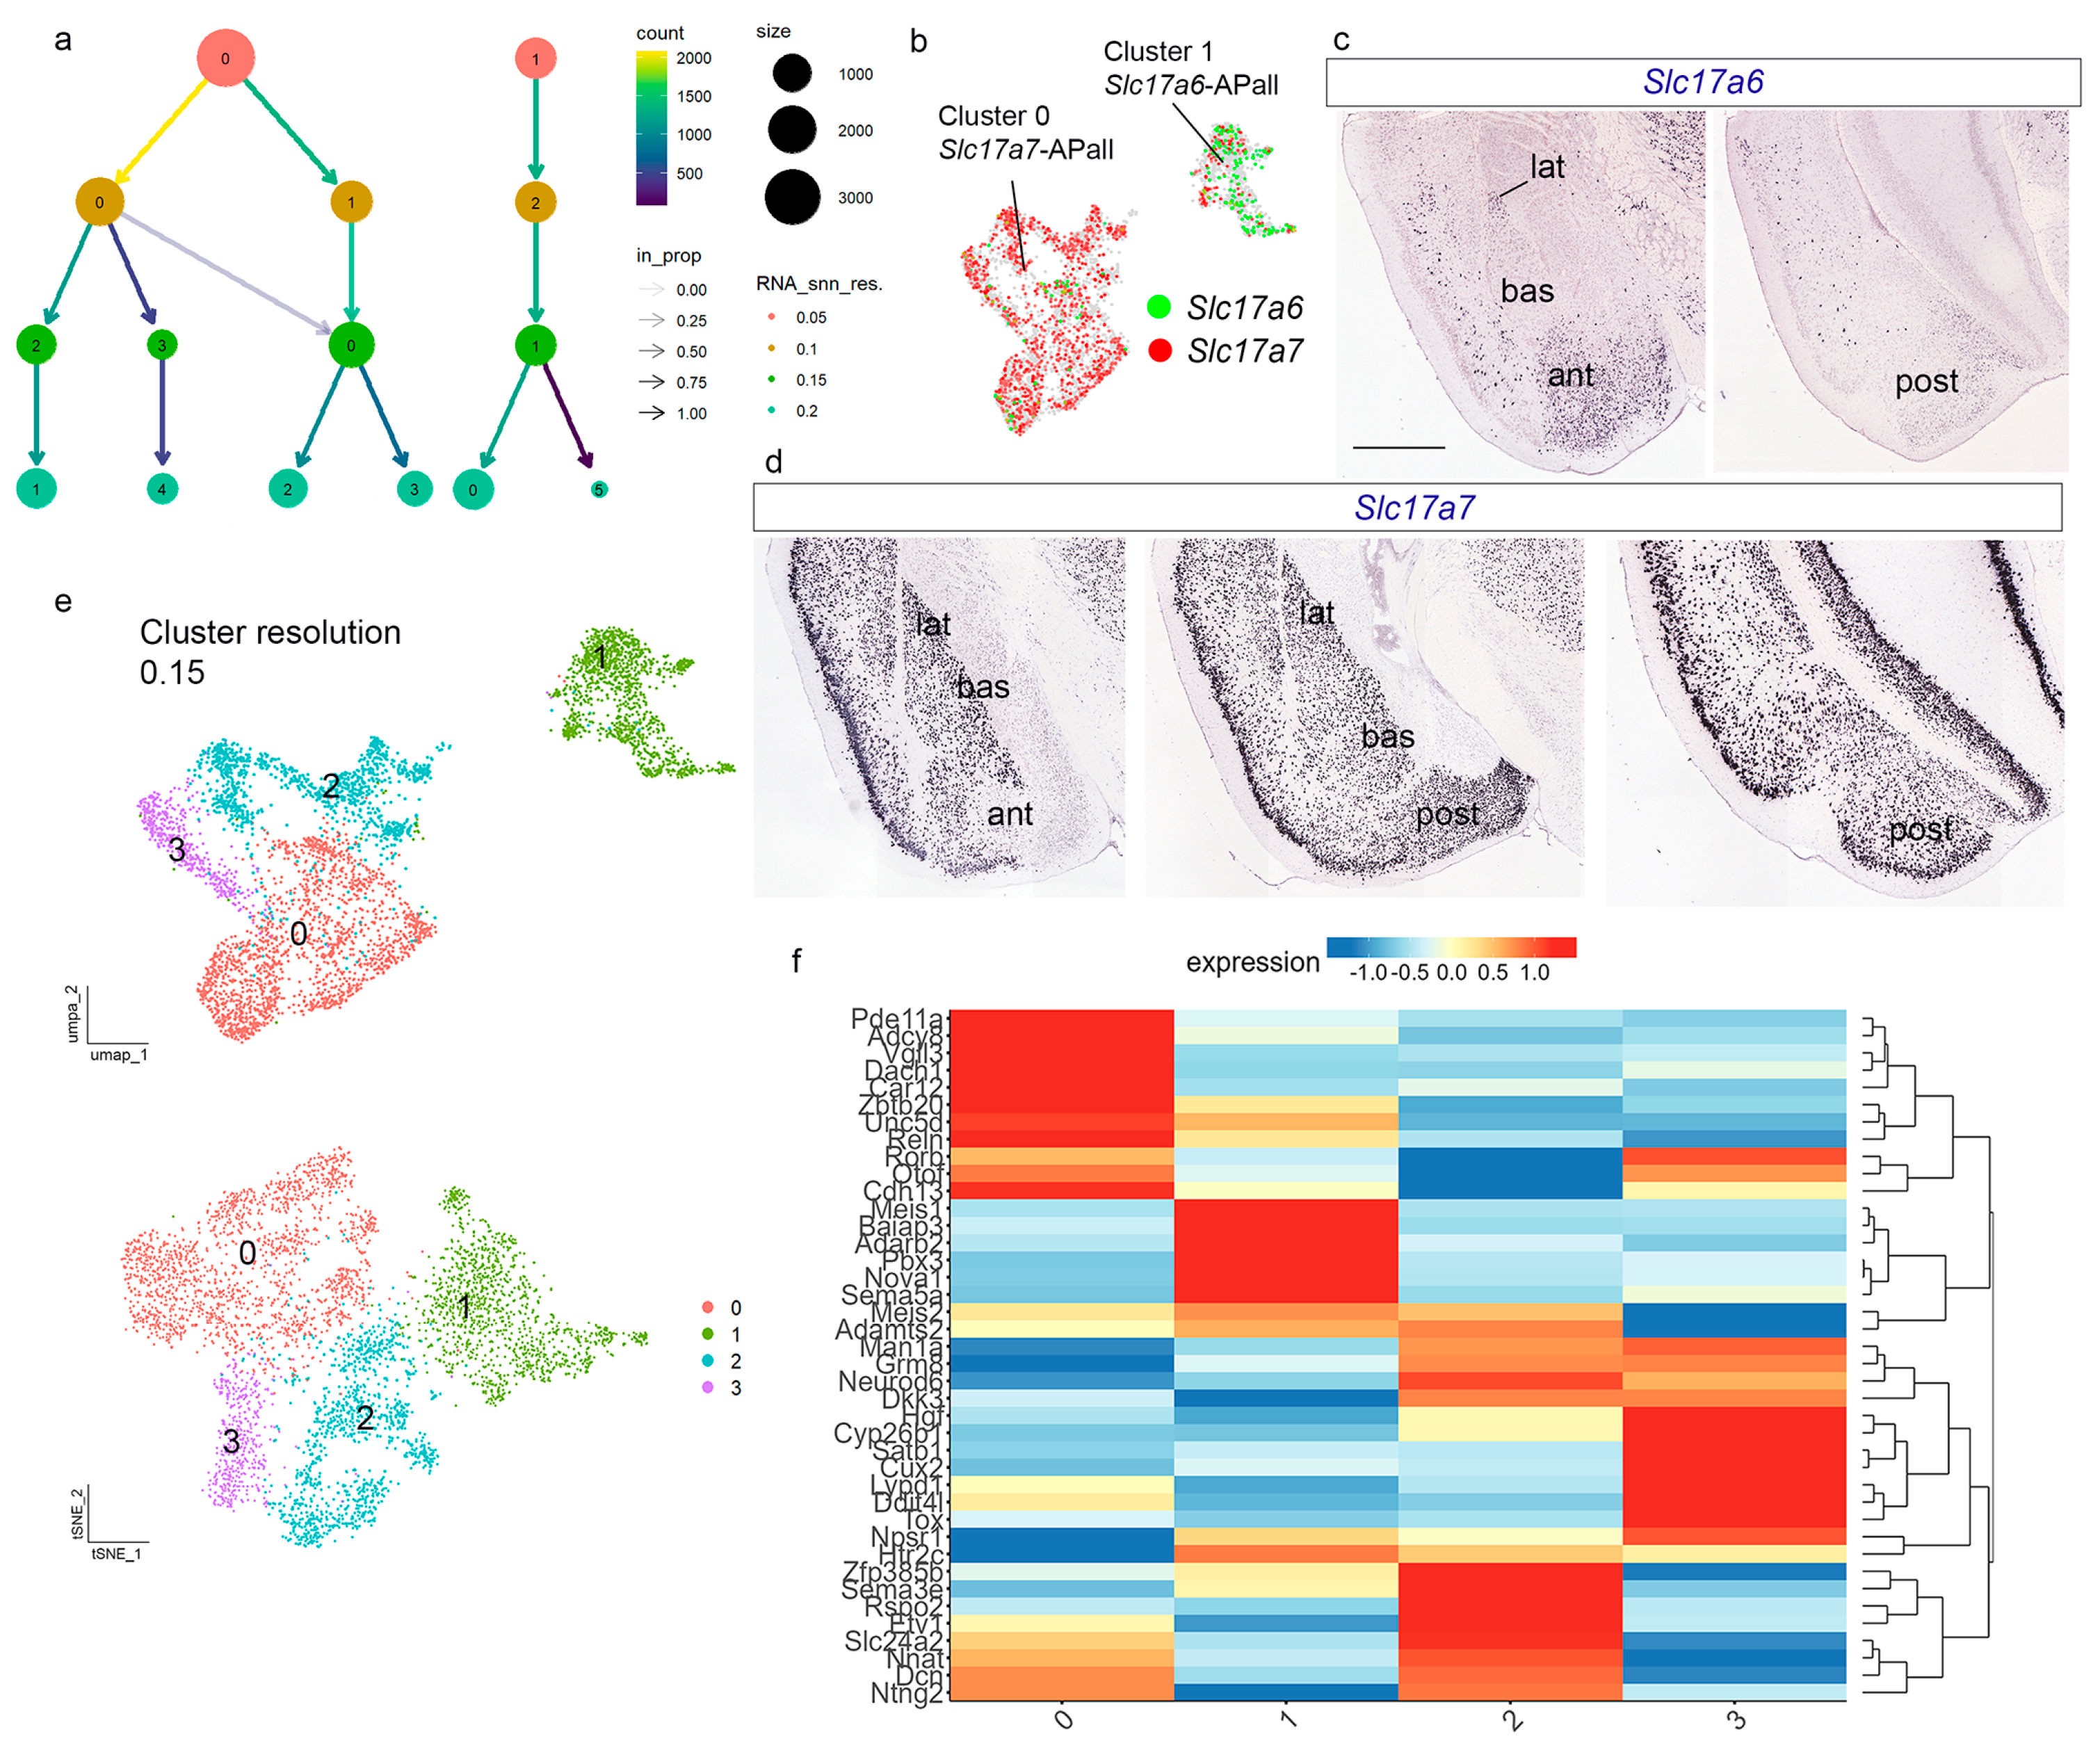
Figure S4a,b). We obtained 4717 high-quality amygdalar pallial nuclei. To select a cluster resolution, we evaluated four potential resolutions: 0.05, 0.1, 0.15, and 0.2 (Clustree in
Figure 3a). At the lowest value (0.05), we detected only the two main clusters mentioned above (named now 0 and 1;
Figure 3a,b and
Figure S4c). Cluster 0 was enriched in
Slc17a7 (
Slc17a7-APall) transcripts, while cluster 1 was enriched in
Slc17a6 (
Slc17a6-APall;
Figure 3b). We checked the expression pattern of
Slc17a6 and
Slc17a7 genes in the pallial amygdala and identified
Slc17a6-APall selectively at the
anterior domain of the radial amygdalar model (
Figure 3c), whereas the
Slc17a7-APall subdivision was represented by the
lateral,
basal and
posterior radial domains (ant, lat, bas, post;
Figure 3d; in situ hybridization from AMBA) [
22,
27]. At cluster resolution 0.1, cluster 0 resulted subdivided into two new clusters, 0 and 1, and the former cluster 1 was renamed cluster 2 (UMAP plot in S4c). At cluster resolution 0.15, we observed four main clusters: the former cluster enriched in
Slc17a6-APall was now cluster 1, while the former
Slc17a7-APall cluster was subdivided now into clusters 0, 2, and 3 (UMAP and tSNE plots in
Figure 3e). The four adult samples and both sexes were represented in the four clusters at resolution 0.15 (
Figure S4d,e).
The postulated amygdalar radial model [
22] proposes four main radial glutamatergic subdivisions in the pallial amygdala. We next checked whether the four clusters obtained at resolution 0.15 in our Seurat object relate to these four radial domains. We employed the “FindAllMarkers” function from Seurat-5.1.0 (
Figure S5) to characterize precisely the different clusters, as well as the AGEA tool from AMBA and our previous results in Garcia-Calero et al. [
22], to find markers for the different radial units or their component nuclei. We selected 40 genes expressed differentially among the four clusters and the diverse radial units (
Figure 3f). The nomenclature we will use in the following text description of pallial amygdalar areas (as well as the figures) adopts a simplified graphic format, e.g., ‘
ant-i’, corresponding to the abbreviation of the radial domain name (among
ant; anterior;
post; posterior;
lat; lateral;
bas; basal) separated by a
hyphen from the abbreviation of the relevant radial stratum (-p; periventricular; -i; intermediate; -s; superficial).
Considering our results, we slightly changed the inner subdivision of the
basal domain. Garcia-Calero et al. [
22] already proposed two main radial subdomains of
bas called
basolateral (bl) and
basomedial (bm), and it was thought that bm showed two mediolateral subdivisions (bmm, bml). In the present work, we keep the two main subdivisions
bl and
bm, but—consistent with specific data—subdivide bl, rather than bm, into lateral and medial subdivisions (
bll and
blm).
3.3. The Anterior Radial Domain
We focused first on the
Slc17a6-APall cluster (cluster 1 in
Figure 3b,e), whose in situ expression was identified selectively at the
anterior radial domain (ant;
Figure 3c). This domain is constituted only by an intermediate stratum (ant-i) and a superficial stratum (ant-s), classically called, respectively, BMA (basomedial amygdaloid nucleus, anterior part) and ACo (anterior cortical amygdaloid nucleus), as identified by Paxinos and Franklin [
21]; Garcia-Calero et al. [
22] used a similar nomenclature. Garcia-Calero and Puelles [
27] specifically described how the transient periventricular stratum of this radial domain disappears during development due to radial migration of its cells into the corresponding intermediate or superficial strata. We checked the expression of the chosen cluster 1 markers identified in
Figure 3f:
Baiap3,
Nova1,
Sema5a,
Adarb2,
Unc5d,
Meis1, and
Pbx3. The
Baiap3 and
Slc17a6 localized in both the ant-i and ant-s strata of the
anterior radial domain; interestingly, the neighboring ventral medial amygdala also shows
Baiap3 and
Slc17a6 transcripts (ant-i, ant-s, MeAV;
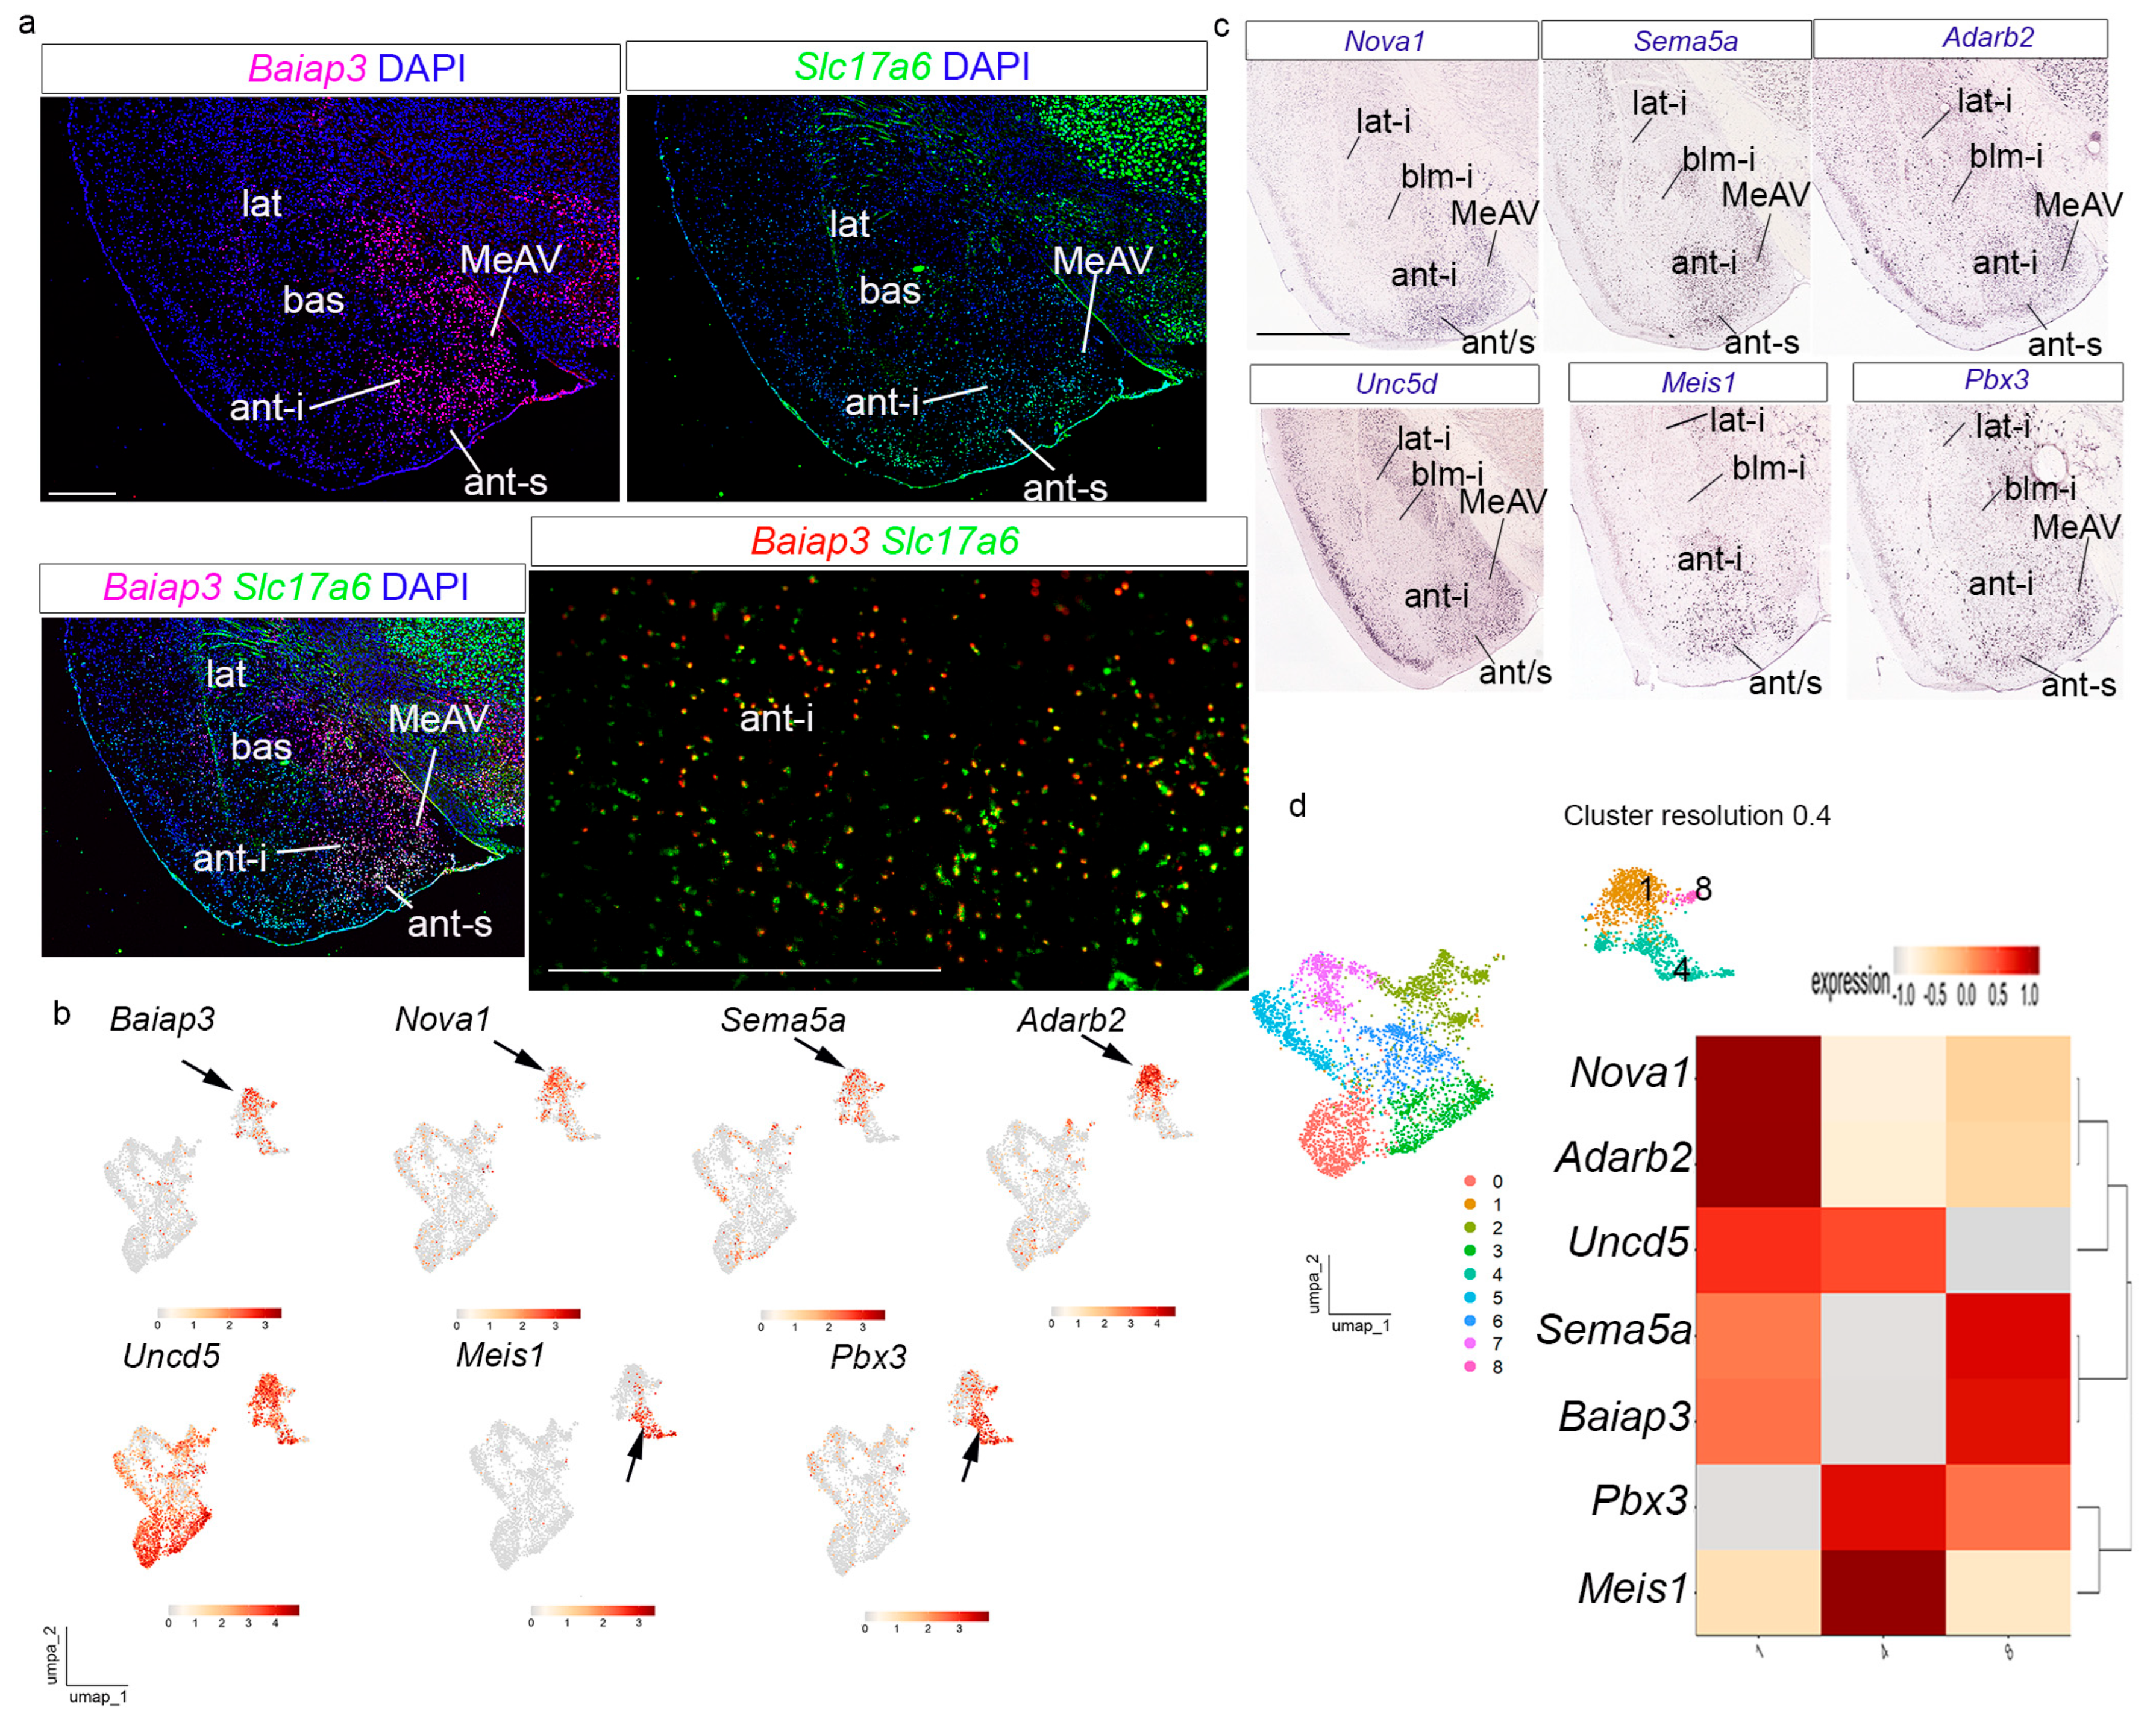
Figure 4a; note that Garcia-Calero and Puelles [
27] reported a possible embryonic tangential migration of
Lhx9 cells from the
anterior radial unit into the MeAV). The UMAP plot indicates a partly dispersed distribution of
Baiap3-positive cells within the
anterior radial cluster, indicating some molecular heterogeneity, perhaps due to the mixture of cells from different strata of the same radial unit (black arrow in
Figure 4b).
Nova1,
Sema5a,
Adarb2, and
Unc5d genes are expressed similarly to
Baiap3, with a partly heterogeneous distribution in the
anterior radial domain and MeAV (
Figure 4c; in situ hybridization from the AMBA). The corresponding UMAP plots for these genes showed a slightly less heterogeneous distribution, except for
Unc5d (black arrows in
Figure 4b).
Meis1 and
Pbx3 transcripts were localized mainly in the superficial stratum of the
anterior radial domain and neighboring ventro-medial amygdala (ant-s; MeAV;
Figure 4c; in situ hybridization from the AMBA); these transcripts, concentrated on superficial cells, were strongly represented in a particular heterogeneous strand of the corresponding UMAP plots (black arrows in
Figure 4b).
This combination of gene expression patterns and UMAP studies indicated that the
anterior radial domain (namely its intermediate and superficial strata) precisely corresponds anatomically to cluster 1. The expression of these genes indicates an inner molecular regionalization within this cluster, with a particular
Meis1 and
Pbx3-expressing cell population located in the superficial stratum of the
anterior domain. This regionalization was also observed at high cluster resolution (see, for example, the UMAP plot at resolution 0.4 and the gene distribution among the corresponding three clusters in
Figure 4d). In addition, these results indicate that the snRNAseq technique was able to neatly distinguish at transcriptomic level the complete
anterior radial domain—singularly devoid of a periventricular stratum—and its potentially migrated cells in the ventral medial amygdala (MeAV), showing marked molecular differences with the other three radial domains, as previously postulated by us [
22,
26,
27].
3.4. The Posterior Radial Domain
At resolution 0.15, the
Slc17a7-APall cluster results subdivided into three main clusters (0, 2, and 3) expressing differentially a number of amygdalar gene markers (
Figure 3e,f). Cluster 0 showed high expression of
Dach1,
Pde11a,
Adcy8,
Car12,
Reln,
Zbtb20,
Vgll3,
Cdh13, and
Rorb. The combinatorial expression of these genes identified at cluster resolution 0.15 indicates that cluster 0 corresponds to the
posterior radial domain (
Figure 5) [
22]. The periventricular stratum of this radial domain (post-p) corresponds to the amygdalo-hippocampal area (AHi) [
21], while the intermediate and superficial strata (post-i, post-s) jointly compose the posteromedial cortical nucleus (PMCo) [
21]. In addition, Garcia-Calero et al. [
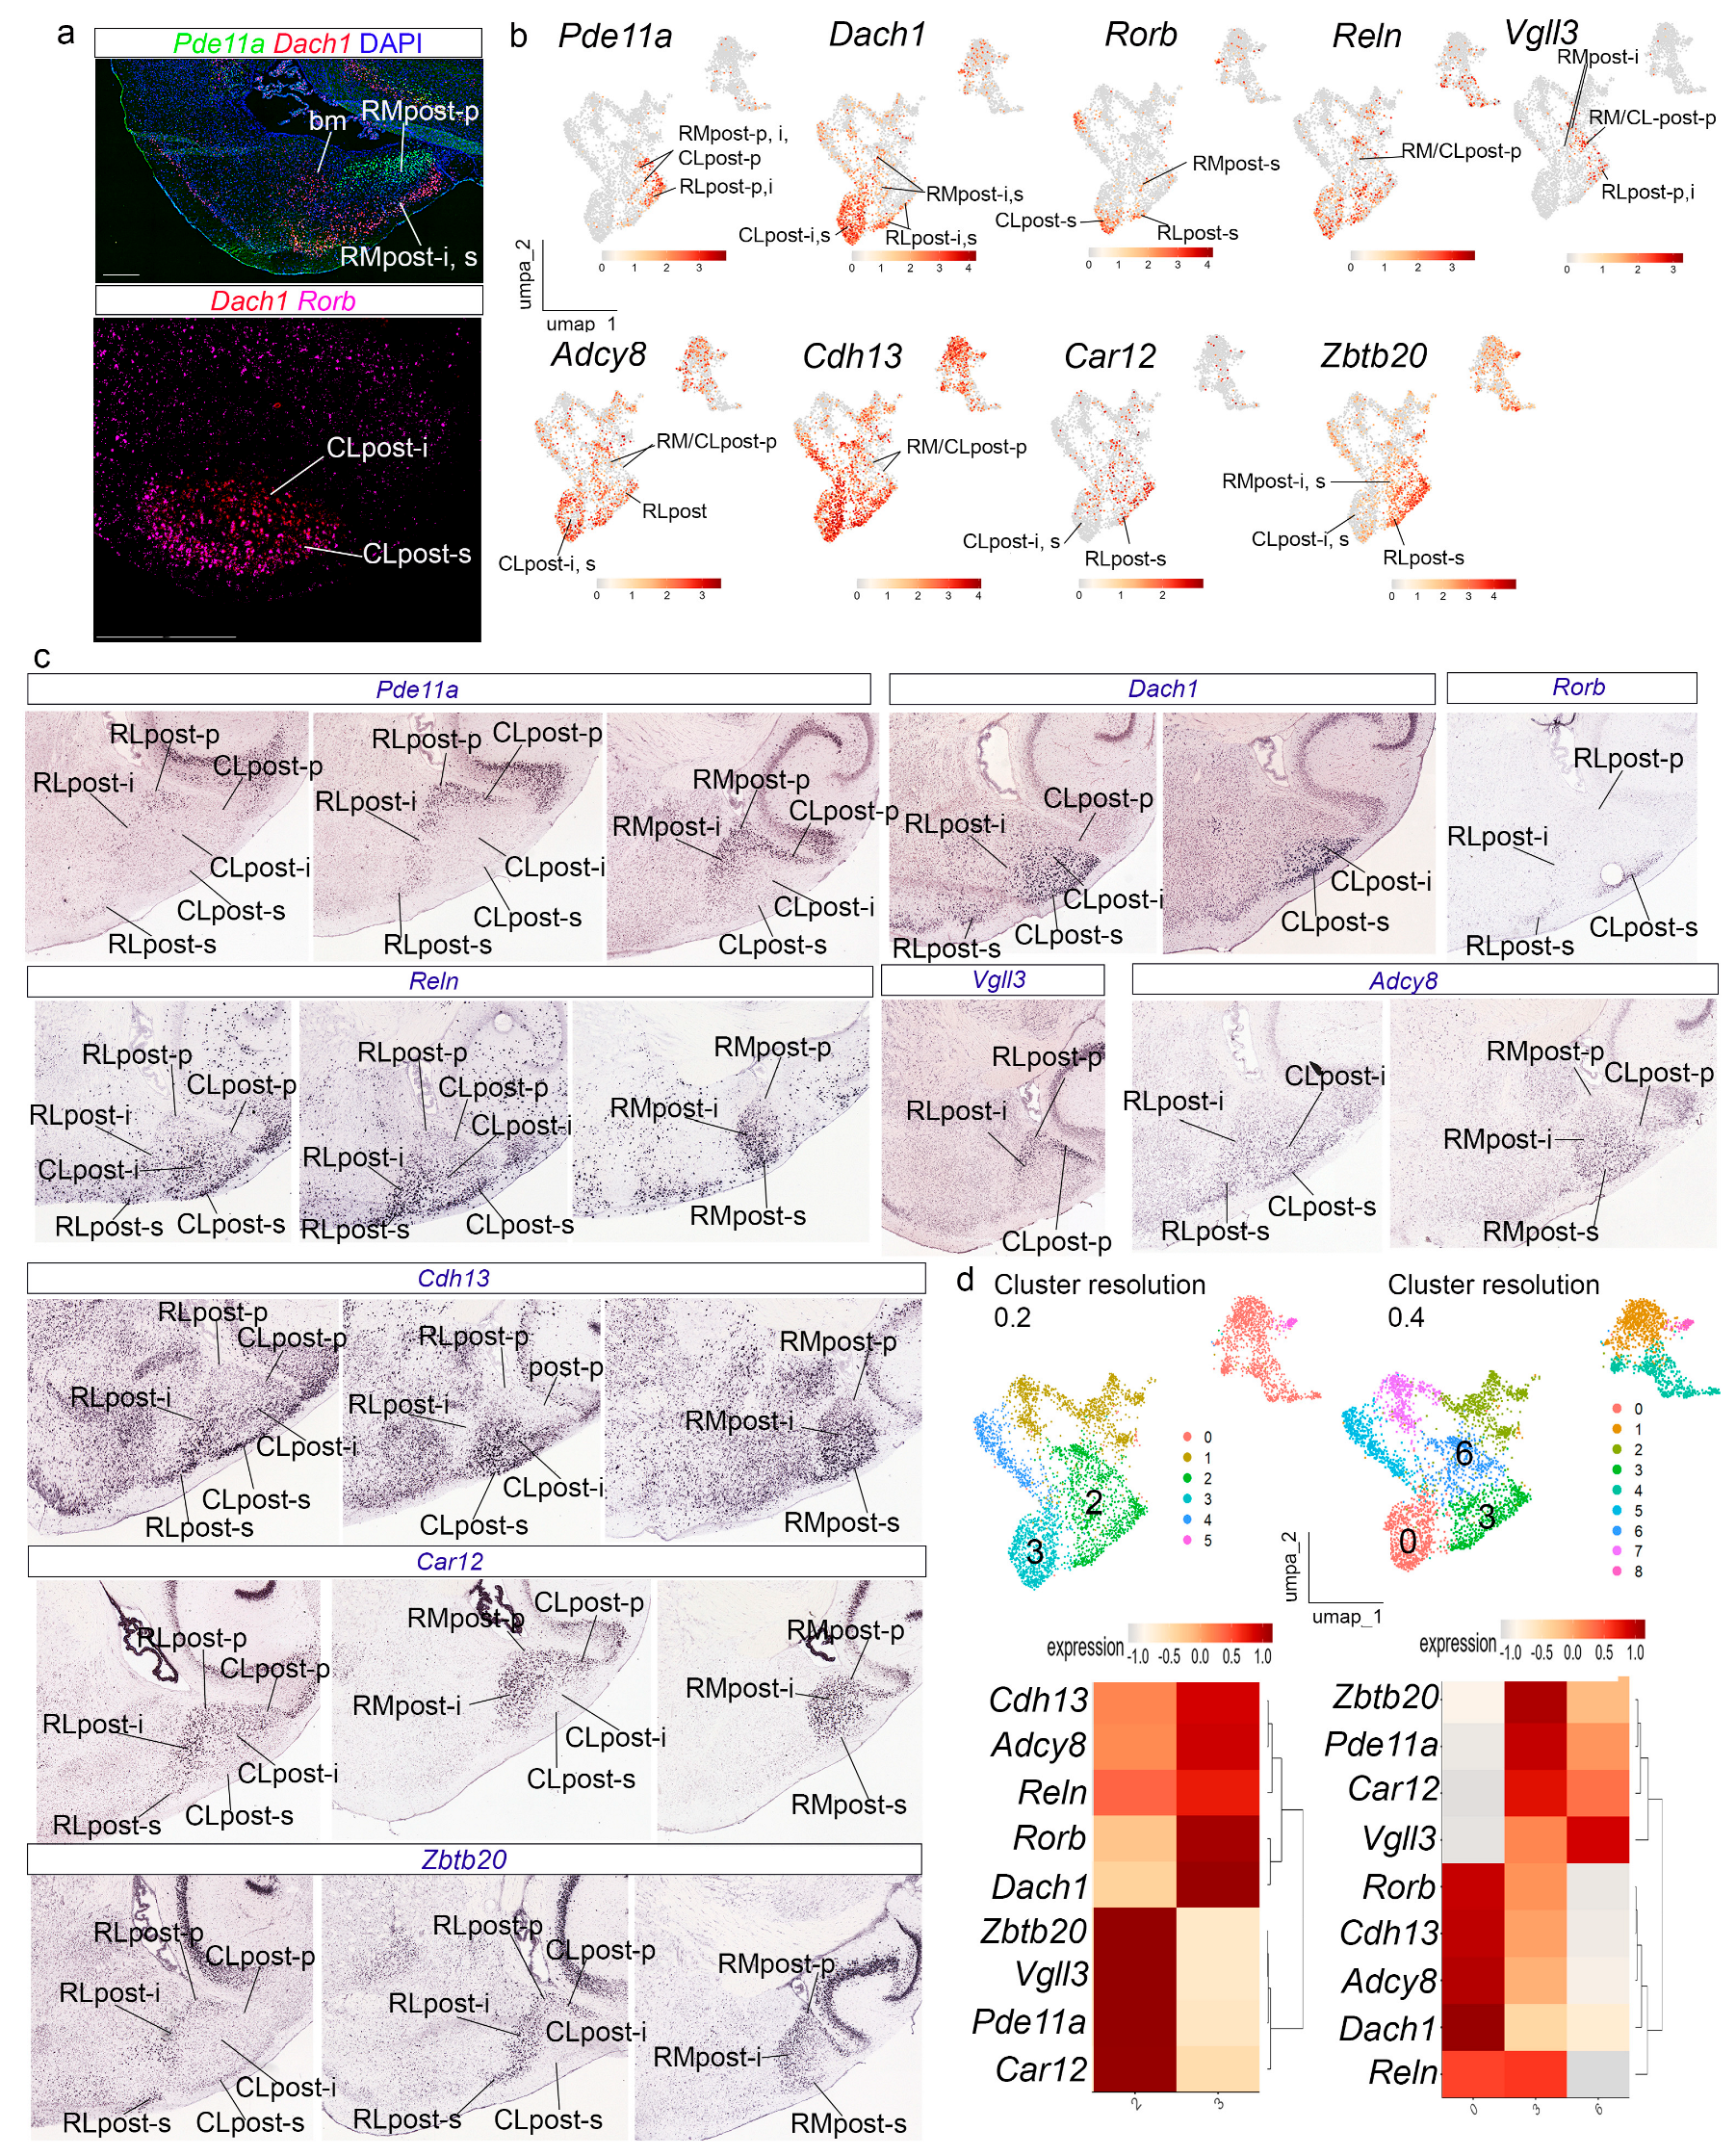
22] described three radial subdomains in this region: rostrolateral (RLpost), rostromedial (RMpost), and caudolateral (CLpost), which we tried to distinguish in our material.
Pde11a,
Dach1, and
Rorb showed differential expression patterns in our in situ preparations, UMAP plots, and AMBA material, with abundant
Pde11a transcripts in the whole RLpost, the periventricular stratum of the rest of the
posterior radial domain, and the intermediate stratum in RMpost (RLpost-p, i, s; RMpost-p, i; CLpost-p;
Figure 5a–c).
Dach1 labelled the intermediate and superficial strata in the
posterior radial domain (RLpost-i,s; RMpost-i,s; CLpost-i,s), while
Rorb transcripts were detected selectively in the corticoid plate or superficial stratum of the
posterior domain, with a few transcripts in the intermediate stratum of the RLpost (RLpost-i,s; RMpost-s; CLpost-s;
Figure 5a–c). UMAP plots for these three genes likewise showed differential expression patterns (
Figure 5b).
Reln displayed a heterogeneous distribution of its transcripts in the
posterior radial domain, labeling its periventricular (low expression), intermediate, and superficial strata (RLpost-p,i,s; RMpost-p,i,s; CLpost-p,i,s; low expression in RM/CLpost-p in UMAP plot in
Figure 5b; in situ hybridization material from the AMBA in
Figure 5c).
Vgll3 showed expression in the periventricular stratum of the
posterior radial domain, and the intermediate stratum of RLpost and RMpost (RLpost-p, i; RMpost-p,i, CLpost-p; UMAP plot in
Figure 5b; in situ hybridization material from the AMBA in
Figure 5c).
Adcy8 and
Cdh13 transcripts also appeared in a heterogeneous pattern, with higher expression in the intermediate and superficial layers, and low expression in the periventricular stratum (RLpost-p,i,s; RMpost-p,i,s; CLpost-p,i,s; UMAP plots in
Figure 5b; in situ hybridization material from the AMBA in
Figure 5c);
Car12 and
Zbtb20 transcripts in the
posterior radial domain, were represented by low expression in the superficial and intermediate strata of the CLpost (RLpost-p,i,s, RMpost-p,i,s; CLpost-i,s; UMAP plots in
Figure 5b; in situ hybridization material from the AMBA in
Figure 5c).
Increasing cluster resolution to 0.2 showed a partition of cluster 0 into two clusters, which represent, on one hand, the intermediate and superficial strata of the caudolateral subdomain and, on the other, the rest of the
posterior radial domain (clusters 3 and 2, respectively;
Figure 5d). Higher resolution 0.4 showed a certain degree of clustering by strata and by radial subdomains (
Figure 5d).
3.5. The Lateral and Basal Radial Domains
We analyzed cluster 3 at resolution 0.15 (
Figure 3e). Genes with high expression in this domain were:
Cux2,
Rorb,
Tox,
Hgf,
Cyp26b1,
Lypd1,
Ddit4l, and
Satb1 (
Figure 3f). Other genes also expressed in this cluster were
Neurod6,
Grm8,
Man1a,
Dkk3,
Npsr1, and
Otof. The expression of these genes indicated that cluster 3, at resolution 0.15, corresponds to the
lateral radial domain (
Figure 6,
Figures S6 and S7).
Cux2 and
Rorb were analyzed together with markers of the
basal radial domain (
Rspo2,
Sema3e,
Ntng2) to differentiate the
lateral and
basal radial domains (
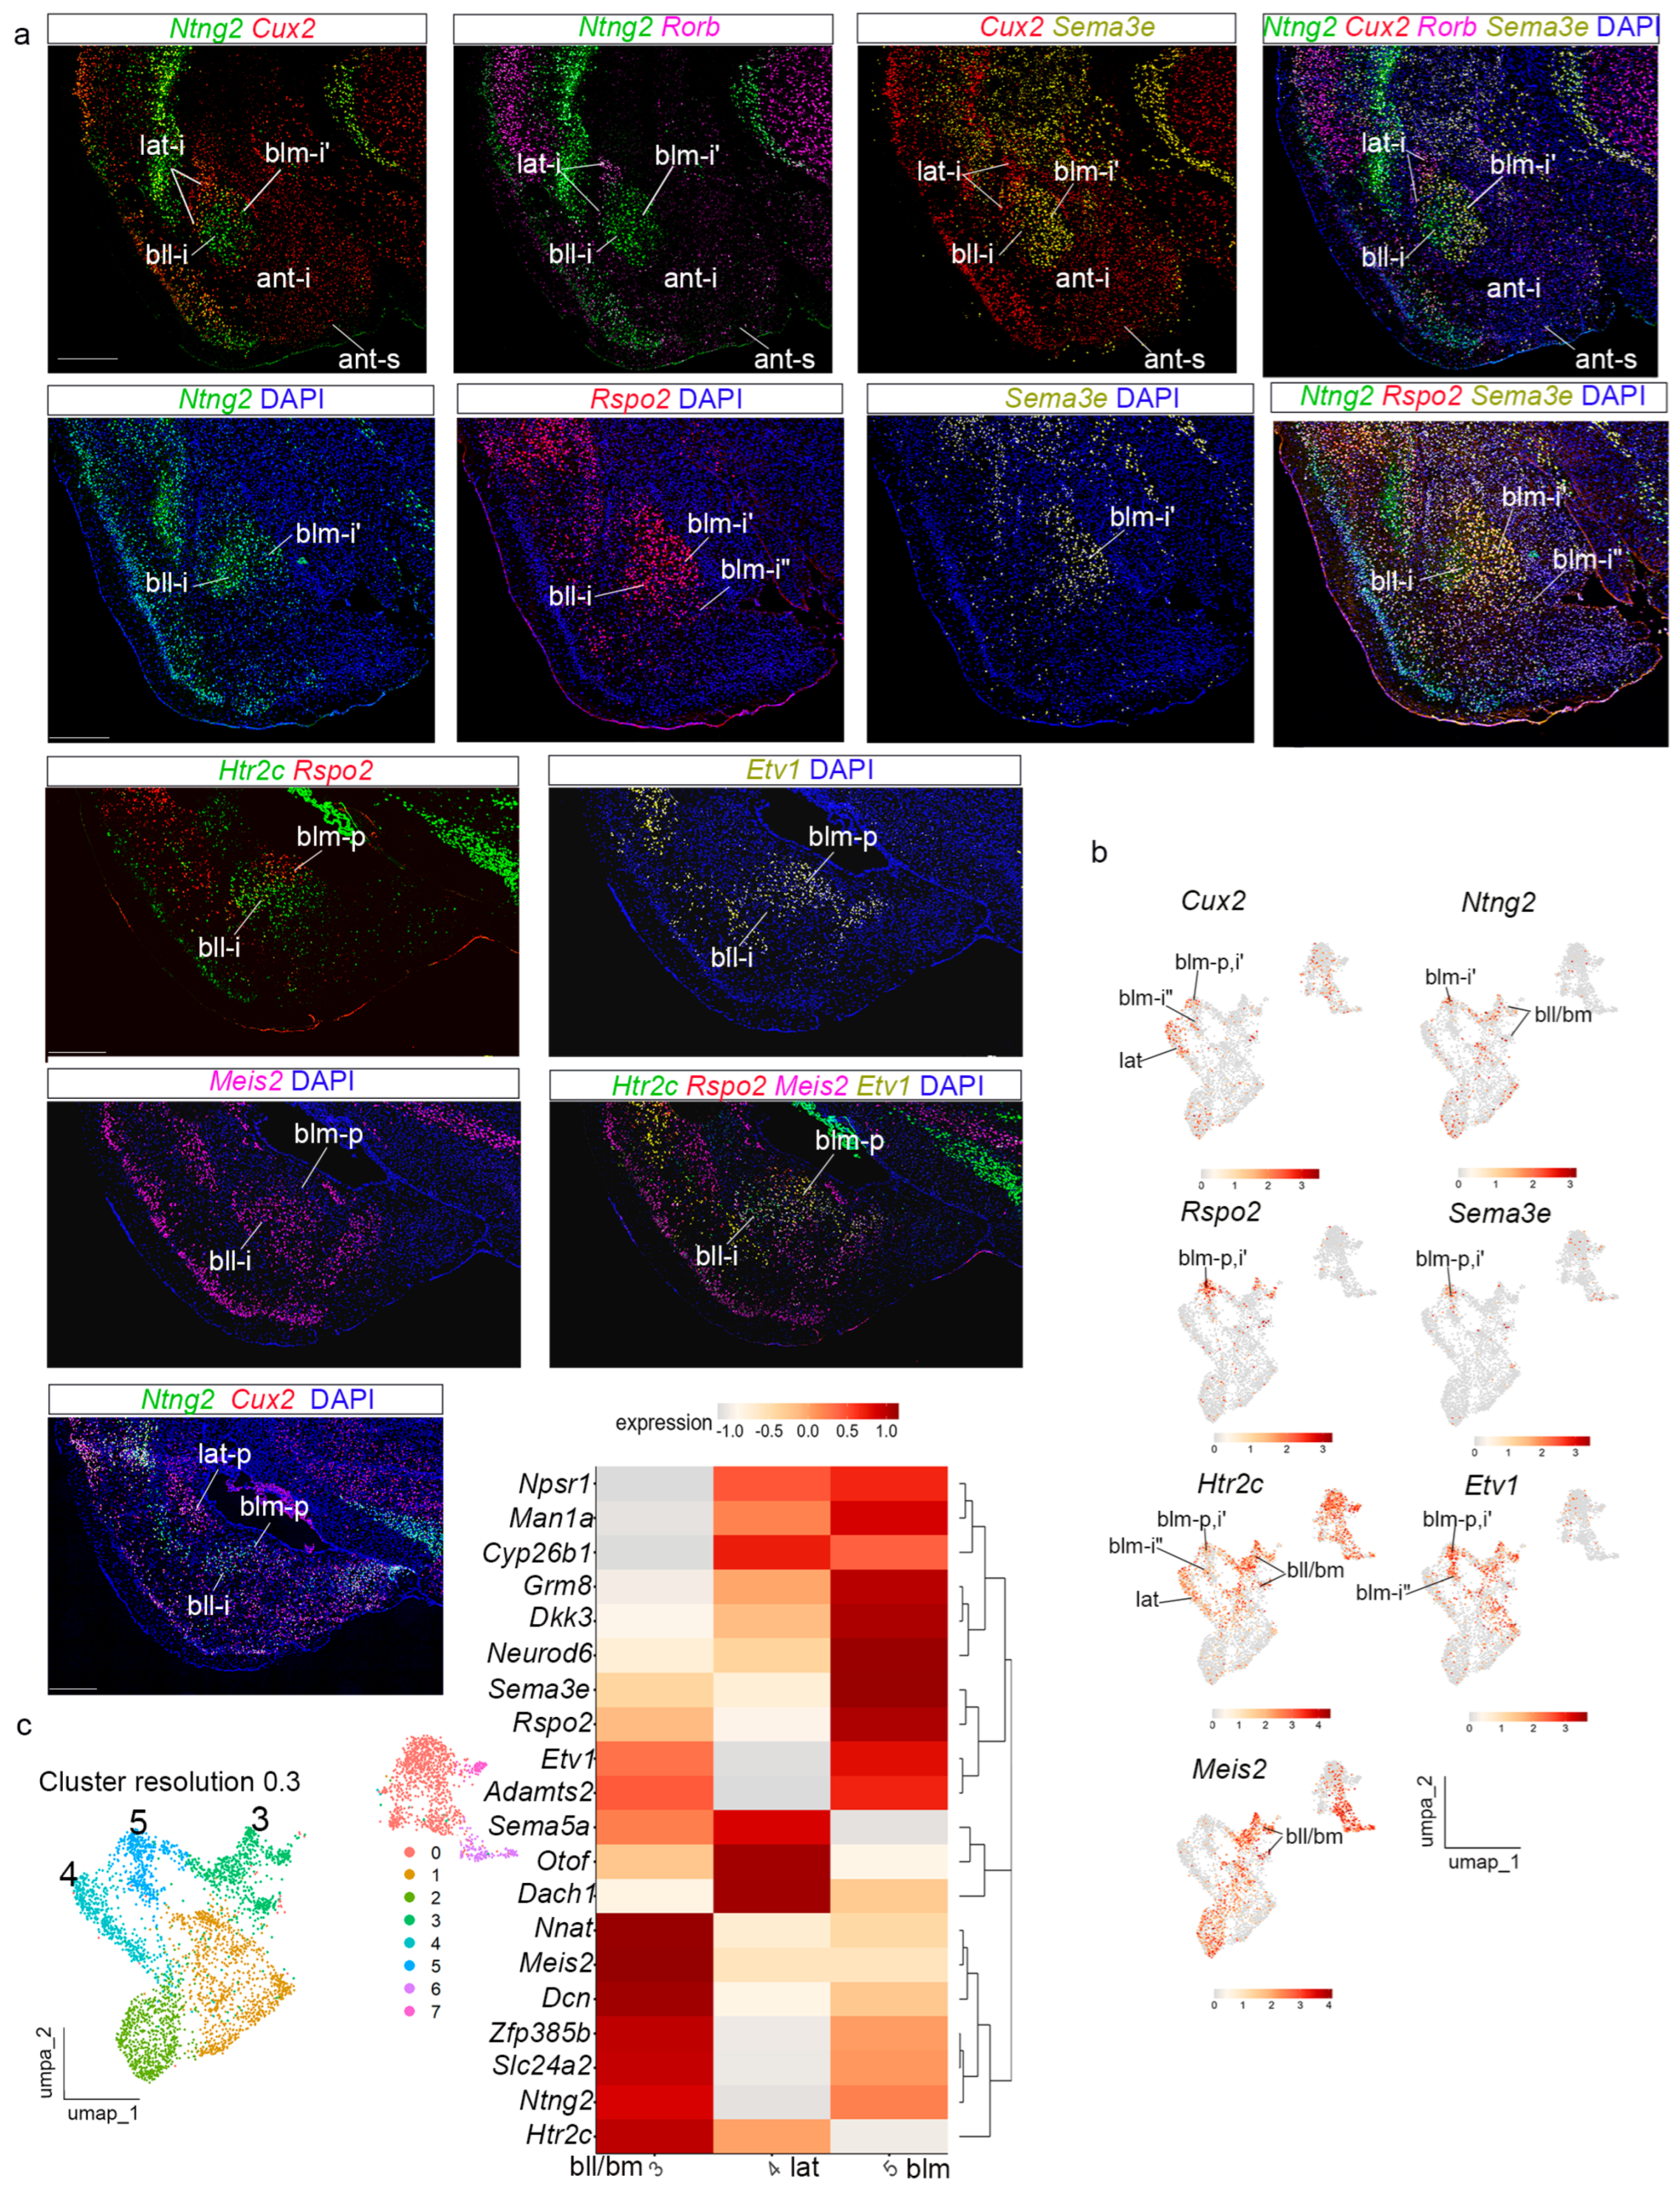
Figure 6a).
Cux2 and
Rorb labelled the intermediate and periventricular strata of the
lateral radial domain (lat-i; lat-p;
Figure 6a). UMAP plots for
Cux2 showed more heterogeneous distribution of positive nuclei than
Rorb UMAP (
Figure 5b and
Figure 6b). Other genes such as
Tox,
Hgf,
Satb1,
Lypd1,
Ddit4l, and
Cyp26b1 showed similar expression patterns throughout the radial domain;
Otof was expressed mainly in the periventricular stratum (see in situ hybridization material from AMBA material and UMAP plots;
Figures S6 and S7). The superficial stratum of the
lateral radial domain (lat-s), a subpial corticoid portion classically identified as ‘cortex-amygdala transition area’ (CxA), was not specifically detected in our material, possibly due to molecular similarity with the piriform cortex.
Next, we analyzed cluster 2 at resolution 0.15 (
Figure 3e,f). Genes strongly expressed in this domain included
Sema3e,
Rspo2,
Ntng2,
Etv1,
Adamts2,
Slc24a2,
Nnat,
Dcn,
Neurod6,
Man1a,
Dkk3,
Zfp385b, and
Grm8. In addition, we checked the expression of
Meis2,
Htrc2, and
Npsr1, also expressed in this cluster. The transcripts of these genes indicated that cluster 2 represents the
basal radial domain of Garcia-Calero et al. [
22], which was subdivided into
basolateral and
basomedial radial subdomains (bl and bm). Present results support these subdivisions and further suggest a partition of bl into lateral and medial components (bll, blm). We distinguish now an internal subdivision in the intermediate stratum of blm, namely deep and superficial subregions (blm-i’; blm-i”).
Ntng2 and
Man1a were expressed in the intermediate and periventricular strata of the whole basolateral subdomain (bll + blm;
Figure 6a; see also in situ hybridization image from the AMBA in S7A; UMAP plots for these genes in
Figure 6b and
Figure S7b). In contrast,
Rspo2 transcripts mainly marked the medial subdivision of the intermediate and periventricular basolateral strata (blm-i’, blm-p), which is also selectively labelled by
Sema3e,
Adamts2, and
Npsr1 (
Figure 6a and
Figure S7a; see UMAP plots in
Figure 6b and
Figure S7b)
. Rspo2 transcripts appeared in the superficial blm-i (blm-i”;
Figure 6a).
Neurod6 and
Dkk3 labelled selectively this superficial stratum of blm (blm-i”;
Figure S7a; See UMAP plots in
Figure S7b). In contrast,
Meis2 labelled differentially the intermediate and periventricular strata of the lateral subdivision in the basolateral subdomain (bll-i;
Figure 6a; see UMAP plots in
Figure 6b).
Htr2c showed high expression in the whole bll subdomain (expression pattern and UMAP;
Figure 6a,b).
Etv1 appeared expressed in the whole intermediate stratum of the basolateral division but showed more numerous transcripts in its medial subdomain (blm-p;
Figure 6a and UMAP plot in
Figure 6b).
Nnat and
Dcn labelled the basomedial subdivision of the basal radial domain (bm), in addition to other basal structures (
Figure S7a and UMAP in
Figure S7b). Other genes, such as
Slc24a2,
Zfp385b, and
Grm8, showed more heterogeneous expression in the
basal radial domain (
Figure S7a; UMAP plots in
Figure S7b).
Cyp26b1 showed low amygdalar expression in our snRNAseq experiment (
Figure S7a and UMAP plot in
Figure S7b). At a higher cluster resolution of 0.3, the
basal domain appears subdivided into two clusters (
Figure 6c). The heatmap of these genes indicated that the basal domain is subdivided mainly into the described bll + bm and blm radial areas. The bm division of the basal radial unit was not detected specifically among the different clusters obtained, though we clearly can distinguish this partition histologically in our preparations (bm;
Figure 6a and
Figure S7a). Other negative data refer to the fact that the subpial corticoid plates corresponding to the basal unit (PLCo and caudal CxA) were not specifically detected, possibly again due to molecular similarity with the piriform cortex.
3.6. Integration with Another Mouse Pallial Amygdalar Dataset Corroborates Our Transcriptomic Analysis in the Pallial Amygdala
To check the robustness of our present analysis, we integrated our adult amygdalar transcriptomic data with a recently published mouse amygdalar dataset of similar facture [
14]. Before integration, we processed independently the results from these authors. We subsetted the excitatory neurons in the four samples of the published dataset that contain the whole amygdala (two males, two females; “sample” and “cell type” in the metadata). We obtained 3380 high-quality single nuclei in these samples, and male and female nuclei were well mixed (metrics in
Figure S8a,b). At low cluster resolution (0.05), we again detected the existence of two main clusters, one enriched in
Slc17a6 (cluster 0), and the other enriched in
Slc17a7 (cluster 1), corroborating our own results of two such main clusters in the pallial amygdala (
Figure S8c,d). Subclustering cluster 1 (named
Slc17a7-APall one) and carefully selecting the subclustering resolution criteria indicated that at subcluster resolution 0.12, cluster 1 subdivides into three subclusters: 1_0, 1_1, and 1_2 (
Figure S8e), while cluster 0 remains unitary. Analysis of radial domain markers in these two clusters and the three subclusters of cluster 1 (
Figure S8f) indicated that cluster 0 represents the
anterior radial domain (markers:
Baiap3,
Nova1,
Sema5a,
Adarb2,
Unc5d,
Meis1, and
Pbx3), subcluster 1_0 corresponds to the
basal radial domain (markers:
Sema3e,
Rspo2,
Ntng2,
Etv1,
Adamts2,
Slc24a2,
Nnat,
Dcn,
Neurod6,
Man1a,
Dkk3,
Zfp385b,
Grm8,
Meis2,
Htrc2, and
Npsr1), subcluster 1_1 corresponds to the
lateral radial domain (markers
Cux2,
Rorb,
Tox,
Hgf,
Lypd1,
Dditl4, and
Cyp26b1), and subcluster 1_3 represents the
posterior radial domain (markers:
Dach1,
Pde11a,
Adcy8,
Car12,
Reln,
Zbtb20,
Vgll3,
Cdh13, and
Rorb;
Figure S8f).
Next, we integrated our adult sample with this processed dataset from Yu et al. [
14], testing different integrative methods (
Figure S9a–c), and chose the canonical anchor-based correlation-analysis algorithm (CCA), which produced well-mixed sample populations (
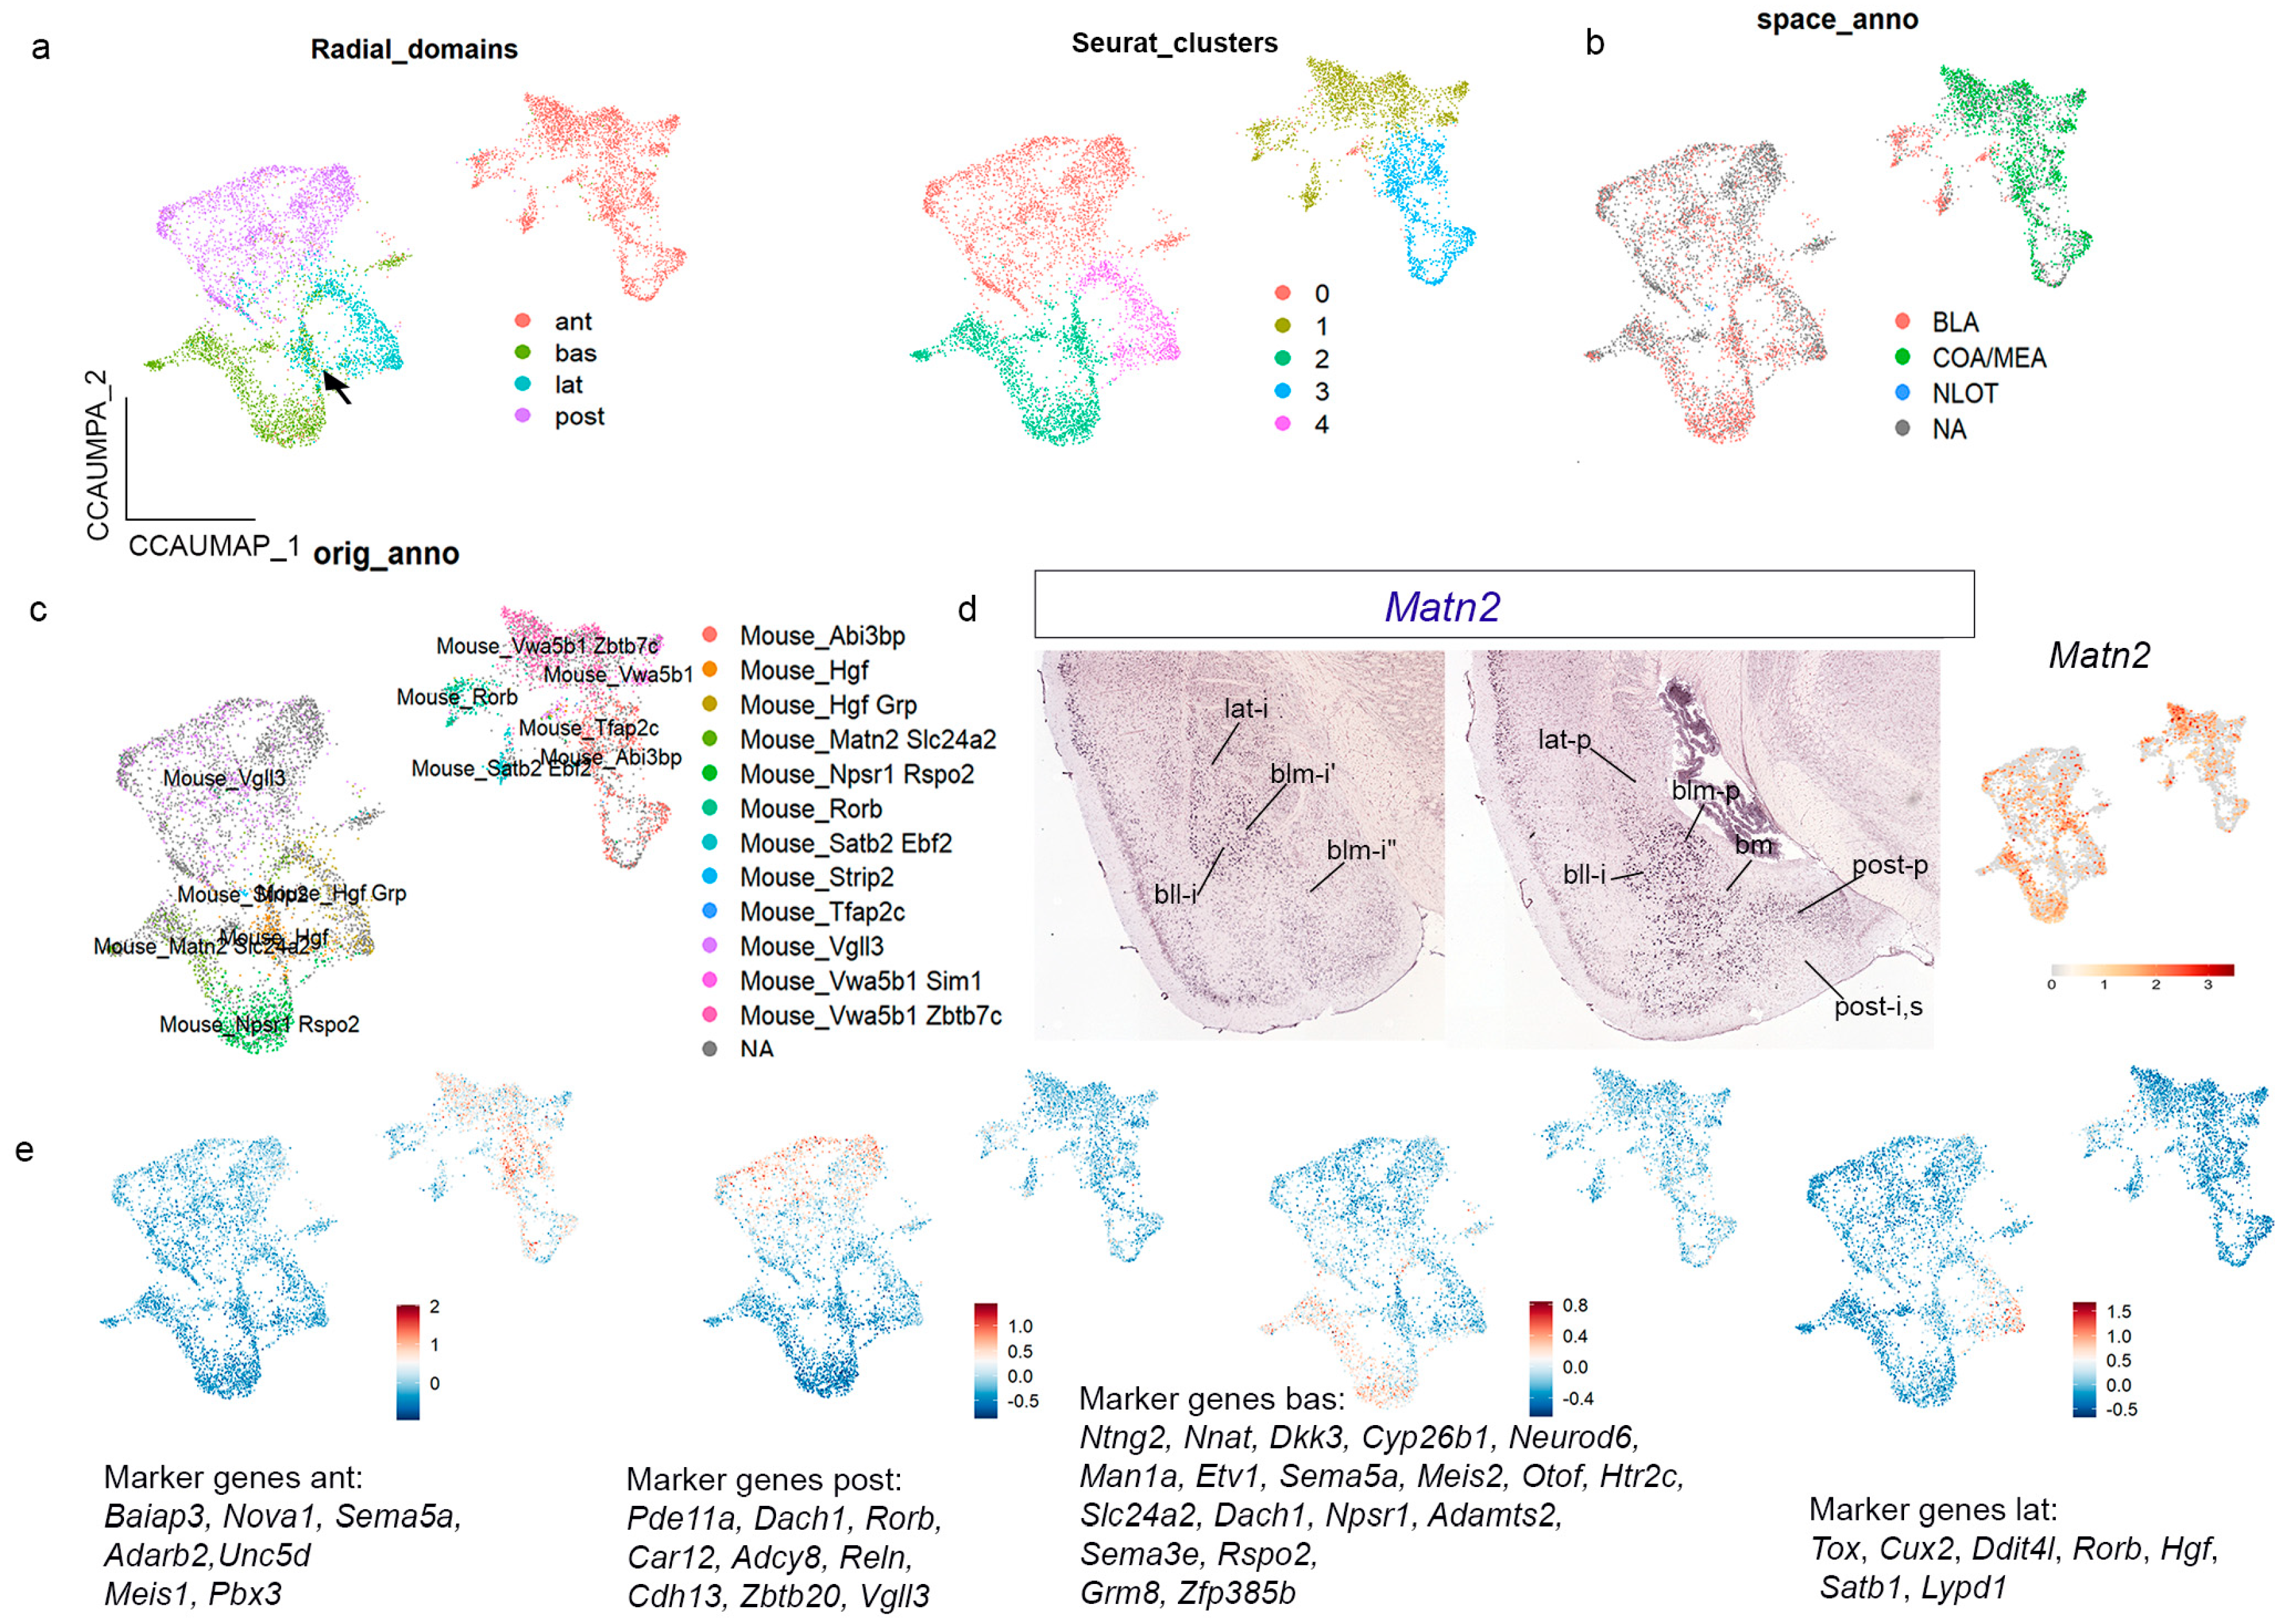
Figure S9c). We observed that in our integrated object, the cell nuclei from each of the four radial domains co-clustered together separately, except for a group of nuclei in between the lateral and basal domains (black arrow in
Figure 7a). At cluster resolution 0.1, we detected five clusters that largely coincide with the aforementioned amygdalar radial domains, except that the
anterior radial domain appears subdivided into two clusters in the integrated object (
Figure 7a).
We analyzed the annotation for amygdalar cell areas in the Yu et al. [
14] dataset in our integrated object (
Figure 7b). It was observed that the
anterior radial domain of our radial model was described in Yu et al. [
14] as ACo + MeA. We agree that ACo (ant-s) and glutamatergic cells within the medial amygdala are included in our cluster for the
anterior radial domain, but we also add the corresponding ant-i stratum, classically known as BMA. In addition, our clusters for the
lateral,
basal, and
posterior radial domains were jointly identified as ‘the BLA area’ in the Yu et al. [
14] dataset. Our radial model predicts a larger number of subdivisions in the amygdala, which is supported by the integrated transcriptomic analysis.
Next, we studied the cell types annotated by Yu et al. [
14] in relation to gene expression in the integrated object (
Figure 7c). In the
anterior radial cluster, Yu et al. [
14] annotated six cell types (
Vwa5b1/Zbtb7c;
Vwa5b1/Sim1;
Rorb;
Tfap2c;
Abi3bp; and
Satb2/Ebf2). We checked the expression of these genes in the AMBA material:
Zbtb7c was clearly enriched in the
anterior radial domain, while
Vwa5b1,
Tfap2c,
Abi3bp, and
Ebf2 showed slight expression in this area.
Sim1 was studied previously in Garcia-Calero et al. [
25] and represents a hypothalamic cell population migrated tangentially to the amygdalar region.
Rorb and
Satb2 were analyzed in the present report. Yu et al. [
14] characterized the
posterior radial cluster as a single
Vgll3-positive cell population. The
lateral radial cluster also contained one distinct cell type (
Hgf). The
basal domain contained two cell populations (
Matn2/Slc24a2;
Npsr1/Rspo2). A
Hgf/Grp-positive cell population lay at the boundary between the
basal and
lateral domains.
Matn2 labels lat-s, bll-p,i,s, bm-p,i,s, and blm-i, and shows dispersed expression in the
posterior radial domain (post-p,i,s;
Figure 7d). Its UMAP confirmed these results and their correspondence with the amygdalar pallial model.
Vgll3,
Hgf,
Slc24a2,
Npsr1, and
Rspo2 were also analyzed by us, and the combined expression pattern was found useful for visualizing the amygdalar radial domains. Finally, we further validated these results by constructing UMAP plots for gene modules (list of genes for every radial domain; list of gene markers indicated in the figures;
Figure 7e).
