3.1. Lymphocytes Exposed to Chronic Hyperglycemia Exhibit Altered Ca2+ Signaling, Reduced SERCA Expression and Depleted ER Ca2+ Stores with ER Stress Activation
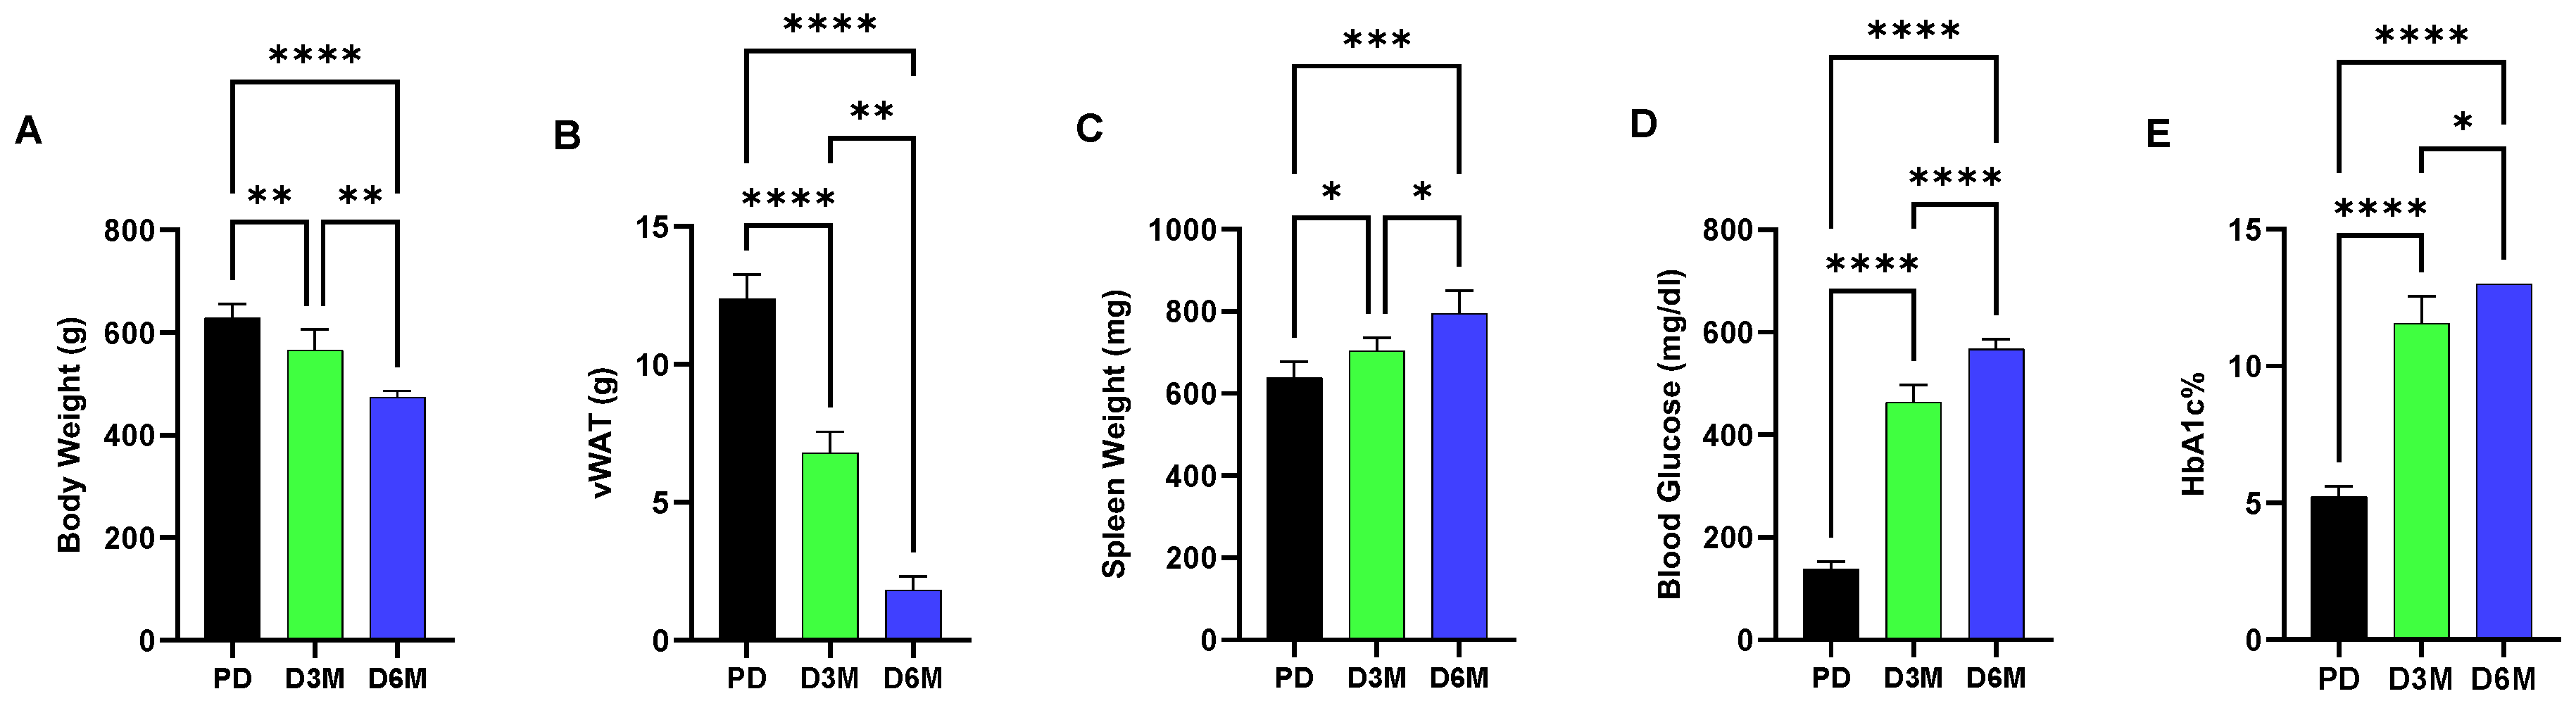
Figure 1 shows changes over a six-month interval in UCD-T2DM rats in blood glucose, hemoglobin A1c (HbA1c), body and adipose (visceral white adipose tissue, vWAT) weight and spleen weight. These metabolic parameters show the progression of diabetic pathogenesis in UCD-T2DM rats from the prediabetic (PD) state to elevated blood glucose and HbA1c levels at both the 3-month (D3M) and 6-month (D6M) time points. Accompanying the high blood glucose condition, we observed a significant progressive loss in body weight (10% reduction in D3M and 23% reduction in D6M) and adipose tissue, while in contrast we observed a modest increase in spleen weight (7% increment in D3M and 20% increment in D6M,
Figure 1). Increased spleen weight is likely due to increased inflammatory conditions associated with diabetic progression.
In this study we were prompted to examine the hypothesis that lymphocytes isolated from animals experiencing chronic hyperglycemia would demonstrate, due to profoundly disrupted metabolism, altered Ca
2+ signaling parameters and ER homeostasis defects that likely underlie immunes system dysfunction in the diabetic state.
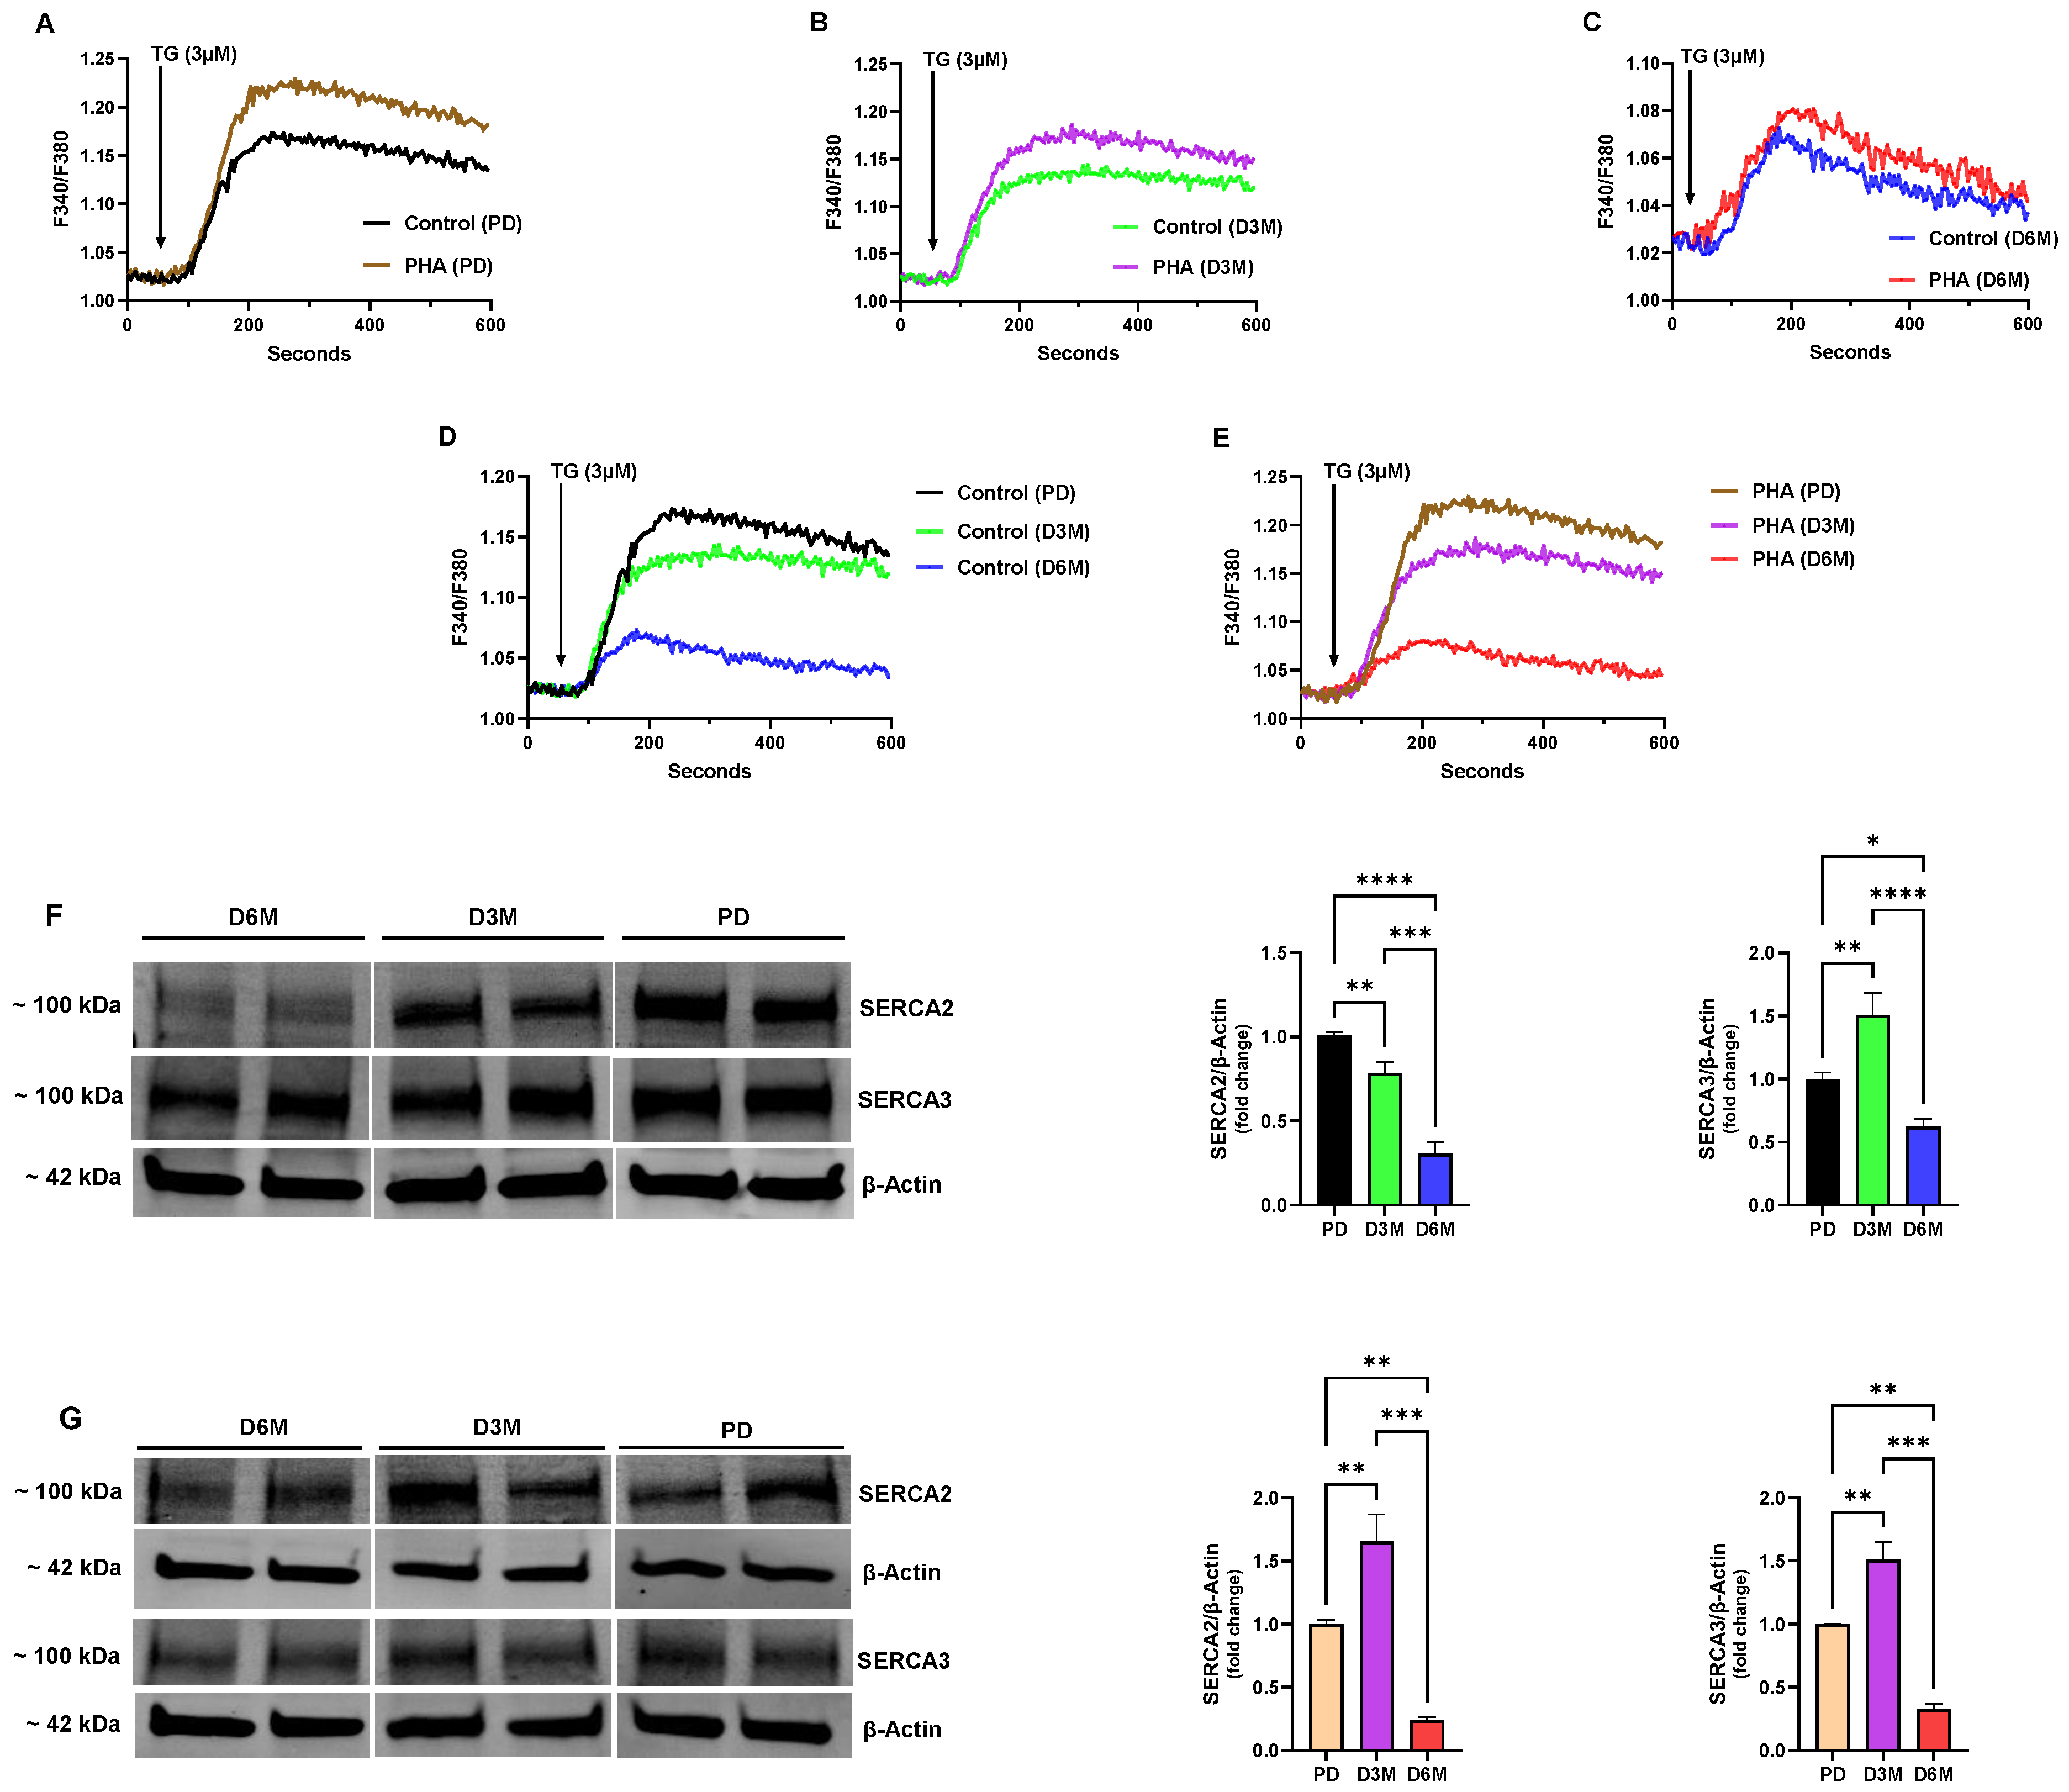
Figure 2 shows the changes in ER Ca
2+ stores from the pre-diabetic (PD) state to animals experiencing chronic high blood glucose for 3- and 6-month intervals (D3M and D6M). We used thapsigargin (TG, 3μM) to release internal Ca
2+ stores, employing a TG concentration that is expected to effectively block all SERCA pump isoforms and release the composite SERCA-regulated Ca
2+ pools [
22,
23]. For these experiments we used rat spleen lymphocytes in both the resting and activated (PHA treated) state. PHA is a well-known T cell mitogen via its action to crosslink and activate the T cell receptor (TCR), and thus enabled our approach to preferentially measure Ca
2+ responses in the activated T cell population [
24,
25]. We observed a significantly greater amplitude response in the PD UCD-T2DM lymphocytes stimulated with PHA treatment (10 µg/mL, 72 h) compared to untreated lymphocytes (ΔF 0.208 ± 0.006 PHA-treated vs. 0.152 ± 0.009 Control
p < 0.05,
n = 6–8,
Figure 2A), suggesting that activation of the T cells produced an expanded Ca
2+ store capacity in the global SERCA-regulated Ca
2+ pools. At the three-month stage (D3M), in rats experiencing significantly higher blood glucose levels (
Figure 1C), we found that the TG-induced Ca
2+ release response was substantially diminished (PD PHA-treated: ΔF 0.208 ± 0.006 vs. D3M PHA-treated: ΔF 0.160 ± 0.004,
p < 0.05,
n = 6–8,
Figure 2A vs.
Figure 2B); and, while the PHA-stimulated lymphocytes still produced a greater amplitude response than unstimulated lymphocytes, the augmentation of the Ca
2+ release response due to PHA-induced activation was smaller (22% decline) compared to lymphocytes isolated from PD animals (
Figure 2A vs.
Figure 2B). This effect was even more pronounced in lymphocyte Ca
2+ release responses in the D6M population, where we observed the severest abrogation (70% decline) of the TG-induced mobilization of ER Ca
2+ as a result of protracted elevated blood glucose (
Figure 2A vs.
Figure 2C). Intriguingly, at this stage of prolonged high glucose we observed only minimal increases in Ca
2+ signals in PHA-treated lymphocytes, suggesting that the long-term high glucose condition substantially alters the capacity of the lymphocytes to adequately load ER Ca
2+ stores.
Figure 2D,E show comparisons of the progressive loss in the TG releasable Ca
2+ pools in unstimulated (
Figure 2D) and PHA-stimulated (
Figure 2E) UCD-T2DM rat lymphocyte populations at the PD, D3M and D6M time intervals. As the figures reveal, the same pattern of declination in the Ca
2+ release response was observed in both stimulated and unstimulated lymphocyte populations, with the greatest perturbation in Ca
2+ stores occurring at the 6-month stage of hyperglycemic diabetes (Control: PD response ΔF 0.152 ± 0.009 vs. D6M response ΔF 0.049 ± 0.005; PHA-treated: PD response ΔF 0.208 ± 0.006 vs. D6M response ΔF 0.060 ± 0.003,
p < 0.05,
n = 6–8,
Figure 2D,E). Thus, although PHA treatment did appear to increase the levels of ER Ca
2+ compared to unstimulated lymphocytes (
Figure 2A–C), the timing and approximate scale of ER Ca
2+ store deterioration was the same in both populations (
Figure 2D vs.
Figure 2E).
As mentioned above, a possible explanation for the substantial degradation in ER Ca
2+ store content in UCD-T2DM lymphocytes is impaired ER Ca
2+ loading due to SERCA dysfunction. Thus, we were motivated to investigate expression levels of the two major lymphocyte SERCA pump isoforms, SERCA 2b and SERCA 3 [
26,
27].
Figure 2F shows a representative Western blot image of SERCA 2b and SERCA 3 protein levels harvested from unstimulated or resting UCD-T2DM rat spleen lymphocytes along with the corresponding bar plots indicating gel band intensities. As the figure reveals, we observed a significant decline in expression of the SERCA 2b pump isoform at the D3M and D6M stage of diabetic hyperglycemia. And, consistent with our TG-induced Ca
2+ release experiments (
Figure 2D), we observed the greatest decline in SERCA 2b expression at the D6M stage which is likely to explain the extensive loss in ER Ca
2+ consequent to chronic hyperglycemia. Intriguingly, we did not observe the same pattern for SERCA 3 expression. Indeed,
Figure 2F shows that initially at the D3M stage of elevated blood glucose we actually observed an increase in expression levels of the SERCA 3 pump isoform. However, this augmented SERCA 3 expression effect is ultimately lost, since by the D6M stage UCD-T2DM lymphocyte SERCA 3 expression levels have significantly declined (
Figure 2F). These results suggest, as we have previously reported, that the SERCA 2b and SERCA 3 Ca
2+ pumps are linked to distinct regulatory functions in lymphocyte Ca
2+ signaling networks [
20,
21]. Indeed, the initial increase in SERCA 3 expression may reflect upregulation of this Ca
2+ transporter recruited to manage ER Ca
2+ stores in a hyperglycemic environment subjected to ER stress; however, with continued unmanageable elevated glucose this stress response is lost and SERCA 3 protein levels eventually wane. Clearly, however, at the D6M stage of chronic elevated blood glucose we observed the maximal degree of ER Ca
2+ store disruption, which corresponds to our observations that both SERCA 2b and SERCA 3 pump expression levels by this time interval have substantially declined.
We noted an interesting difference when we examined SERCA expression levels in lymphocytes stimulated with the T-cell mitogen PHA (
Figure 2G). In contrast to unstimulated lymphocytes, when we activated T cells with PHA exposure, we observed a significant increase in SERCA 2b protein levels at the D3M stage of hyperglycemia, suggesting that T cell activation was specifically driving increased SERCA 2b expression, given that no difference was observed in the SERCA 3 expression pattern in the unstimulated vs. PHA-stimulated lymphocyte population (
Figure 2F vs.
Figure 2G). However, although we observed an increase in SERCA 2b expression at the D3M stage, as previously noted (
Figure 2E), there was a loss in TG-releasable ER Ca
2+ from PHA-treated lymphocytes at this stage of chronic hyperglycemia. Thus, even though lymphocytes appear to be increasing SERCA 2b expression levels it may be that there are functional impairments in SERCA activity in elevated glucose conditions, as has been previously reported in other cell types [
14,
15]. These results further underscore the plausibility of SERCA pump dysfunction either due to altered expression levels or functional impairments as a key factor in lymphocyte Ca
2+ signaling defects associated with diabetic pathogenesis.
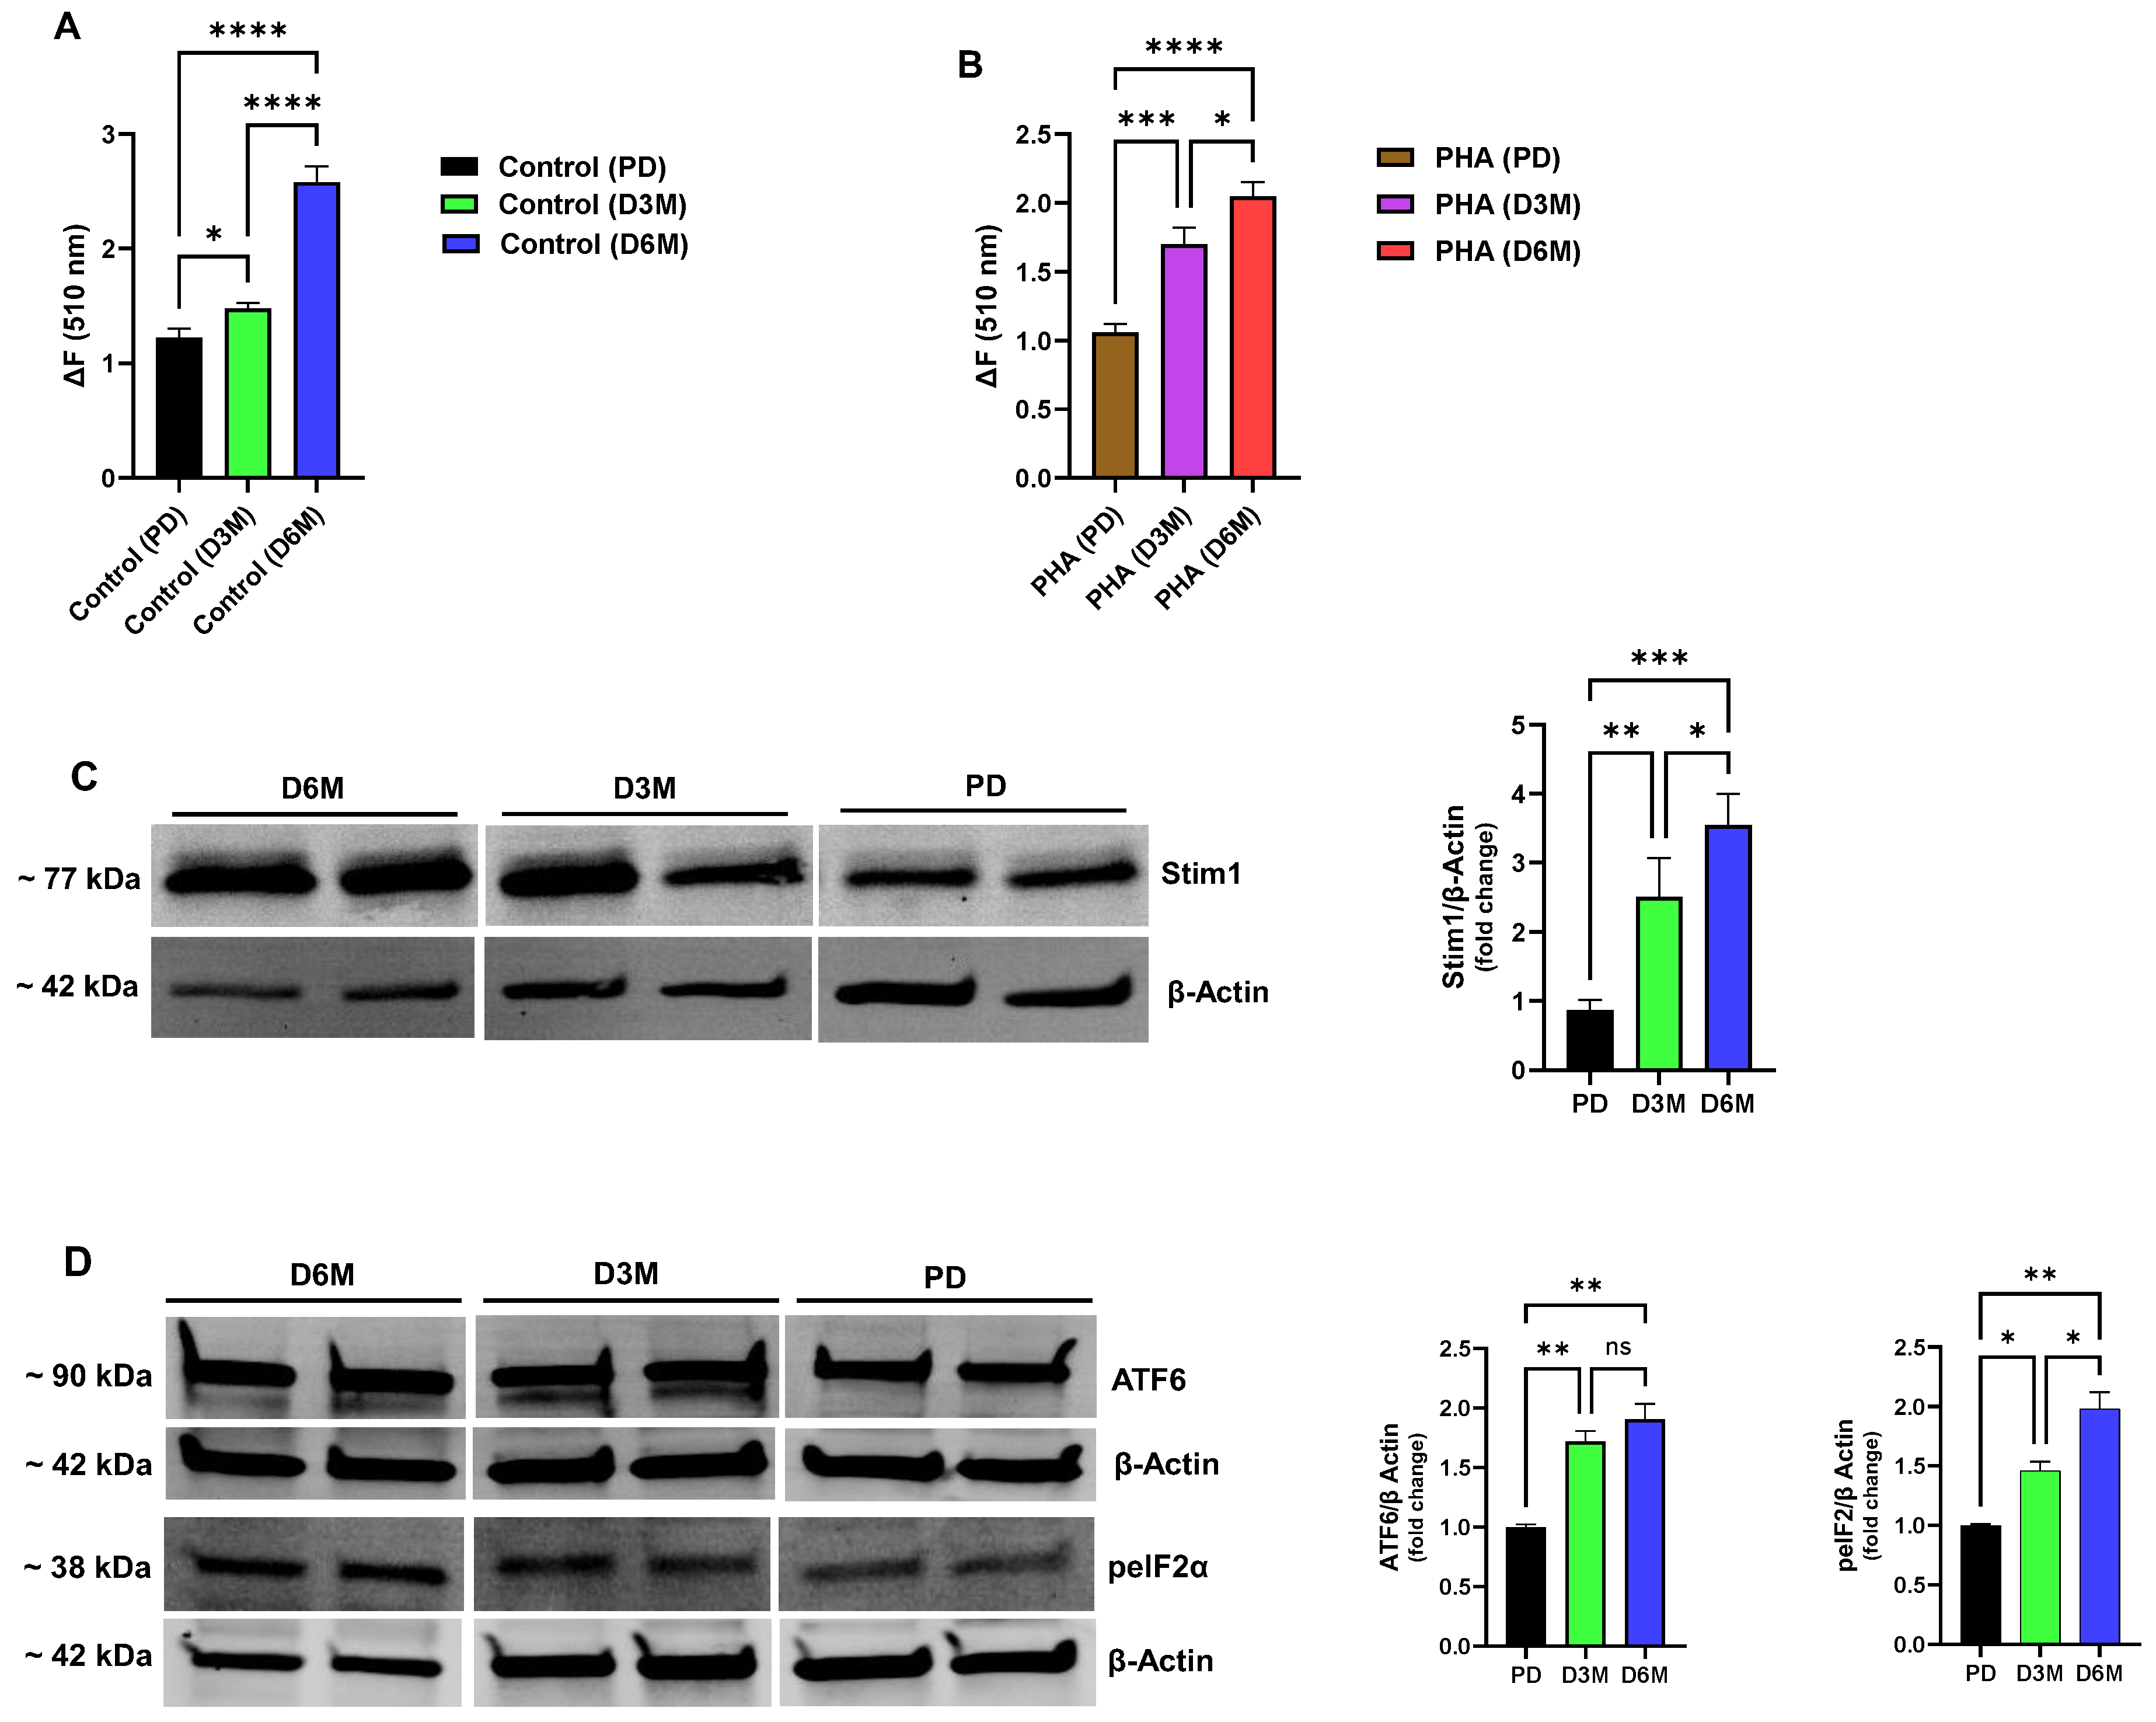
In addition to perturbations in ER Ca
2+ stores, we observed a significantly altered TG-induced Ca
2+ influx response in the UCD-T2DM rat lymphocyte population exposed to chronically elevated glucose levels (
Figure 3A,B). Similar to the Ca
2+ release responses, we observed the same general pattern of altered Ca
2+ influx activity in both unstimulated (
Figure 3A) and PHA-stimulated (
Figure 3B) lymphocytes, emphasizing that the disrupted Ca
2+ signaling landscape in the hyperglycemic condition manifests regardless of lymphocyte stimulation. These experiments revealed that with chronic hyperglycemia and progressive depletion of ER Ca
2+ stores we observed a correspondingly increased Ca
2+ influx response, with the greatest amplitude response occurring in the D6M lymphocyte population with the severest diminishment in Ca
2+ store levels (Control ΔF ratio: D6M/PD = 110%; PHA-stimulated ΔF ratio: D6M/PD = 93%,
n = 6–8,
p < 0.05
Figure 3A,B). Thus, these results suggest that a dysfunctional lymphocyte Ca
2+ signaling state may emerge in diabetes due to chronically depleted ER Ca
2+ stores with an associated hyperactivated coupling signal driving inappropriate Ca
2+ influx signals. Distortions in these key antigen-activated Ca
2+ signaling pathways are therefore likely to result in impairments of lymphocyte function with consequent immune system deficiencies observed in the diabetic condition. Given our observation that UCD-T2DM rat lymphocytes exhibit pronounced activation of Ca
2+ influx pathways at the 3- and 6-month hyperglycemic stage, we hypothesized that the Stim1 protein, as the major transducer of depleted ER Ca
2+ stores, would be elevated. Indeed, we did observe a significant increase in expression of Stim1 in D3M and D6M rat lymphocytes as shown in
Figure 3C (D3M: 2.5-fold increase; D6M: 3.5-fold increase). Thus, we suggest that an ER stress condition gradually develops in lymphocytes as chronic hyperglycemia progresses in part due to decreased SERCA expression/function with consequent rundown and depletion of critical Ca
2+ levels in ER stores. Cells will likely attempt to counter or control ER Ca
2+ loss by increasing expression of Stim1 to promote Orai1 Ca
2+ channel activation and Ca
2+ influx to replenish depleted stores.
In view of our experiments revealing severely depleted ER Ca
2+ stores and upregulation of Stim1 expression as UCD-T2DM lymphocytes progress to late-stage hyperglycemia, we explored the possibility that these signaling impairments may be associated with the development of an ER stress condition. We chose two commonly investigated markers of ER stress, testing for changes in expression levels of activating transcription factor 6 (ATF6) and the phosphorylated form of eukaryotic initiation factor 2α (p-eIF2α) as a key mediator of the ER stress condition via its actions as a global protein translation inhibitor [
28,
29]. As shown in
Figure 3D we did observe significant increases in the expression levels of ATF6 and p-eIF2α in lymphocytes experiencing chronic elevated blood glucose in the D3M and D6M phases (ATF6: D3M 1.7-fold increase, D6M 1.9-fold increase; p-eIF2α: D3M 1.4-fold increase, D6M 1.9-fold increase,
Figure 3D). We did note that expression of ATF6 appeared to saturate earlier in the D3M hyperglycemic stage as compared to p-eIF2α which rose to maximal levels of expression corresponding to the D6M stage in which we observed the greatest degradation in ER Ca
2+ levels. This temporal sequence of deployment of ER stress mediators may relate to their respective roles in ER stress transduction; ATF6 and PKR-like ER Kinase (PERK) are proximal ER resident sensors of ER stress such that their recruitment and activation occurs early in the pathway, whereas mediators like PERK-dependent p-eIF2α are downstream effectors which are likely to reach peak levels of activity later in the sequence [
28,
29,
30]. Thus, our findings suggest that immune system dysfunction in the chronic diabetic state may occur consequent to the pronounced alterations in ER Ca
2+ store management with aberrant Ca
2+ influx engagement and an ensuing corrupted ER organellar state with recruitment of ER stress pathways.
3.2. T Lymphocytes Subjected to Long-Term High Glucose Undergo Ca2+ Signaling Perturbations Characterized by Reduced SERCA 2b Expression, ER Stress Induction and Loss of Cell Viability
We next shifted our studies to the use of the well-characterized model human Jurkat T cell line to take advantage of the benefits of using a clonally homogenous T cell population, thereby enabling avoidance of potentially conflicting effects likely present in a heterogeneous mix of primary spleen lymphocytes. The use of the Jurkat clonal T cell population also permits a more unambiguous assessment of the earliest changes developing in corrupted Ca2+ signaling pathways exposed to high glucose perturbation, given that complex cell population heterogeneity in spleen cells may mask the initial small disruptions that precede the larger overt damage observable in late-stage hyperglycemia. We established, as noted below, clear parallels between Ca2+ signaling alterations observed in the UCD-T2DM rat lymphocyte population and our Jurkat T lymphocyte in vitro high-glucose configuration, which provides assurance for productive use of the Jurkat T lymphocyte in these studies.
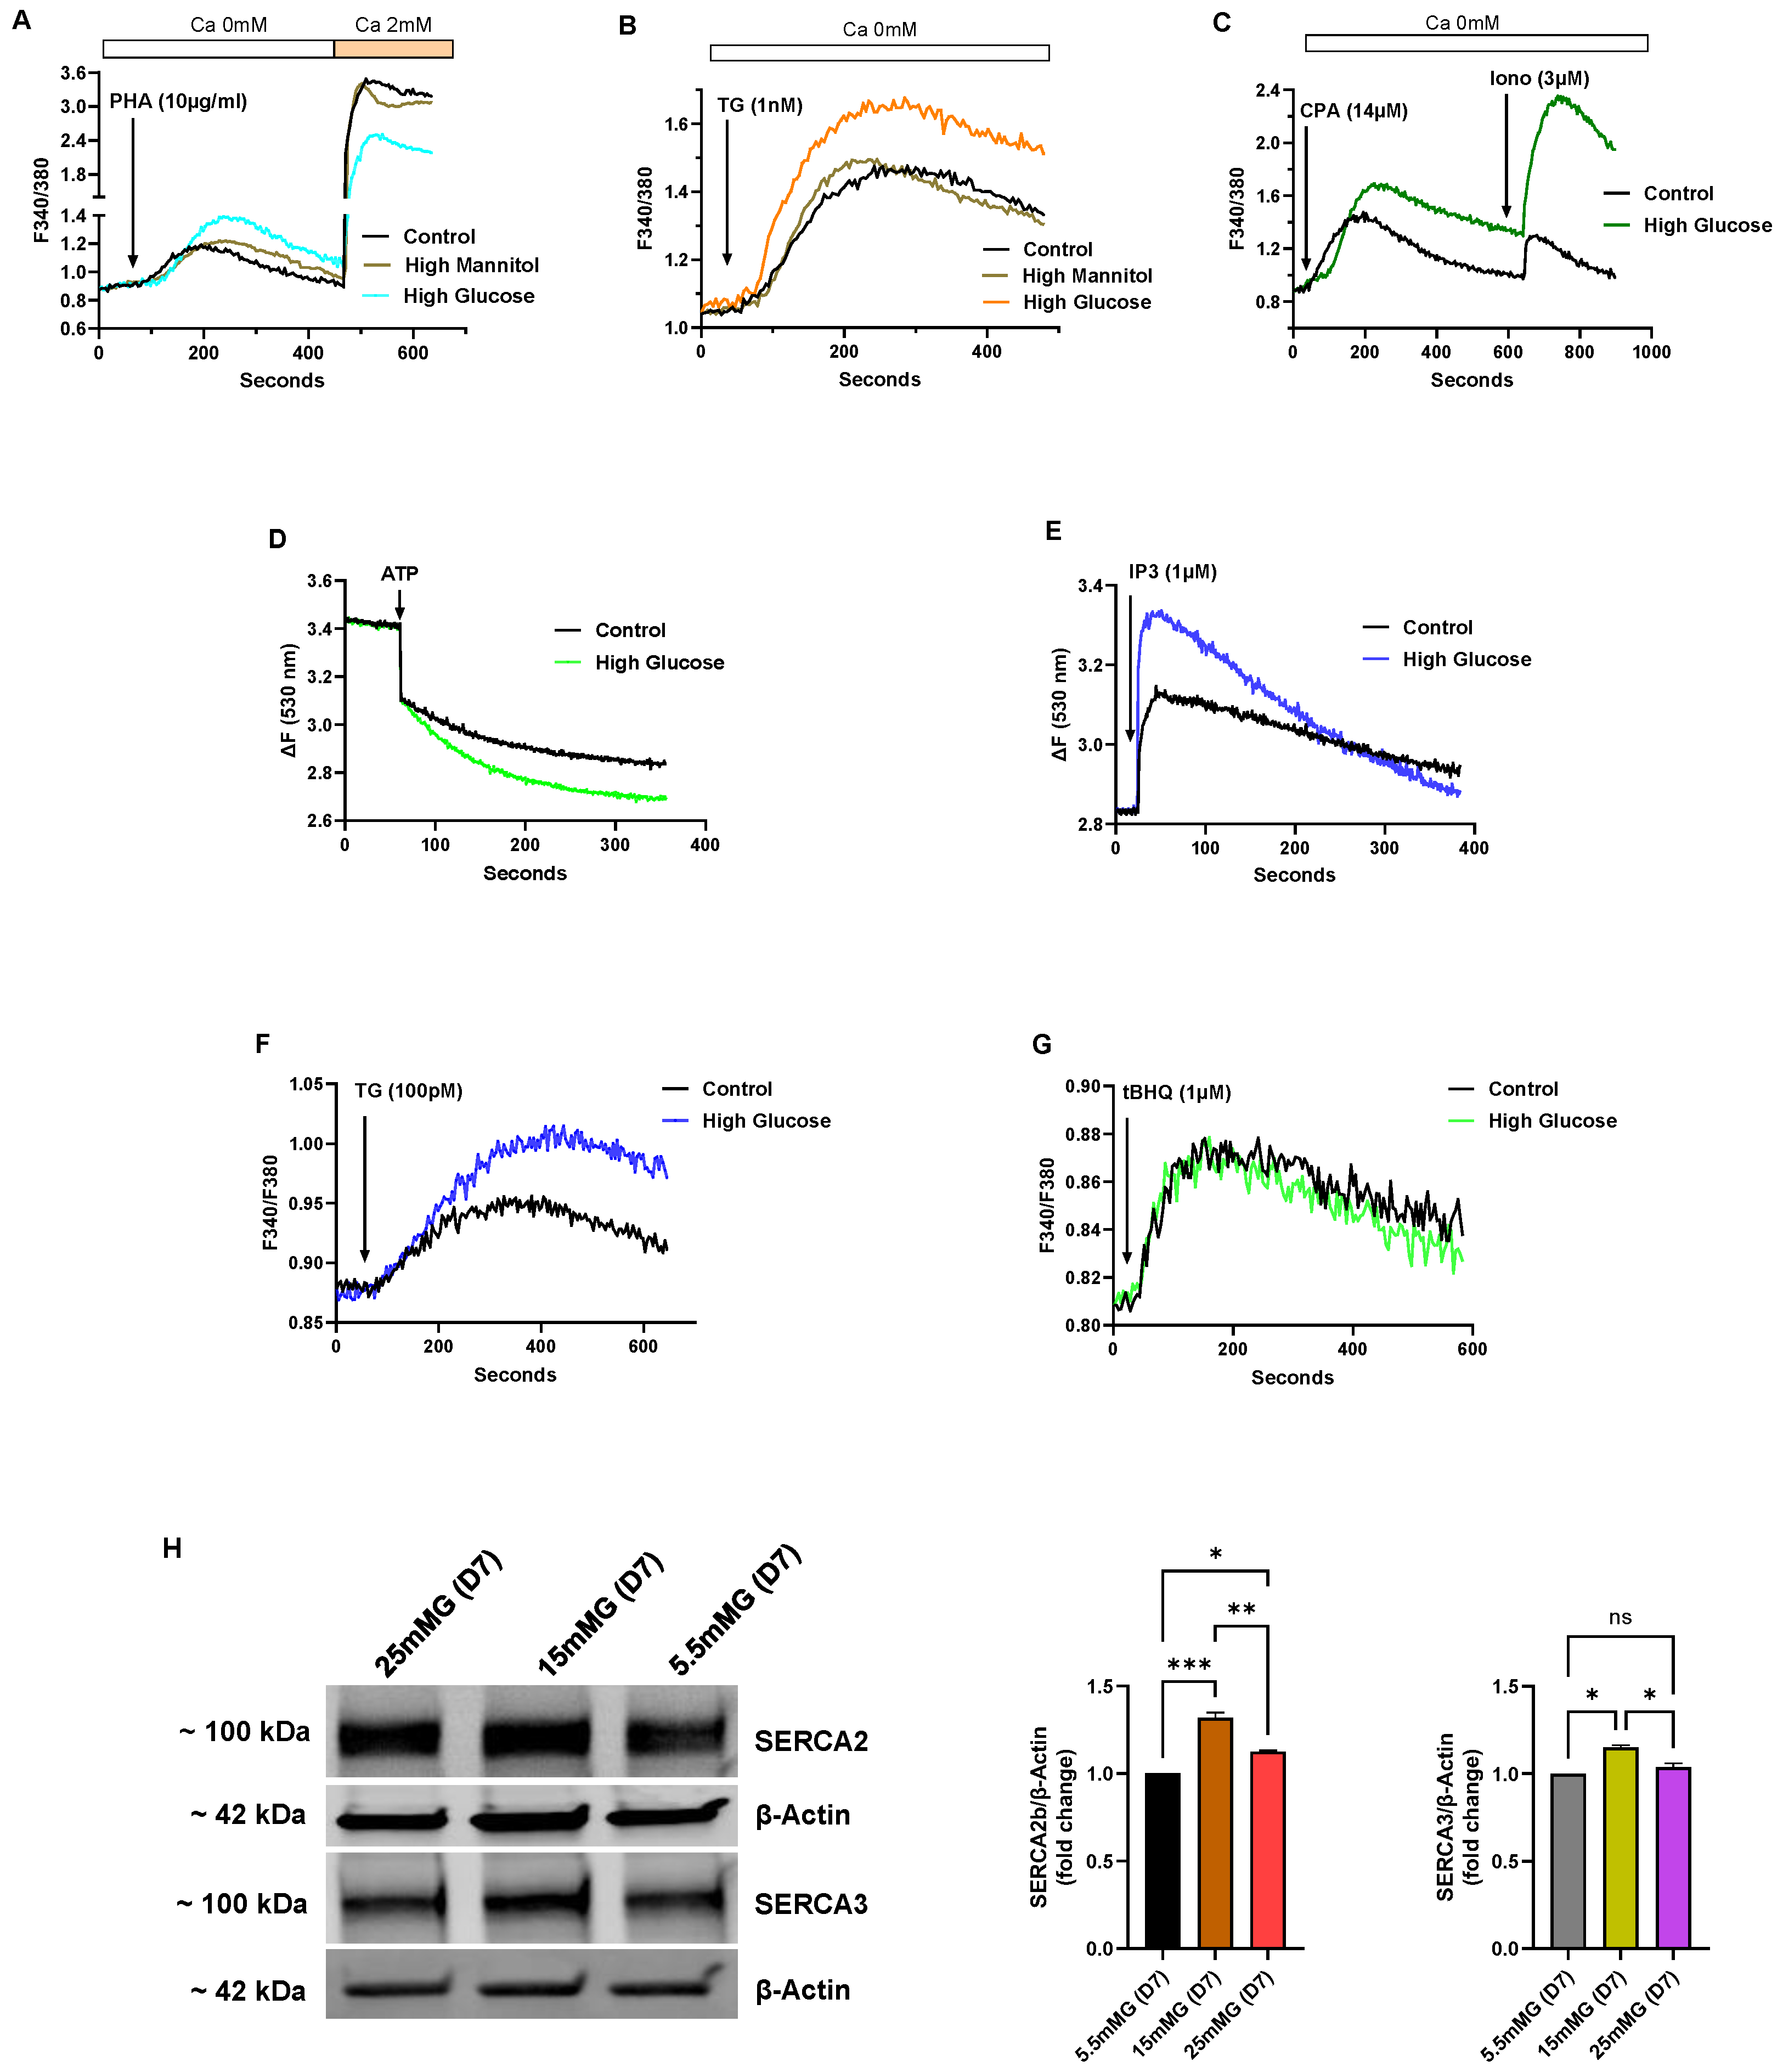
Figure 4 shows a series of experiments performed on Jurkat lymphocytes maintained in standard growth medium but with the glucose concentration increased from 5.5 mM (normal) to intermediate high (15 mM) and high (25 mM) glucose for an incubation period of 7 days, and thus denoted in our experiments as short-term high-glucose growth conditions. In select experiments, we used mannitol in place of glucose at the same concentrations to ensure that the observed effects were specific for glucose and not attributable to nonspecific osmotic effects (
Figure 4A,B).
Figure 4A–C depict Ca
2+ responses elicited by various Ca
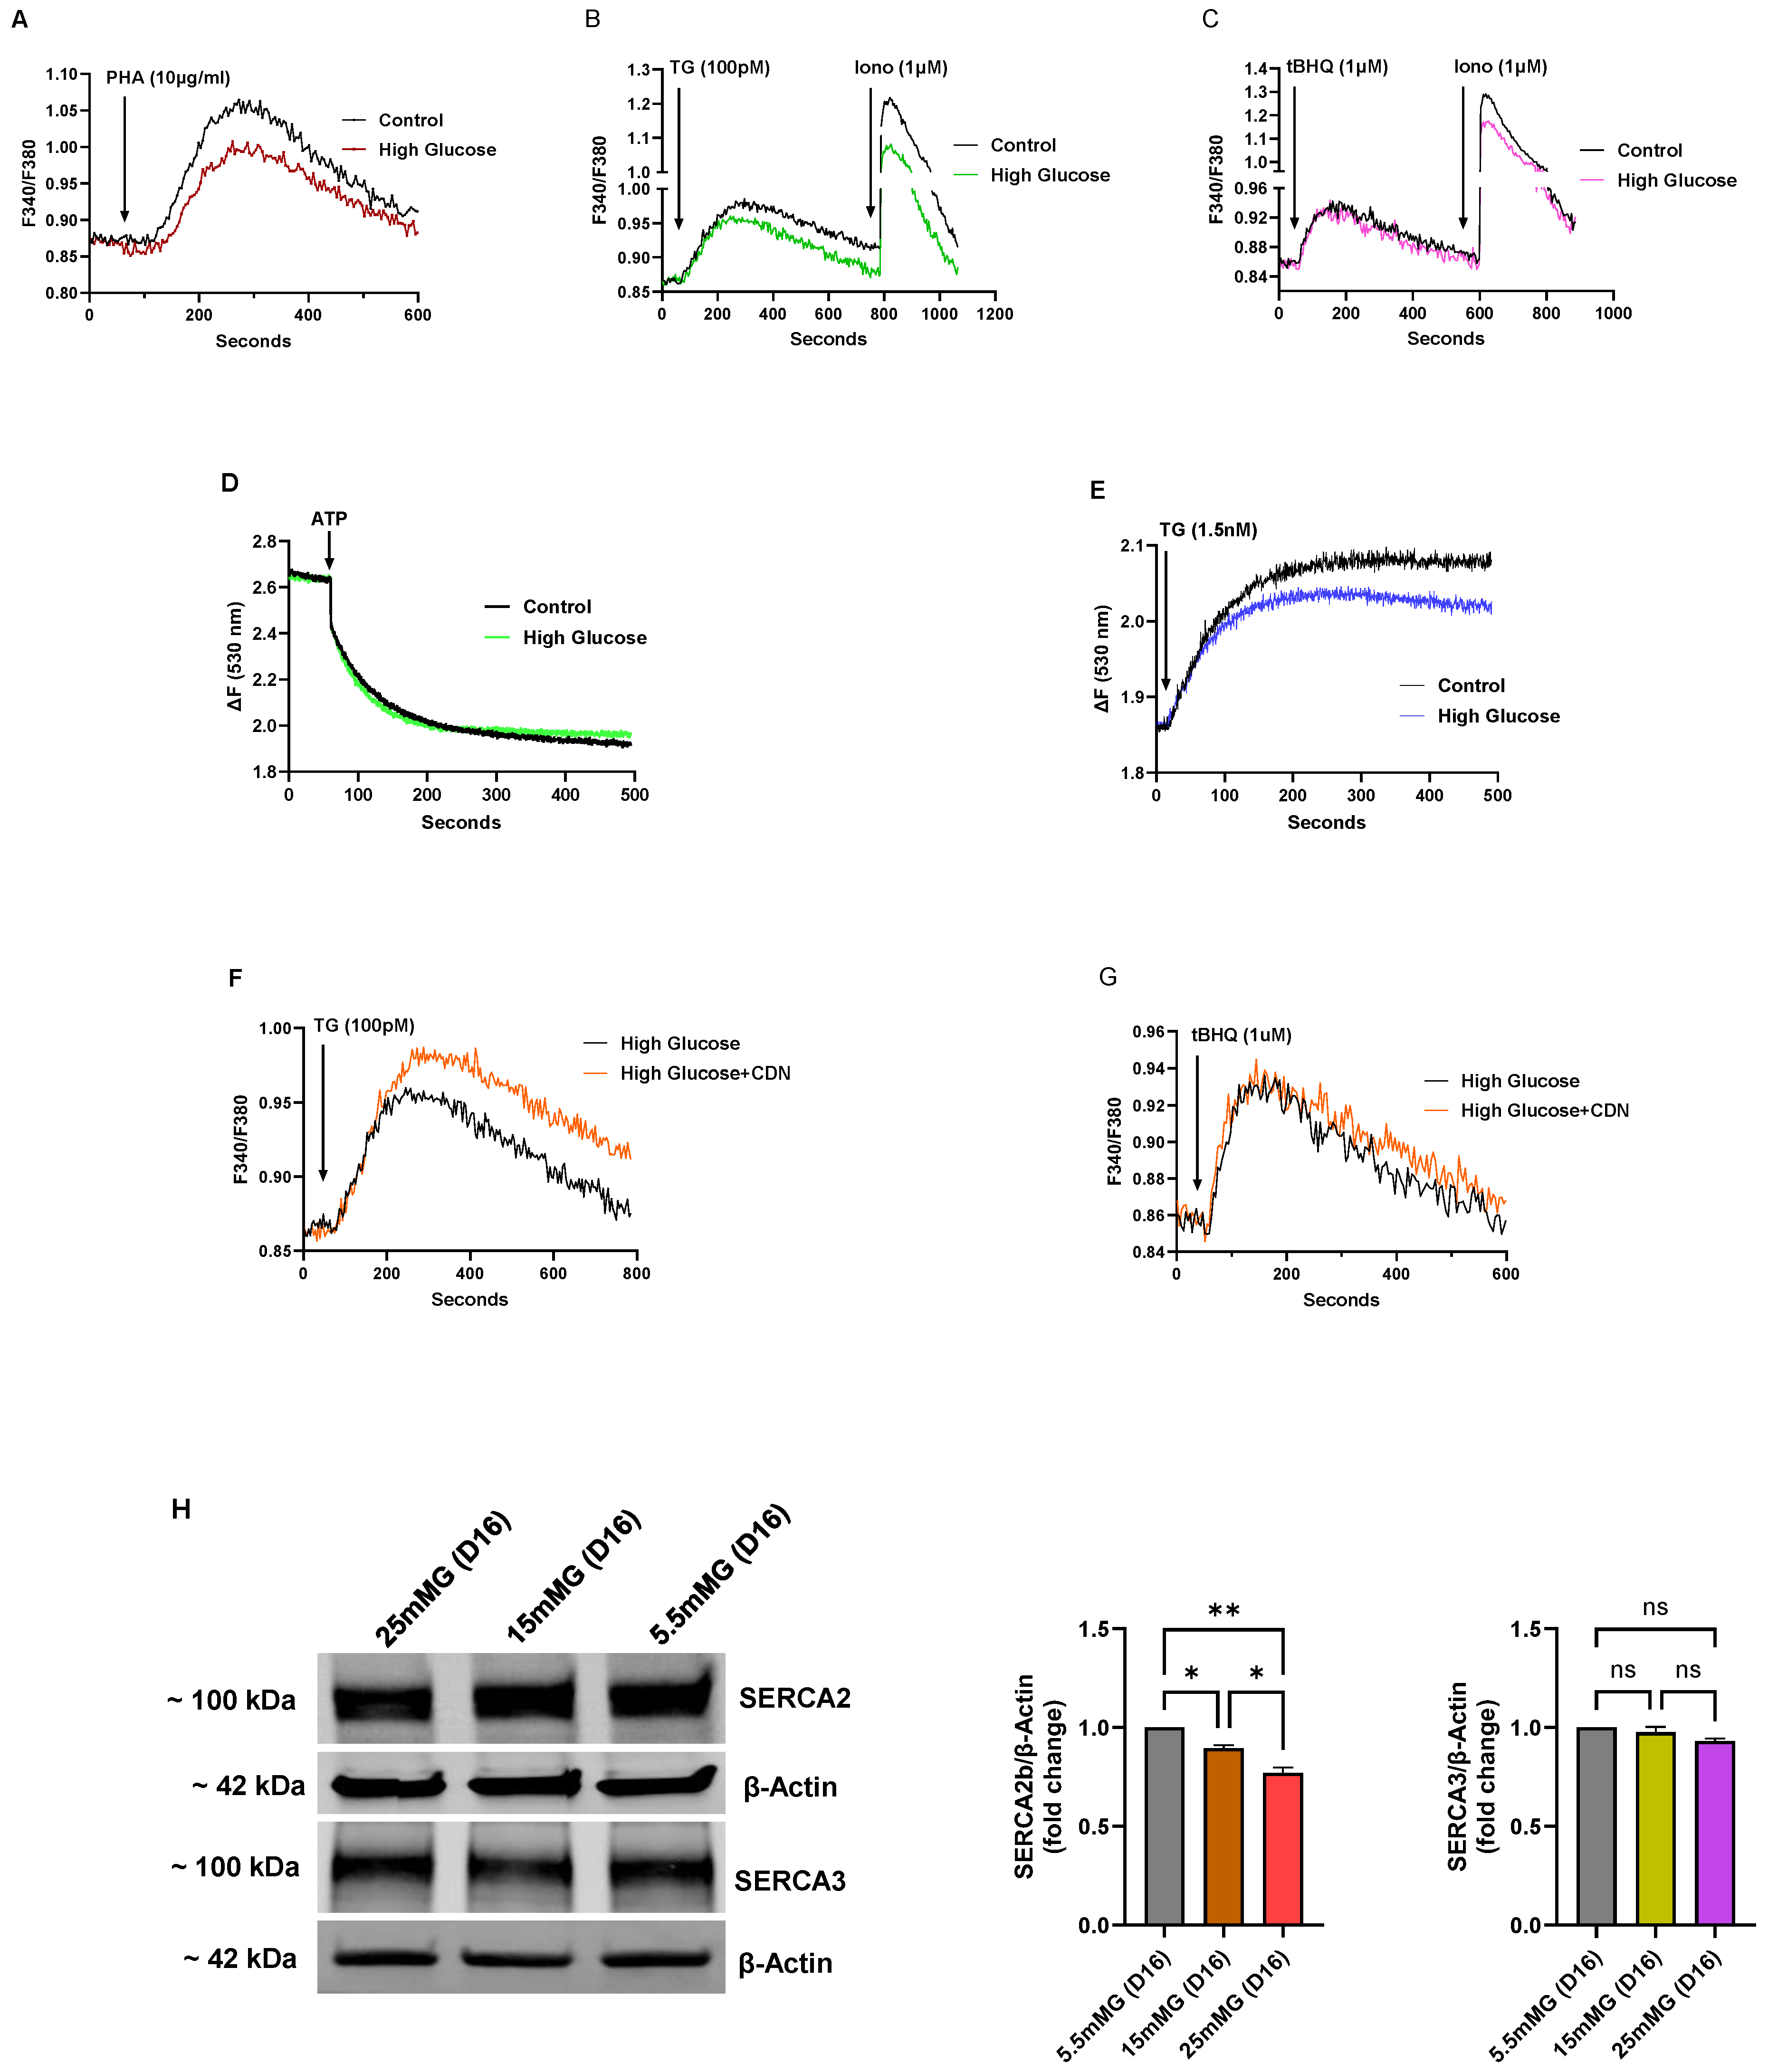
2+ mobilizing agonists in Jurkat lymphocytes exposed to short-term (<10 days) high glucose (25 mM) in the growth medium.
Figure 4A shows increased Ca
2+ release responses induced by the TCR agonist PHA in high-glucose medium compared to PHA-induced responses in control cells (High glucose ΔF 0.52 ± 0.012 vs, Control glucose ΔF 0.31 ± 0.008,
p < 0.05,
n = 5). The figure also reveals diminished PHA-induced Ca
2+ influx responses observed in high-glucose treated cells (High glucose ΔF 1.46 ± 0.015 vs. Control glucose ΔF 2.58 ± 0.02,
p < 0.05,
n = 5,
Figure 4A), suggesting weaker ER coupling to Ca
2+ influx pathways perhaps due to higher ER Ca
2+ content with a corresponding attenuated depletion-activated signal.
Figure 4B shows a similar response in cells treated with TG (1 nM) to achieve Ca
2+ release via SERCA pump inhibition in short-term high glucose T lymphocytes (High glucose TG ΔF 0.62 ± 0.008 vs. Control glucose TG ΔF 0.43 ± 0.005,
n = 5). We also used cyclopiazonic acid (CPA, 14 μM) as a structurally distinct SERCA blocker to further test ER Ca
2+ store levels in high-glucose treated Jurkat lymphocytes (High glucose CPA ΔF 0.80 ± 0.009 vs. Control glucose CPA ΔF 0.59 ± 0.004,
n = 3,
Figure 4C). Low concentrations of the SERCA blockers TG and CPA have previously been reliably employed as Ca
2+-releasing agents enabling assessments of ER Ca
2+ store levels; and we show in these experiments (
Figure 4B,C) that initial high glucose exposure appears to result in an early change whereby T lymphocytes re-configure ER stores to accommodate increased Ca
2+ levels. This effect of augmented Ca
2+ store content also appeared to apply more broadly to global Ca
2+ storage sites in the T lymphocyte given we observed a significantly increased Ca
2+ release response in cells treated with high concentrations of the Ca
2+ ionophore ionomycin (High glucose ionomycin ΔF 1.05 ± 0.016 vs. Control glucose ionomycin ΔF 0.32 ± 0.003,
n = 3,
p < 0.05,
Figure 4C), which discharges the totality of both SERCA and non-SERCA internal storage compartments.
An additional advantage of using Jurkat T lymphocytes for these studies is the ability to harvest large cell numbers from a clonal population of T cells to examine intracellular Ca
2+ uptake/release experiments utilizing permeabilized cell experiments, and also to take advantage of our previously reported novel SERCA pharmacological approach that allows characterization of the specific roles of the SERCA 2b and SERCA 3 pumps in the T cell ER Ca
2+ store system [
20,
21]. Indeed,
Figure 4D shows an increased initial rate of Ca
2+ uptake in Jurkat T lymphocytes exposed to short-term high glucose (25 mM) compared to control cells (High glucose rate ΔF/s 4.1 × 10
−3 vs, Control rate ΔF/s 2.2 × 10
−3,
n = 3), consistent with our Ca
2+ release experiments (
Figure 4A–C) revealing elevated Ca
2+ store levels. Thus, one potential underlying explanation for the high-glucose augmented store effect during short-term exposure is a quantifiable general increase in ATP-driven Ca
2+ uptake into ER Ca
2+ storage organelles. Notably, we further verified this heightened ER Ca
2+ store state by observing an increased discharge of Ca
2+ with the direct application of IP3 to permeabilized Jurkat lymphocytes exposed to short-term high glucose (High glucose IP3 response ΔF 0.50 ± 0.006 vs. Control glucose IP3 response ΔF 0.31 ± 0.004,
p < 0.05,
n = 3,
Figure 4E).
We applied the low-dose TG and 2,5-di-(
tert butyl)-1,4-benzohydroquinone (tBHQ) SERCA blocker regimen we previously reported [
20] to show that high-glucose induced re-configuration of T cell Ca
2+ stores appears to be mostly due to specific augmentation of SERCA 2b-regulated Ca
2+ pools. Thus, we observed that low concentrations of TG (100 pM), which we have shown specifically discharges the SERCA 2b Ca
2+ stores, mobilized a significantly larger increment of Ca
2+ in T lymphocytes exposed to short-term high glucose compared to control cells (High glucose TG ΔF 0.13±0.005 vs. Control glucose TG ΔF 0.08 ± 0.003,
p < 0.05,
n = 4,
Figure 4F). Conversely, application of low-dose tBHQ (1 μM), which preferentially targets SERCA 3-regulated stores, did not significantly alter Ca
2+ release amplitudes in cells incubated in high glucose as compared to control cells (
Figure 4G). Intriguingly, the early phase of elevated glucose, which presumably supports higher ATP production, appears to selectively enhance Ca
2+ loading into SERCA 2b-regulated stores, suggesting differential roles of the SERCA pumps in managing the allocation of energy resources depending on the external T cell environment. Consistent with the results shown in
Figure 4F, which suggests greater SERCA 2b activity in the early high-glucose condition, we observed a corresponding increase in expression of SERCA 2b protein levels (
Figure 4H).
Figure 4H shows a representative Western blot image along with bar plots of band intensities of SERCA 2b and SERCA 3 expression levels in Jurkat T lymphocytes exposed to normal glucose (5.5 mM), intermediate high glucose (15 mM) and high glucose (25 mM) concentrations in short-term (7 days) growth conditions. As shown, we observed a significant increase in SERCA 2b protein expression in the short-term interval in T lymphocytes exposed to intermediate glucose levels, yet expression levels start to fall, albeit still elevated, when cells are exposed to high glucose (
Figure 4H). In contrast, consistent with the tBHQ-induced Ca
2+ release experiments shown in
Figure 4G, we observed a smaller change in SERCA 3 expression levels, increasing only modestly to short-term intermediate-high glucose levels and subsequently falling back to levels similar to control cells in conditions of high-glucose exposure (
Figure 4H). Interestingly, the SERCA expression experiments hint at early changes occurring in T lymphocytes as the high-glucose stress environment develops; it appears as cells first encounter intermediately elevated glucose in the short-term that SERCA 2b levels are increased allowing the conditioning of ER Ca
2+ stores to accommodate greater storage capacity. However, with exposure to the increased stressor of high glucose (25 mM), even in the short-term interval, T lymphocytes exhibit scaled-back expression of the SERCA 2b pump.
As the Jurkat T lymphocytes are subjected to long-term high-glucose exposure (16 days, 25 mM) we observed similar effects on ER Ca
2+ stores as was noted for hyperglycemic UCD-T2DM rats. We observed, for example, significantly reduced TCR-activated Ca
2+ release (using the TCR agonist PHA) in T lymphocytes exposed to long-term (>10 days) high glucose (High glucose ΔF 0.138 ± 0.008 vs. Control glucose ΔF 0.195 ± 0.005,
p < 0.05,
n = 5,
Figure 5A), reversing the augmented ER Ca
2+ effect we noted in short-term high glucose conditions (
Figure 4A). Similarly, we also observed an attenuated Ca
2+ release response inducible by low-dose TG (100 pM), suggesting, as noted above, that the primary perturbatory action of high-glucose is directed to the SERCA 2b Ca
2+ pump (High glucose TG ΔF 0.097 ± 0.005 vs. Control glucose TG ΔF 0.120 ± 0.003,
p < 0.05,
n = 5,
Figure 5B); accordingly, as with the short-term high-glucose effect, we did not find a significant alteration of the low-dose tBHQ-stimulated Ca
2+ release response (
Figure 5C), again suggesting that the SERCA 3-regulated Ca
2+ stores may be relatively unaffected by changes in glucose levels for these incubation periods. Interestingly, although our low-dose SERCA blocker (TG and tBHQ) experiments indicate differential sensitivities of SERCA-regulated Ca
2+ pools, we did observe a more global diminishment of Ca
2+ storage reservoirs as revealed by ionomycin application (1 μM,
Figure 5B,C), similar to the effects we noted above in rat lymphocytes subjected to chronic hyperglycemia.
Using the permeabilized lymphocyte assay to examine Ca
2+ uptake and release effects directly, we observed reduced ER Ca
2+ uptake back to levels indistinguishable from control normal glucose levels (
Figure 5D vs.
Figure 4D), and an attenuated permeabilized cell TG (1.5 nM)-induced ER Ca
2+ release response in Jurkat lymphocytes exposed to long-term high-glucose conditions (High glucose TG ΔF 0.18 ± 0.007 vs. Control glucose TG ΔF 0.23 ± 0.004,
n = 3,
Figure 4E). These results suggest, as we noted using the UCD-T2DM rat lymphocytes, an impairment in SERCA-mediated Ca
2+ ER loading, likely due to high-glucose induced perturbations affecting ER energy homeostasis with an ensuing deficiency to sequester Ca
2+ into storage compartments. Intriguingly, we observed that incubation with the SERCA activator CDN1163 (10 μM, 72 h) significantly boosted Ca
2+ release responses induced by low-dose TG (100 pM) in Jurkat lymphocytes exposed to long-term (16 days) high glucose (TG/CDN1163 ΔF 0.126 ± 0.007 vs. TG/no CDN1163 ΔF 0.097 ± 0.005,
p < 0.05,
n = 4,
Figure 5F), which as we have previously reported specifically targets the SERCA 2b Ca
2+ pools [
20]. In contrast,
Figure 5G shows that CDN1163 treatment did not have a similar effect in restoring low-dose tBHQ responses in the long-term high-glucose condition, consistent with our short-term high-glucose experiments (
Figure 4F,G), suggesting differential effects of high-glucose perturbations on SERCA 2b vs. SERCA 3 Ca
2+ stores. This finding adds to previous studies noting beneficial effects of pharmacological SERCA activation in cardiovascular pathologies [
31,
32,
33,
34], with our work now finding evidence that a protective effect of CDN1163 operates via preferential augmentation of SERCA 2b-mediated Ca
2+ loading in T cell Ca
2+ stores. This pharmacological effect is also consistent with our SERCA expression studies showing that the initial T cell response to short-term high glucose is to transiently increase the SERCA 2b Ca
2+ pump which appears to result in increased ER Ca
2+ storage capacity (
Figure 4H). Consistent with this idea we show in
Figure 5H that with continued long-term high-glucose exposure the boost in SERCA 2b Ca
2+ pump expression is reversed, revealing a progressive loss of expression of the transporter with intermediate and high glucose extended exposure. Moreover, as noted previously, expression and function of the SERCA 3 Ca
2+ pump isoform appears less sensitive to perturbations induced by T cell growth in high-glucose conditions (
Figure 5H). These findings further underscore the potential value of therapeutic targeting of SERCA 2b Ca
2+ pumps to protect ER Ca
2+ stores, and thereby preserve T cell function in a hyperglycemic environment.
Given that we observed an apparent deterioration in ER Ca
2+ store-loading capacity in Jurkat lymphocytes exposed to long-term (>10 days) high glucose, we sought to examine whether these Ca
2+ store perturbations associated with an elevated ER stress state, as we noted in the UCD-T2DM rat lymphocytes. Indeed, as shown in
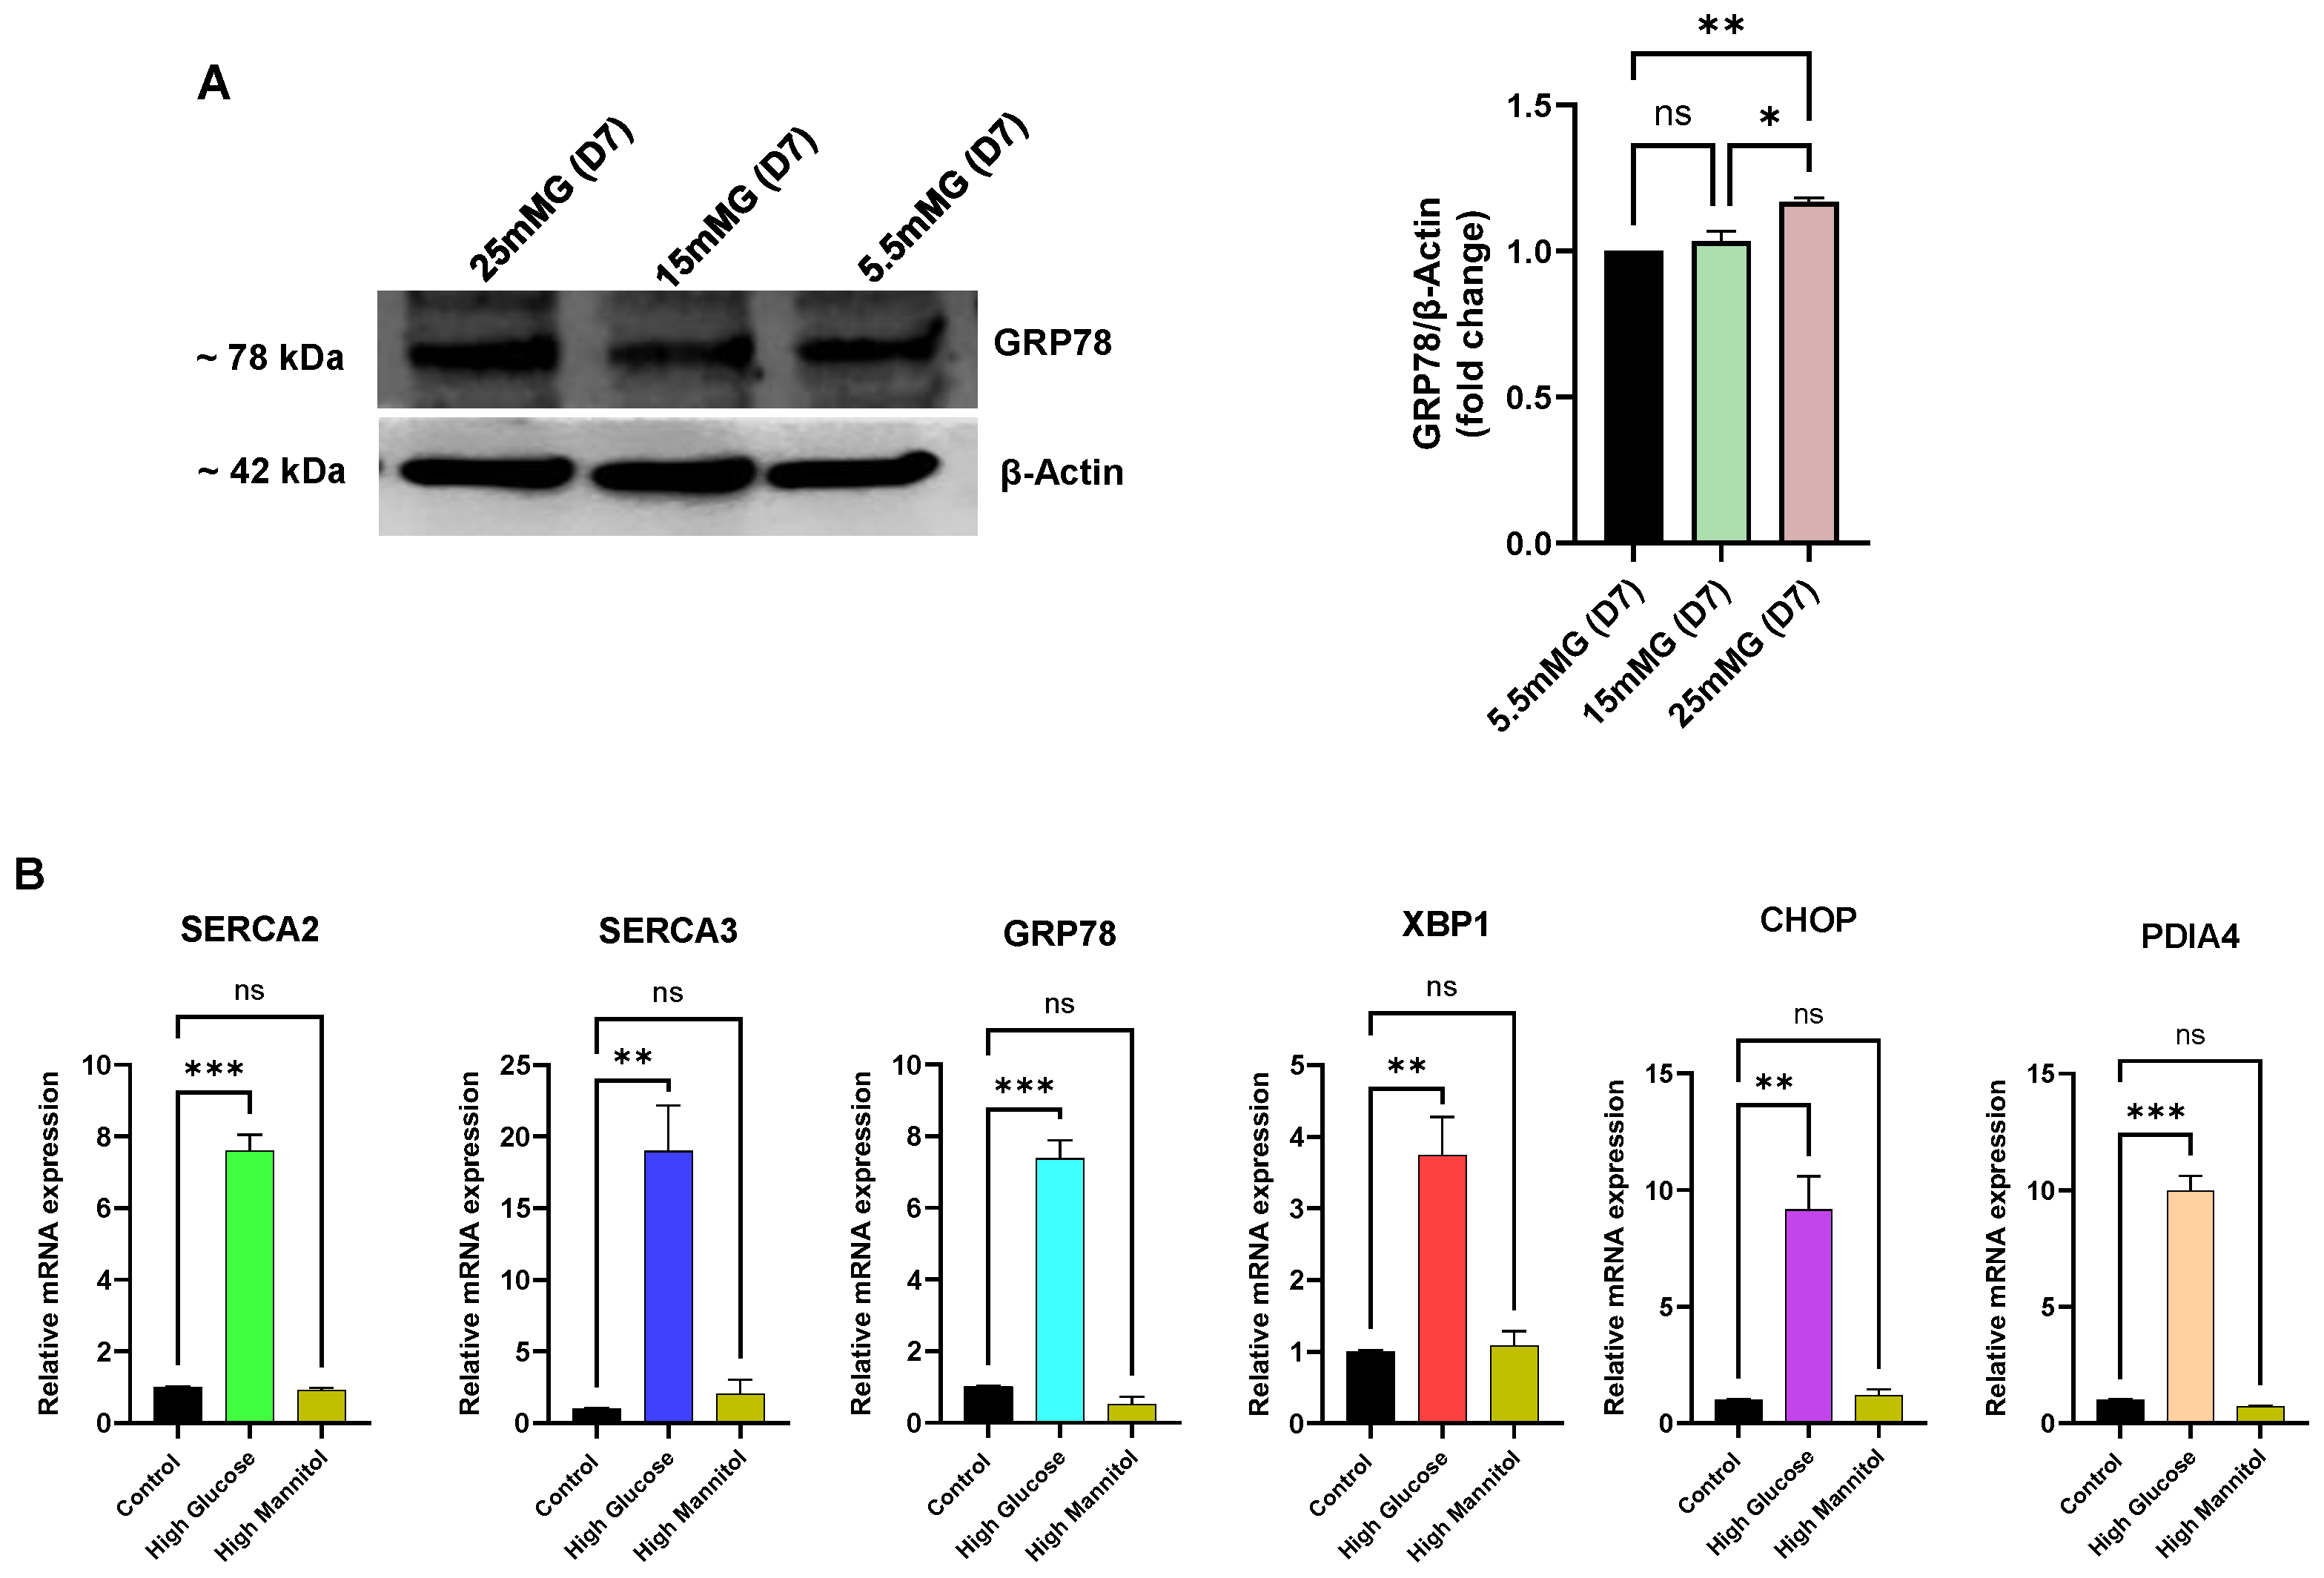
Figure 6 we did observe a significant increase in key ER-resident markers of the ER stress condition.
Figure 6A shows, for example, increased expression of the major ER chaperone and ER-stress regulator protein GRP78. This experiment revealed, as we noted in
Figure 4H for declining SERCA expression levels, early changes (<10 days) in expression levels with increasing GRP78 production by day 7 in Jurkat lymphocytes exposed to high glucose (
Figure 6A), preceding the measurable loss in ER Ca
2+ levels detectable in our long-term high-glucose condition. Similarly,
Figure 6B shows RT-qPCR experiments measuring elevation of mRNA levels of an expanded list of common ER stress markers and SERCA pumps within our short-term (<10 day) high-glucose exposure interval, reflecting early gene expression changes in Jurkat lymphocytes to high-glucose perturbations in ER conditions that appear before our detection of diminished ER Ca
2+ store content (>10 days,
Figure 5A,B). Indeed, in alignment with our protein expression studies (
Figure 4H) we noted an increase (3 days) in mRNA levels for SERCA 2b (7-fold) and SERCA 3 (17-fold), likely reflecting an early adaptive response to preserve ER Ca
2+ store levels in response to high external glucose concentrations. In addition to upregulation of the ER chaperone and protein folding mediators GRP78 (6-fold increase) and Protein Disulfide Isomerase A4 (PDIA4, 9-fold increase), we observed increased expression of the genes encoding key transcriptional regulators and effectors of the ER stress state in X-Box Binding Protein 1 (XBP1, 2.5-fold increase) and C/EBP Homologous Protein (CHOP, 8-fold increase). Thus, these experiments reveal that our in vitro Jurkat lymphocyte high-glucose model exposes early changes in gene and protein expression patterns, manifesting before observable alterations in Ca
2+ release responses, that signal an impairment in ER functional integrity, likely due to disruptions secondary to exposure to high glucose conditions.
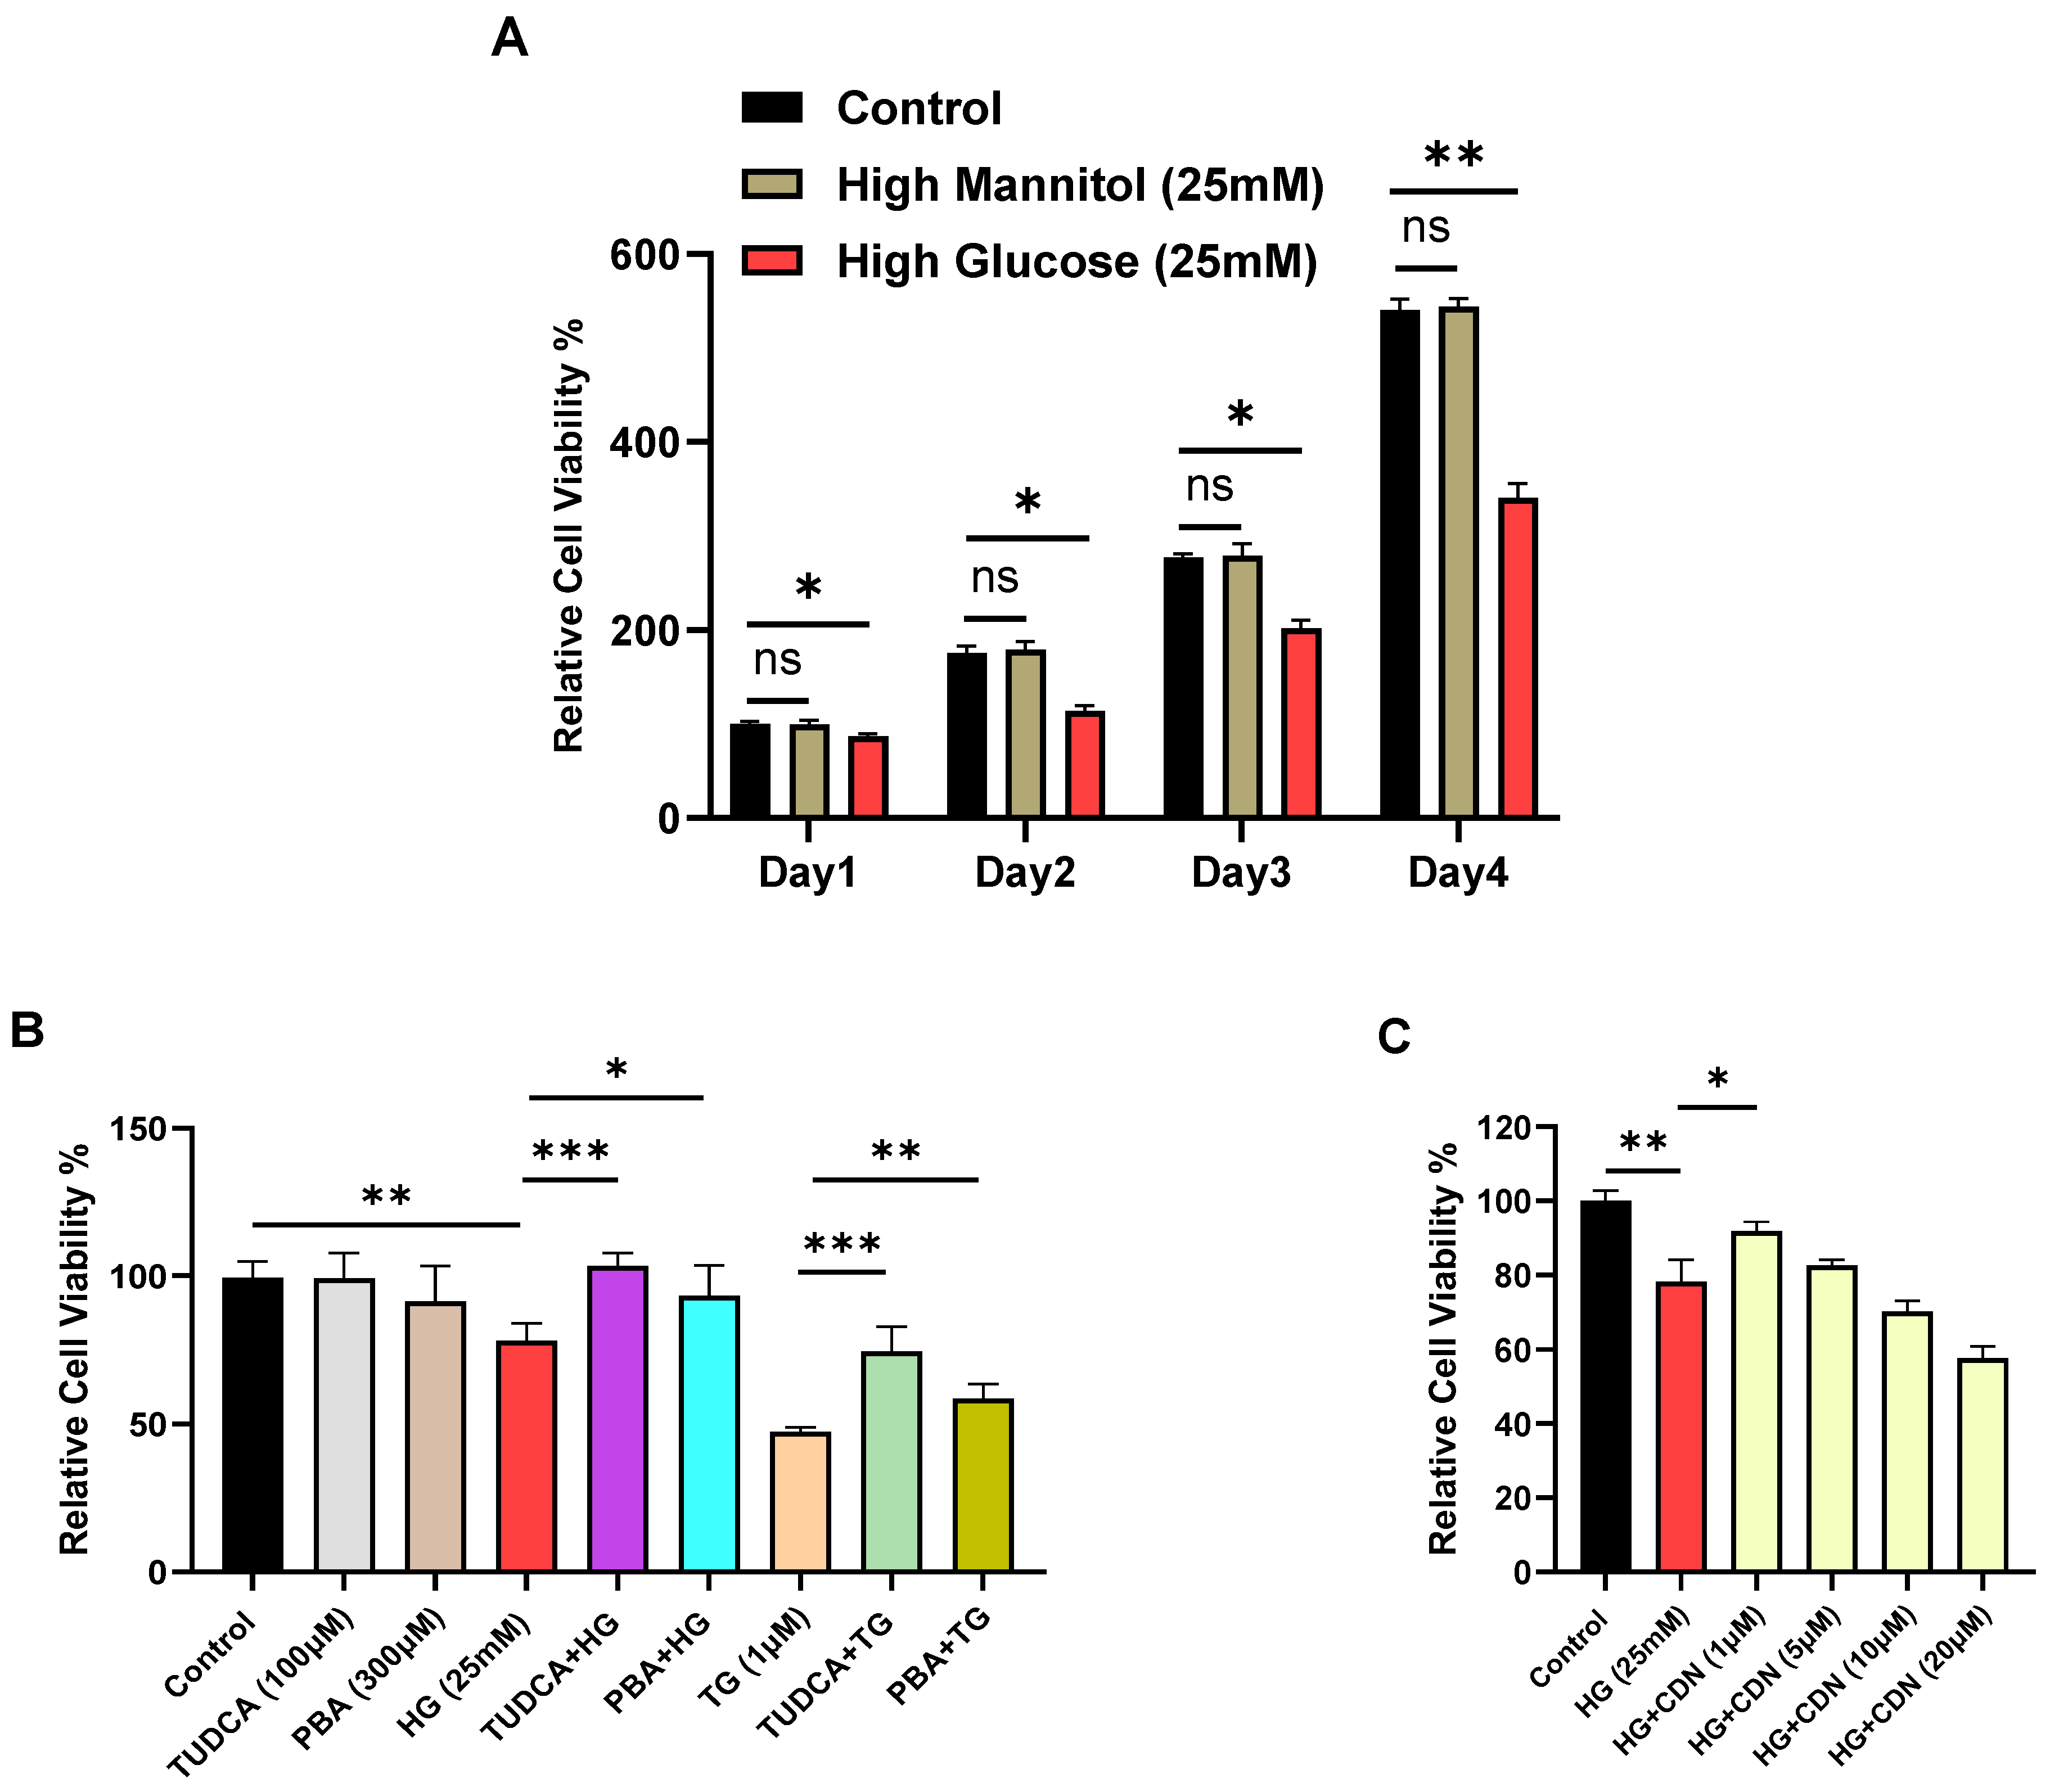
Corruption of ER function due to external high-glucose with recruitment of ER stress mediators GRP78, XBP1 and CHOP might reasonably be expected to exert an observable growth suppression effect on T lymphocytes to allow for corrective protein folding reactions and restoration of ER integrity. We thus proceeded to examine indices of cell viability in Jurkat lymphocytes subjected to high glucose.
Figure 7A shows a gradual loss on viability for Jurkat lymphocytes exposed to high glucose (25 mM) with clear growth inhibition observed as early as day 4. Next, we investigated the effects of the small molecule chemical chaperones tauroursodeoxycholic acid (TUDCA) and 4-phenylbutyrate (PBA), which have been shown to provide protection against damaging ER stress associated with metabolic dysfunction, insulin resistance and type 2 diabetes [
35]. Indeed, we observed that pre-incubation of Jurkat lymphocytes with TUDCA (100 μM, 24 h) and PBA (300 μM, 24 h) provided significant protection against high-glucose induced cell viability degradation occurring by day 4, largely restoring cell growth to levels similar to control lymphocytes (
Figure 7B). These experiments are in alignment with the well-established property of TUDCA and PBA to mitigate ER stress [
35], and our experiment also shows the capacity of these chemical chaperones to protect against the effects of TG, a well-known potent inducer of ER stress (
Figure 7B).
Figure 7C shows that incubation of Jurkat lymphocytes with the SERCA activator CDN1163 also provided protection against long-term (14 days) high-glucose induced loss of cell viability, revealing maximal preservation of lymphocyte cell viability at the 1–5 μM range. Importantly, this result suggests that the effects of CDN1163 to restore Ca
2+ levels in SERCA 2b-regulated stores in lymphocytes exposed to long-term high glucose (
Figure 5F) may be a valuable therapeutic strategy to protect T cell functions and viability in the presence of chronic high glucose.


 ,
, 