
Transcriptome Analysis Reveals PpMYB1 and PpbHLH1 Promote Anthocyanin Accumulation in Phalaenopsis pulcherrima Flowers

 , and
, and 
Abstract
1. Introduction
2. Materials and Methods
2.1. Plant Materials and Growing Conditions
2.2. Determination of Anthocyanin Content
2.3. RNA-Seq
2.4. Differentially Expressed Gene (DEG) Analysis
2.5. Quantitative Real-Time PCR Analysis
2.6. Identification and Phylogenetic Analysis of Transcription Factors
2.7. Isolation of the Full-Length cDNA of PpMYB1 and PpbHLH1
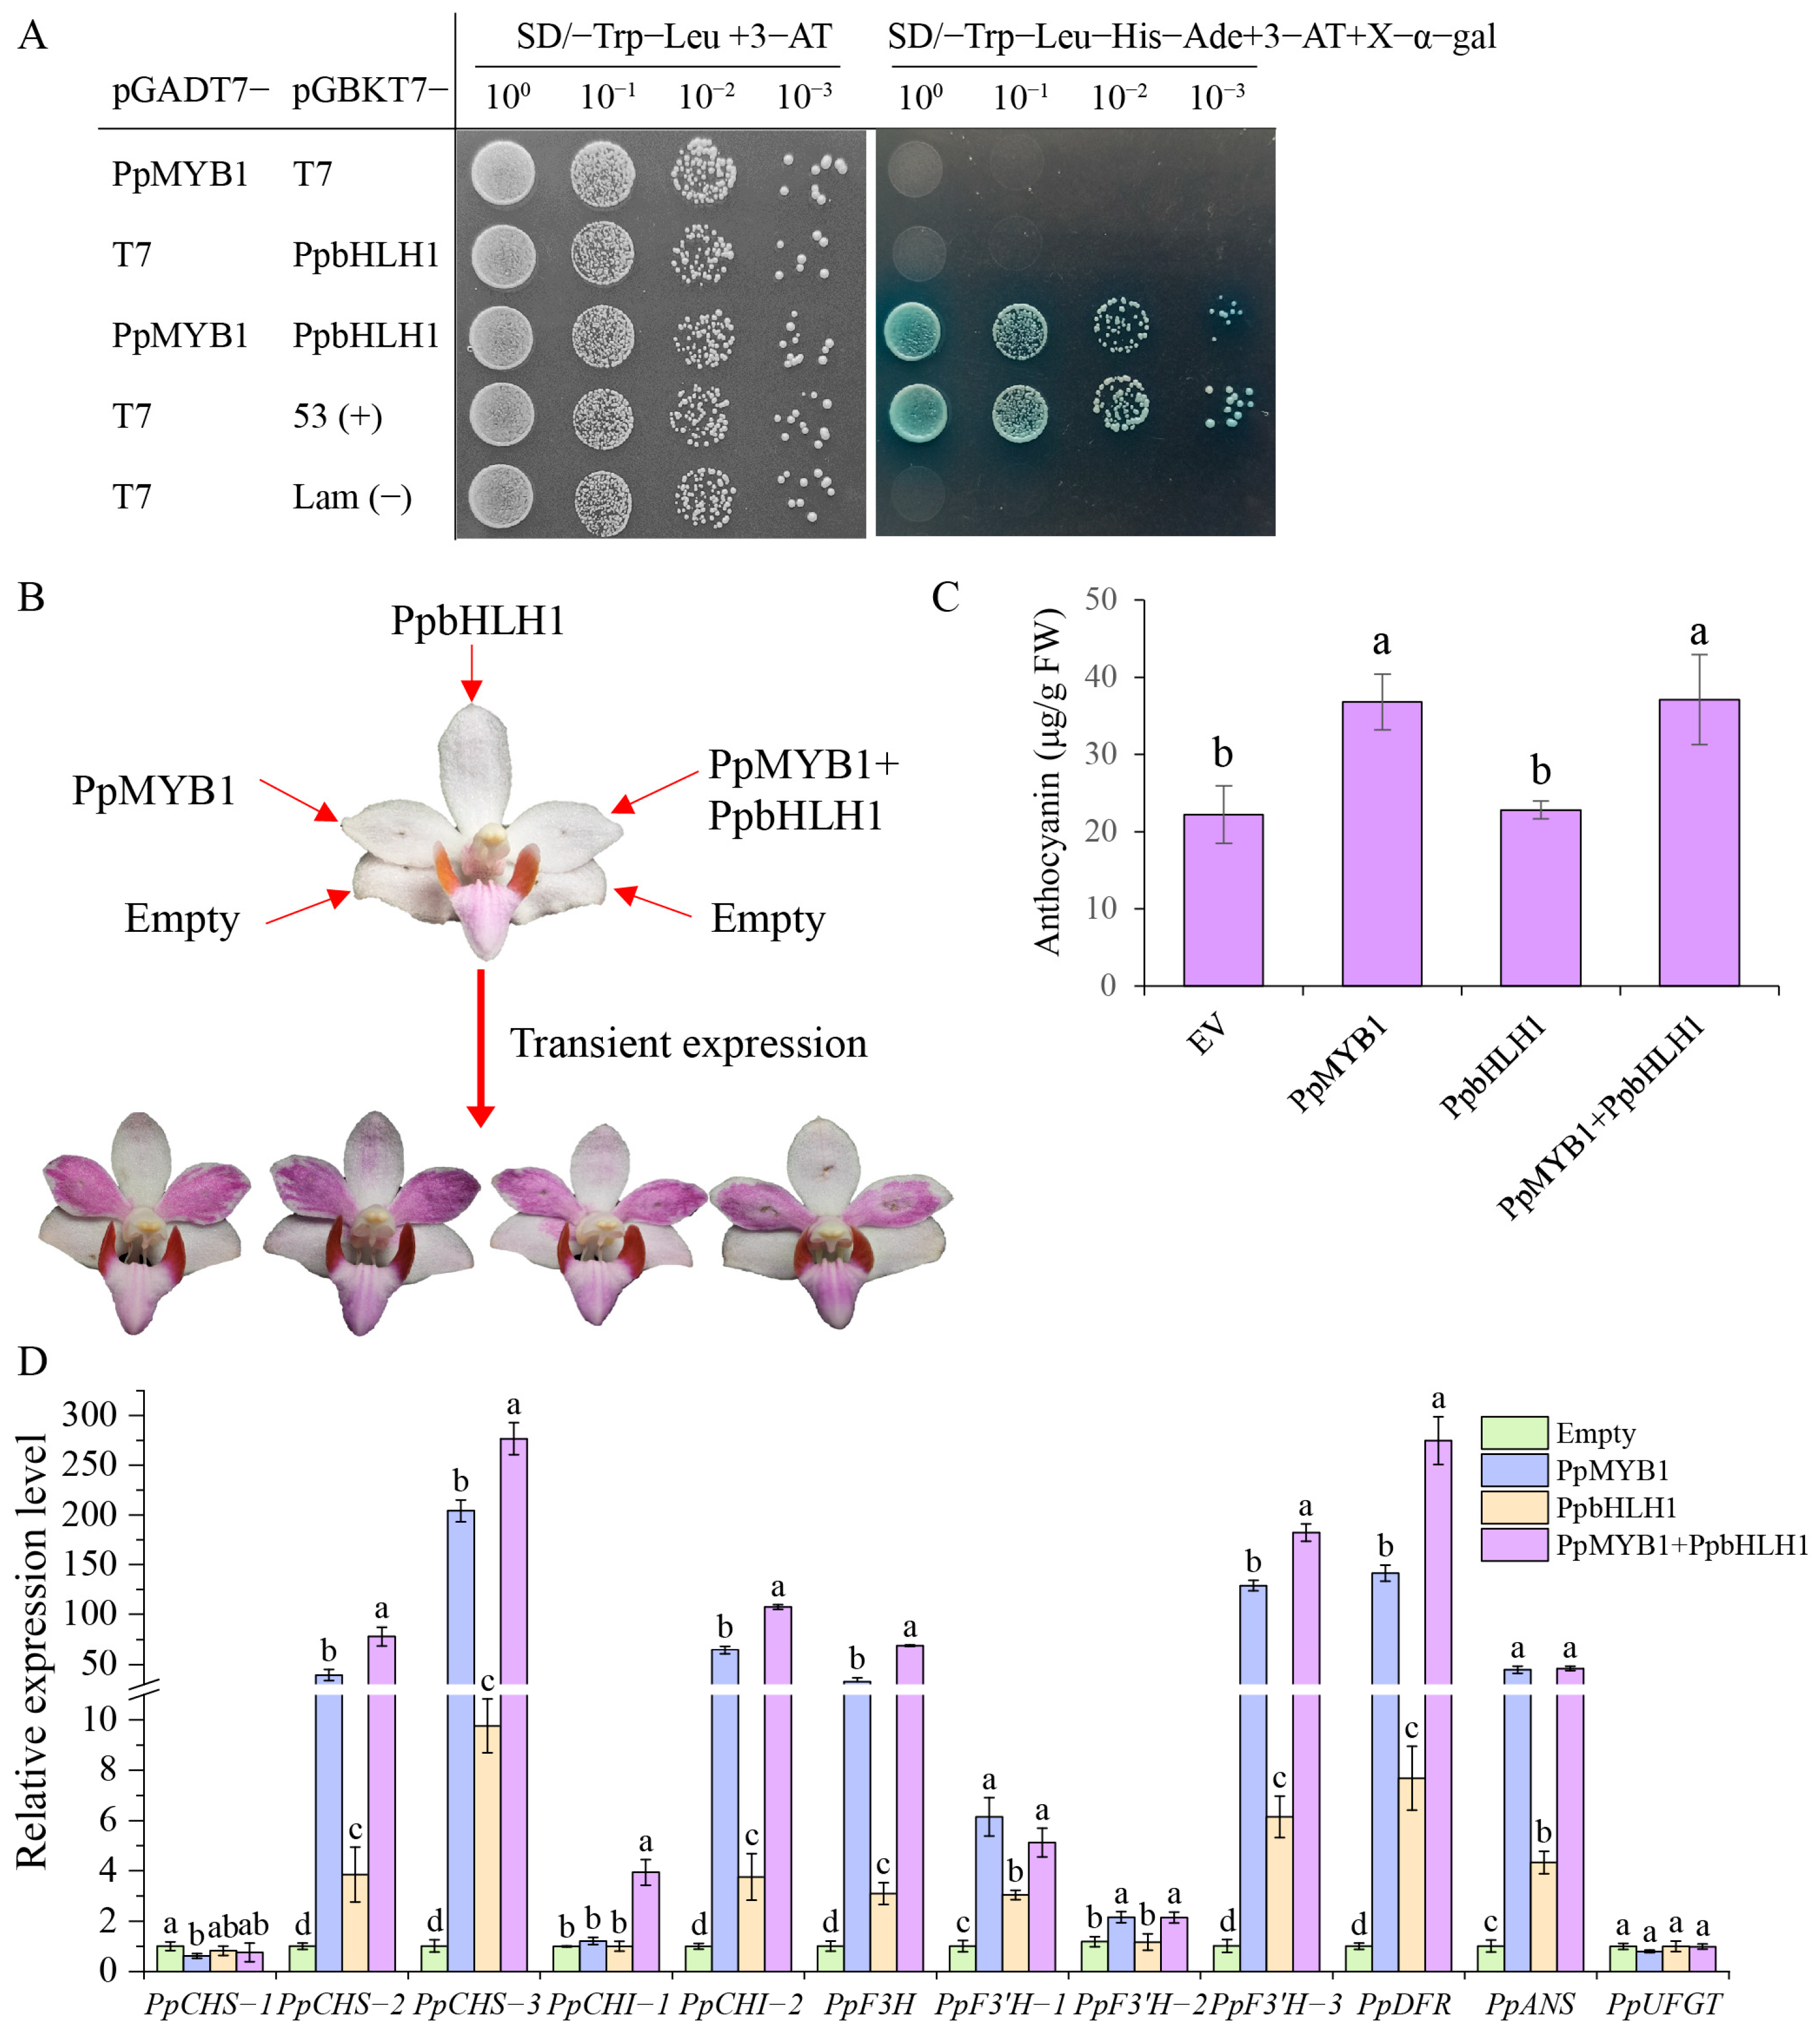
2.8. Yeast Two-Hybrid (Y2H) Assay
2.9. Transient Expression of PpMYB1 and PpbHLH1 in P. pulcherrima
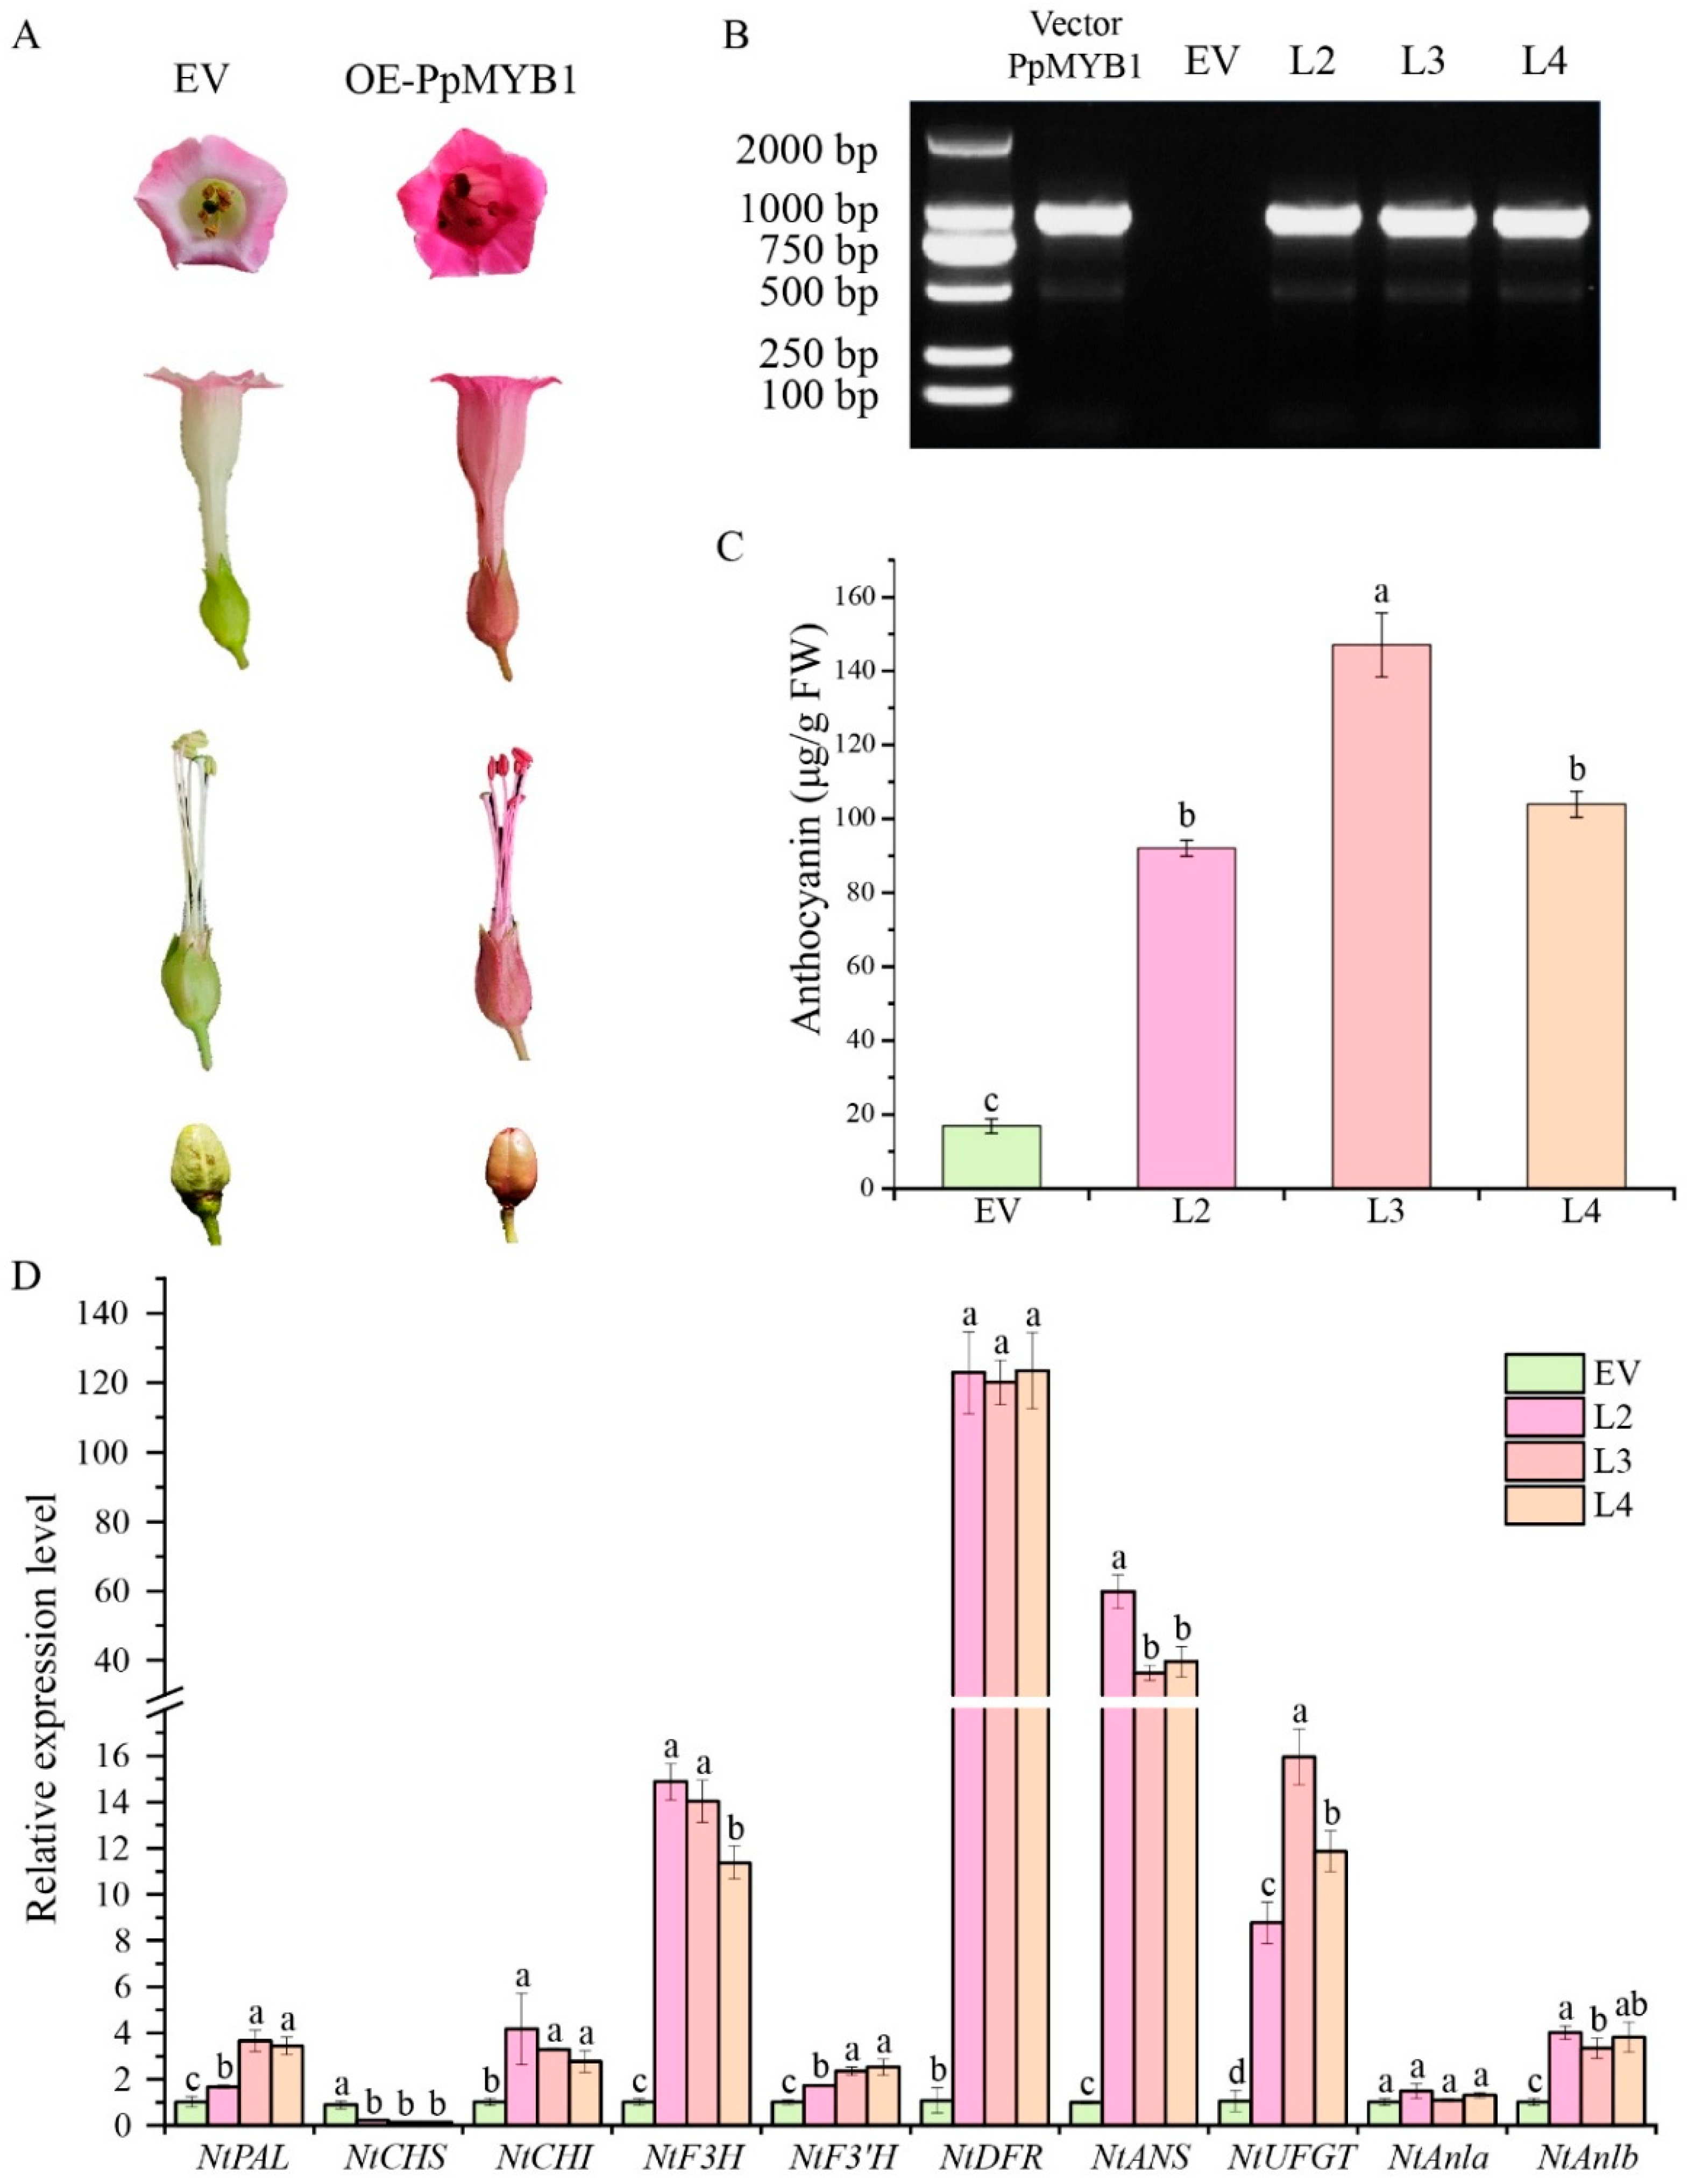
2.10. Stable Transformation of PpMYB1 and PpbHLH1 in Tobacco
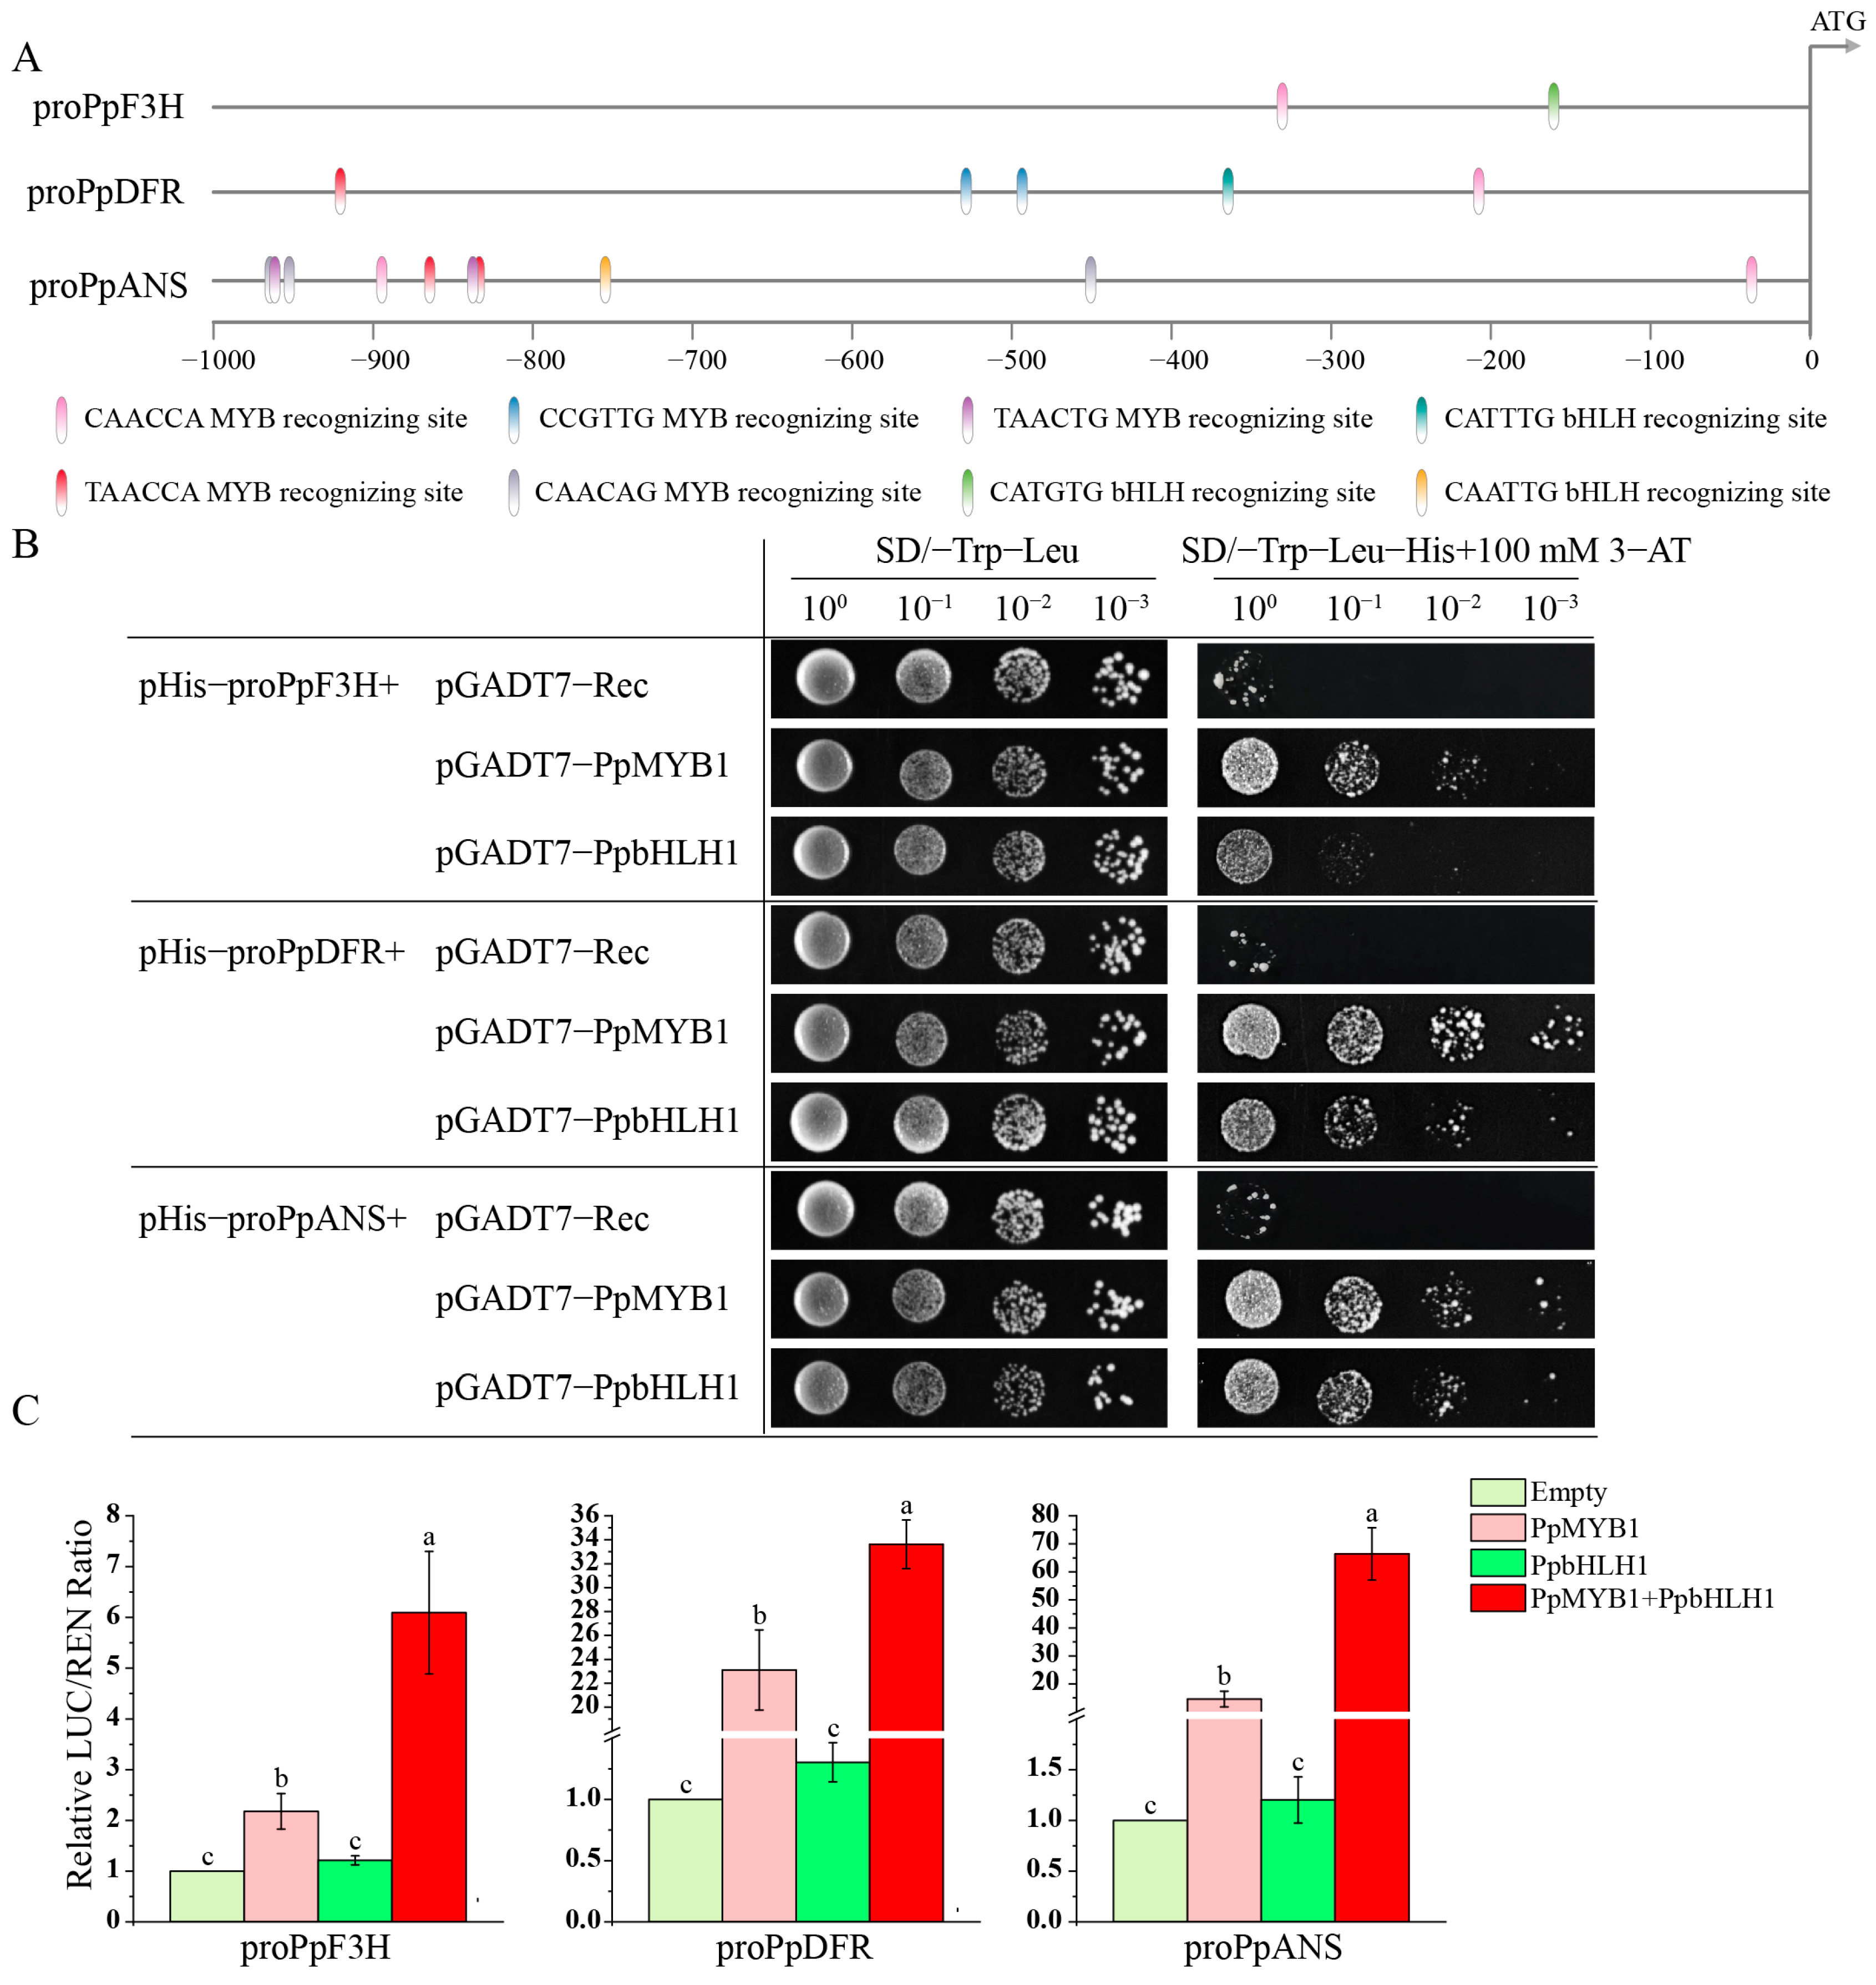
2.11. Yeast One-Hybrid (Y1H) Assay
2.12. Dual-Luciferase Assay
2.13. Statistical Analysis
3. Results
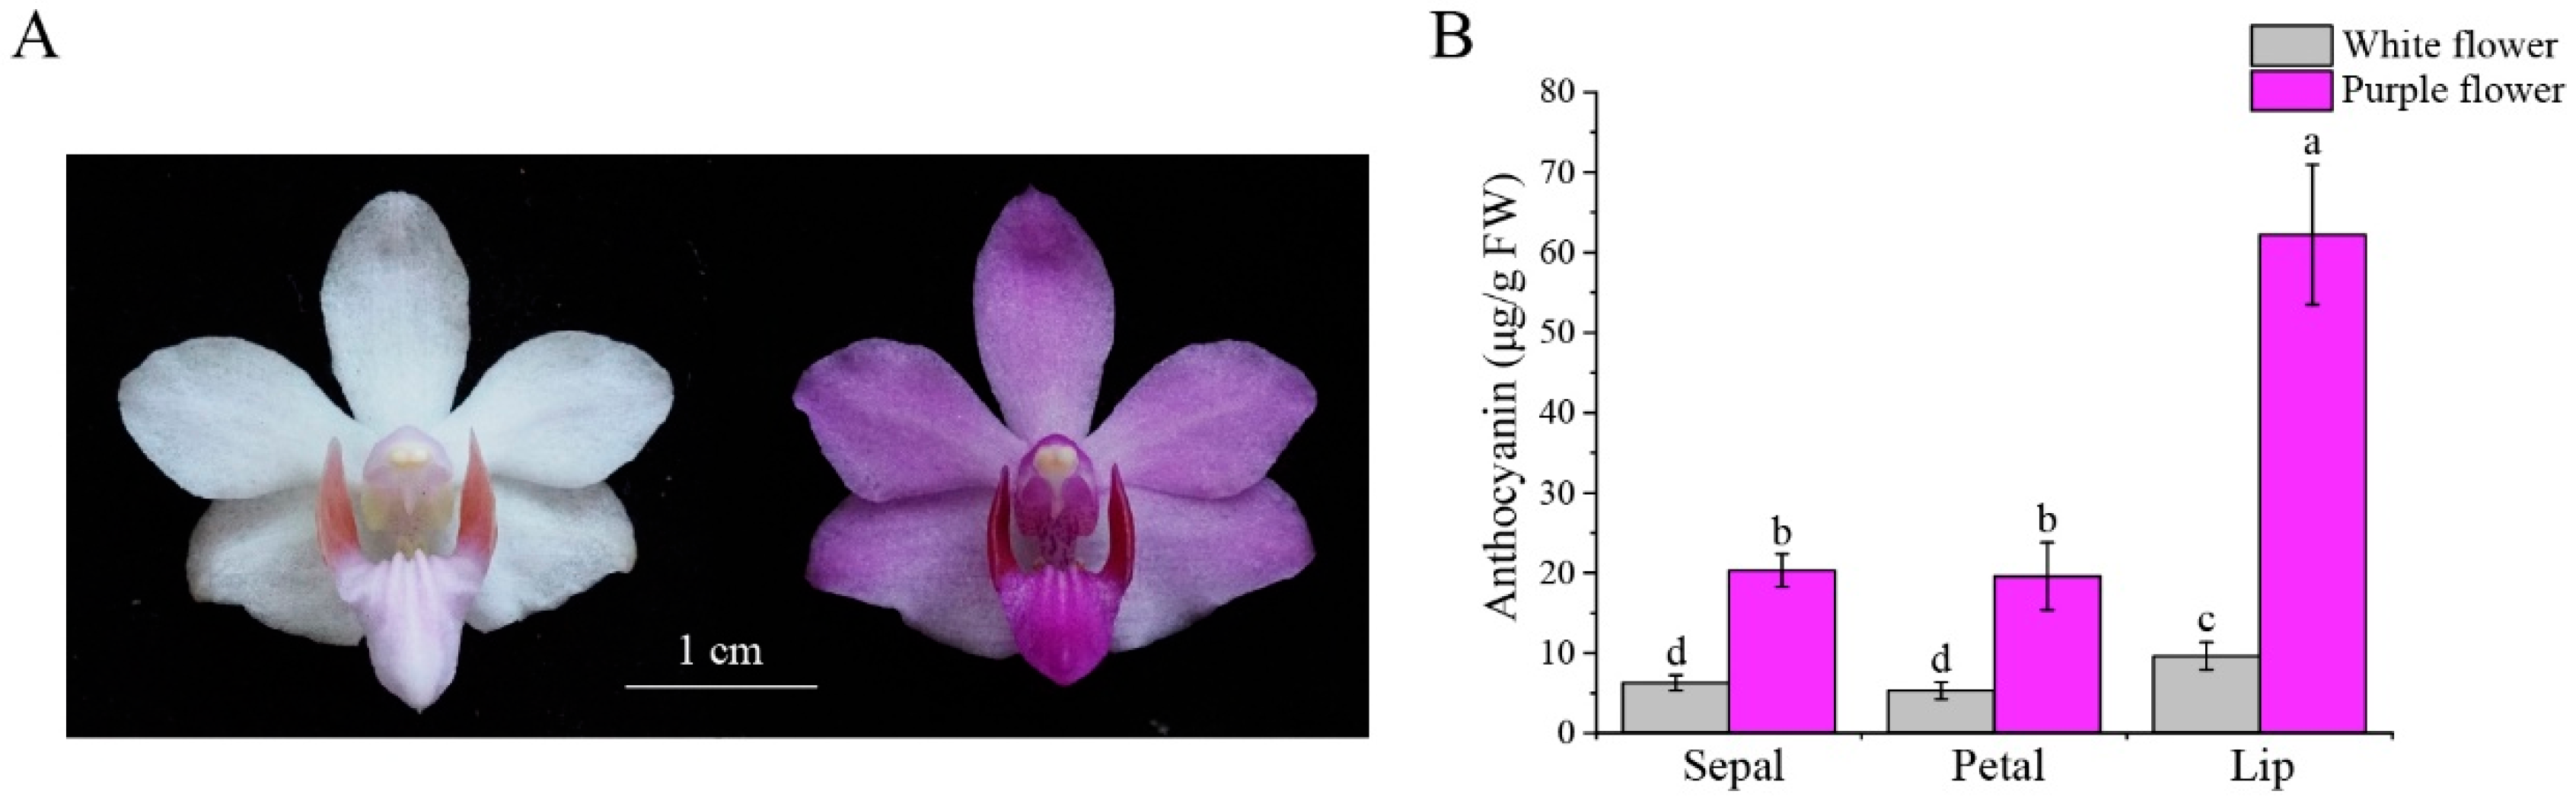
3.1. The Flower Color of P. pulcherrima Is Related to the Content of Anthocyanin
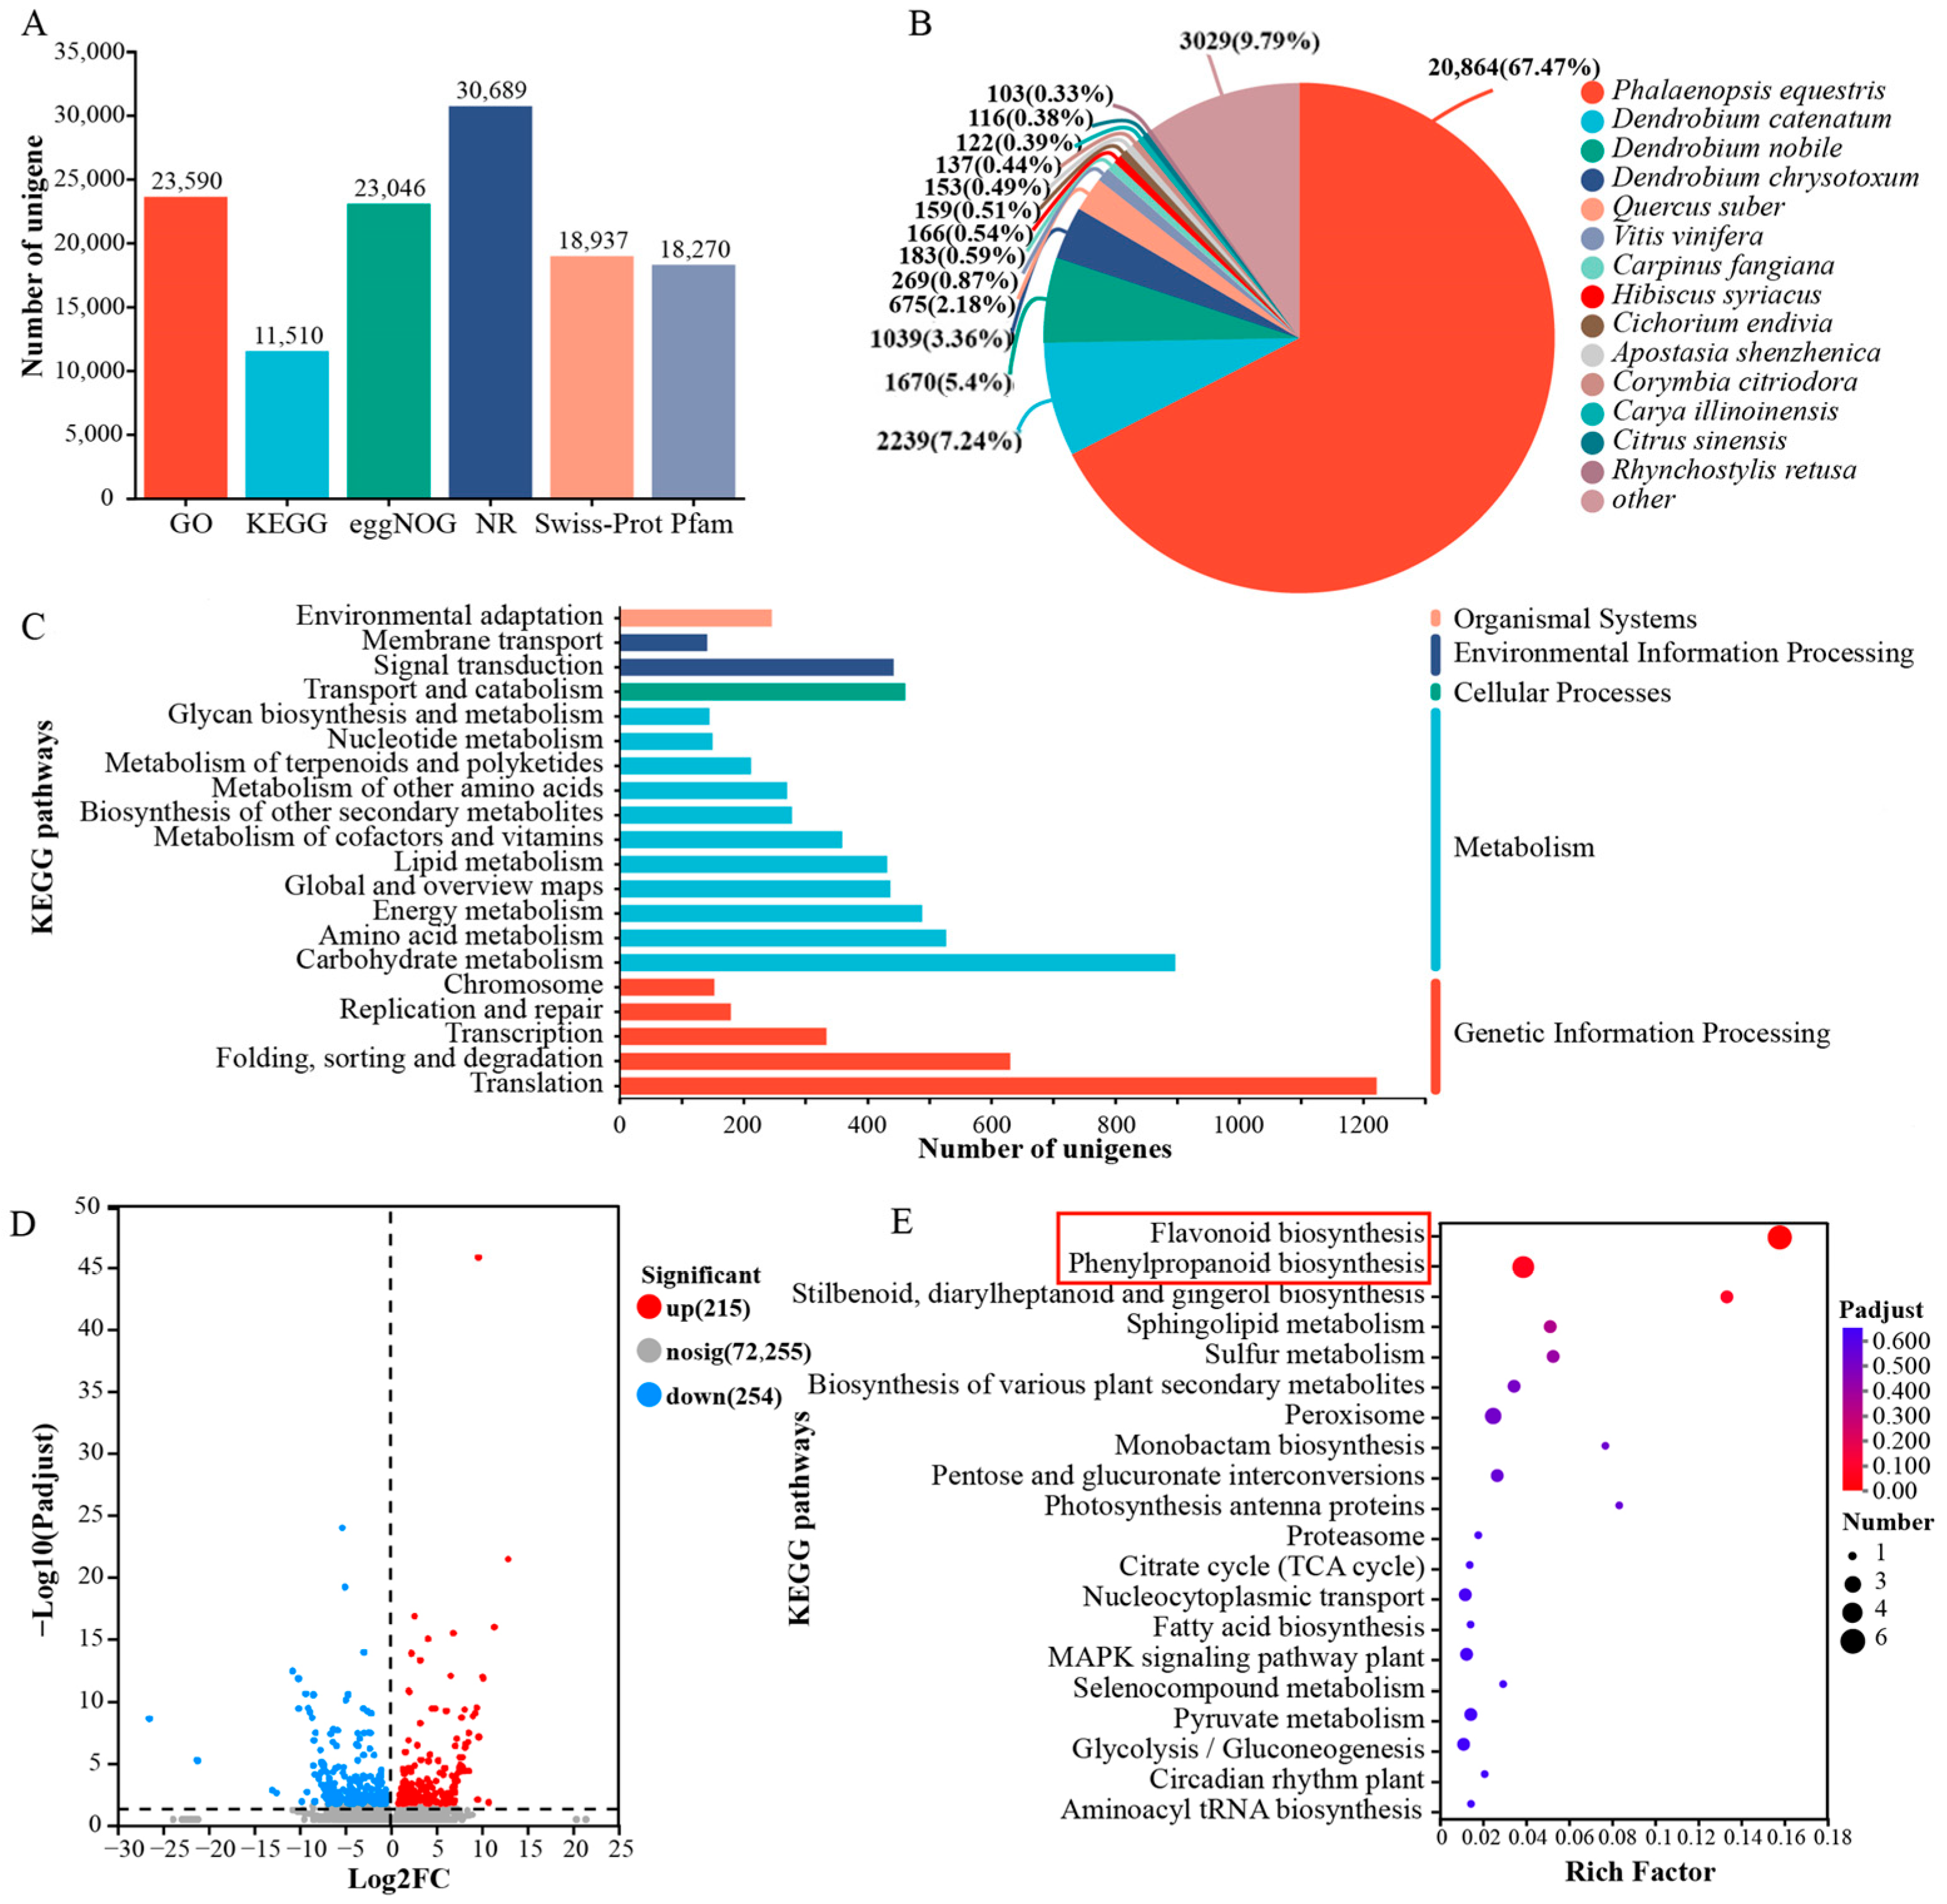
3.2. Transcriptome Data Analysis of White and Purple Flowers
3.3. Analysis of Anthocyanin Biosynthesis Pathway Genes
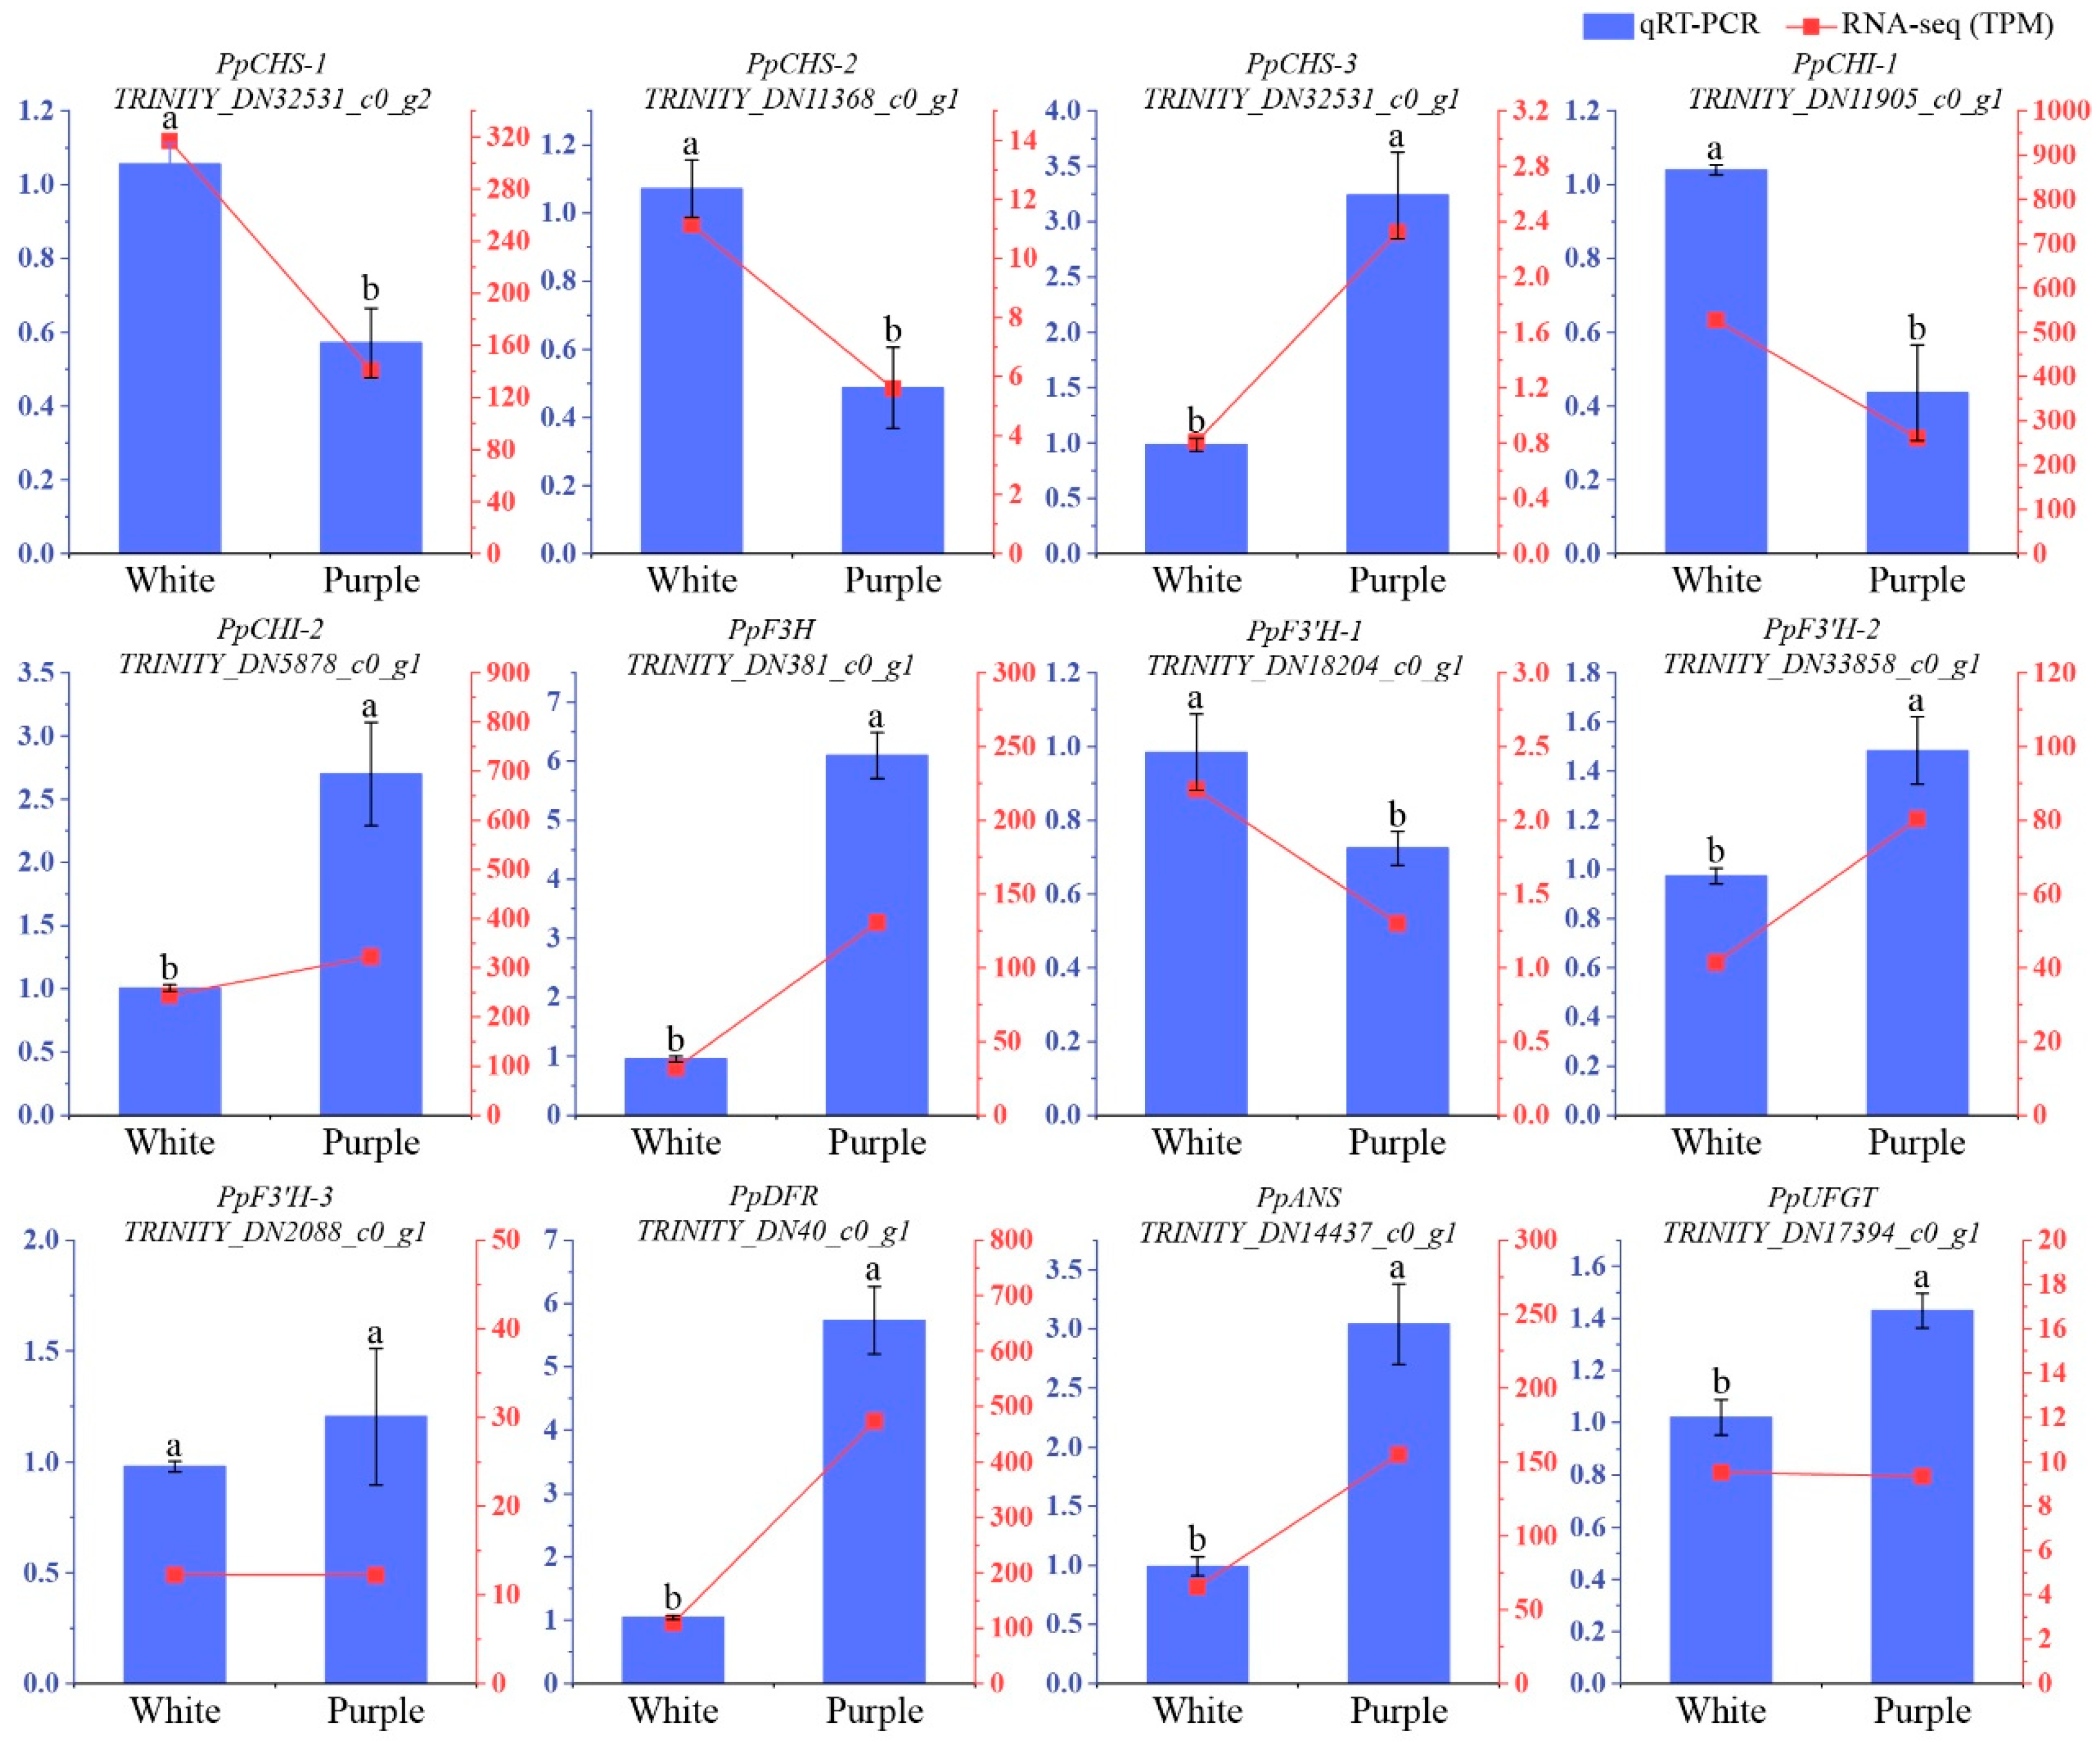
3.4. Validate RNA-Seq Dataset Using qRT-PCR
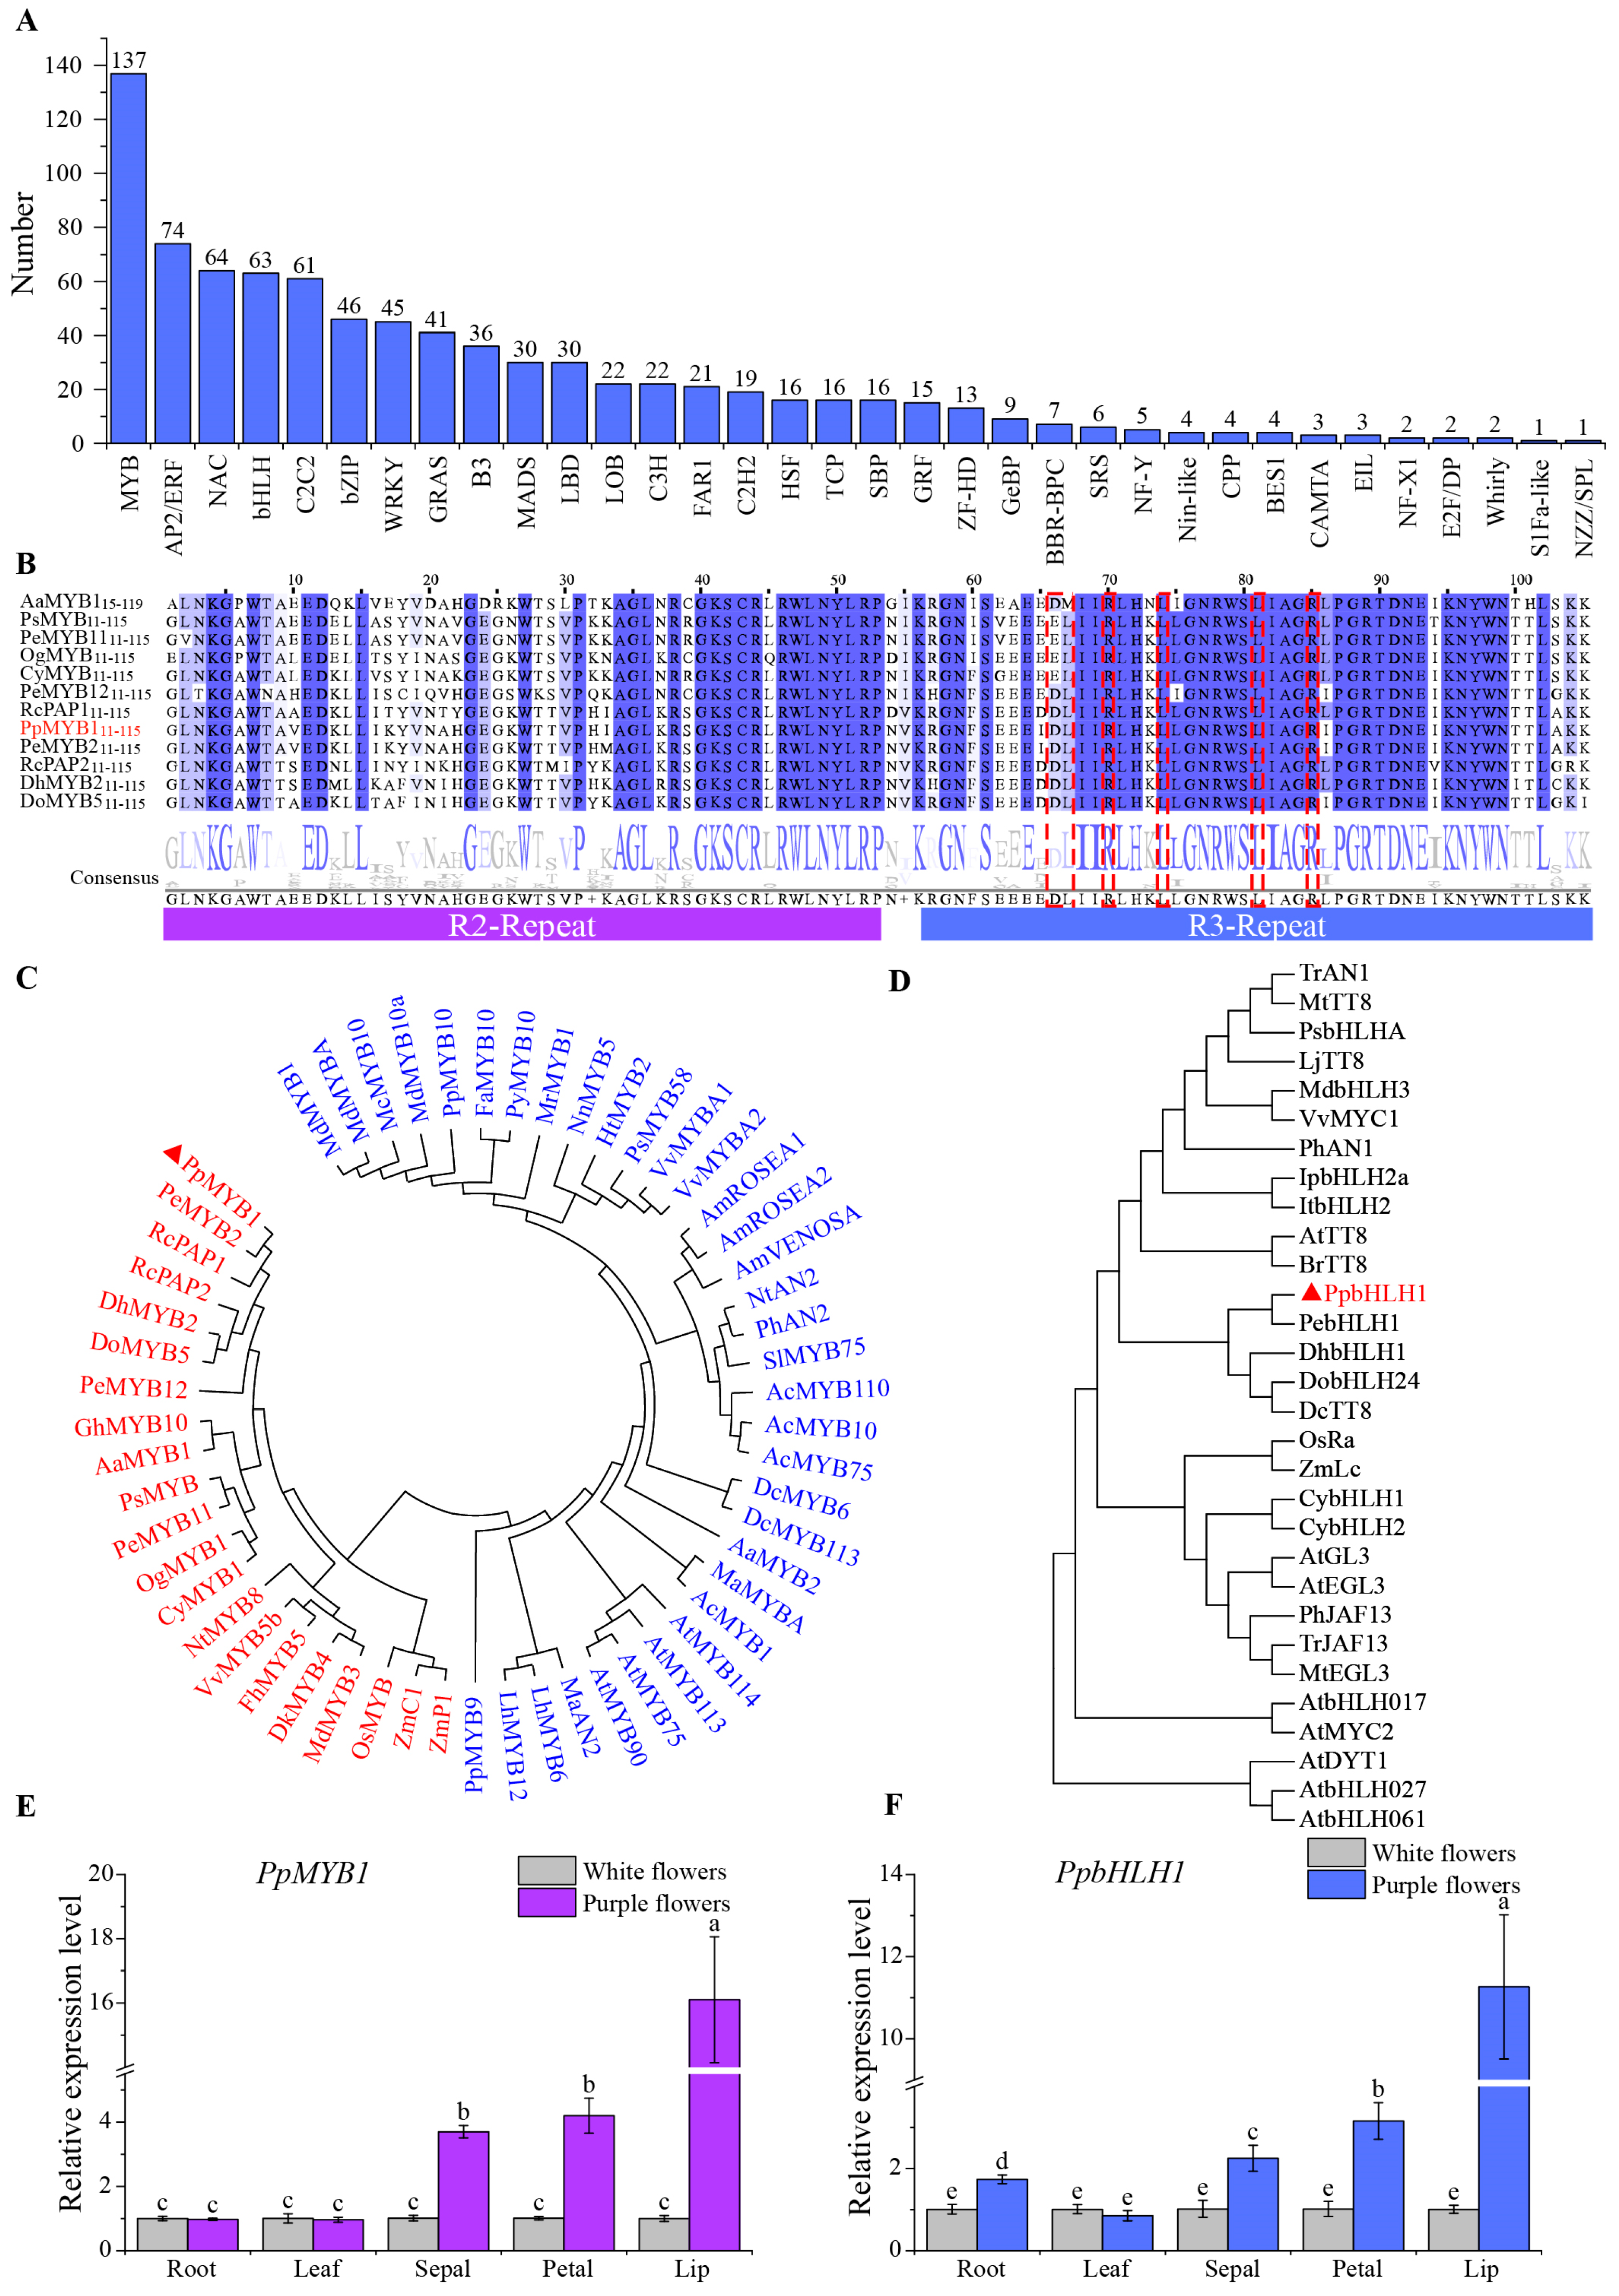
3.5. Identification and Cloning of Key Transcription Factors
3.6. The Transient Overexpression of PpMYB1 and PpbHLH1 Enhances Anthocyanin Accumulation
3.7. Stable Transformation of PpMYB1 and PpbHLH1 Genes in Tobacco
3.8. Transcriptional Regulation of Key Genes Involved in Anthocyanin Biosynthesis by PpMYB1 and PpbHLH1
4. Discussion
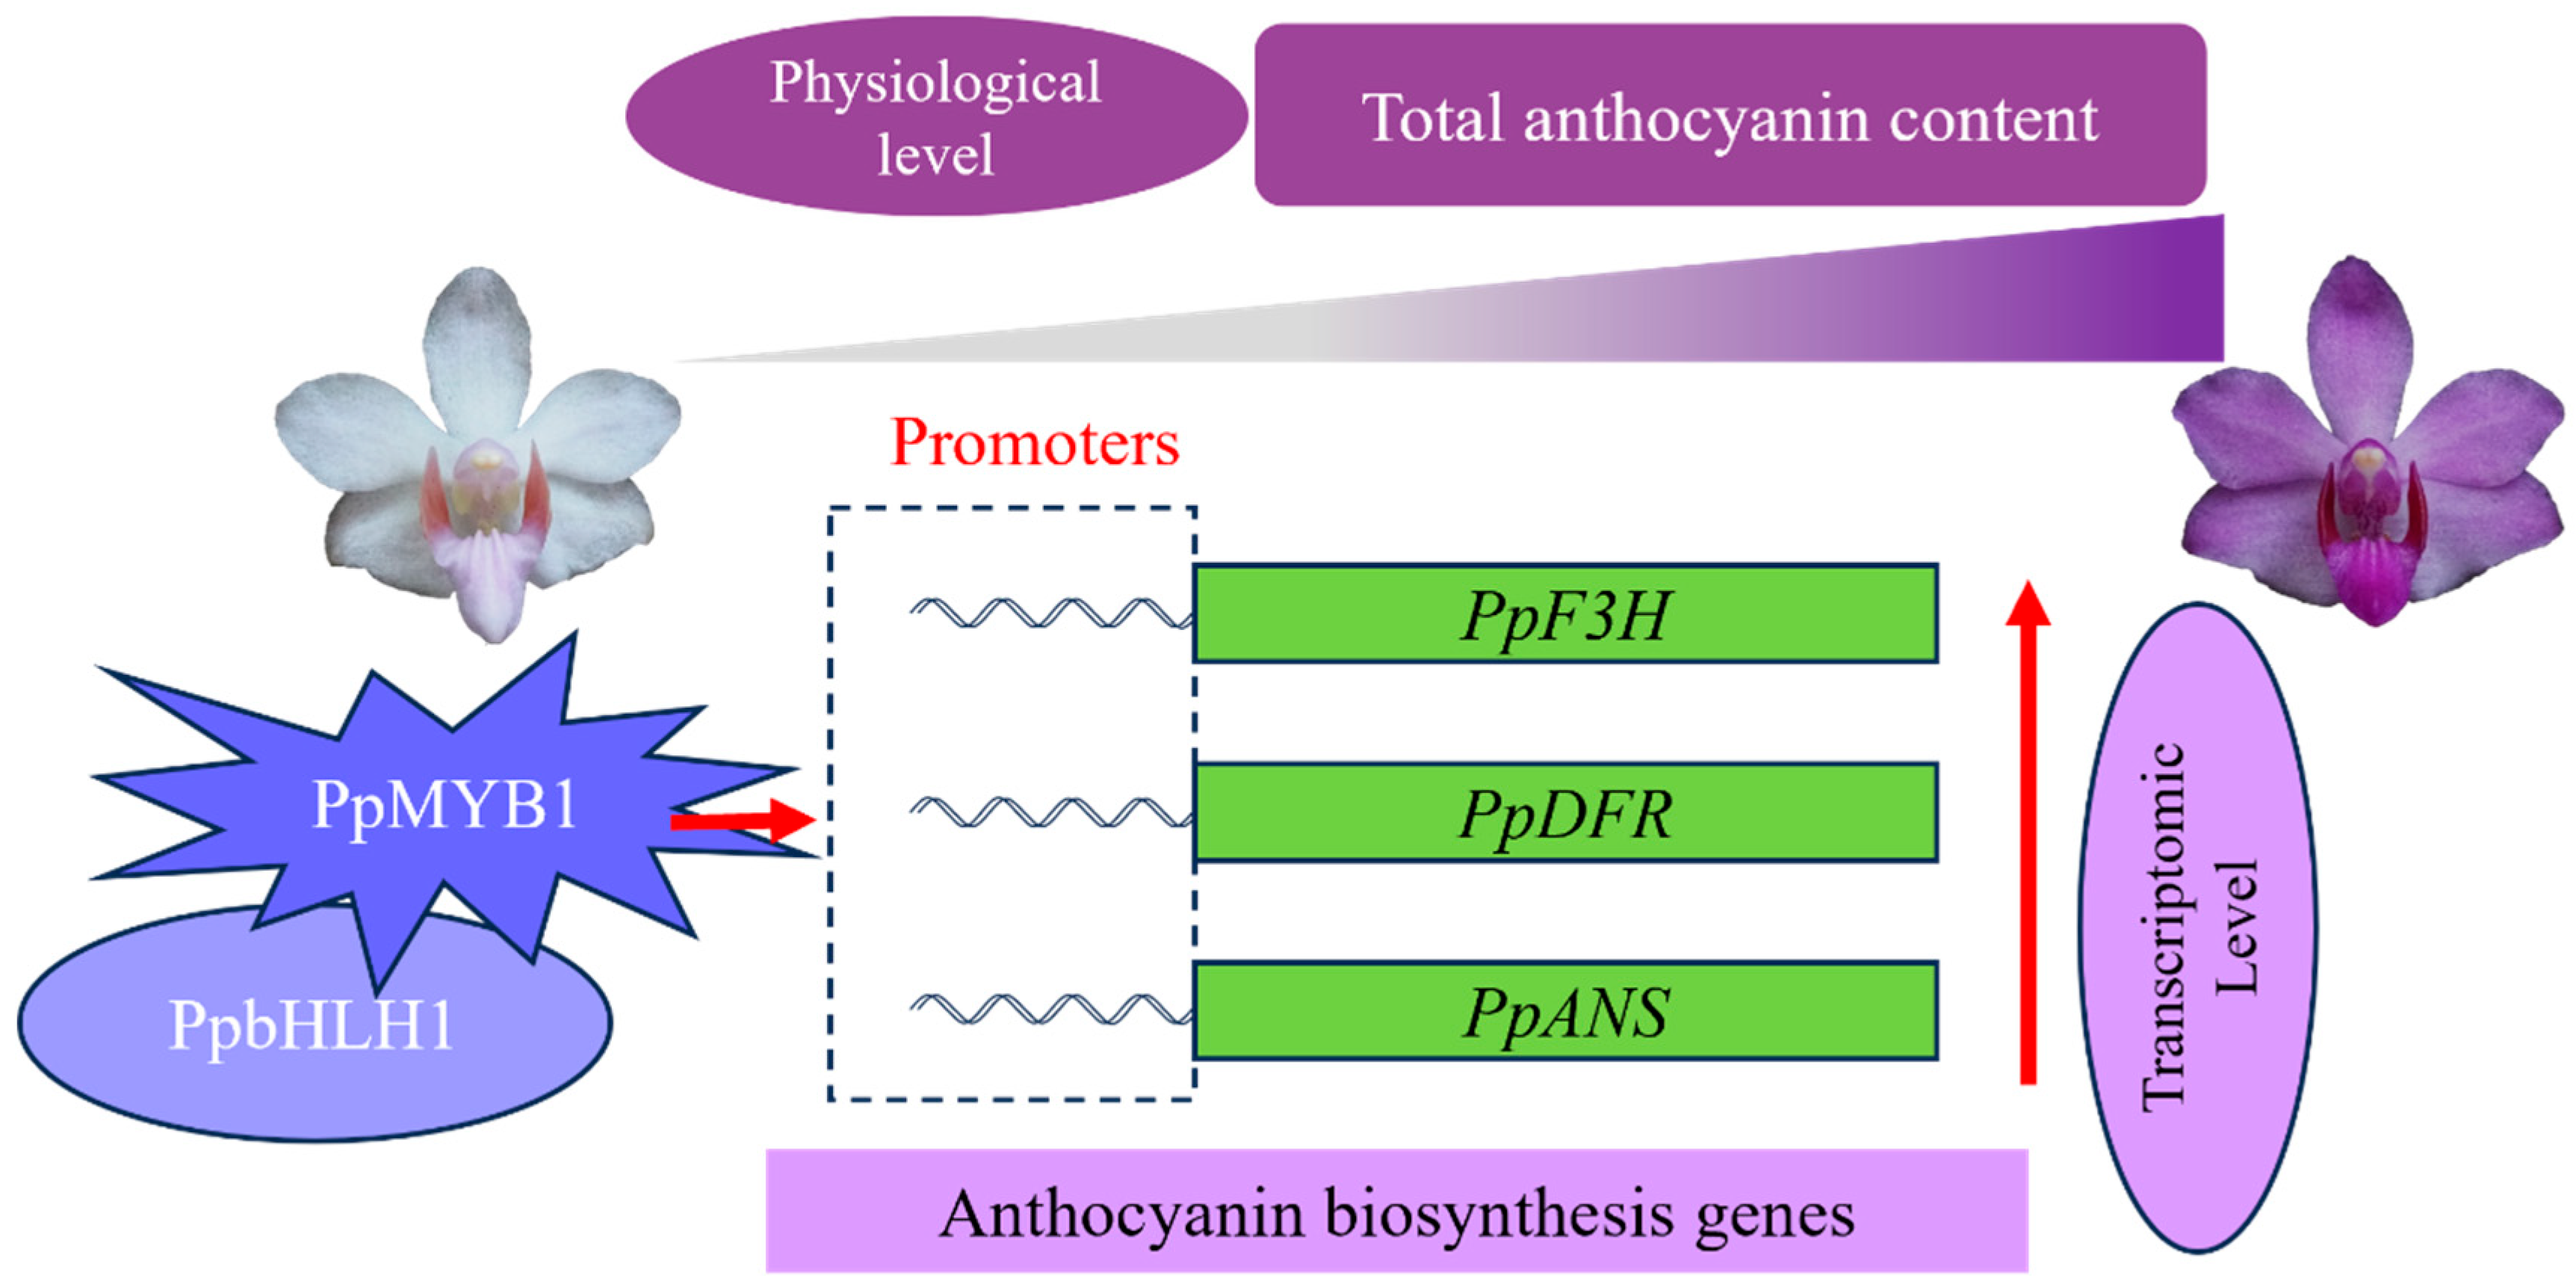
5. Conclusions
Supplementary Materials
Author Contributions
Funding
Institutional Review Board Statement
Informed Consent Statement
Data Availability Statement
Conflicts of Interest
Abbreviations
References
- Chen, X.Q.; Jeffrey, J.W. Flora of China; Science Press: Beijing, China, 2009; Volume 25, pp. 445–446. [Google Scholar]
- Ke, H.L.; Song, X.Q.; Tan, Z.Q.; Liu, H.X.; Luo, Y.B. Endophytic fungi diversity in root of Doritis pulcherrima (Orchidaceae). Biodivers. Sci. 2007, 15, 456–462. [Google Scholar]
- Zhang, Z.; Song, X.Q.; Zhu, G.P.; Huang, M.J. Study on flowering phenology and reproductive features of Phalaenopsis pulcherrima (Orchidaceae). Chin. J. Trop. Crops 2013, 34, 1223–1227. [Google Scholar]
- Yang, Q.; Song, X.Q.; Hu, X.W.; Zhu, G.P. Niche characteristics of Phalaenopsis pulcherrima (Orchidaceae) with two ecotypes in Bawangling Nature Reserve, Hainan Island. Guihaia 2013, 33, 786–790. [Google Scholar]
- Yan, H.L.; Pei, X.N.; Zhang, H.; Li, X.; Zhang, X.X.; Zhao, M.H.; Chiang, V.L.; Sederoff, R.R.; Zhao, X.Y. MYB-mediated regulation of anthocyanin biosynthesis. Int. J. Mol. Sci. 2021, 22, 3103. [Google Scholar] [CrossRef] [PubMed]
- Hichri, I.; Barrieu, F.; Bogs, J.; Kappel, C.; Delrot, S.; Lauvergeat, V. Recent advances in the transcriptional regulation of the flavonoid biosynthetic pathway. J. Exp. Bot. 2011, 62, 2465–2483. [Google Scholar] [CrossRef] [PubMed]
- Gai, Z.S.; Wang, Y.; Ding, Y.Q.; Qian, W.J.; Qiu, C.; Xie, H.; Sun, L.T.; Jiang, Z.W.; Ma, Q.P.; Wang, L.J.; et al. Exogenous abscisic acid induces the lipid and flavonoid metabolism of tea plants under drought stress. Sci. Rep. 2020, 10, 12275. [Google Scholar] [CrossRef]
- Winkel-Shirley, B. Flavonoid biosynthesis. A colorful model for genetics, biochemistry, cell biology, and biotechnology. Plant Physiol. 2001, 126, 485–493. [Google Scholar] [CrossRef]
- Bartel, B.; Matsuda, S.P.T. Seeing Red. Science 2003, 299, 352–353. [Google Scholar] [CrossRef]
- Springob, K.; Nakajima, J.; Yamazaki, M.; Saito, K. Recent advances in the biosynthesis and accumulation of anthocyanins. Nat. Prod. Rep. 2003, 20, 288–303. [Google Scholar] [CrossRef]
- Liang, C.M.; Ge, W.J.; Feng, Y.Y.; Wang, M.J.; Zan, S.W.; Xie, H.H.; Yu, F.C.; Guan, P.Y.; Liang, J.J.; Wen, P.F. Transcription factor VvbHLH92 negatively regulates salicylic acid mediated proanthocyanidins biosynthesis in grapevine. Sci. Hortic. 2025, 341, 113989. [Google Scholar] [CrossRef]
- Fu, M.; Li, G.H.; Lu, M.T.; Jiang, S.Z.; Karamat, U.; Khan, I.; Guo, J.X. BrGSTF12, an anthocyanin-related glutathione S-transferase gene, is essential for light-induced anthocyanin accumulation in zicaitai (Brassica Rapa Var. purpuraria). BMC Plant Biol. 2025, 25, 468. [Google Scholar] [CrossRef] [PubMed]
- Wang, D.; Liu, G.L.; Yang, J.; Shi, G.F.; Niu, Z.Q.; Liu, H.J.; Xu, N.; Wang, L. Integrated metabolomics and transcriptomics reveal molecular mechanisms of corolla coloration in Rhododendron dauricum L. Plant Physiol. Biochem. 2024, 207, 108438. [Google Scholar]
- Koseki, M.; Goto, K.; Masuta, C.; Kanazawa, A. The star-type color pattern in Petunia hybrida ‘Red star’ flowers is induced by sequence-specific degradation of chalcone synthase RNA. Plant Cell Physiol. 2005, 46, 1879–1883. [Google Scholar] [CrossRef] [PubMed]
- Tanaka, Y.; Sasaki, N.; Ohmiya, A. Biosynthesis of plant pigments: Anthocyanins, betalains and carotenoids. Plant J. 2008, 54, 733–749. [Google Scholar] [CrossRef]
- Itoh, Y.; Higeta, D.; Suzuki, A.; Yoshida, H.; Ozeki, Y. Excision of transposable elements from the chalcone isomerase and dihydroflavonol 4-reductase genes may contribute to the variegation of the yellow-flowered carnation (Dianthus caryophyllus). Plant Cell Physiol. 2002, 43, 578–585. [Google Scholar] [CrossRef]
- Xu, P.B.; Li, X.Y.; Fan, J.M.; Tian, S.H.; Cao, M.H.; Lin, A.Q.; Gao, Q.H.; Xiao, K.; Wang, C.; Kuang, H.Y.; et al. An arginine-to-histidine mutation in flavanone-3-hydroxylase results in pink strawberry fruits. Plant Physiol. 2023, 193, 1849–1865. [Google Scholar] [CrossRef]
- Zuker, A.; Tzfira, T.; Ben-Meir, H.; Ovadis, M.; Shklarman, E.; Itzhaki, H.; Forkmann, G.; Martens, S.; Neta-Sharir, I.; Weiss, D.; et al. Modification of flower color and fragrance by antisense suppression of the flavanone 3-hydroxylase gene. Mol. Breed. 2002, 9, 33–41. [Google Scholar] [CrossRef]
- Pattanaik, S.; Kong, Q.; Zaitlin, D.; Werkman, J.R.; Xie, C.H.; Patra, B.; Yuan, L. Isolation and functional characterization of a floral tissue-specific R2R3 MYB regulator from tobacco. Planta 2010, 231, 1061–1076. [Google Scholar] [CrossRef]
- Shen, G.A.; Wu, R.R.; Xia, Y.Y.; Pang, Y.Z. Identification of Transcription Factor Genes and Functional Characterization of PlMYB1 from Pueraria lobata. Front. Plant Sci. 2021, 12, 743518. [Google Scholar] [CrossRef]
- Wang, Y.C.; Yin, H.T.; Long, Z.X.; Zhu, W.J.; Yin, J.M.; Song, X.Q.; Li, C.H. DhMYB2 and DhbHLH1 regulates anthocyanin accumulation via activation of late biosynthesis genes in Phalaenopsis-type Dendrobium. Front. Plant Sci. 2022, 13, 1046134. [Google Scholar] [CrossRef]
- Yan, J.; Zeng, H.; Chen, W.; Zheng, S.; Luo, J.; Jiang, H.; Yang, B.; Farag, M.A.; Lou, H.; Song, L.; et al. Effects of tree age on flavonoids and antioxidant activity in Torreya grandis nuts via integrated metabolome and transcriptome analyses. Food Front. 2023, 4, 358–367. [Google Scholar] [CrossRef]
- Wang, Y.; Tu, H.X.; Zhang, J.; Wang, H.; Liu, Z.S.; Zhou, J.T.; He, W.; Lin, Y.X.; Zhang, Y.T.; Li, M.Y.; et al. Identifying potential anthocyanin biosynthesis regulator in Chinese cherry by comprehensive genome-wide characterization of the R2R3-MYB transcription factor gene family. BMC Genom. 2024, 25, 784. [Google Scholar] [CrossRef] [PubMed]
- Ma, S.Q.; Zhou, H.L.; Ren, T.T.; Yu, E.R.; Feng, B.; Wang, J.Y.; Zhang, C.S.; Zhou, C.; Li, Y.Q. Integrated transcriptome and metabolome analysis revealed that HaMYB1 modulates anthocyanin accumulation to deepen sunflower flower color. Plant Cell Rep. 2024, 43, 74. [Google Scholar] [CrossRef]
- Ramsay, N.A.; Glover, B.J. MYB-bHLH-WD40 protein complex and the evolution of cellular diversity. Trends Plant Sci. 2005, 10, 63–70. [Google Scholar] [CrossRef] [PubMed]
- Paz-Ares, J.; Ghosal, D.; Wienand, U.; Peterson, P.A.; Saedler, H. The regulatory c1 locus of Zea mays encodes a protein with homology to myb proto-oncogene products and with structural similarities to transcriptional activators. EMBO J. 1987, 6, 3553–3558. [Google Scholar] [CrossRef]
- Lang, X.A.; Li, N.; Li, L.F.; Zhang, S.Z. Integrated metabolome and transcriptome analysis uncovers the role of anthocyanin metabolism in Michelia maudiae. Int. J. Genom. 2019, 2019, 4393905. [Google Scholar] [CrossRef]
- Wang, X.H.; Li, L.H.; Liu, C.X.; Zhang, M.H.; Wen, Y.F. An integrated metabolome and transcriptome analysis of the Hibiscus syriacus L. petals reveal the molecular mechanisms of anthocyanin accumulation. Front. Genet. 2022, 13, 995748. [Google Scholar] [CrossRef]
- Shao, D.N.; Liang, Q.; Wang, X.F.; Zhu, Q.H.; Liu, F.; Li, Y.J.; Zhang, X.Y.; Yang, Y.L.; Sun, J.; Xue, F. Comparative metabolome and transcriptome analysis of anthocyanin biosynthesis in white and pink petals of cotton (Gossypium hirsutum L.). Int. J. Mol. Sci. 2022, 23, 10137. [Google Scholar] [CrossRef]
- Ju, Y.L.; Wang, W.N.; Yue, X.F.; Xue, W.; Zhang, Y.L.; Fang, Y.L. Integrated metabolomic and transcriptomic analysis reveals the mechanism underlying the accumulation of anthocyanins and other flavonoids in the flesh and skin of teinturier grapes. Plant Physiol. Biochem. 2023, 197, 107667. [Google Scholar] [CrossRef]
- Dong, X.M.; Zhang, W.; Tu, M.L.; Zhang, S.B. Spatial and temporal regulation of flower coloration in Cymbidium lowianum. Plant Cell Environ. 2025, 48, 3844–3860. [Google Scholar] [CrossRef]
- Baudry, A.; Heim, M.A.; Dubreucq, B.; Caboche, M.; Weisshaar, B.; Lepiniec, L. TT2, TT8, and TTG1 synergistically specify the expression of BANYULS and proanthocyanidin biosynthesis in Arabidopsis thaliana. Plant J. 2004, 39, 366–380. [Google Scholar] [CrossRef] [PubMed]
- Li, J.; Wu, K.L.; Li, L.; Ma, G.H.; Fang, L.; Zeng, S.J. AcMYB1 interacts with AcbHLH1 to regulate anthocyanin biosynthesis in Aglaonema commutatum. Front. Plant Sci. 2022, 13, 886313. [Google Scholar] [CrossRef]
- Li, Y.Q.; Shan, X.T.; Zhou, L.D.; Gao, R.F.; Yang, S.; Wang, S.C.; Wang, L.; Gao, X. The R2R3-MYB factor FhMYB5 from contributes to the regulation of anthocyanin and proanthocyanidin in biosynthesis. Front. Plant Sci. 2019, 9, 1935. [Google Scholar] [CrossRef]
- Li, J.; Wu, K.L.; Li, L.; Ma, G.H.; Fang, L.; Zeng, S.J. Identification of HpMYB1 inducing anthocyanin accumulation in Hippeastrum hybridum tepals by RNA-seq. BMC Plant Biol. 2023, 23, 594. [Google Scholar] [CrossRef] [PubMed]
- Hsu, C.C.; Chen, Y.Y.; Tsai, W.C.; Chen, W.H.; Chen, H.H. Three R2R3-MYB transcription factors regulate distinct floral pigmentation patterning in Phalaenopsis spp. Plant Physiol. 2015, 168, 175–191. [Google Scholar] [CrossRef]
- Chiou, C.Y.; Yeh, K.W. Differential expression of MYB gene (OgMYB1) determines color patterning in floral tissue of Oncidium Gower Ramsey. Plant Mol. Biol. 2008, 66, 379–388. [Google Scholar] [CrossRef]
- Albert, N.W.; Davies, K.M.; Lewis, D.H.; Zhang, H.; Montefiori, M.; Brendolise, C.; Boase, M.R.; Ngo, H.; Jameson, P.E.; Schwinn, K.E. A Conserved Network of Transcriptional a ctivators and repressors regulates anthocyanin pigmentation in Eudicots. Plant Cell 2014, 26, 962–980. [Google Scholar] [CrossRef]
- Hu, X.M.; Liang, Z.H.; Sun, T.X.; Huang, L.; Wang, Y.P.; Chan, Z.L.; Xiang, L. The R2R3-MYB transcriptional repressor TgMYB4 negatively regulates anthocyanin biosynthesis in Tulips (Tulipa gesneriana L.). Int. J. Mol. Sci. 2024, 25, 563. [Google Scholar] [CrossRef] [PubMed]
- Anwar, M.; Wang, G.Q.; Wu, J.C.; Waheed, S.; Allan, A.C.; Zeng, L.H. Ectopic overexpression of a novel R2R3-MYB, NtMYB2 from Chinese Narcissus represses anthocyanin biosynthesis in tobacco. Molecules 2018, 23, 781. [Google Scholar] [CrossRef]
- Aharoni, A.; De Vos, C.H.R.; Wein, M.; Sun, Z.K.; Greco, R.; Kroon, A.; Mol, J.N.M.; O’Connell, A.P. The strawberry FaMYB1 transcription factor suppresses anthocyanin and flavonol accumulation in transgenic tobacco. Plant J. 2001, 28, 319–332. [Google Scholar] [CrossRef]
- Wang, R.; Mao, C.J.; Ming, F. PeMYB4L interacts with PeMYC4 to regulate anthocyanin biosynthesis in Phalaenopsis orchid. Plant Sci. 2022, 324, 111423. [Google Scholar] [CrossRef] [PubMed]
- Love, M.I.; Huber, W.; Anders, S. Moderated estimation of fold change and dispersion for RNA-seq data with DESeq2. Genome Biol. 2014, 15, 550. [Google Scholar] [CrossRef] [PubMed]
- Livak, K.J.; Schmittgen, T.D. Analysis of relative gene expression data using real-time quantitative PCR and the 2−ΔΔCT method. Methods 2001, 25, 402–408. [Google Scholar] [CrossRef] [PubMed]
- Tamura, K.; Peterson, D.; Peterson, N.; Stecher, G.; Nei, M.; Kumar, S. MEGA5: Molecular evolutionary genetics analysis using maximum likelihood, evolutionary distance, and maximum parsimony methods. Mol. Biol. Evol. 2011, 28, 2731–2739. [Google Scholar] [CrossRef]
- Ye, K.Y.; Li, H.; Ding, Y.L.; Shi, Y.T.; Song, C.P.; Gong, Z.Z.; Yang, S.H. BRASSINOSTEROID-INSENSITIVE2 negatively regulates the stability of transcription factor ICE1 in response to cold stress in Arabidopsis. Plant Cell 2019, 31, 2682–2696. [Google Scholar] [CrossRef]
- Suo, J.W.; Liu, Y.; Yan, J.W.; Li, Q.X.; Chen, W.J.; Liu, Z.H.; Zhang, Z.Y.; Hu, Y.Y.; Yu, W.W.; Yan, J.W.; et al. Sucrose promotes cone enlargement via the TgNGA1-TgWRKY47-TgEXPA2 module in Torreya grandis. New Phytol. 2024, 243, 1823–1839. [Google Scholar] [CrossRef]
- Yin, X.R.; Allan, A.C.; Chen, K.S.; Ferguson, I.B. Kiwifruit EIL and ERF genes involved in Regulating fruit ripening. Plant Physiol. 2010, 153, 1280–1292. [Google Scholar] [CrossRef]
- Zhang, Z.; Gale, S.W.; Li, J.H.; Fischer, G.A.; Ren, M.X.; Song, X.Q. Pollen-mediated gene flow ensures connectivity among spatially discrete sub-populations of Phalaenopsis pulcherrima, a tropical food-deceptive orchid. BMC Plant Biol. 2019, 19, 597. [Google Scholar] [CrossRef]
- Bu, X.P.; Jiu, F.F.; Wang, F.T.; Chen, C.Z.; Yang, F.S. Response to drought stress Simulated by PEG of Phalaenopsis pulcherrima. J. Trop. Subtrop. Bot. 2020, 28, 53–61. [Google Scholar]
- Jin, X.H.; Li, D.Z.; Ren, Z.X.; Xiang, X.G. A generalized deceptive pollination system of Doritis pulcherrima (Aeridinae: Orchidaceae) with non-reconfigured pollinaria. BMC Plant Biol. 2012, 12, 67. [Google Scholar]
- Lu, R.X.; Song, M.Y.; Wang, Z.; Zhai, Y.L.; Hu, C.Y.; Perl, A.; Ma, H.Q. Independent flavonoid and anthocyanin biosynthesis in the flesh of a red-fleshed table grape revealed by metabolome and transcriptome co-analysis. BMC Plant Biol. 2023, 23, 361. [Google Scholar] [CrossRef] [PubMed]
- Pu, Q.M.; He, Z.H.; Xiang, C.Y.; Shi, S.M.; Zhang, L.C.; Yang, P. Integration of metabolome and transcriptome analyses reveals the mechanism of anthocyanin accumulation in purple radish leaves. Physiol. Mol. Biol. Plants 2022, 28, 1799–1811. [Google Scholar] [CrossRef] [PubMed]
- Li, X.L.; Fan, J.Z.; Luo, S.M.; Yin, L.; Liao, H.Y.; Cui, X.Q.; He, J.Z.; Zeng, Y.H.; Qu, J.J.; Bu, Z.Y. Comparative transcriptome analysis identified important genes and regulatory pathways for flower color variation in Paphiopedilum hirsutissimum. BMC Plant Biol. 2021, 21, 495. [Google Scholar] [CrossRef] [PubMed]
- Zhao, T.; Wei, Z.H.; Liu, H.F.; Dong, L.M. Integrated metabolome and transcriptome analyses reveal that the flavonoid metabolic pathway is associated with pigment differential accumulation in two colors of petaloid staminodes in Canna glauca. Horticulturae 2024, 10, 372. [Google Scholar] [CrossRef]
- Li, L.; Zhai, Y.H.; Luo, X.N.; Zhang, Y.; Shi, Q.Q. Comparative transcriptome analyses reveal genes related to pigmentation in the petals of red and white Primula vulgaris cultivars. Physiol. Mol. Biol. Plants 2019, 25, 1029–1041. [Google Scholar] [CrossRef]
- Ding, B.Q.; Yuan, Y.W. Testing the utility of fluorescent proteins in Mimulus lewisii by an Agrobacterium-mediated transient assay. Plant Cell Rep. 2016, 35, 771–777. [Google Scholar] [CrossRef]
- Liang, C.Y.; Rengasamy, K.P.; Huang, L.M.; Hsu, C.C.; Jeng, M.F.; Chen, W.H.; Chen, H.H. Assessment of violet-blue color formation in Phalaenopsis orchids. BMC Plant Biol. 2020, 20, 212. [Google Scholar] [CrossRef]
- Sun, Y.B.; Zhang, X.K.; Zhang, H.; Zhang, M.H.; Sun, S.K.; Han, W.Z.; Zhang, X.J.; Irfan, M.; Chen, L.J.; Zhang, L. LvWRKY75 enhances the transcription of LvMYB5 and promotes anthocyanin biosynthesis in lily petals during the blooming phase. Physiol. Plant. 2025, 177, e70143. [Google Scholar] [CrossRef]
- Liu, Y.; Wang, S.Y.; Liu, X.; Wang, R.M.; Chen, W.J.; Suo, J.W.; Yan, J.W.; Wu, J.S. Agrobacterium-mediated transient expression in Torreya grandis cones: A simple and rapid tool for gene expression and functional gene assay. Sci. Hortic. 2024, 338, 113664. [Google Scholar] [CrossRef]
- Zhao, K.K.; Zhang, J.J.; Fan, Y.; Du, X.F.; Zhu, S.L.; Li, Z.F.; Qiu, D.; Cao, Z.H.; Ma, Q.; Li, Y.Y.; et al. PSC1, a basic/helix–loop–helix transcription factor controlling the purplish-red testa trait in peanut. J. Integr. Plant Biol. 2025, 67, 1364–1378. [Google Scholar] [CrossRef]
- Li, B.J.; Zheng, B.Q.; Wang, J.Y.; Tsai, W.C.; Lu, H.C.; Zou, L.H.; Wan, X.; Zhang, D.Y.; Qiao, H.J.; Liu, Z.J.; et al. New insight into the molecular mechanism of colour differentiation among floral segments in orchids. Commun. Biol. 2020, 3, 89. [Google Scholar] [CrossRef] [PubMed]
- Chai, D.; Yu, H. Recent advances in transgenic Orchid production. Orchid Sci. Biotechnol. 2007, 1, 34–39. [Google Scholar]
- Belarmino, M.M.; Mii, M. Agrobacterium-mediated genetic transformation of a phalaenopsis orchid. Plant Cell Rep. 2000, 19, 435–442. [Google Scholar] [CrossRef] [PubMed]
- Wang, J.; Zeng, S.J.; Chen, Z.L.; Wu, K.L.; Zhang, J.X.; Duan, J. Genetic transformation of Doritis pulcherrima (Orchidaceae) via ovary-injection. Chin. J. Trop. Crops 2013, 34, 1498–1501. [Google Scholar]
- Zhong, C.M.; Tang, Y.; Pang, B.; Li, X.K.; Yang, Y.P.; Deng, J.; Feng, C.Y.; Li, L.F.; Ren, G.P.; Wang, Y.Q.; et al. The R2R3-MYB transcription factor GhMYB1a regulates flavonol and anthocyanin accumulation in Gerbera hybrida. Hortic. Res. 2020, 7, 78. [Google Scholar] [CrossRef]
- Yang, K.; Hou, Y.B.; Wu, M.; Pan, Q.Y.; Xie, Y.L.; Zhang, Y.S.; Sun, F.H.; Zhang, Z.Z.; Wu, J.H. DoMYB5 and DobHLH24, Transcription factors involved in regulating anthocyanin accumulation in Dendrobium officinale. Int. J. Mol. Sci. 2023, 24, 7552. [Google Scholar] [CrossRef]

Disclaimer/Publisher’s Note: The statements, opinions and data contained in all publications are solely those of the individual author(s) and contributor(s) and not of MDPI and/or the editor(s). MDPI and/or the editor(s) disclaim responsibility for any injury to people or property resulting from any ideas, methods, instructions or products referred to in the content. |
© 2025 by the authors. Licensee MDPI, Basel, Switzerland. This article is an open access article distributed under the terms and conditions of the Creative Commons Attribution (CC BY) license (https://creativecommons.org/licenses/by/4.0/).
Share and Cite
Wen, J.; Li, J.; Wu, K.; Zeng, J.; Li, L.; Fang, L.; Zeng, S. Transcriptome Analysis Reveals PpMYB1 and PpbHLH1 Promote Anthocyanin Accumulation in Phalaenopsis pulcherrima Flowers. Biomolecules 2025, 15, 906. https://doi.org/10.3390/biom15070906
Wen J, Li J, Wu K, Zeng J, Li L, Fang L, Zeng S. Transcriptome Analysis Reveals PpMYB1 and PpbHLH1 Promote Anthocyanin Accumulation in Phalaenopsis pulcherrima Flowers. Biomolecules. 2025; 15(7):906. https://doi.org/10.3390/biom15070906
Chicago/Turabian StyleWen, Jianqiang, Ji Li, Kunlin Wu, Jingjue Zeng, Lin Li, Lin Fang, and Songjun Zeng. 2025. "Transcriptome Analysis Reveals PpMYB1 and PpbHLH1 Promote Anthocyanin Accumulation in Phalaenopsis pulcherrima Flowers" Biomolecules 15, no. 7: 906. https://doi.org/10.3390/biom15070906
APA StyleWen, J., Li, J., Wu, K., Zeng, J., Li, L., Fang, L., & Zeng, S. (2025). Transcriptome Analysis Reveals PpMYB1 and PpbHLH1 Promote Anthocyanin Accumulation in Phalaenopsis pulcherrima Flowers. Biomolecules, 15(7), 906. https://doi.org/10.3390/biom15070906