
Activation of Endoplasmic Reticulum-Localized Metabotropic Glutamate Receptor 5 (mGlu5) Triggers Calcium Release Distinct from Cell Surface Counterparts in Striatal Neurons


Abstract
1. Introduction
2. Materials and Methods
2.1. Materials
2.2. Plasmid Constructs
2.3. Primary Neuronal Culture and Transfection
2.4. Immunocytochemistry
2.5. Measurement of ER Ca2+ Dynamics
2.6. Confocal Microscopy and Data Analysis
2.7. Animal Studies
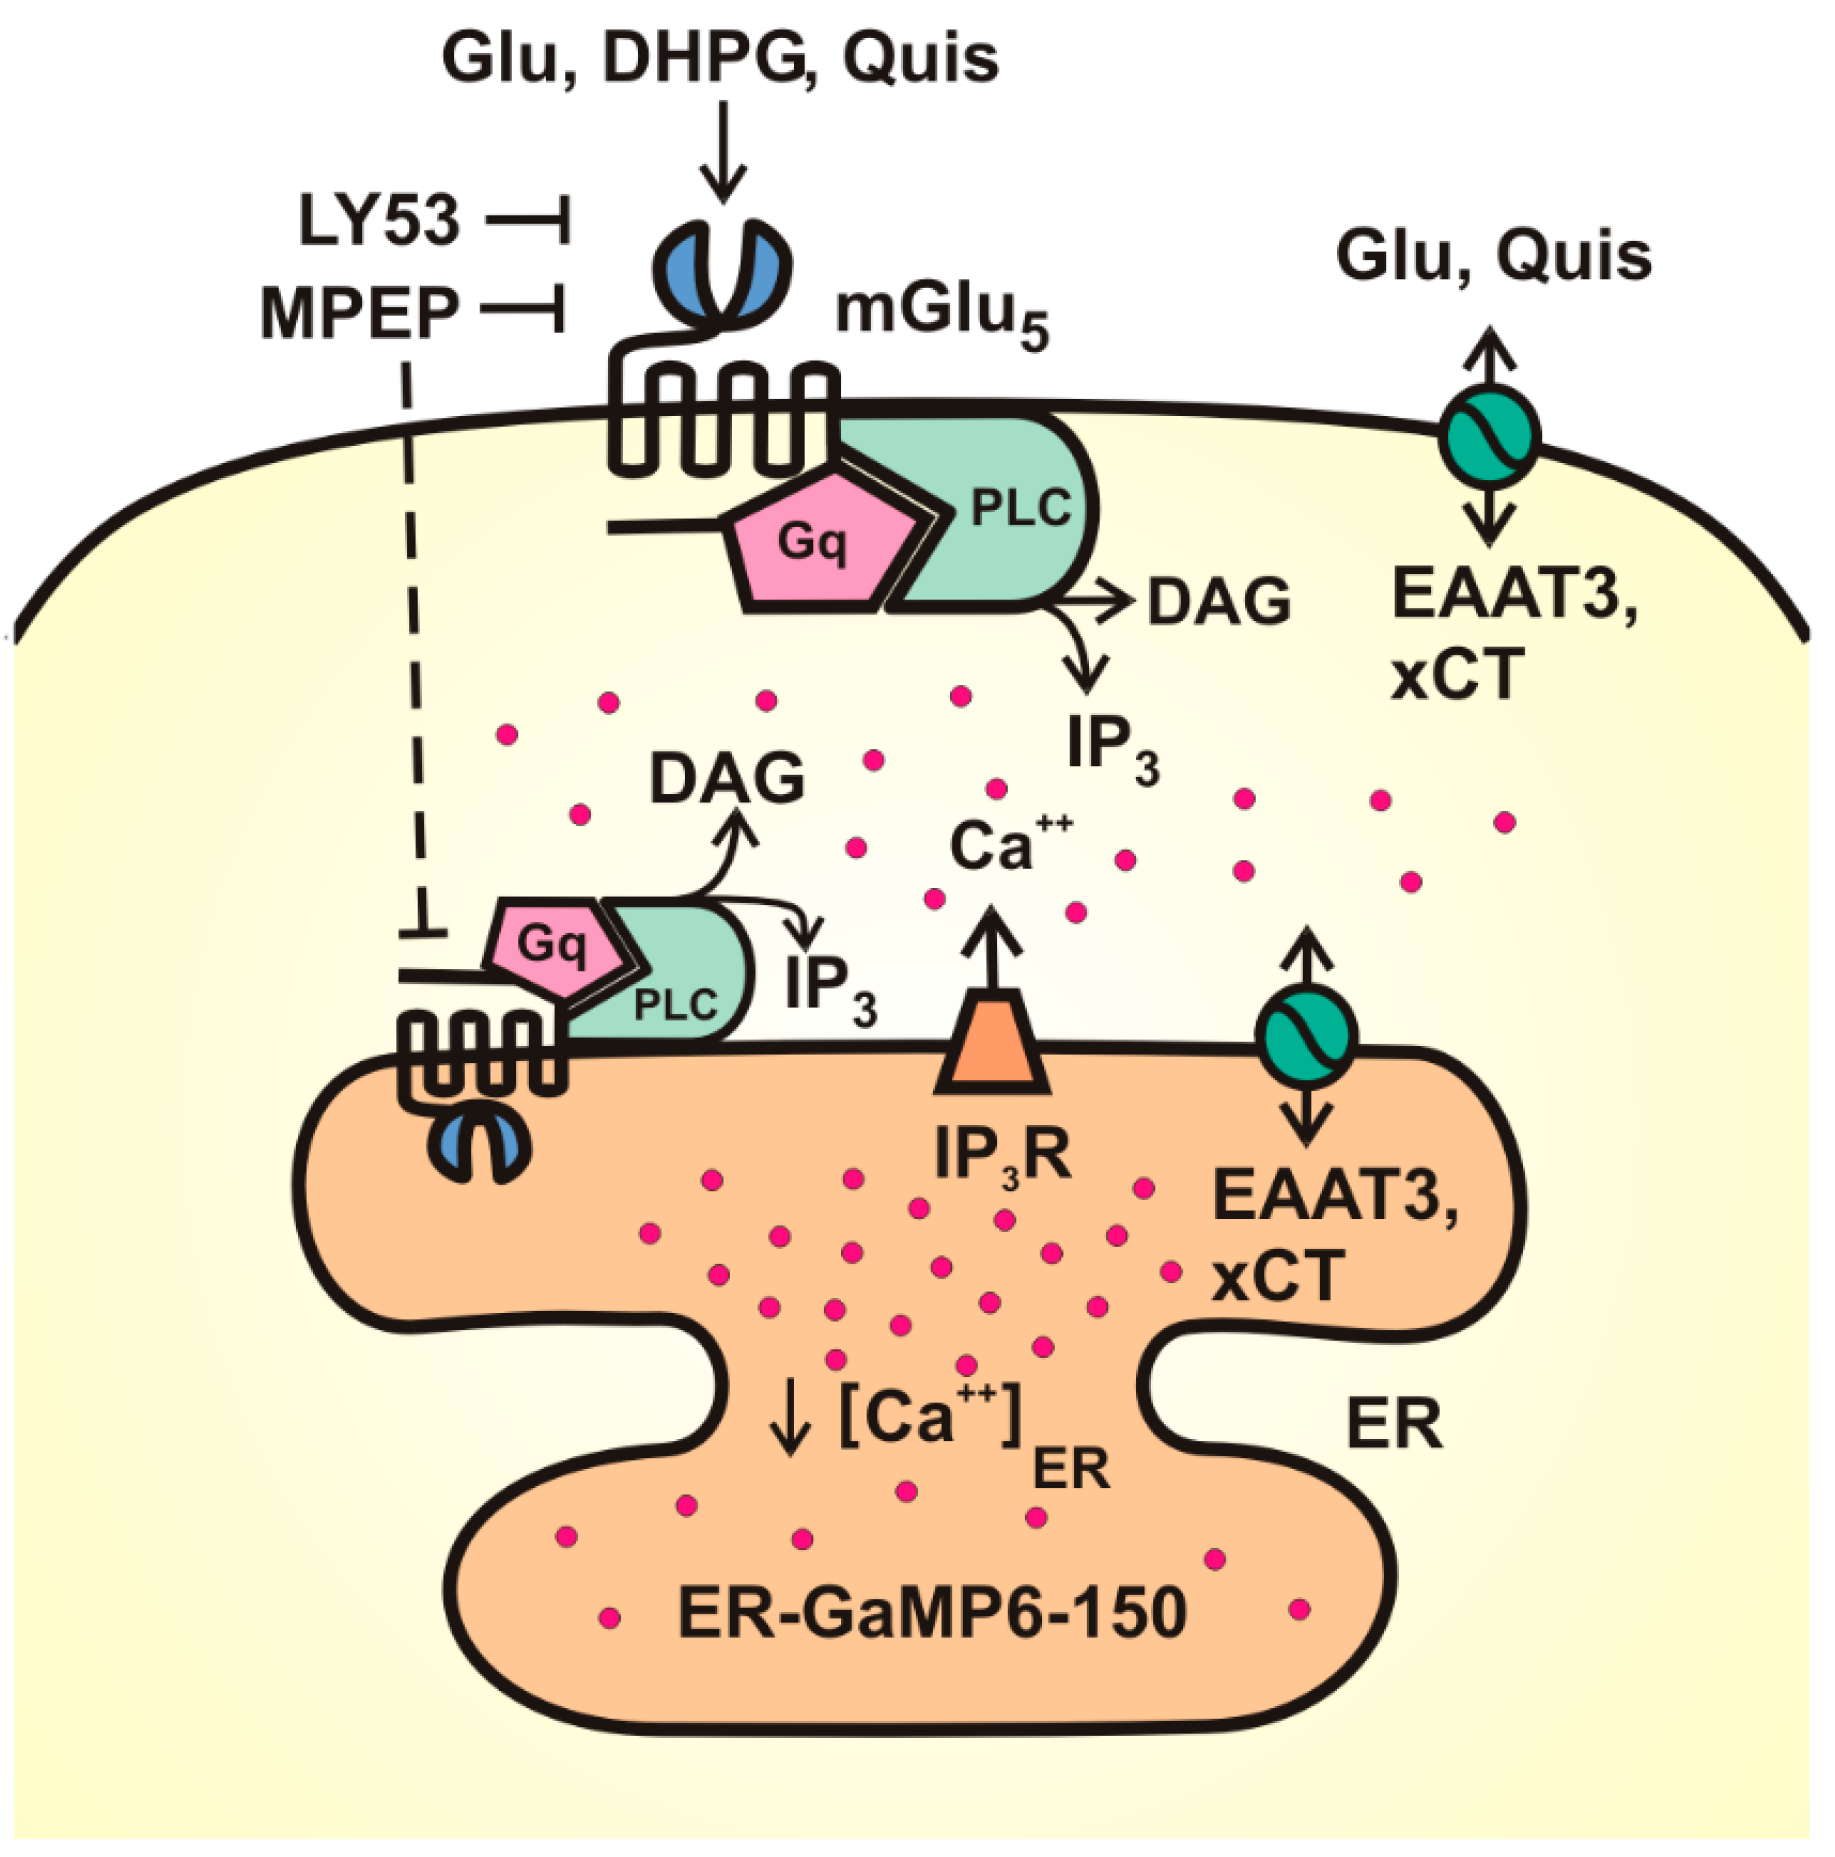
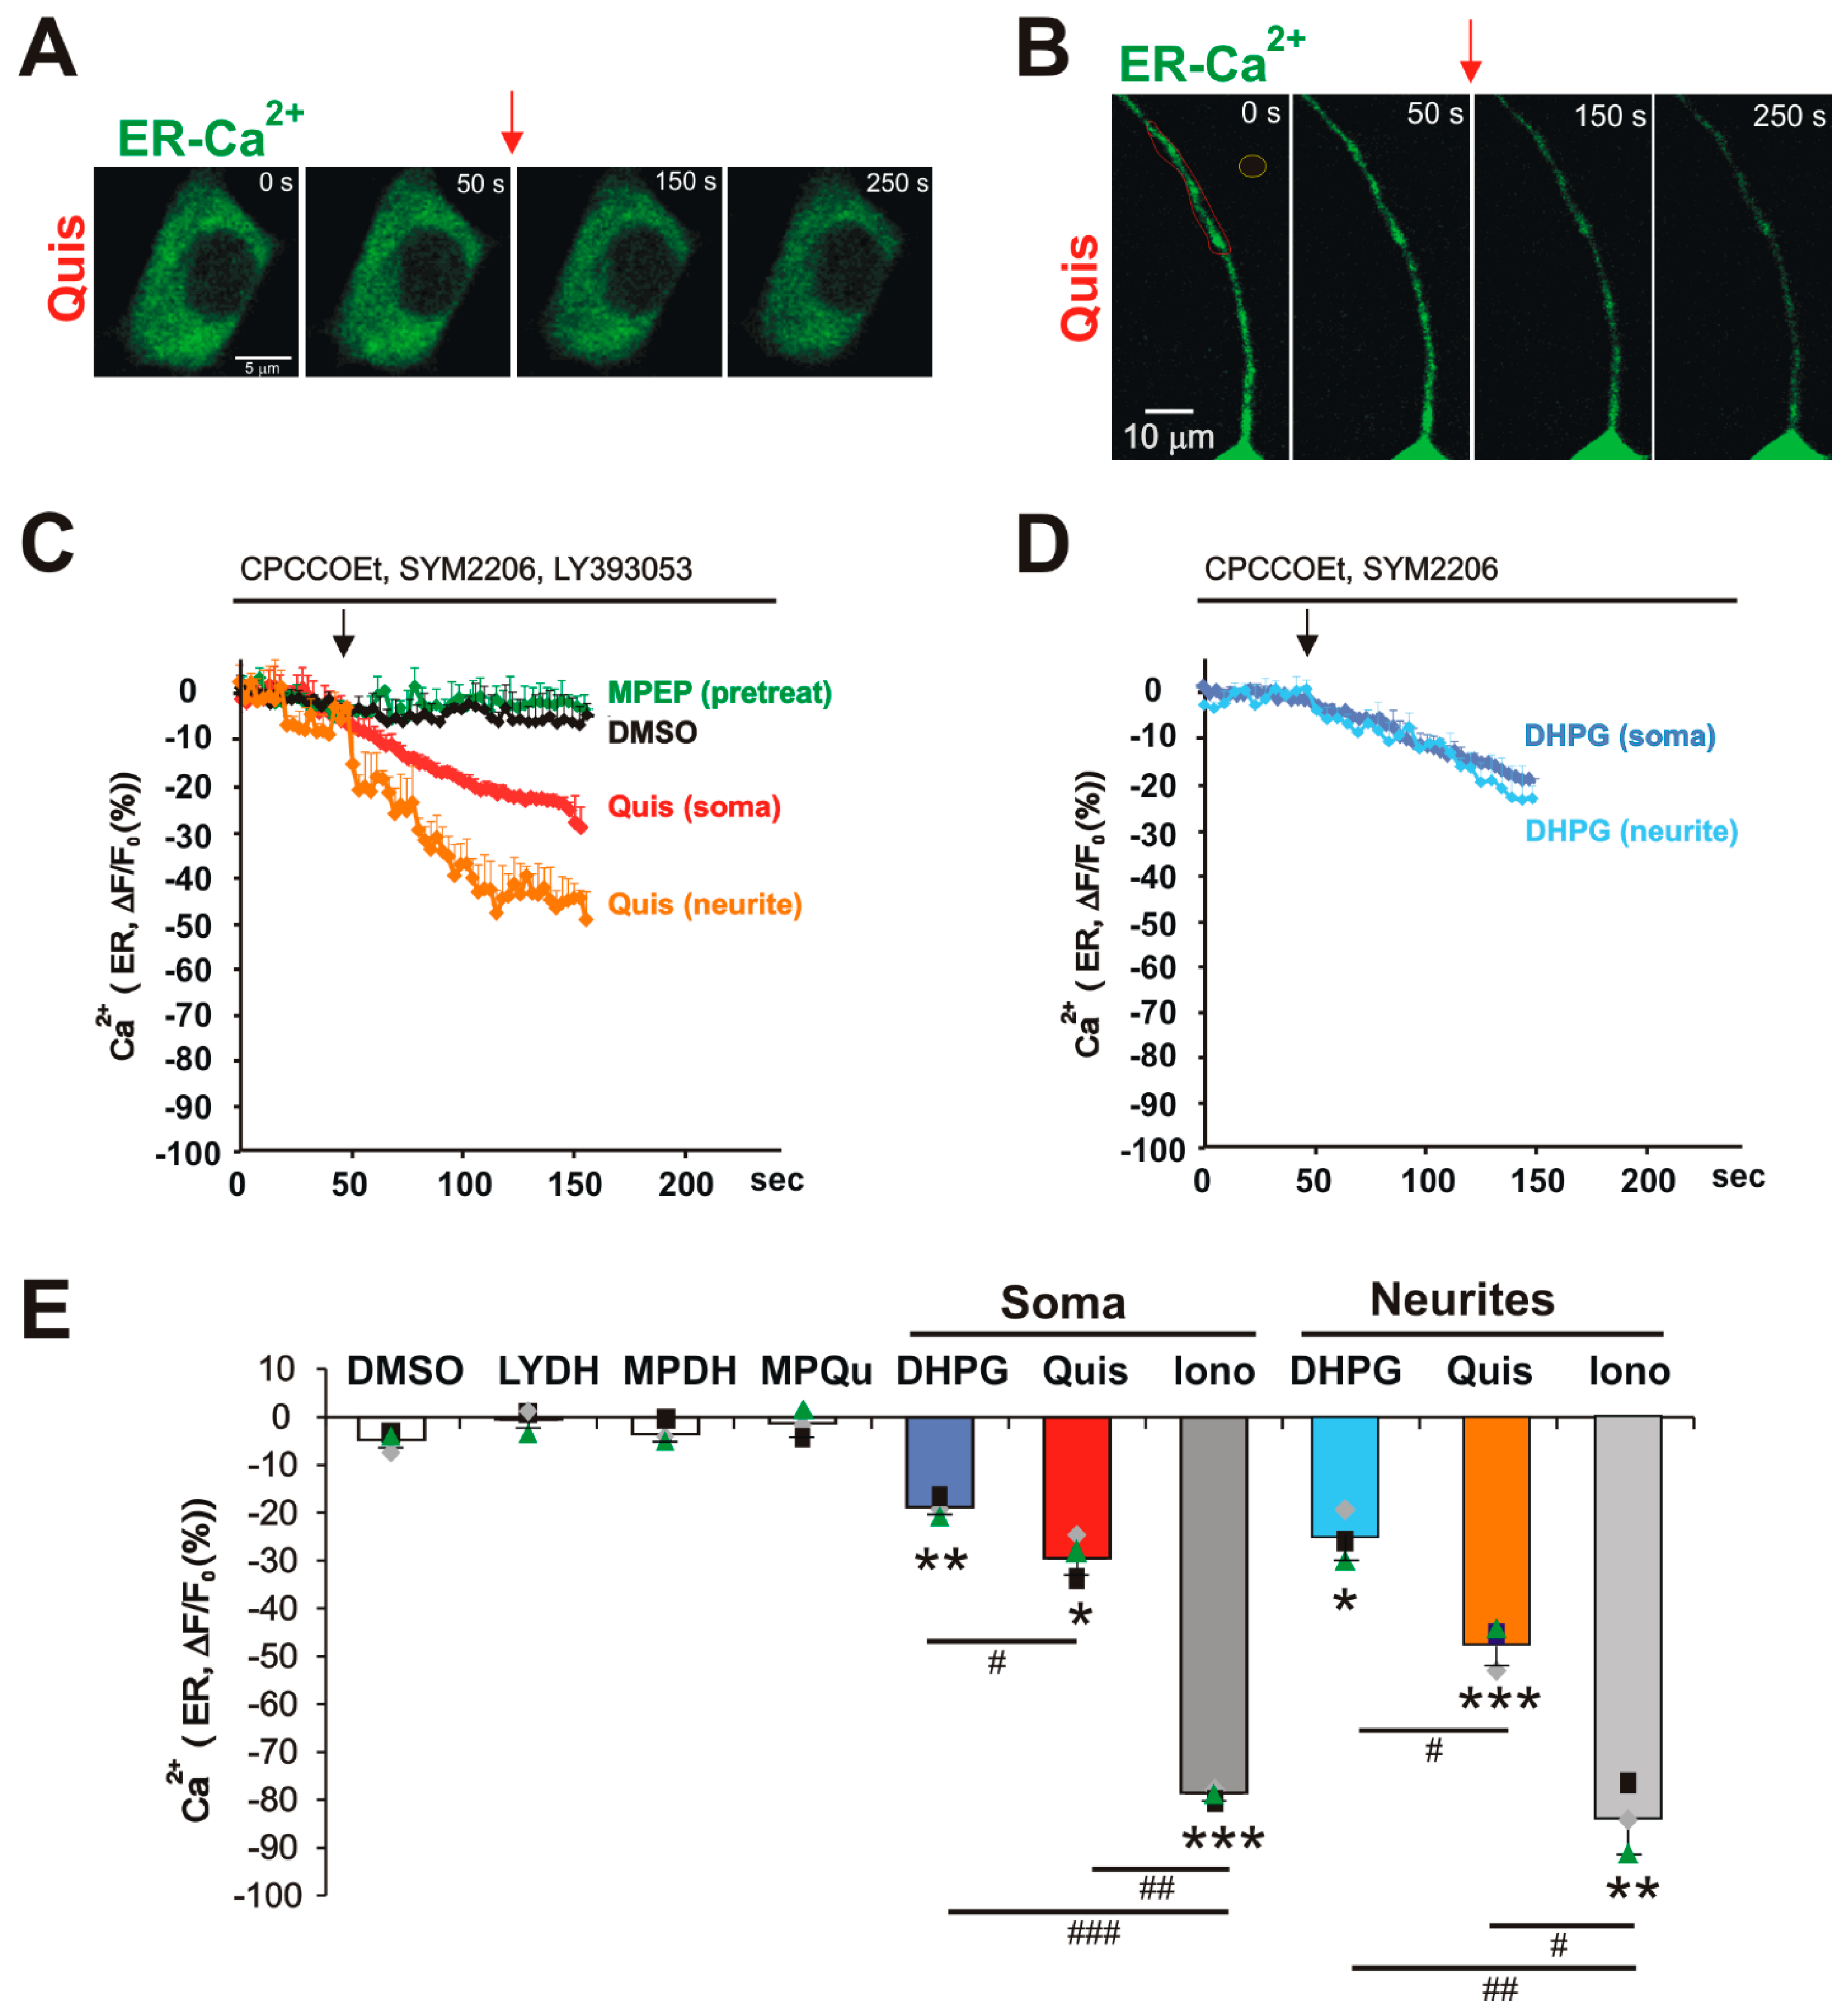
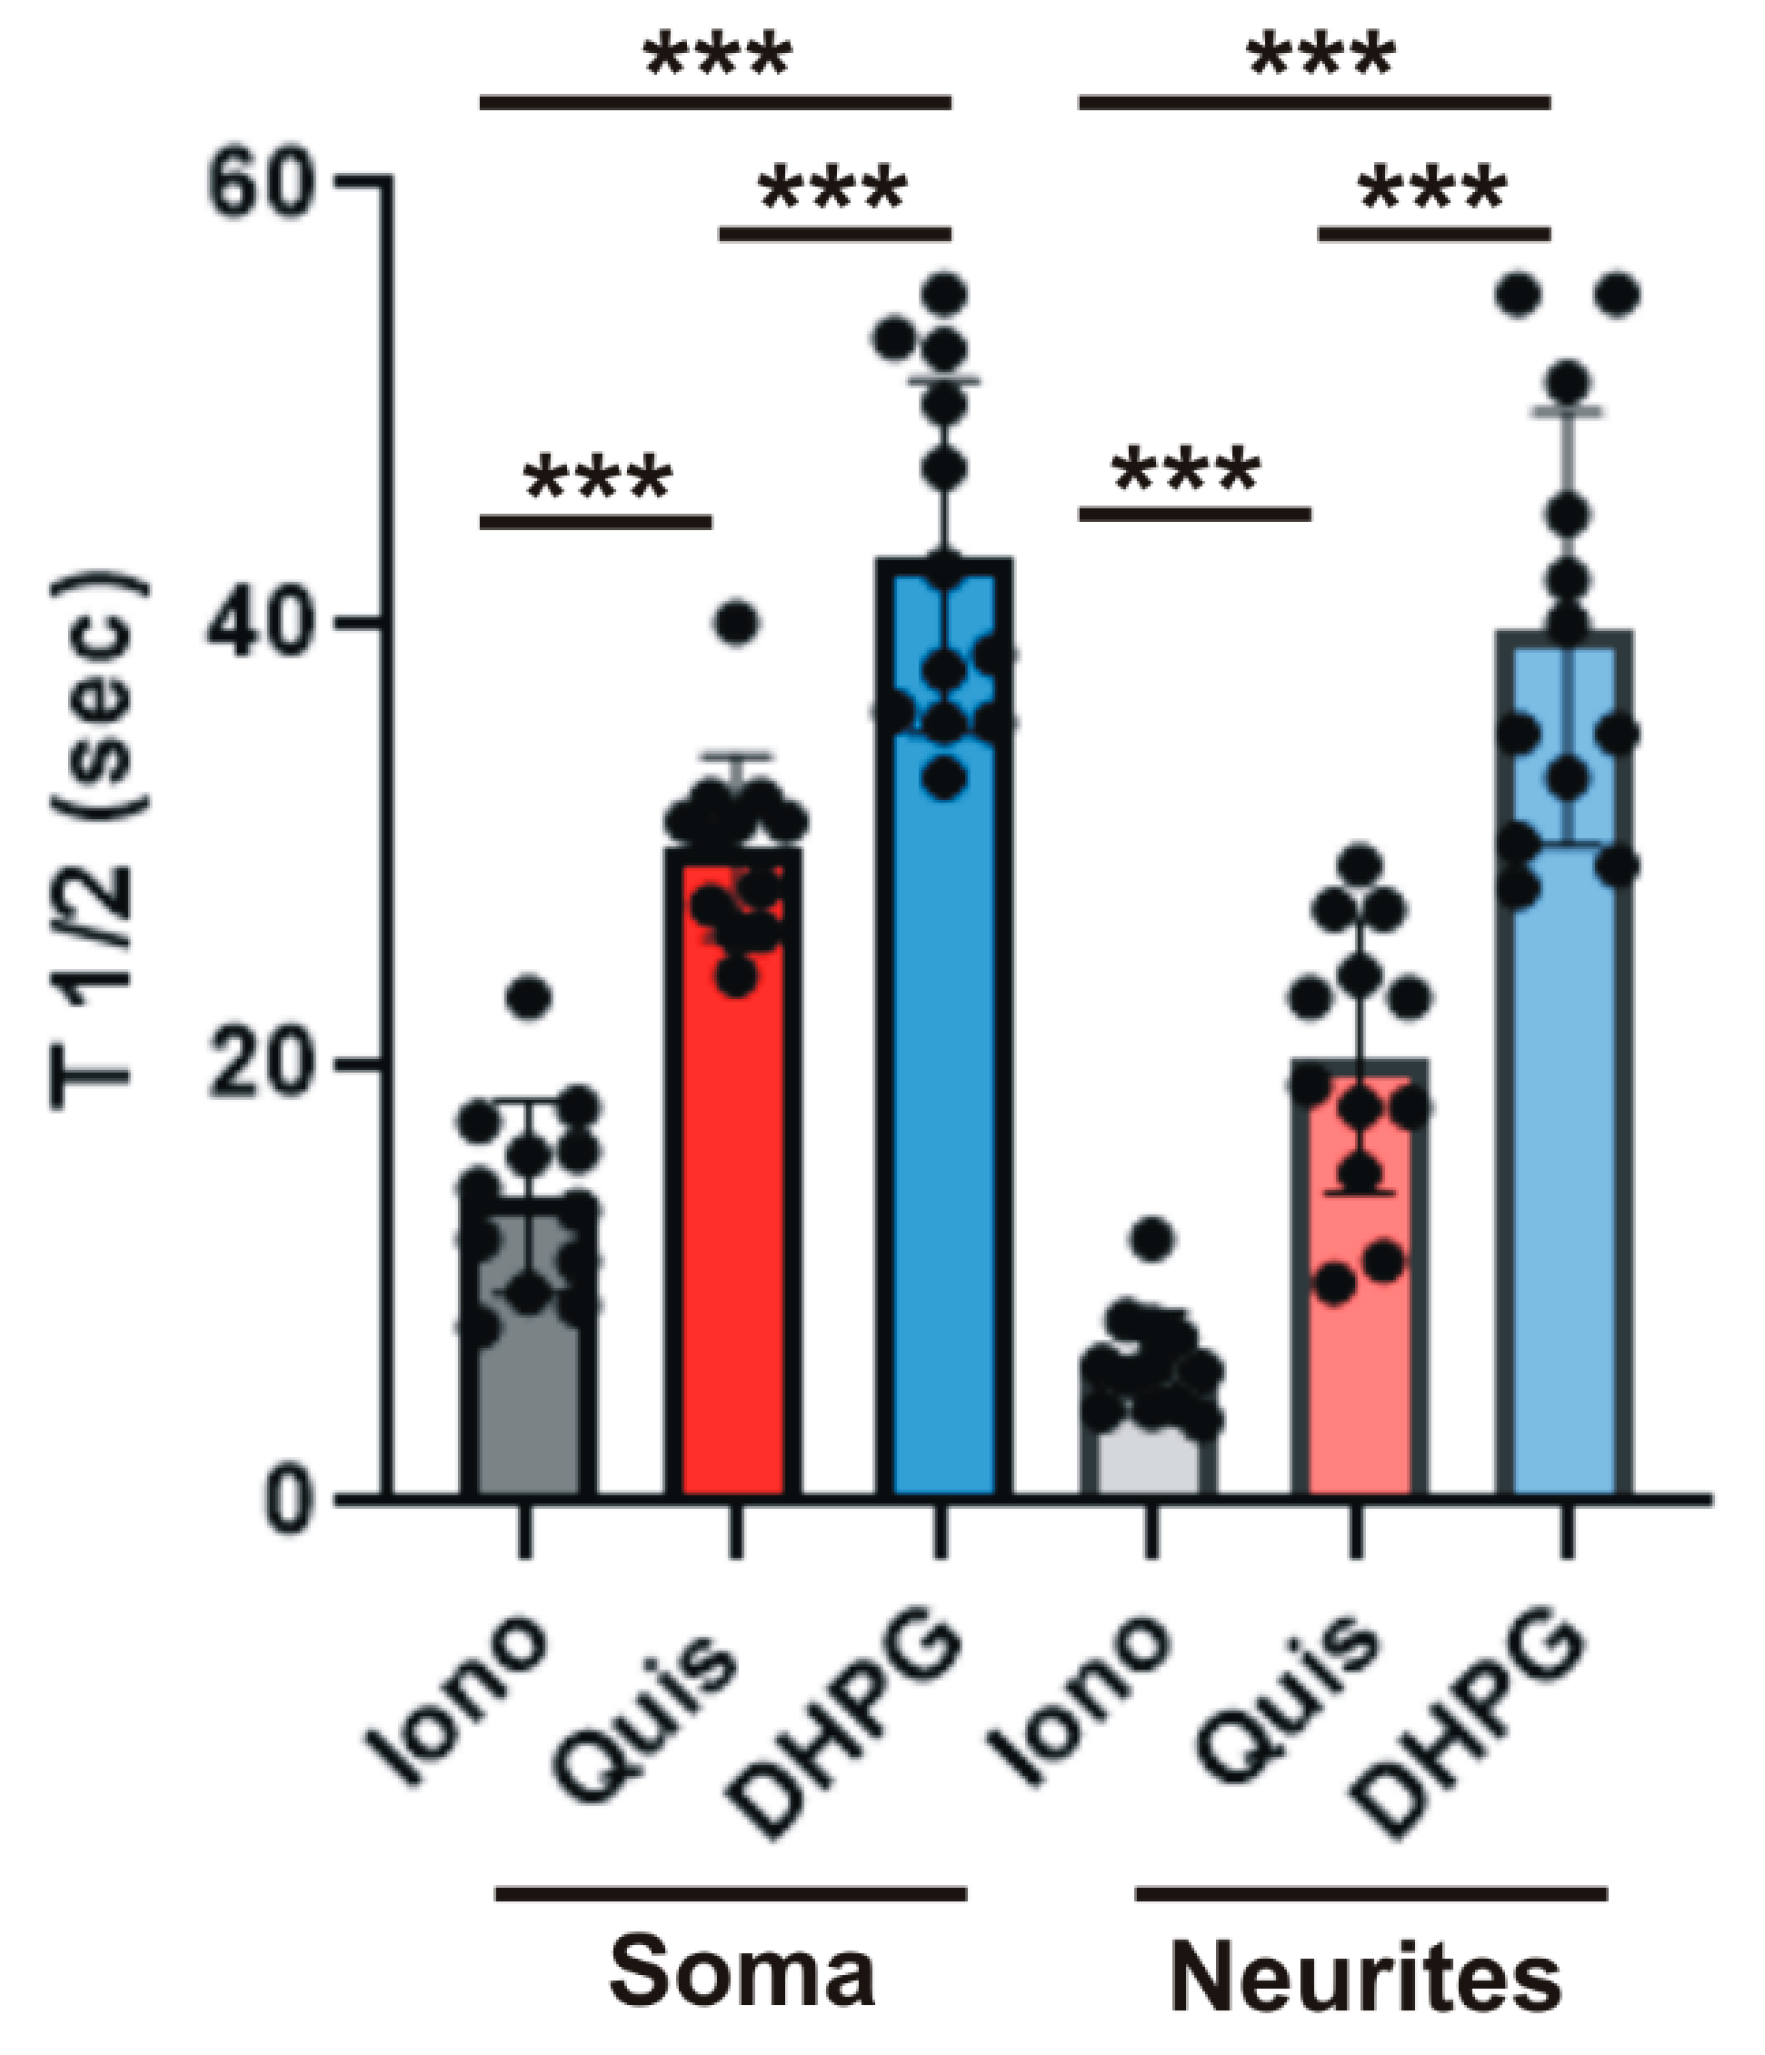
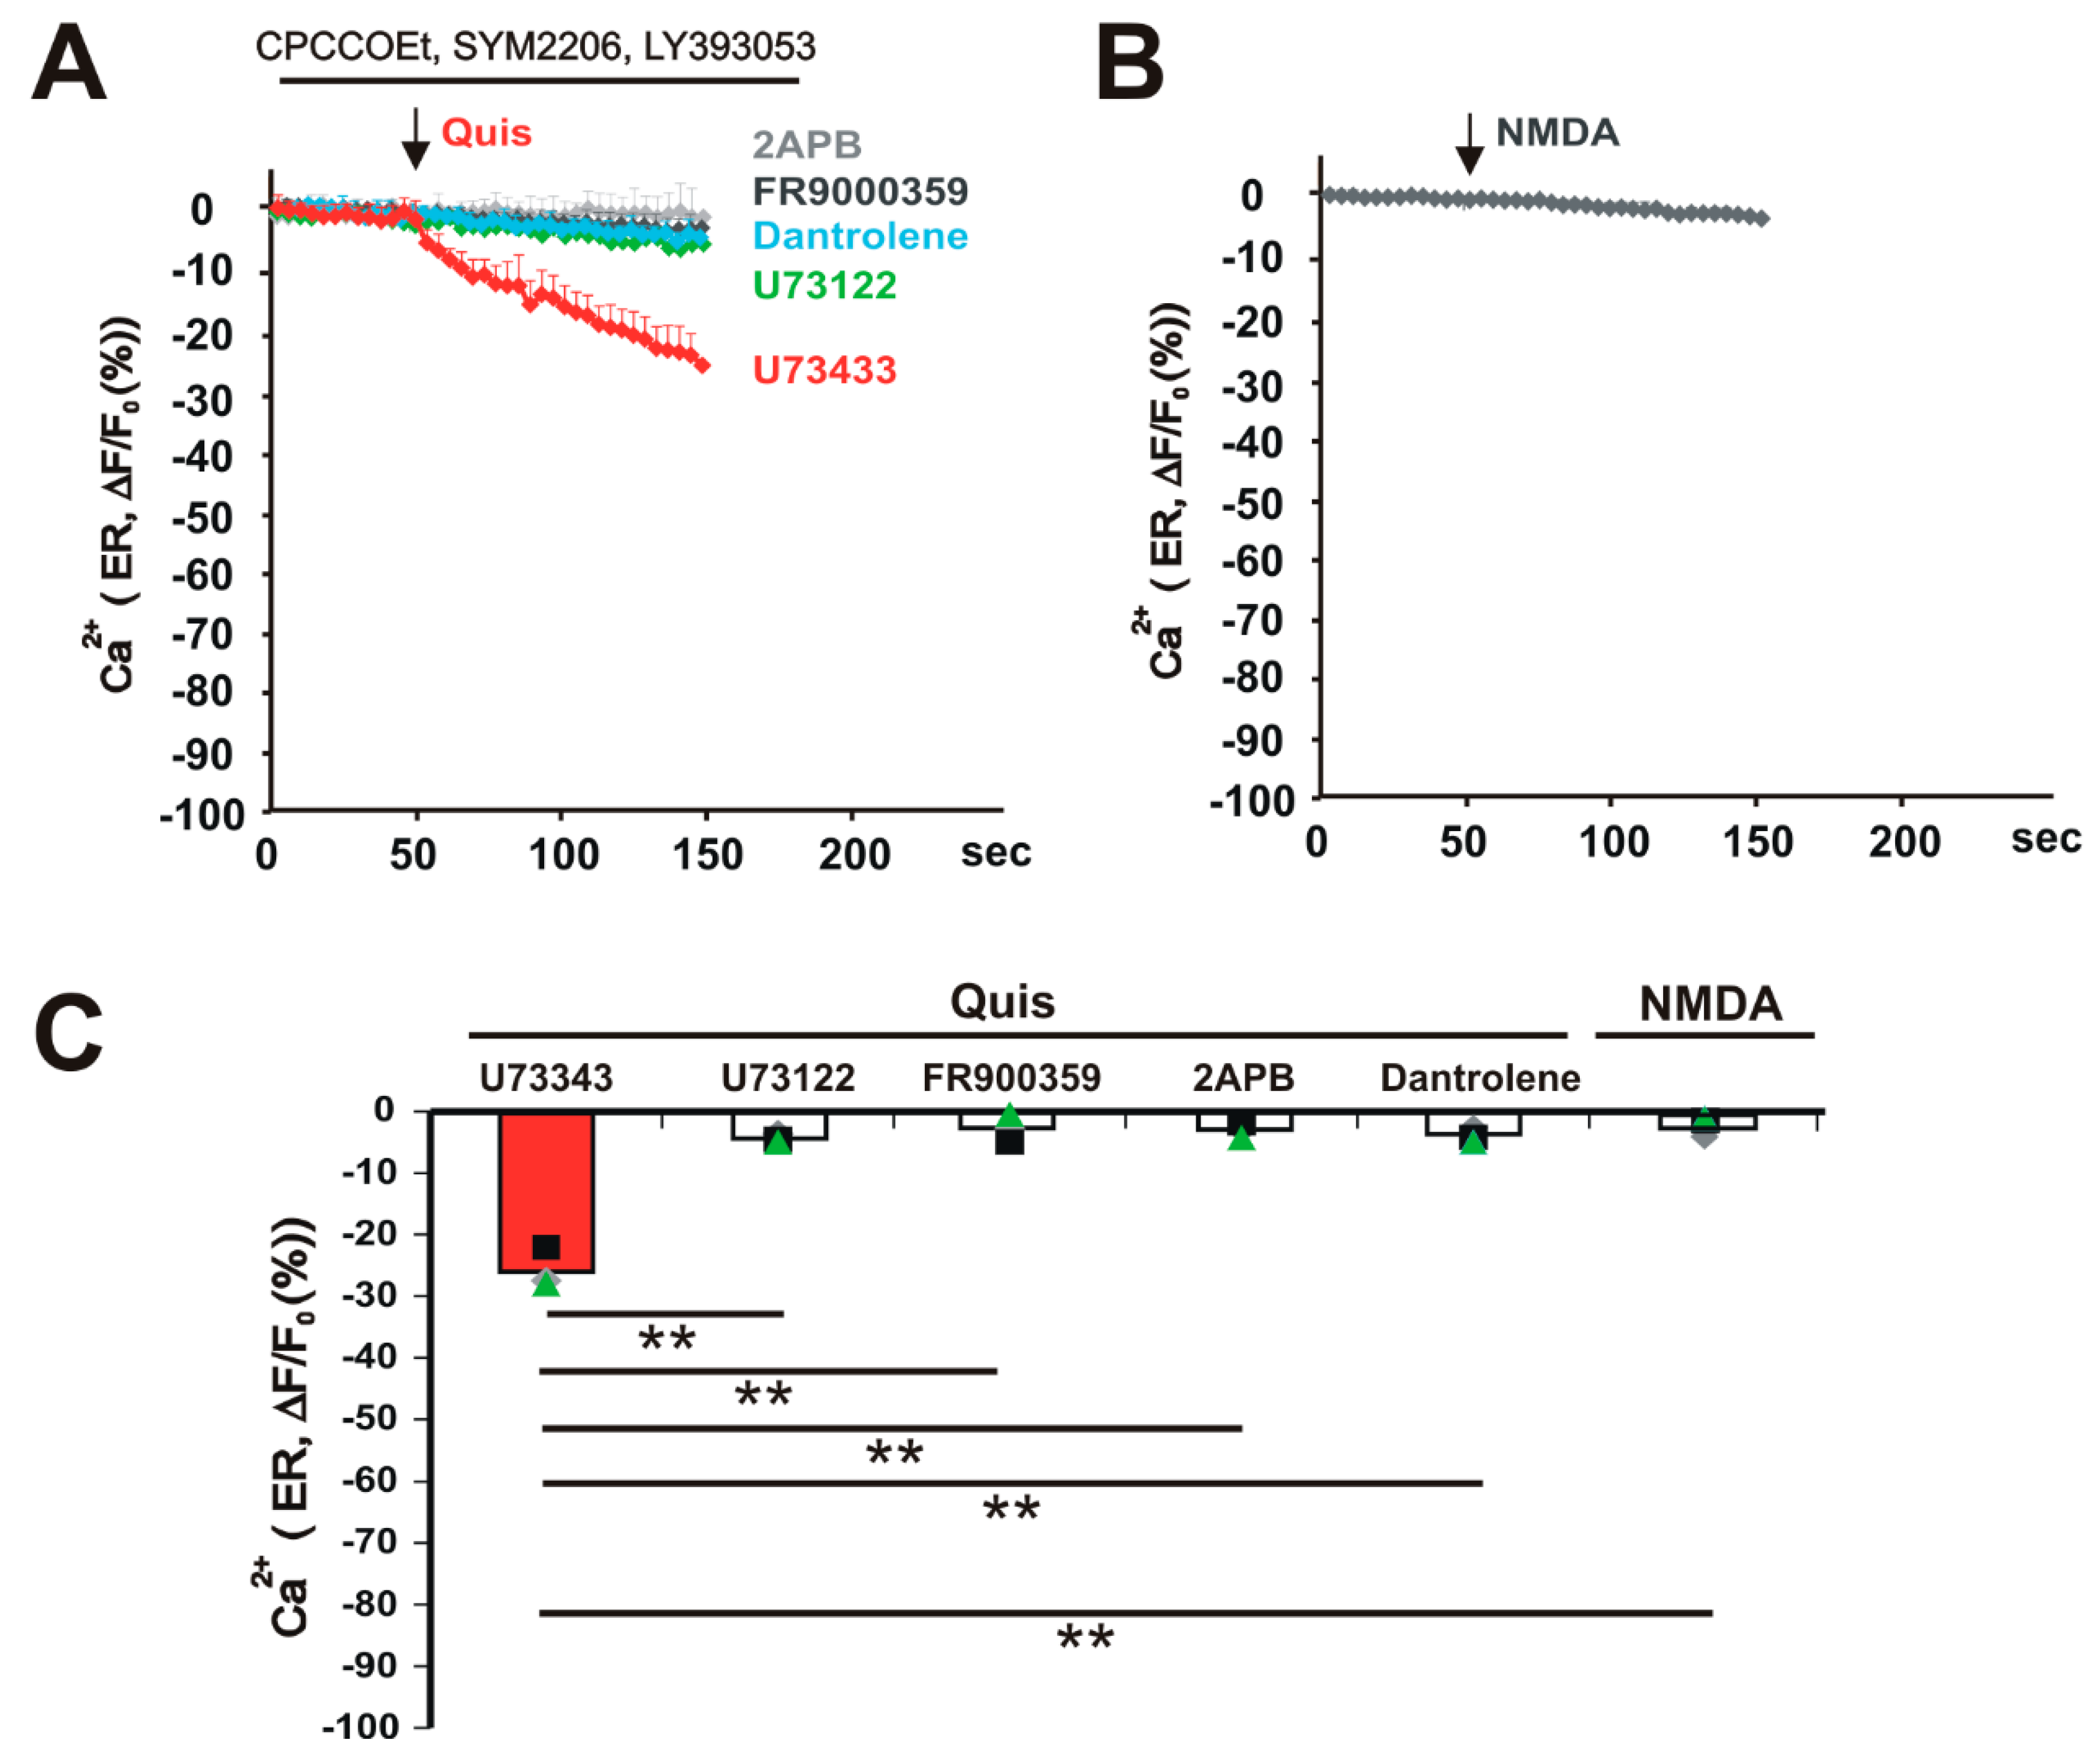
3. Results
4. Discussion
5. Conclusions
Author Contributions
Funding
Institutional Review Board Statement
Informed Consent Statement
Data Availability Statement
Conflicts of Interest
References
- Berridge, M.; Lipp, P.; Bootman, M. Calcium signalling. Curr. Biol. 1999, 9, R157–R159. [Google Scholar] [CrossRef]
- Berridge, M.J.; Bootman, M.D.; Roderick, H.L. Calcium signalling: Dynamics, homeostasis and remodelling. Nat. Rev. Mol. Cell Biol. 2003, 4, 517–529. [Google Scholar] [CrossRef] [PubMed]
- Bootman, M.D.; Bultynck, G. Fundamentals of Cellular Calcium Signaling: A Primer. Cold Spring Harb. Perspect. Biol. 2019, 12, a038802. [Google Scholar] [CrossRef] [PubMed]
- Kilpatrick, L.E.; Hill, S. Transactivation of G protein-coupled receptors (GPCRs) and receptor tyrosine kinases (RTKs): Recent insights using luminescence and fluorescence technologies. Curr. Opin. Endocr. Metab. Res. 2021, 16, 102–112. [Google Scholar] [CrossRef] [PubMed]
- Mikoshiba, K. The InsP3 receptor and intracellular Ca2+ signaling. Curr. Opin. Neurobiol. 1997, 7, 339–345. [Google Scholar] [CrossRef]
- Foskett, J.K.; White, C.; Cheung, K.H.; Mak, D.O. Inositol trisphosphate receptor Ca2+ release channels. Physiol. Rev. 2007, 87, 593–658. [Google Scholar] [CrossRef]
- Berridge, M.J. The inositol trisphosphate/calcium signaling pathway in health and disease. Physiol. Rev. 2016, 96, 1261–1296. [Google Scholar] [CrossRef]
- Carreras-Sureda, A.; Pihán, P.; Hetz, C. Calcium signaling at the endoplasmic reticulum: Fine-tuning stress responses. Cell Calcium 2018, 70, 24–31. [Google Scholar] [CrossRef]
- Hermans, E.; Challiss, R.J. Structural, signalling and regulatory properties of the group I metabotropic glutamate receptors: Prototypic family C G-protein-coupled receptors. Biochem. J. 2001, 359, 465–484. [Google Scholar] [CrossRef]
- Moldrich, R.X.; Beart, P.M. Emerging signalling and protein interactions mediated via metabotropic glutamate receptors. Curr. Drug Target.-CNS Neurol. Disord. 2003, 2, 109–122. [Google Scholar] [CrossRef]
- Flint, A.C.; Dammerman, R.S.; Kriegstein, A.R. Endogenous activation of metabotropic glutamate receptors in neocortical development causes neuronal calcium oscillations. Proc. Natl. Acad. Sci. USA 1999, 96, 12144–12149. [Google Scholar] [CrossRef] [PubMed]
- Kettunen, P.; Krieger, P.; Hess, P.D.; El Manira, A. Signaling mechanisms of metabotropic glutamate receptor 5 subtype and its endogenous role in a locomotor network. J. Neurosci. 2002, 22, 1868–1873. [Google Scholar] [CrossRef] [PubMed]
- Marino, M.; Awad-Granko, H.; Ciombor, K.; Conn, P. Haloperidol-induced alteration in the physiological actions of group I mGlus in the subthalamic nucleus and the substantia nigra pars reticulata. Neuropharmacology 2002, 43, 147–159. [Google Scholar] [CrossRef] [PubMed]
- Jong, Y.-J.I.; Harmon, S.K.; O’malley, K.L. Intracellular GPCRs Play Key Roles in Synaptic Plasticity. ACS Chem. Neurosci. 2018, 9, 2162–2172. [Google Scholar] [CrossRef]
- Jong, Y.I.; Harmon, S.K.; O’Malley, K.L. GPCR signalling from within the cell. Br. J. Pharmacol. 2018, 175, 4026–4035. [Google Scholar] [CrossRef]
- Jong, Y.I.; Harmon, S.K.; O’Malley, K.L. GPCR Signaling from Intracellular Membranes. In GPCRs as Therapeutic Targets Chapter 8; Gilchrist, A., Ed.; Wiley: Hoboken, NJ, USA, 2022. [Google Scholar] [CrossRef]
- Jong, Y.-J.I.; Kumar, V.; Kingston, A.E.; Romano, C.; O’Malley, K.L. Functional metabotropic glutamate receptors on nuclei from brain and primary cultured striatal neurons. Role of transporters in delivering ligand. J. Biol. Chem. 2005, 280, 30469–30480. [Google Scholar] [CrossRef]
- Jong, Y.-J.I.; Kumar, V.; O’Malley, K.L. Intracellular metabotropic glutamate receptor 5 (mGluR5) activates signaling cascades distinct from cell surface counterparts. J. Biol. Chem. 2009, 284, 35827–35838. [Google Scholar] [CrossRef]
- Purgert, C.A.; Izumi, Y.; Jong, Y.-J.I.; Kumar, V.; Zorumski, C.F.; O’Malley, K.L. Intracellular mGluR5 can mediate synaptic plasticity in the hippocampus. J. Neurosci. 2014, 34, 4589–4598. [Google Scholar] [CrossRef]
- Vincent, K.; Cornea, V.M.; Jong, Y.-J.I.; Laferrière, A.; Kumar, N.; Mickeviciute, A.; Fung, J.S.T.; Bandegi, P.; Ribeiro-Da-Silva, A.; O’malley, K.L.; et al. Intracellular mGluR5 plays a critical role in neuropathic pain. Nat. Commun. 2016, 7, 10604. [Google Scholar] [CrossRef]
- Jong, Y.I.; Harmon, S.K.; O’Malley, K.L. Location and Cell-Type-Specific Bias of Metabotropic Glutamate Receptor, mGlu5, Negative Allosteric Modulators. ACS Chem. Neurosci. 2019, 10, 4558–4570. [Google Scholar] [CrossRef]
- Jong, Y.-J.I.; Izumi, Y.; Harmon, S.K.; Zorumski, C.F.; Ómalley, K.L. Striatal mGlu5-mediated synaptic plasticity is independently regulated by location-specific receptor pools and divergent signaling pathways. J. Biol. Chem. 2023, 299, 104949. [Google Scholar] [CrossRef] [PubMed]
- Kumar, V.; Jong, Y.J.; O’Malley, K.L. Activated nuclear metabotropic glutamate receptor mGlu5 couples to nuclear Gq/11 proteins to generate inositol 1,4,5-trisphosphate-mediated nuclear Ca2+ release. J. Biol. Chem. 2008, 283, 14072–14083. [Google Scholar] [CrossRef] [PubMed]
- de Juan-Sanz, J.; Holt, G.T.; Schreiter, E.R.; de Juan, F.; Kim, D.S.; Ryan, T.A. Axonal Endoplasmic Reticulum Ca2+ Content Controls Release Probability in CNS Nerve Terminals. Neuron 2017, 93, 867–881. [Google Scholar] [CrossRef]
- Onken, M.D.; Makepeace, C.M.; Kaltenbronn, K.M.; Kanai, S.M.; Todd, T.D.; Wang, S.; Broekelmann, T.J.; Rao, P.K.; Cooper, J.A.; Blumer, K.J. Targeting nucleotide exchange to inhibit constitutively active G protein α subunits in cancer cells. Sci. Signal. 2018, 11, eaao6852. [Google Scholar] [CrossRef]
- Mao, L.; Wang, J.Q. Upregulation of preprodynorphin and preproenkephalin mRNA expression by selective activation of group I metabotropic glutamate receptors in characterized primary cultures of rat striatal neurons. Mol. Brain Res. 2001, 86, 125–137. [Google Scholar] [CrossRef]
- Zhu, T.; Gobeil, F.; Vazquez-Tello, A.; Leduc, M.; Rihakova, L.; Bossolasco, M.; Bkaily, G.; Peri, K.; Varma, D.R.; Orvoine, R.; et al. Intracrine signaling through lipid mediators and their cognate nuclear G-protein-coupled receptors: A paradigm based on PGE2, PAF, and LPA1 receptors. Can. J. Physiol. Pharmacol. 2006, 84, 377–391. [Google Scholar] [CrossRef]
- O’Malley, K.L.; Jong, Y.-J.I.; Gonchar, Y.; Burkhalter, A.; Romano, C. Activation of metabotropic glutamate receptor mGlu5 on nuclear membranes mediates intranuclear Ca2+ changes in heterologous cell types and neurons. J. Biol. Chem. 2003, 278, 28210–28219. [Google Scholar] [CrossRef]
- Hardingham, G.E.; Arnold, F.J.L.; Bading, H. Nuclear calcium signaling controls CREB-mediated gene expression triggered by synaptic activity. Nat. Neurosci. 2001, 4, 261–267. [Google Scholar] [CrossRef]
- Carrasco, M.A.; Jaimovich, E.; Kemmerling, U.; Hidalgo, C. Signal transduction and gene expression regulated by calcium release from internal stores in excitable cells. Biol. Res. 2004, 37, 701–712. [Google Scholar] [CrossRef]
- Goussakov, I.; Miller, M.B.; Stutzmann, G.E. NMDA-mediated Ca(2+) influx drives aberrant ryanodine receptor activation in dendrites of young Alzheimer’s disease mice. J. Neurosci. 2010, 30, 12128–12137. [Google Scholar] [CrossRef]
- Zieminska, E.; Stafiej, A.; Toczylowska, B.; Albrecht, J.; Lazarewicz, J.W. Role of Ryanodine and NMDA Receptors in Tetrabromobisphenol A-Induced Calcium Imbalance and Cytotoxicity in Primary Cultures of Rat Cerebellar Granule Cells. Neurotox. Res. 2015, 28, 195–208. [Google Scholar] [CrossRef] [PubMed]
- Kucharz, K.; Krogh, M.; Na Ng, A.; Toresson, H. NMDA receptor stimulation induces reversible fission of the neuronal endoplasmic reticulum. PLoS ONE 2009, 4, e5250. [Google Scholar] [CrossRef] [PubMed]
- Buchner, K.; Otto, H.; Hilbert, R.; Lindschau, C.; Haller, H.; Hucho, F. Properties of protein kinase C associated with nuclear membranes. Biochem. J. 1992, 286, 369–375. [Google Scholar] [CrossRef] [PubMed]
- Humbert, J.-P.; Matter, N.; Artault, J.-C.; Köppler, P.; Malviya, A.N. Inositol 1,4,5-trisphosphate receptor is located to the inner nuclear membrane vindicating regulation of nuclear calcium signaling by inositol 1,4,5-trisphosphate. Discrete distribution of inositol phosphate receptors to inner and outer nuclear membranes. J. Biol. Chem. 1996, 271, 478–485. [Google Scholar] [CrossRef]
- Irvine, R. Nuclear lipid signaling. Sci. STKE 2000, 48, re1. [Google Scholar] [CrossRef]
- Divecha, N.; Clarke, J.H.; Roefs, M.; Halstead, J.R.; D’santos, C. Nuclear inositides: Inconsistent consistencies. Cell. Mol. Life Sci. 2000, 57, 379–393. [Google Scholar] [CrossRef]
- D’Santos, C.; Clarke, J.H.; Roefs, M.; Halstead, J.R.; Divecha, N. Nuclear inositides. Eur. J. Histochem. 2000, 44, 51–60. [Google Scholar]
- Willard, F.S.; Crouch, M.F. Nuclear and cytoskeletal translocation and localization of heterotrimeric G-proteins. Immunol. Cell Biol. 2000, 78, 387–394. [Google Scholar] [CrossRef]
- Gerasimenko, J.V.; Maruyama, Y.; Yano, K.; Dolman, N.J.; Tepikin, A.V.; Petersen, O.H.; Gerasimenko, O.V. NAADP mobilizes Ca2+ from a thapsigargin-sensitive store in the nuclear envelope by activating ryanodine receptors. J. Cell Biol. 2003, 163, 271–282. [Google Scholar] [CrossRef]
- Huber, K.M.; Roder, J.C.; Bear, M.F. Chemical Induction of mGluR5- and Protein Synthesis–Dependent Long-Term Depression in Hippocampal Area CA1. J. Neurophysiol. 2001, 86, 321–325. [Google Scholar] [CrossRef]
- Schwarz, D.S.; Blower, M.D. The endoplasmic reticulum: Structure, function and response to cellular signaling. Cell Mol. Life Sci. 2016, 73, 79–94. [Google Scholar] [CrossRef] [PubMed]
- Parkkinen, I.; Their, A.; Asghar, M.Y.; Sree, S.; Jokitalo, E.; Airavaara, M. Pharmacological Regulation of Endoplasmic Reticulum Structure and Calcium Dynamics: Importance for Neurodegenerative Diseases. Pharmacol. Rev. 2023, 75, 959–978. [Google Scholar] [CrossRef] [PubMed]
- Zheng, S.; Wang, X.; Zhao, D.; Liu, H.; Hu, Y. Calcium homeostasis and cancer: Insights from endoplasmic reticulum-centered organelle communications. Trends Cell Biol. 2023, 33, 312. [Google Scholar] [CrossRef]
- Karagas, N.E.; Venkatachalam, K. Roles for the Endoplasmic Reticulum in Regulation of Neuronal Calcium Homeostasis. Cells 2019, 8, 1232. [Google Scholar] [CrossRef]

Disclaimer/Publisher’s Note: The statements, opinions and data contained in all publications are solely those of the individual author(s) and contributor(s) and not of MDPI and/or the editor(s). MDPI and/or the editor(s) disclaim responsibility for any injury to people or property resulting from any ideas, methods, instructions or products referred to in the content. |
© 2025 by the authors. Licensee MDPI, Basel, Switzerland. This article is an open access article distributed under the terms and conditions of the Creative Commons Attribution (CC BY) license (https://creativecommons.org/licenses/by/4.0/).
Share and Cite
Jong, Y.-J.I.; Harmon, S.K.; O’Malley, K.L. Activation of Endoplasmic Reticulum-Localized Metabotropic Glutamate Receptor 5 (mGlu5) Triggers Calcium Release Distinct from Cell Surface Counterparts in Striatal Neurons. Biomolecules 2025, 15, 552. https://doi.org/10.3390/biom15040552
Jong Y-JI, Harmon SK, O’Malley KL. Activation of Endoplasmic Reticulum-Localized Metabotropic Glutamate Receptor 5 (mGlu5) Triggers Calcium Release Distinct from Cell Surface Counterparts in Striatal Neurons. Biomolecules. 2025; 15(4):552. https://doi.org/10.3390/biom15040552
Chicago/Turabian StyleJong, Yuh-Jiin I., Steven K. Harmon, and Karen L. O’Malley. 2025. "Activation of Endoplasmic Reticulum-Localized Metabotropic Glutamate Receptor 5 (mGlu5) Triggers Calcium Release Distinct from Cell Surface Counterparts in Striatal Neurons" Biomolecules 15, no. 4: 552. https://doi.org/10.3390/biom15040552
APA StyleJong, Y.-J. I., Harmon, S. K., & O’Malley, K. L. (2025). Activation of Endoplasmic Reticulum-Localized Metabotropic Glutamate Receptor 5 (mGlu5) Triggers Calcium Release Distinct from Cell Surface Counterparts in Striatal Neurons. Biomolecules, 15(4), 552. https://doi.org/10.3390/biom15040552