Article

Mitochondrial Genome Features and Phylogenetic Analyses of Four Chrysochroinae Species (Coleoptera: Buprestidae)

The Key Laboratory of Southwest China Wildlife Resources Conservation of the Ministry of Education, College of Life Sciences, China West Normal University, Nanchong 637009, China
*
Author to whom correspondence should be addressed.
Biomolecules 2025, 15(11), 1531; https://doi.org/10.3390/biom15111531
Submission received: 30 September 2025 / Revised: 26 October 2025 / Accepted: 27 October 2025 / Published: 30 October 2025
(This article belongs to the Section Molecular Biology)

Abstract

The number of known mitochondrial genomes in Buprestidae is limited, especially in Chrysochroinae, which seriously hinders the phylogenetic study of this family. The mitogenomes of Capnodis miliaris, Lamprodila cupreosplendens, Sphenoptera insidiosa and Philocteanus rubroaureus were sequenced, assembled and annotated in this study. The mitogenomes of these four species are typical circular double-stranded DNA molecules, containing 13 protein-coding genes (PCGS), 22 transfer RNA genes (tRNAs), 2 ribosomal RNA genes (rRNAs), and a control region (CR). The total lengths of these four mitogenomes are moderate, ranging from 15,778 bp to 16,230 bp. Additionally, their A + T content ranges from 68.76% to 73.47%, showing positive AT-skew values ranging from 0.098 to 0.181. Relative Synonymous Codon Usage (RSCU) analysis indicated that TTT (Phe), ATT (Ile), TCT (Ser2), and TTA (Leu2) are the most frequently used codons. The gene arrangement of four mitogenomes is consistent with the previously reported Buprestidae mitogenomes. Most of the PCGs use ATN as the start codon, with TAA as the stop codon or an incomplete stop codon T-. Phylogenetic trees were constructed based on the PCGs and rRNAs using both maximum-likelihood and Bayesian inference methods. The phylogenetic results showed that Julodinae, Polycestinae, Buprestinae and Agrilinae are monophyletic groups, and Chrysochroinae is a paraphyletic group. As the number of Buprestidae mitogenomes used for polyogenetic analysis increases, the topology of phylogenetic tree shows differences compared to previous studies.

1. Introduction

The family Buprestidae is one of the largest families in the order Coleoptera, comprising 6 subfamilies, 521 genera, and over 15,000 species [1]. Buprestid beetles are herbivorous, have a worldwide distribution, and exhibit significant morphological diversity across species from different subfamilies [2]. Some species are global pests of agriculture and forestry, especially in Agrilinae [3,4,5] and Buprestinae [6,7], while a few species are endangered [8,9,10]. The subfamily Chrysochroinae is divided into 8 tribes, 112 genera, and approximately 3100 species worldwide, with a broad distribution across the six major zoogeographical regions. Species of this subfamily are large in size; adults all feed on plant leaves, while larvae bore into tree trunks or branches, such as the species of Lamprodila [11,12] and Sphenoptera [13,14].
The subfamily Chrysochroinae, as a key group within the Buprestidae, has long been a focus of research in entomology due to its classification status and phylogenetic relationships [15,16]. While numerous scholars have conducted in-depth studies on its morphological characteristics, phylogenetic studies on subfamily Chrysochroinae remain relatively scarce [17,18]. Morphological characteristics have provided valuable insights into the classification of Buprestidae, but the phylogenetic relationships among higher-level taxa have not yet been fully resolved [17,18,19]. Previous studies have shown that Chrysochroinae and Buprestinae are polyphyletic, and their interrelationships remain uncertain [18]. The classification of the genus Coomaniella Bílý, 1974, has been controversial for a long time [18]. Based on morphological cladistic analysis, the antenna structure is consistent with the typical characteristics of Buprestinae [20], providing solid morphological evidence for the traditional classification of this genus.
The mitogenome is a double-stranded circular DNA molecule, which has unique advantages such as maternal inheritance, a rapid evolutionary rate, and a relatively stable structure. It has become an efficient molecular marker for studying the phylogeny of insect [21,22,23,24]. The mitogenome has been widely applied in entomological research, providing crucial molecular evidence for revealing the evolutionary relationships among different insect species [25,26,27,28]. However, research on the mitogenomes of Chrysochroinae is relatively scarce, which greatly limits the understanding of the phylogenetic relationships among various taxa.
In this study, the complete mitogenomes of Capnodis miliaris (Klug, 1829), Lamprodila cupreosplendens (Kerremans, 1895), Sphenoptera insidiosa (Mannerheim, 1852), and Philocteanus rubroaureus (De Geer, 1778) were sequenced and annotated. The mitogenomes of the genera Capnodis, Lamprodila, Sphenoptera, and Philocteanus are reported here for the first time. The mitogenomes from this study will provide valuable data for the phylogenetic analysis, species identification, and population genetics of the subfamily Chrysochroinae.

2. Materials and Methods

2.1. Taxon Sampling and DNA Extraction

In this study, specimens of Capnodis miliaris were collected on 17 April 2022, from Xiremu Village in the Gaochang District of Turpan City, Xinjiang Uygur Autonomous Region, China. Specimens of Lamprodila cupreosplendens were collected on 13 June 2022, from Wanzi tou in Yunwu Town, Guiding County, Guizhou Province, China. Specimens of Sphenoptera insidiosa were collected on 8 July 2024, from Shiyu Village in the Liujang National Geological Park, Qinhuangdao City, Hebei Province, China. Specimens of Philocteanus rubroaureus were collected on 28 June 2024, in Tuanshan Village, Yongde County, Yunnan Province, China. All specimens are stored at China West Normal University in a −24 °C environment, preserved in 95% ethanol. The leg and thorax tissues were used for DNA extraction using the DNeasy Blood and Tissue Kit (Sangon Biotech (Shanghai) Co., Ltd., China). The experimental procedures were strictly followed in accordance with the kit instructions.

2.2. Mitogenome Sequencing, Annotation and Analysis

In this study, high-throughput sequencing was conducted using the Illumina MiSeq platform with paired-end 150 bp. The sequence assembly followed the method proposed by Hahn [29]. The sequencing coverage for C. miliaris, L. cupreosplendens, S. insidiosa, and P. rubroaureus reached 295.9 X, 270.2 X, 215.3 X, and 239.2 X, respectively. Low-quality sequence fragments were removed using Trimmomatic (v0.36) software, and the cleaned sequences were then assembled and annotated using Geneious (v11.0.2) software [30]. During data analysis, the relative synonymous codon usage (RSCU) frequency of the mitogenomes was calculated using MEGA (v12) software [31]. Nucleotide diversity (Pi), nonsynonymous substitution rate (Ka), and synonymous substitution rate (Ks) for protein-coding genes (PCGs) were estimated using DnaSP (v5.0) software [32]. These three mitogenome sequences obtained in this study have been submitted to GenBank, with the accession numbers PV330099 (C. miliaris), PV330528 (L. cupreosplendens), PV391144 (S. insidiosa), and PX370042 (P. rubroaureus).

2.3. Phylogenetic Aanlysis

To further investigate the phylogenetic position of these four species within the Buprestidae, 43 mitogenomes (Table S1), including 39 previously reported and 4 newly sequenced mitogenomes representing 5 subfamilies, were used for phylogenetic analysis. The Maximum likelihood (ML) and Bayesian inference (BI) methods were used to construct the phylogenetic trees, with Dryops ernesti (Gozis, 1866), Heterocerus parallelus (Gebler, 1830), Pyrocoelia rufa (Olivier, 1886), and Limonius minutus (Linnaeus, 1758) as the outgroups. First, PCGs and rRNAs sequences were all aligned using ClustalW (v2.1) software [33]. The sequences were then trimmed using trimAl (v1.2) software [34]. The concatenate sequence function in PhyloSuite (v1.2.2) software was used to concatenate the aligned sequences of PCGs and rRNAs [16,35], and the best-fit model was determined using ModelFinder (v2.5) software [33]. The Best-fit models for the ML and BI analyses are GTR + F + I + G4 and GTR + I + G + F, respectively. The phylogenetic trees were constructed using IQ-tree (v1.6.8) software [36] and MrBayes (v3.2.6) program [33]. The ML analyses were conducted with the following parameters: the number of bootstraps: 50,000; replicates: 1000; and minimum correlation coefficient: 0.9. For Bayesian analysis, two independent Markov chains were set with a total of 2,000,000 generations, with each chain containing 4 parallel Markov chains and a sampling interval of 100 generations. The burn-in period was set to 0.25. The final phylogenetic tree was edited and visualized using Figtree (v1.4.3) software [33].

3. Results

3.1. Genome Organization and Base Composition

This study performed the complete sequencing and annotation of the mitogenomes of four Chrysochroinae species: C. miliaris (No. PV330099), L. cupreosplendens (No. PV330528), S. insidiosa (No PV391144), and P. rubroaureus (No. PX370042). Overall, these four newly sequenced mitogenomes share the same composition, consisting of 37 coding genes (13PCGs, 22 tRNAs and 2 rRNAs) along with a control region (A + T-rich region). Further analysis revealed that four PCGs (nad1, nad4, nad4L, and nad5), eight tRNAs (trnC, trnF, trnH, trnL1, trnP, trnQ, trnV, and trnY), and two rRNAs (rrnL and rrnS) are encoded by the N strand, while the remaining 23 genes (14 tRNAs and 9 PCGs) are encoded by the J strand (Figure S1).
The A + T content of the four complete mitogenomes ranges from 68.76% to 73.47%, showing a positive AT-skews values varying from 0.098 to 0.181 (Table S1). Regarding gene overlap, the mitogenome of C. miliaris contains 12 overlapping regions, with a total length of 34 bp; L. cupreosplendens has 13 overlapping regions, with a total length of 37 bp; S. insidiosa has 20 overlapping regions, with a total length of 96 bp; and P. rubroaureus has 14 overlapping regions, with a total length of 67 bp (Table 1). Notably, the longest overlap in all four species is 35 bp (S. insidiosa), located between the cox2 and trnK genes. Additionally, there is a 7 bp overlap between the atp8 and atp6 genes, as well as between the nad4 and nad4L genes, which aligns with common features of insect mitogenomes. Worth noting is that P. rubroaureus has a 128 bp and 83 bp intergenic region between the trnD and atp8 genes, and between the rrnL and trnV genes, respectively. Which is the longest intergenic region among the four species.
Comparing with the mitogenomes of other species in the family Buprestidae, the four species provided in this study exhibit high conservation in gene arrangement, nucleotide composition, and codon usage patterns. Gene rearrangement was not detected in these four mitogenomes.

3.2. Protein-Coding Regions, Codon Usage and Nucleotide Diversity

There are differences in the total lengths of PCGs among the four mitogenome: C. miliaris (11,159 bp), L. cupreosplendens (11,150 bp), S. insidiosa (11,034 bp), and P. rubroaureus (11,140 bp), which account for 66.16–71.93% of their respective mitogenome lengths. Among the 13 PCGs, the atp8 gene is the shortest, ranging from 156 to 177 bp, while the nad5 gene is the longest, with a length ranging from 1708 to 1720 bp. In terms of initiation codons, most PCGs use ATN (ATA/ATT/ATG/ATC) as the start codon, while the nad1 and cox1 gene are unique in using TTG and ACG as the start codon, respectively. Furthermore, the start codons for cox1 in C. miliaris and L. cupreosplendens are not detected, potentially indicating an unusual start codon. Termination codon analysis shows that, except for five genes (cox1, cox2, cox3, nad5, and nad4) that use incomplete termination codons (T-), which are completed by the addition of an A residue at the 3′ end of mRNA, the remaining genes use TAA or TAG as termination codons [37,38].
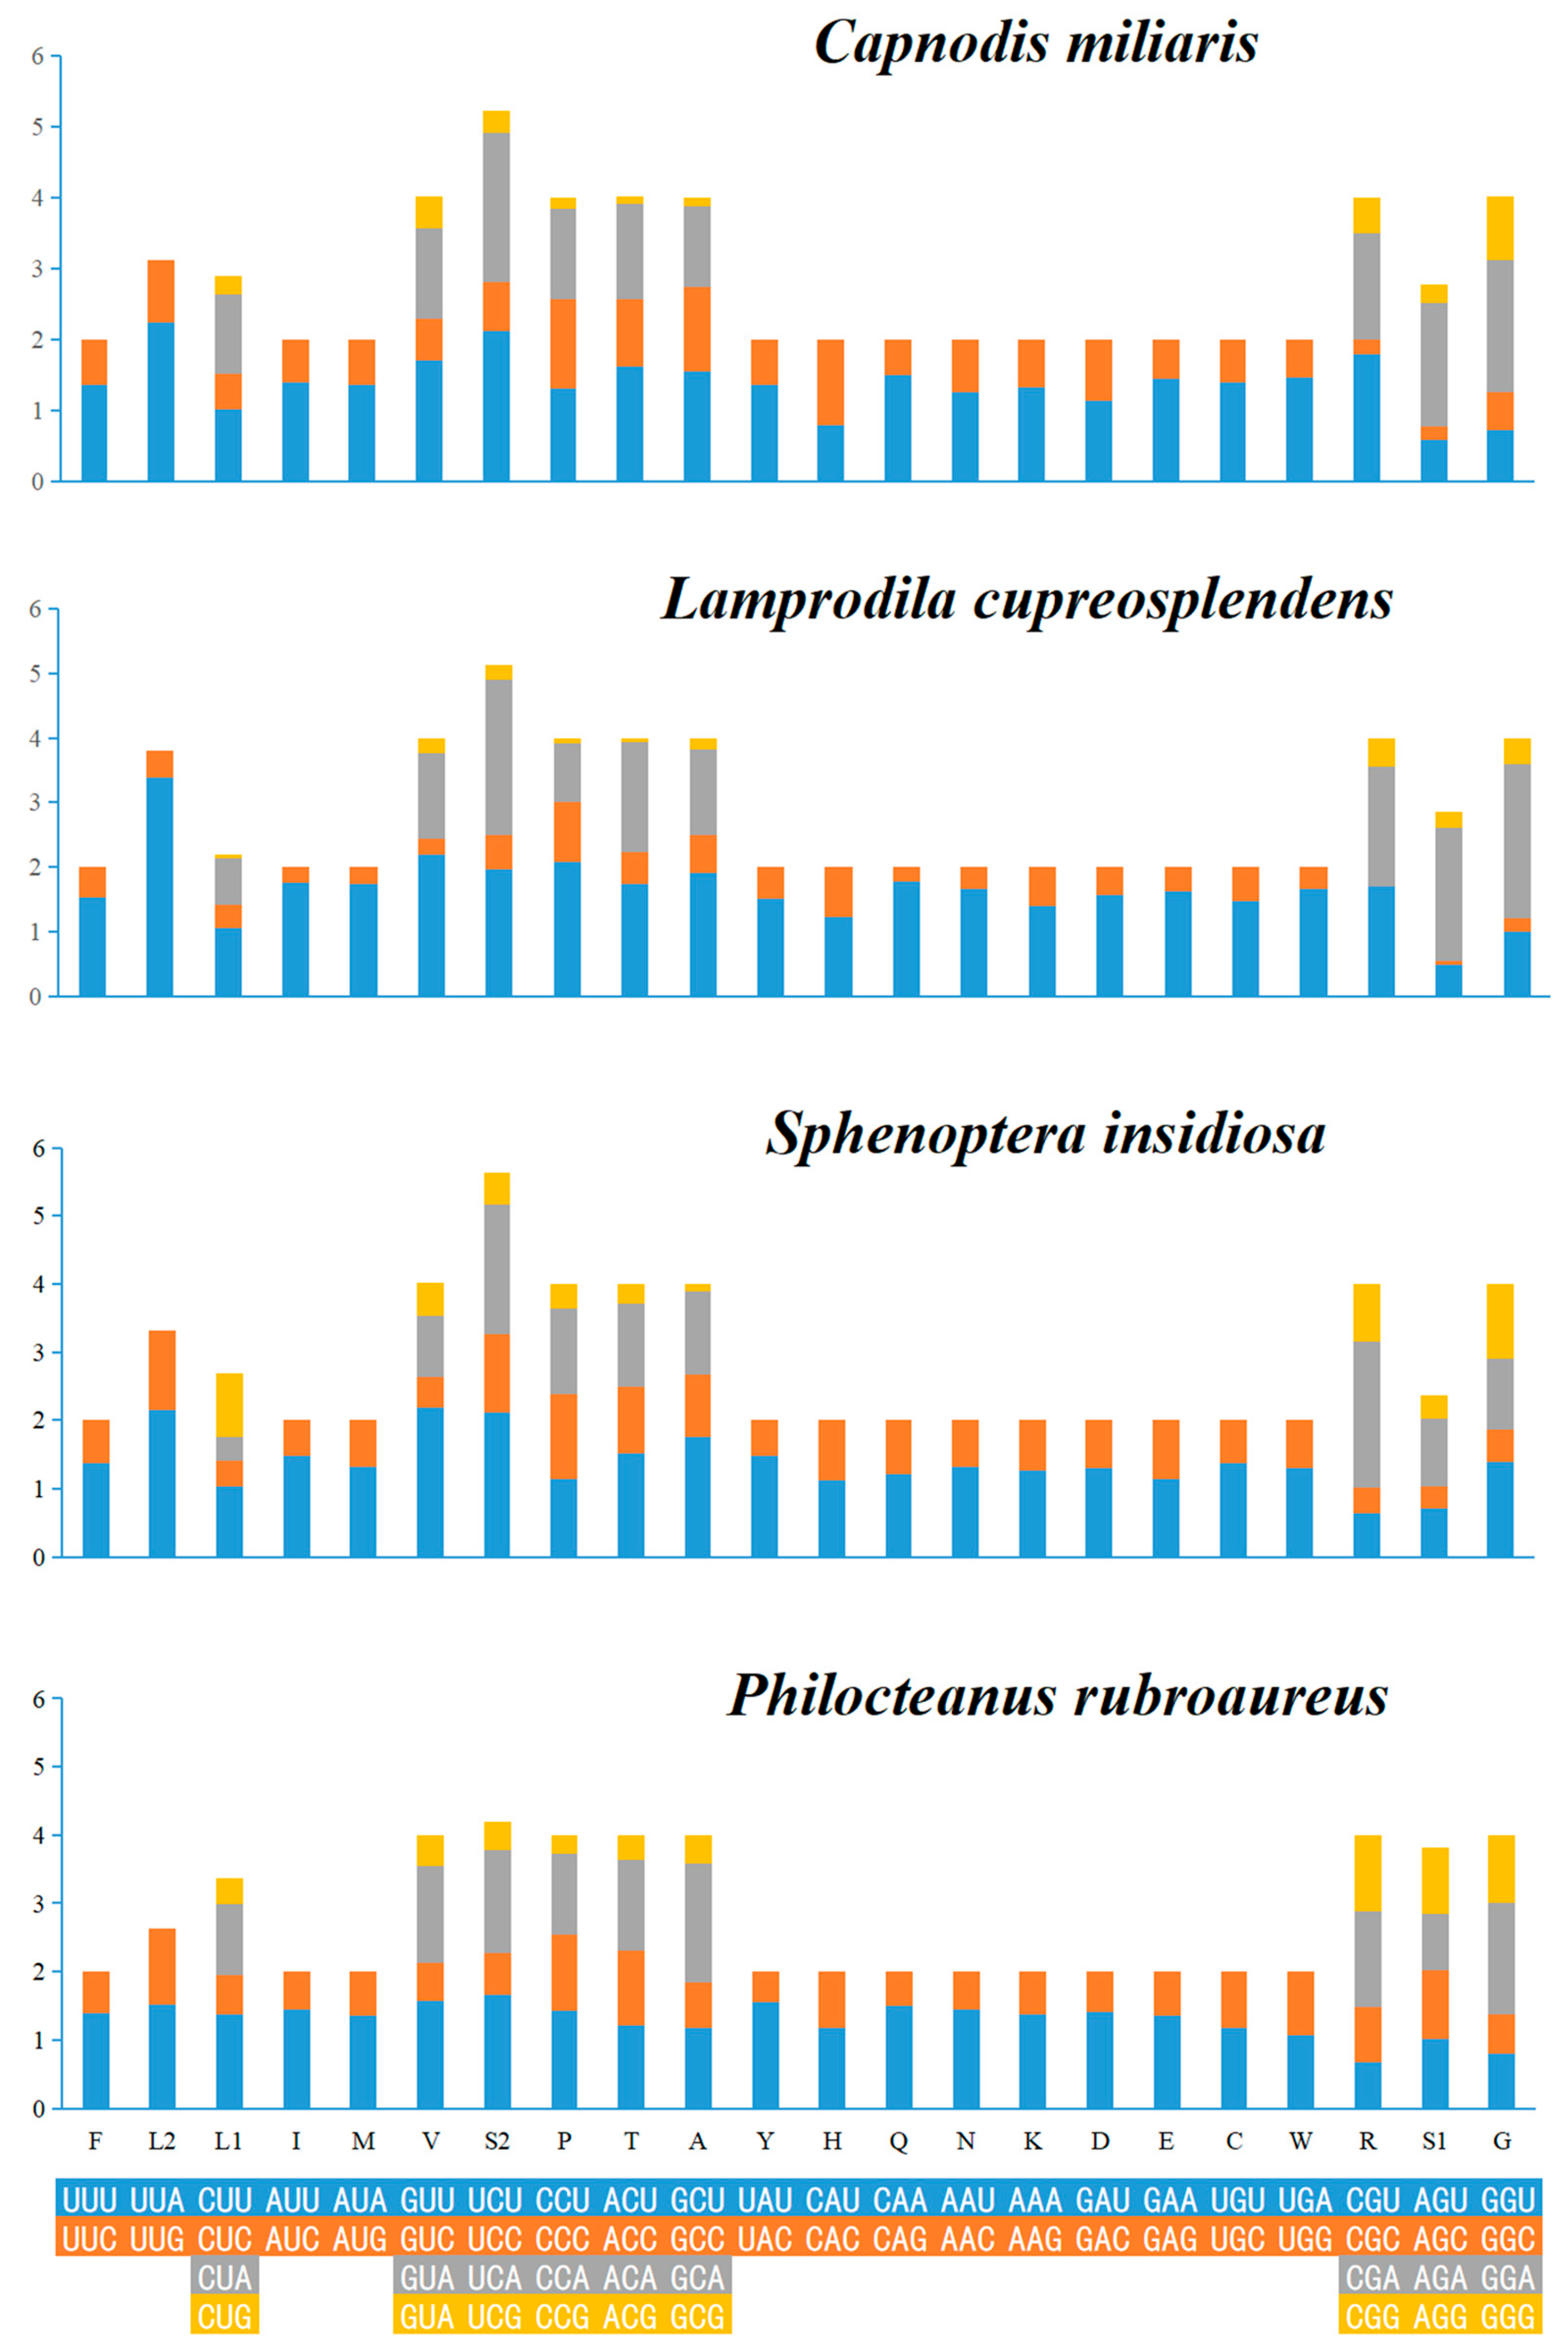
The amino acid counts of PCGs in these four mitogenomes (Figure 1) and the relative synonymous codon usage (RSCU) values (Figure 2) are presented. The results indicate that Phe (F), Ile (I), Ser (S2), and Leu (L2) are the four most commonly used amino acids, while the content of other amino acids is below 7.00%. In addition, C. miliaris and L.cupreosplendens have relatively large total numbers of amino acids, whereas S. insidiosa has a relatively small total number. This reflects differences in the length of proteins encoded by the mitogenome. The RSCU values show that TTT (Phe), ATT (Ile), TCT (Ser2), and TTA (Leu2) are the most frequently used codons. The UUU codon for Phe is used significantly more frequently across multiple species, while the UUA and UUG codons of Leu exhibit a strong usage bias. Additionally, the AUU and AUC codons for Ile maintain a high usage frequency. These preferential characteristics are associated with the efficiency of gene expression regulation and the evolutionary adaptability of species, reflecting group-specific codon selection within the mitogenomes of chrysochroine beetles.
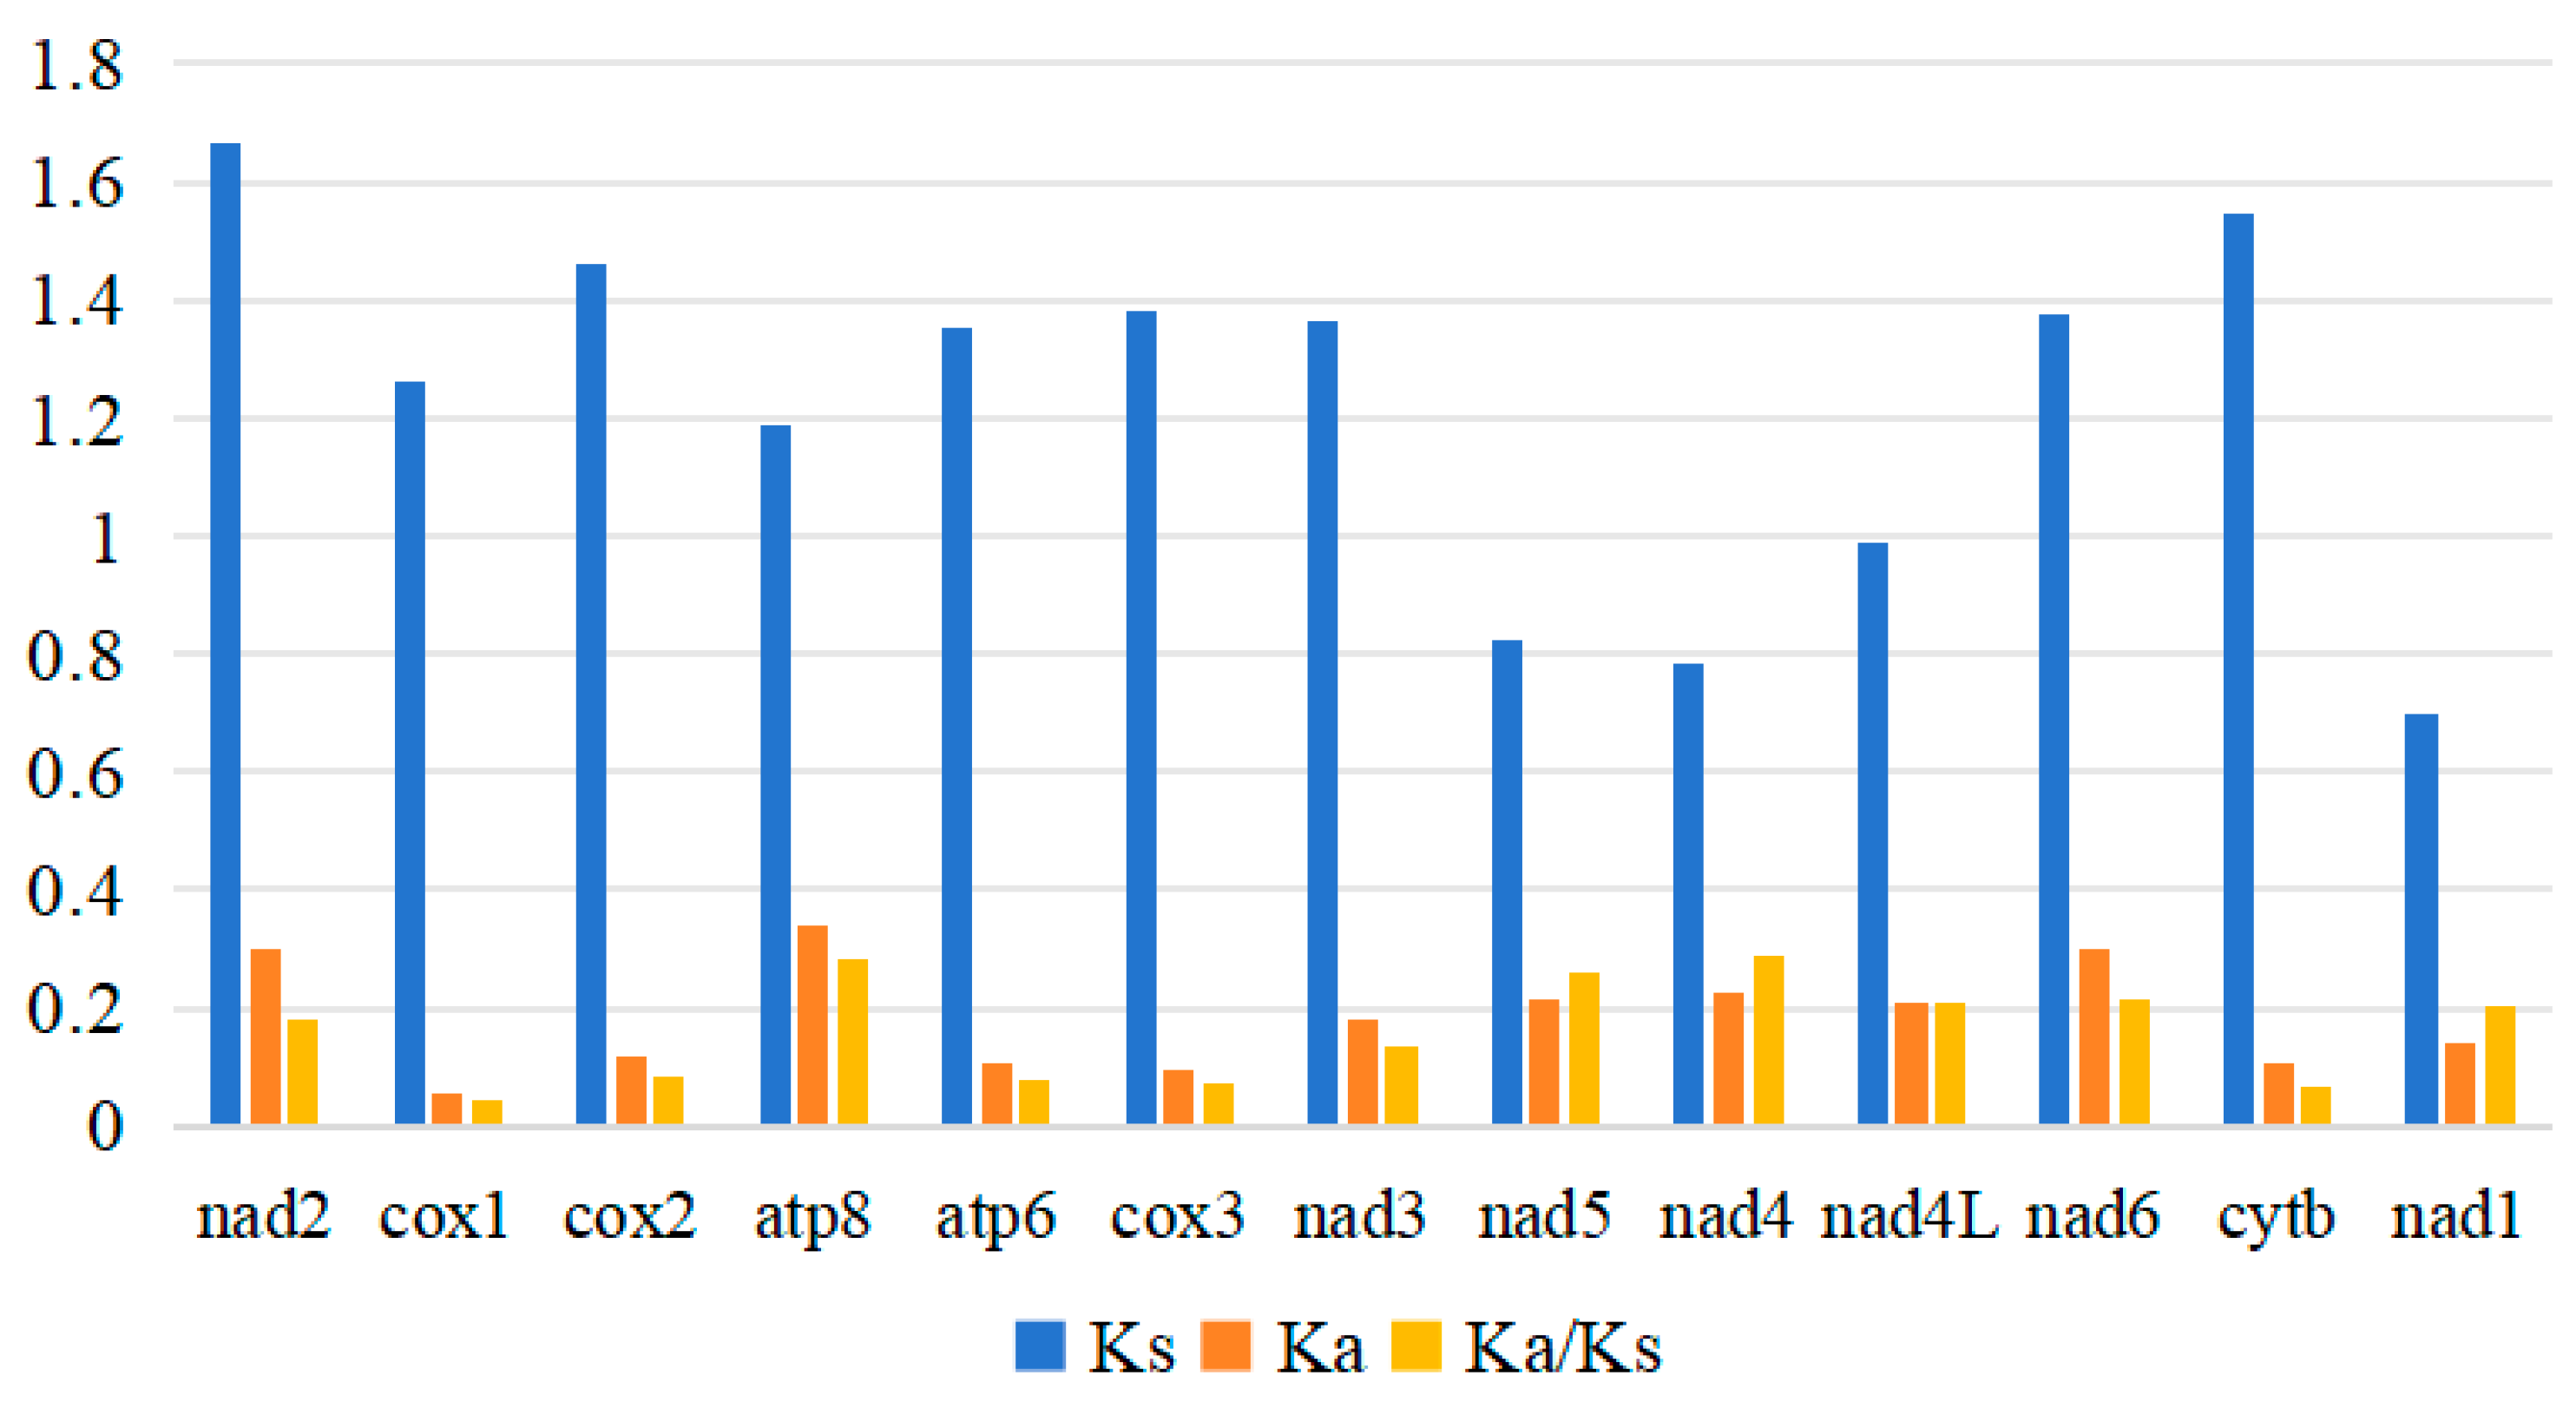
The nucleotide diversity (Pi) of PCGs in these four mitogenomes was measured, with results ranging from 0.193 to 0.345. Specifically, the nad2 (Pi = 0.345) exhibited the highest variability, followed by nad6 (Pi = 0.337), atp8 (Pi = 0.33), and nad3 (Pi = 0.273), while the cox1 gene showed the lowest variability (Pi = 0.193). By calculating the nonsynonymous substitution rate (Ka), synonymous substitution rate (Ks), and Ka/Ks ratio of PCGs in these four mitogenomes (Figure 3), it was found that the indicators of the nad4 were significantly higher than those of other genes, suggesting that this gene has a relatively fast evolutionary rate. Among these genes, the cox1 gene having the lowest value (Ka/Ks = 0.04). This result indicates the presence of purifying selection in these four species [39]. The ATP8 gene has a relatively higher Ka value compared to other genes, and its Ka/Ks ratio is also relatively high. This suggests that the gene experiences weaker purifying selection constraints during evolution; however, it still undergoes purifying selection overall, maintaining the basic stability of mitochondrial functions.

3.3. Ribosomal and Transfer RNA Genes

The rRNAs are located in the A + T region between trnL1 and trnV. Both rRNA genes are located on the N strand, with the length of 16S ranging from 1185 to 1290 bp and the length of 12S ranging from 607 to 737 bp. Their A + T content is between 72.18% and 76.74%, and the AT-skew values range from −0.16 to −0.03. The total length of the 22 tRNAs is between 1438 and 1452 bp, with individual gene lengths ranging from 61 to 71 bp. The A + T content is between 73.75% and 74.4%, and the AT-skew values range from 0.01 to 0.02. Structural analysis showed that, except for trnS1, which cannot form the standard cloverleaf structure due to the absence of the DHU arm, the remaining tRNAs exhibit typical cloverleaf secondary structures. Notably, the trnS1 genes of the four species are nearly identical in size, measuring 68 bp, 67 bp, 67 bp, and 67 bp (Figures S2–S5). U-G mismatches were also detected in some tRNA genes.

3.4. Control Region and Gene Arrangement

The control region (CR), also known as the A + T-rich region or non-coding region, is a core functional unit in the mitogenome. As the longest non-coding region in the mitogenome, it is typically located between trnI and rrnS. This region exhibits unique evolutionary characteristics, with an evolutionary rate approximately 2.8 to 5 times higher than that of other mitochondrial regions, marked by frequent base substitutions and rich sequence variations.
In this study, the control region lengths of the four species, C. miliaris, L. cupreosplendens, S. insidiosa, and P. rubroaureus, were 1581 bp, 1635 bp, 1488 bp, and 1138 bp, respectively. Sequence analysis results showed that the A + T content of the control region (75.66–95.48%) was significantly higher than of other components of the mitogenome, including PCGs (66.16–71.93%), rRNA (72.18–76.74%), and tRNA (70.85–74.4%) (Table 2). Furthermore, compositional analysis indicated that the CR of these four species in subfamily Chrysochroinae exhibited both positive and negative AT-skew values, revealing the diversity of base composition in this region.

3.5. Phylogenetic Analysis

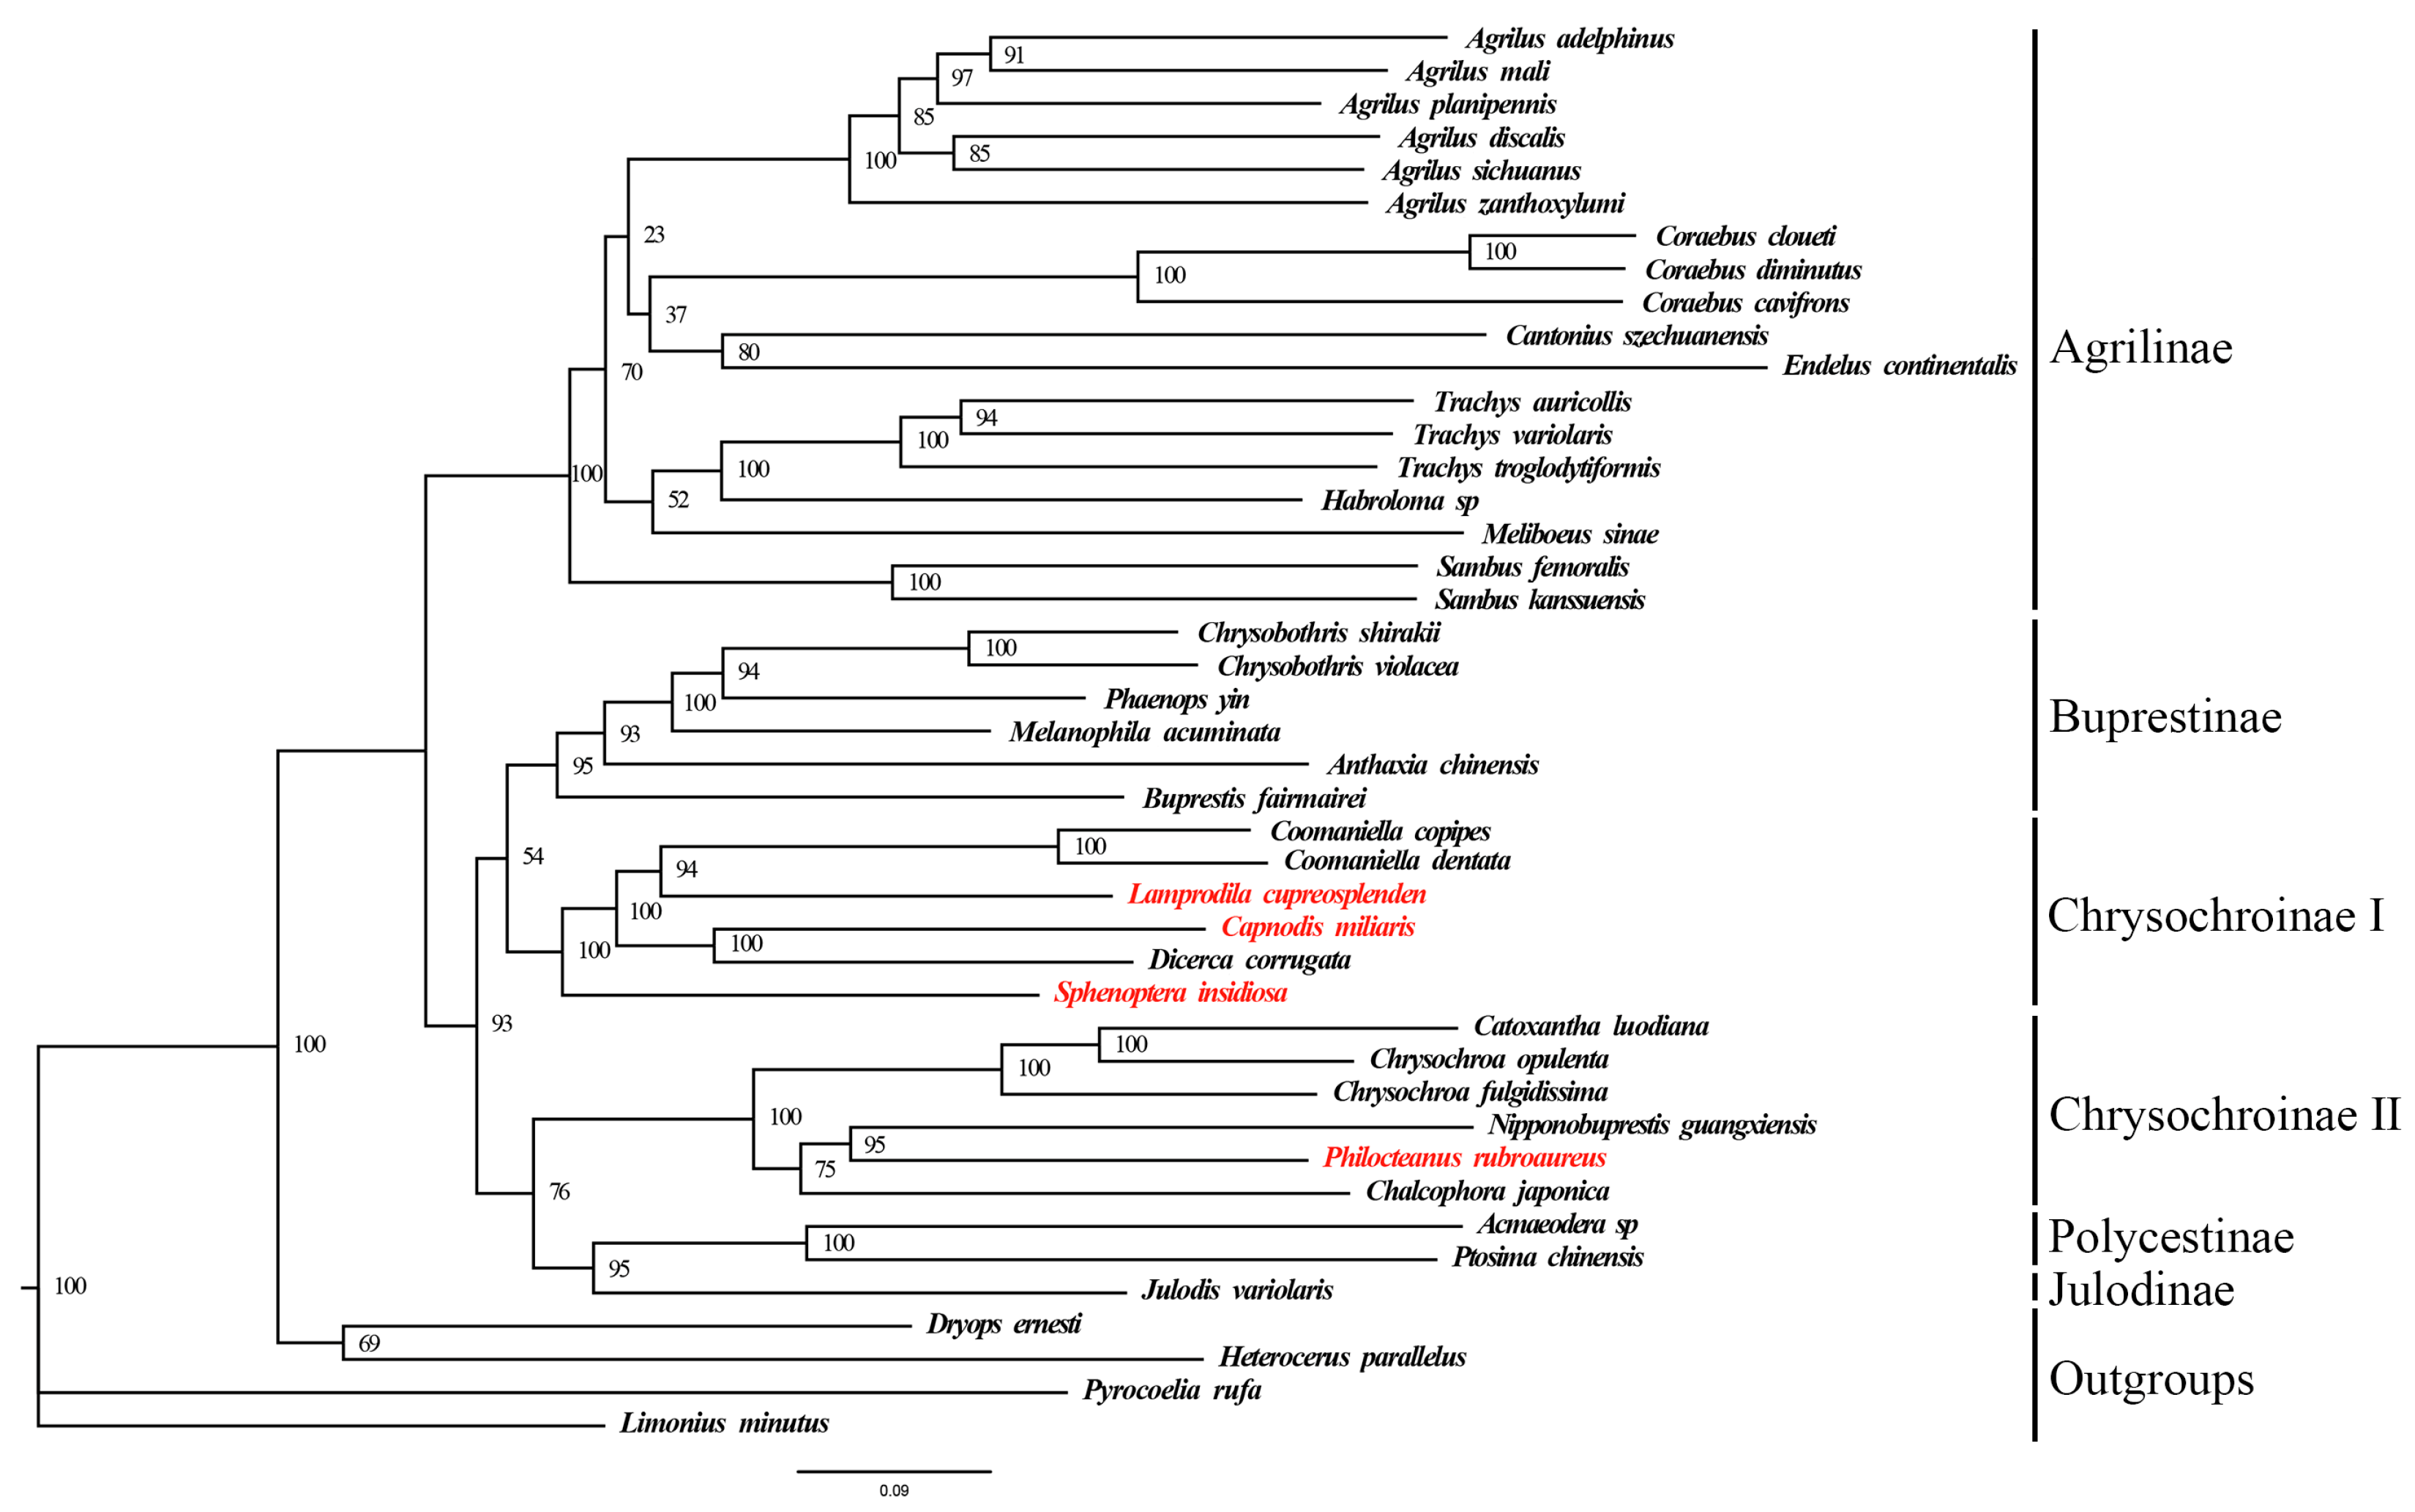
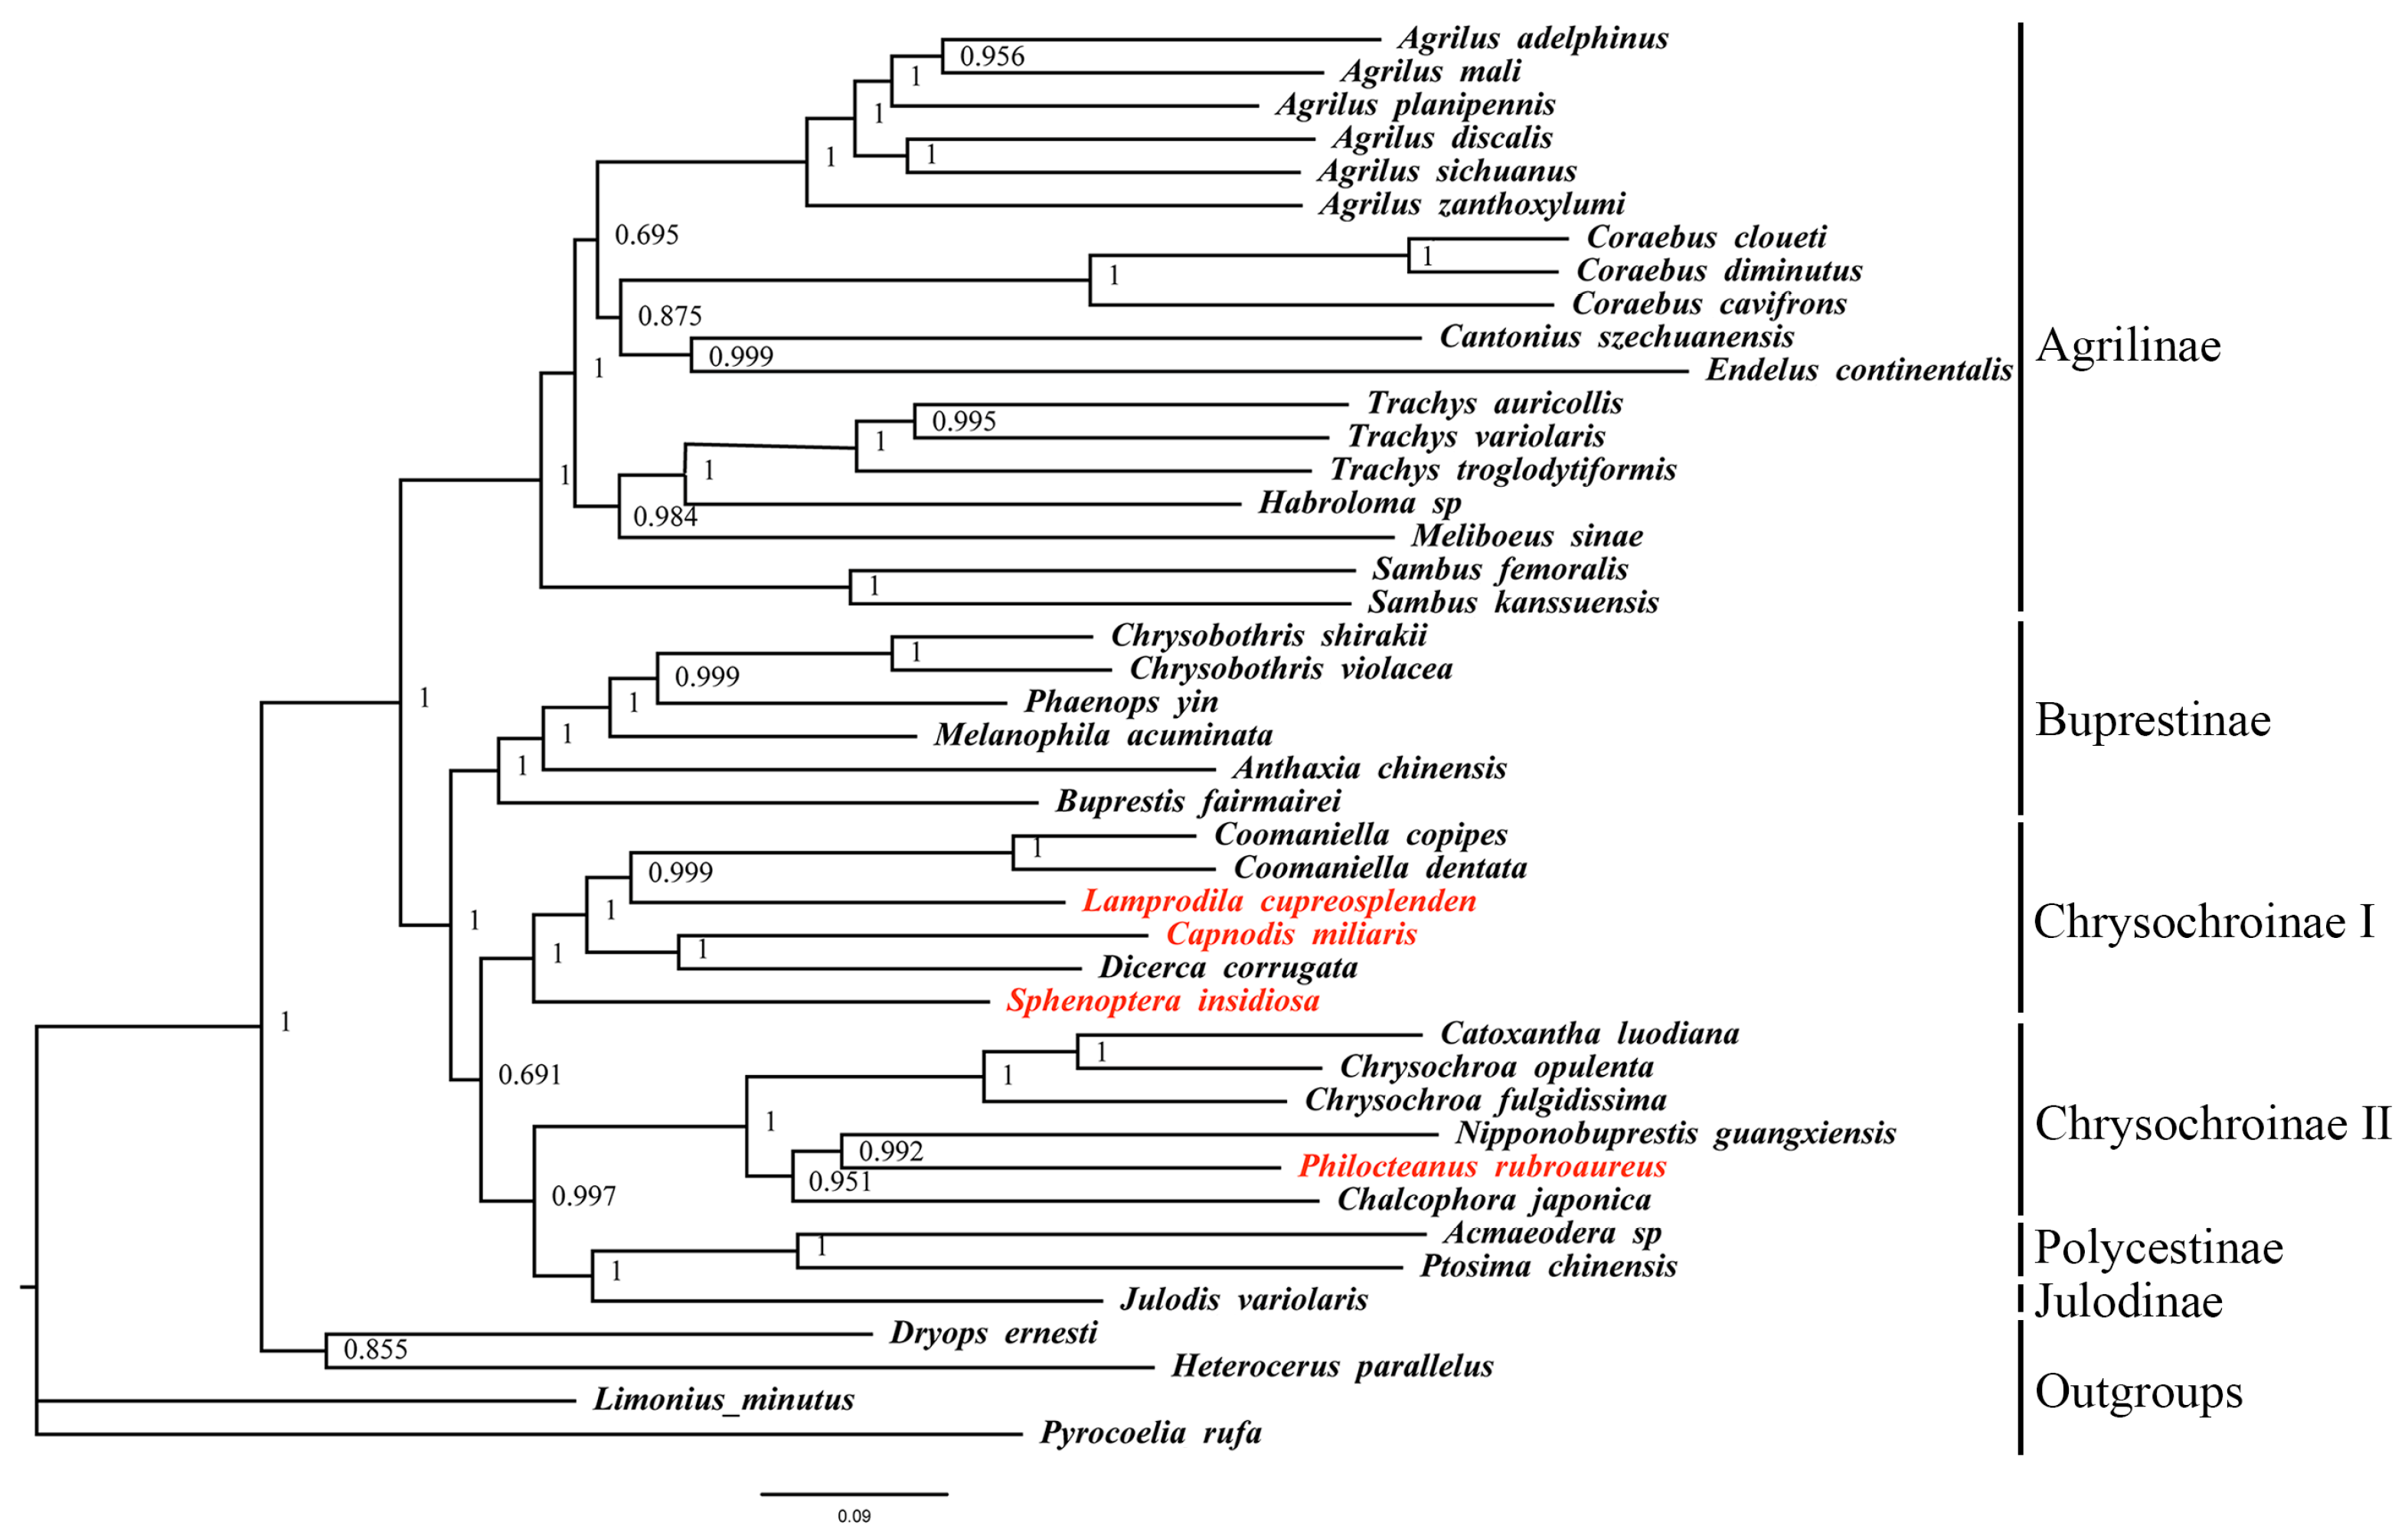
To better understand the phylogenetic position of these four species and the phylogenetic relationships among subfamilies in Buprestidae, this study used a mitogenome dataset (13 PCGs + 2 rRNAs) from 43 species, including four outgroups, to construct ML and BI trees. Despite using two different methods, the topologies of the phylogenetic trees were consistent (Figure 4 and Figure 5). Outgroup taxa and buprestid species were clearly separated, supporting the monophyly of Buprstidae.
Based on the topologies of the ML and BI trees, the Chrysochroniae is a paraphyletic group. The four target species cluster together with other Buprestinae species, forming a clade with low support values. In the Chrysochroinae I clade, ((Coomaniella copipes + Coomaniella dentata) + Lamprodila cupreosplendens) and (Capnodis miliaris + Dicerca corrugata) are sister groups; in the Chrysochroinae II clade, ((Catoxantha luodiana + Chrysochroa opulenta) + Chrysochroa fulgidissima) and ((Nipponobuprestis guangxiensis + Philocteanus rubroaureus) + Chalcophora japonica) are sister groups.

4. Discussion

The mitogenome has many advantages, such as high conservatism, maternal inheritance, and a relatively fast evolutionary rate, making it an important tool in studies of phylogenetic relationships, species identification, and environmental adaptability [21,22,23,24,40]. Additionally, the complete mitogenome not only provides insights into general genomic characteristics but also has the potential to study functional molecular mechanisms [41]. Therefore, in this study, we newly sequenced the mitogenomes of four Chrysochroinae species and combined them with the mitogenome of 39 known buprestid species to construct the phylogenic trees of Buprestidae.
The results indicated that the four newly sequenced mitogenomes contain 37 typical genomic genes and a control region. The gene composition is consistent with the mitogenome characteristics of Buprestidae reported in previous studies [16,42,43,44]. In terms of mitogenome length, it is moderate, mainly influenced by the length of the control region, which is consistent with the previous study [45]. Further analysis revealed the absence of gene rearrangements in these four mitogenomes, which is also consistent with previous studies [42,46]. With respect to base composition, all four new sequences show a distinct AT-skew. The analysis of amino acid usage frequency shows that L2, I, S2, and F are the most frequently occurring amino acids, which corroborates previous studies [42,43,44,45,47]
In the PCGs, the cox1 gene exhibited the lowest variability (Pi = 0.193), with its Ka/Ks ratio also being the lowest. This suggested that the cox1 gene had a relatively slow evolutionary rate, consistent with previous studies [16,45]. In tRNAs, except for trnS1, all other tRNAs has the typical cloverleaf secondary structure; however, the dihydrouridine (DHU) arm of trnS1 formed a simple circular structure, differing from the conventional structure [16,44,48,49]. The topologies phylogenetic trees showed significant differences in the phylogenetic relationships between subfamilies compared to previous study [18]. This is mainly attributed to the different genes and different number of inergroup: previous study analyzed four gene fragments from 141 ingroup taxa, whereas this study used mitogenome data from 39 ingroup taxa for phylogenetic analysis.
The results of phylogenetic analysis showed that the subfamily Chrysochroinae is not a monophyletic group, which is divided into two clades. This finding contrasts with previous studies, which indicated that the Coomaniellini and Dicercini tribes were more closely related [45,46,50]. The result of this study may be caused by differences in the number of mitogenomes. It is noteworthy that some researchers support the merger of Chrysochroinae and Buprestinae, suggesting that there is no clear distinction between these two subfamilies [18,51,52,53]. Additionally, in Agrilinae, the classification status of the genus Sambus has also been subject to frequent changes [1,42,45,54]. In this study, the relationship between Chrysochroinae and Buprestinae is not well addressed. In the future, mitogenome data from more species of the Buprestidae will be used to explore the phylogenetic relationships among the high-level taxa.

5. Conclusions

In this study, the mitogenomes of C. miliaris, L. cupreosplendens, S. insidiosa, and P.rubroaureus were sequenced, assembled and annotated. The total lengths of these four mitogenomes ranged from 15,778 bp to 16,230 bp, and their gene arrangement order is completely consistent with that of the known buprestid mitogenomes. These four mitogenomes exhibit the characteristic of high A + T content, which is consistent with the common base composition preference of insect mitogenomes, accompanied by a positive AT-skew and a negative GC-skew. PCGs generally follow the conserved ATN start codon pattern, but specific variations have also been identified: nad1 in C. miliaris and L. cupreosplendens starts with TTG, while cox1 in S. insidiosa uses ACG. These exceptions provide valuable insights into the molecular evolutionary characteristics of PCGs. The phylogenetic trees constructed by the two methods have consistent topology, and the results of phylogenetic analysis showed that Chrysochroinae is paraphyletic. The phylogenetic relationship within Chrysochroinae os not well resolved, and it may require more Buprestid mitogenome data or genomic data combing morphological characteristics, to resolve this issue.

Supplementary Materials

The following supporting information can be downloaded at: https://www.mdpi.com/article/10.3390/biom15111531/s1, Table S1: Information on the mitogenomes of Buprestidae and outgroup taxa used for phylogeny; Figure S1: The mitogenome maps of Capnodis maliaris (A), Lamprodila cupreosplendens (B), Sphenoptera insidiosa (C) and Philocteanus rubroaureus (D); Figure S2: The secondary cloverleaf structure for the tRNAs of Capnodis maliaris; Figure S3: The secondary cloverleaf structure for the tRNAs of Lamprodila cupreosplendens; Figure S4: The secondary cloverleaf structure for the tRNAs of Sphenoptera insidiosa; Figure S5: The secondary cloverleaf structure for the tRNAs of Philocteanus rubroaureus.

Author Contributions

Conceptualization: Z.W. and A.S. Data curation: J.W. and Y.L. Formal analysis: J.W. and Z.W. Funding acquisition: Z.W. Software: J.W. and Y.L. Writing—original draft: J.W. and Z.W. Writing—review and editing: Z.W. All authors have read and agreed to the published version of the manuscript.

Funding

This study was founded by the Natural Science Foundation of Sichuan Province (2025NSFSC2117, 2024NSFSC0076).

Institutional Review Board Statement

Not applicable.

Informed Consent Statement

Not applicable.

Data Availability Statement

The new sequences of complete mitogenomes can be available in NCBI (PV330099, PV330528, PV391144, and PX370042).

Acknowledgments

We sincerely thank the collectors for their hard work in field specimen collection.

Conflicts of Interest

The authors declare no conflicts of interest.

References

  1. Bellamy, C.L. A World Catalogue and Bibliography of the Jewel Beetles (Coleoptera: Buprestoidea), Pensoft Series Faunistica; Pensoft Publishers: Sofia, Bulgaria; Moscow, Russia, 2008; Volume 1–4, pp. 1–2684. [Google Scholar]
  2. Bellamy, C.L.; Volkovitsh, M.G. 18 Buprestoidea Crowson, 1955. In Handbook of Zoology, Arthropoda: Insecta, Coleoptera, Beetles, 2nd ed.; Beutel, R.G., Kristensen, N.P., Eds.; Walter de Gruyter GmbH: Berlin, Germany; Boston, MA, USA, 2016; Volume 1, pp. 543–552. [Google Scholar]
  3. Herms, D.A.; McCullough, D.G. Emerald ash borer invasion of North America: History, biology, ecology, impact and management. Annu. Rev. Entomol. 2014, 59, 13–30. [Google Scholar] [CrossRef] [PubMed]
  4. Bozorov, T.A.; Luo, Z.H.; Li, X.S.; Zhang, D.Y. Agrilus mali Matsumara (Coleoptera: Buprestidae), a new invasive pest of wild apple in western China: DNA barcoding and life cycle. Ecol. Evol. 2018, 9, 1160–1172. [Google Scholar] [CrossRef] [PubMed]
  5. Herms, D.A. Strategies for deployment of insect resistant ornamental plants. In Mechanisms and Deployment of Resistance in Trees to Insects; Wagner, M.R., Clancy, K.M., Lieutier, F., Paine, T.D., Eds.; Kluwer Academic Publishing: Dordrecht, The Netherlands, 2002; pp. 217–237. [Google Scholar]
  6. Apel, K.H.; Katzel, R.; Luttschwager, D.; Schmitz, H.; Schutz, S. Investigations on possible mechanisms of the host finding by Phaenops cyanea F. (Col., Buprestidae). Mitt. Dtsch. Ges. Allg. Angew. Ent. 2000, 12, 23–27. [Google Scholar]
  7. Xu, G.X.; Liu, Y.M.; Wu, W. Occurrence rhythm and control of Chrysobothris igai at Orange Stand. J. Zhejiang For. Sci. Technol. 2006, 26, 49–52. [Google Scholar]
  8. Åström, M.; Pettersson, L.B.; Öckinger, E.; Hedin, J. Habitat preferences and conservation of the marbled jewel beetle Poecilonota variolosa (Buprestidae). J. Insect Conserv. 2013, 17, 1145–1154. [Google Scholar] [CrossRef]
  9. Ohmomo, S.; Fukutomi, H. The Buprestid Beetles of Japan; Mushi-Sha: Tokyo, Japan, 2013. [Google Scholar]
  10. Ong, U.; Hattori, T. Jewel Beetles of Taiwan; Ministry of Beetles: Tainan, China, 2019; Volume 1. [Google Scholar]
  11. Volkovitsh, M.G.; Karpun, N.N. A new invasive species of buprestid beetles in the Russian fauna: Lamprodila (Palmar) festiva (L.) (Coleoptera, Buprestidae), a pest of Cupressaceae. Entomol. Rev. 2017, 97, 425–437. [Google Scholar] [CrossRef]
  12. Ruicănescu, A.; Stoica, A.I. The distribution and behaviour studies on a new invasive Buprestid species, Lamprodila festiva (Coleoptera: Buprestidae) in Romania. Trav. Mus. Natn. Hist. Nat. “Grigore Antipa” 2019, 62, 43–56. [Google Scholar]
  13. Zeng, F.Y.; Wang, T.; Zong, S.X. Damage characteristics and spatial distribution of Sphenoptera sp. larvae. Forest Res. 2012, 25, 223–226. [Google Scholar]
  14. Wang, J.W.; Li, Y.H.; Han, W.D.; Luo, Y.Q.; Zong, S.X. Biological characteristics of Sphenoptera sp. on Artemisia ordosoca. Chin. J. Appl. Entomol. 2012, 48, 141–146. [Google Scholar]
  15. Hong, M.Y.; Jeong, H.C.; Kim, M.J.; Jeong, H.U.; Lee, S.H.; Kim, I. Complete mitogenome sequence of the jewel beetle, Chrysochroa fulgidissima (Coleoptera: Buprestidae). Mitochondrial DNA A DNA Mapp. Seq. Anal. 2009, 20, 46–60. [Google Scholar] [CrossRef]
  16. Xiao, L.F.; Zhang, S.D.; Long, C.P.; Guo, Q.Y.; Xu, J.S.; Dai, X.H.; Wang, J.G. Complete mitogenome of a leaf-mining buprestid beetle, Trachys auricollis, and its phylogenetic implications. Genes 2019, 10, 992. [Google Scholar] [CrossRef] [PubMed]
  17. Hołyński, R.B. Taxonomic Structure of the Subtribe Chrysochroina Cast with Review of the Genus Chrysochroa Dej. (Coleoptera: Buprestidae); Gondwana: Warszawa, Poland, 2009; pp. 1–379. [Google Scholar]
  18. Evans, A.M.; Mckenna, D.D.; Bellamy, C.L.; Farrell, B.D. Large-scale molecular phylogeny of metallic wood-boring beetles (Coleoptera: Buprestoidea) provides new insights into relationships and reveals multiple evolutionary origins of the larval leaf-mining habit. Syst. Entomol. 2015, 40, 385–400. [Google Scholar] [CrossRef]
  19. Kolibááč, J. Classification and phylogeny of the Buprestoidea (Insecta: Coleoptera). Acta Mus. Moraviae Sci. biol. 2000, 85, 113–184. [Google Scholar]
  20. Volkovitsh, M.G. The comparative morphology of antennal structures in Buprestidae (Coleoptera): Evolutionary trends, taxonomic and phylogenetic implications. Part 1. Acta Mus. Morav. Sci. Biol. 2001, 86, 43–169. [Google Scholar]
  21. Li, H.; Shao, R.F.; Song, N.; Song, F.; Jiang, P.; Li, Z.H.; Cai, W.Z. Higher-level phylogeny of paraneopteran insects inferred from mitochondrial genome sequences. Sci. Rep. 2015, 5, 8527. [Google Scholar] [CrossRef]
  22. Qin, J.; Zhang, Y.Z.; Zhou, X.; Kong, X.B.; Wei, S.J.; Ward, R.D.; Zhang, A.B. Mitochondrial phylogenomics and genetic relationships of closely related pine moth (Lasiocampidae: Dendrolimus) species in China, using whole mitochondrial genomes. BMC Genom. 2015, 16, 428. [Google Scholar] [CrossRef]
  23. Tian, T.; Yuan, H.; Chen, B. Phylogeny of hydradephagan water beetles (Coleoptera: Adephaga) inferred with mitochondrial genome sequences. Acta Entomol. Sin. 2020, 63, 1016–1027. [Google Scholar]
  24. Krzywinski, J.; Li, C.; Morris, M.; Conn, J.E.; Lima, J.B.; Povoa, M.M.; Wilkerson, R.C. Analysis of the evolutionary forces shaping mitochondrial genomes of a Neotropical malaria vector complex. Mol. Phylogenet. Evol. 2011, 58, 469–477. [Google Scholar] [CrossRef]
  25. Yan, L.P.; Pape, T.; Elgar, M.A.; Gao, Y.Y.; Zhang, D. Evolutionary history of stomach bot flies in the light of mitogenomics. Syst. Entomol. 2019, 44, 797–809. [Google Scholar] [CrossRef]
  26. Motyka, M.; Kusy, D.; Háva, J.; Jahodářová, E.; Bílková, R.; Vogler, A.P.; Bocak, L. Mitogenomic data elucidate the phylogeny and evolution of life strategies in Dermestidae (Coleoptera). Syst. Entomol. 2022, 47, 82–93. [Google Scholar] [CrossRef]
  27. Nie, R.E.; Wei, J.; Zhang, S.K.; Vogler, A.P.; Wu, L.; Konstantinov, A.S.; Li, W.Z.; Yang, X.K.; Xue, H.J. Diversification of mitogenomes in three sympatric Altica flea beetles (Insecta, Chrysomelidae). Zool. Scr. 2019, 48, 657–666. [Google Scholar] [CrossRef]
  28. Park, J.S.; Cho, Y.; Kim, M.J.; Nam, S.H.; Kim, I. Description of complete mitochondrial genome of the black-veined white, Aporia crataegi (Lepidoptera: Papilionoidea), and comparison to papilionoid species. J. Asia-Pac. Entomol. 2012, 15, 331–341. [Google Scholar] [CrossRef]
  29. Hahn, C.; Bachmann, L.; Chevreux, B. Reconstructing mitochondrial genomes directly from genomic next-generation sequencing reads—A baiting and iterative mapping approach. Nucleic Acids Res. 2013, 41, e129. [Google Scholar] [CrossRef] [PubMed]
  30. Kearse, M.; Moir, R.; Wilson, A.; Stones-Havas, S.; Cheung, M.; Sturrock, S.; Buxton, S.; Cooper, A.; Markowitz, S.; Duran, C.; et al. Geneious basic: An integrated and extendable desktop software platform for the organization and analysis of sequence data. Bioinformatics 2012, 28, 1647–1649. [Google Scholar] [CrossRef]
  31. Peng, Z.L. A study on the genus Nipponobuprestis Obenberger (Coleoptera: Buprestidae). Insect Sci. 1995, 2, 95–103. [Google Scholar] [CrossRef]
  32. Rozas, J.; Ferrer-Mata, A.; Sánchez-DelBarrio, J.C.; Guirao-Rico, S.; Librado, P.; Ramos-Onsins, S.E.; Sánchez-Gracia, A. DnaSP 6: DNA sequence polymorphism analysis of large data sets. Mol. Biol. Evol. 2017, 34, 3299–3302. [Google Scholar] [CrossRef]
  33. Kumar, S.; Stecher, G.; Tamura, K. MEGA7: Molecular evolutionary genetics analysis version 7.0 for bigger datasets. Mol. Phylogenetics Evol. 2016, 33, 1870–1874. [Google Scholar] [CrossRef]
  34. Capella-Gutiérrez, S.; Silla-Martínez, J.M.; Gabaldón, T. TrimAl: A tool for automated alignment trimming in large-scale phylogenetic analyses. Bioinformatics 2009, 25, 1972–1973. [Google Scholar] [CrossRef]
  35. Thompson, J.D.; Higgins, D.G.; Gibson, T.J. Clustal W: Improving the sensitivity of progressive multiple sequence alignment through sequence weight, position-specific gap penalties and weight matrix choice. Nucleic Acids Res. 1994, 22, 4673–4680. [Google Scholar] [CrossRef]
  36. Nguyen, L.T.; Schmidt, H.A.; von Haeseler, A.; Minh, B.Q. IQ-TREE: A fast and effective stochastic algorithm for estimating maximum-likelihood phylogenies. Mol. Biol. Evol. 2015, 32, 268–274. [Google Scholar] [CrossRef]
  37. Anderson, S.; Bankier, A.T.; Barrell, B.G.; de Bruijin, M.H.L.; Droujn, A.R.J.; Eperon, I.C.; Nierlich, D.P.; Roe, B.A.; Sanger, F.; Schreier, P.H.; et al. Sequence and organization of the human mitochondrial genome. Nature 1981, 290, 457–465. [Google Scholar] [CrossRef]
  38. Ojala, D.; Montoya, J.; Attardi, G. TRNA punctuation model of RNA processing in human mitochondria. Nature 1981, 290, 470–474. [Google Scholar] [CrossRef]
  39. Shen, X.; Li, X.; Sha, Z.; Yan, B.; Xu, Q. Complete mitochondrial genome of the Japanese snapping shrimp Alpheus japonicus (Crustacea: Decapoda: Caridea): Gene rearrangement and phylogeny within Caridea. Sci. China Life Sci. 2012, 55, 591–598. [Google Scholar] [CrossRef]
  40. Chen, X.Q. Phylogenetic Relationships of Buprestidae (Coleoptera) Based on Molecular and Morphological Data. J. Insect Syst. Evol. 2024, 52, 189–205. [Google Scholar]
  41. Zhang, Y.J.; Jiang, N.; Liu, Q.; Zhu, Y.; Huang, X. The role of mitochondrial damage in cadmium-induced hepatocyte apoptosis and DNA damage. J. Hygiene Res. 2020, 49, 290–297. [Google Scholar]
  42. Huang, X.Y.; Wei, Z.H.; Lu, J.W.; Shi, A.M. Mitogenomic analysis and phylogenetic relationships of Agrilinae: Insights into the evolutionary patterns of a diverse buprestid subfamily. PLoS ONE 2023, 18, e0291820. [Google Scholar] [CrossRef] [PubMed]
  43. Ronquist, F.; Teslenko, M.; van der Mark, P.; Ayres, D.L.; Darling, A.; Höhnam, S.; Largetm, B.; Lium, L.; Suchardm, M.A.; Huelsenbeck, J.P. MrBayes 3.2: Efficient Bayesian phylogenetic inference and model choice across a large model space. Syst. Biol. 2012, 61, 539–542. [Google Scholar] [CrossRef]
  44. Wei, Z.H. The complete mitochondrial genomes of five Agrilinae (Coleoptera, Buprestidae) species and phylogenetic implications. ZooKeys 2022, 1092, 195–212. [Google Scholar] [CrossRef]
  45. Ouyang, B.W.; Huang, X.Y.; Gan, Y.J.; Wei, Z.H.; Shi, A.M. Three mitochondrial genomes of Chrysochroinae (Coleoptera, Buprestidae) and phylogenetic analyses. Genes 2024, 15, 1336. [Google Scholar] [CrossRef]
  46. Li, Y.; Wang, J.; Ouyang, B.; Wei, Z.; Shi, A. Four Mitochondrial Genomes of Buprestinae (Coleoptera: Buprestidae) and Phylogenetic Analyses. Genes 2025, 16, 828. [Google Scholar] [CrossRef]
  47. Huang, X.Y.; Chen, B.; Wei, Z.H.; Shi, A.M. First report of complete mitochondrial genome in the tribes Coomaniellini and Dicercini (Coleoptera: Buprestidae) and phylogenetic implications. Genes 2022, 13, 1074. [Google Scholar] [CrossRef]
  48. Li, H.; Liu, H.Y.; Song, F.; Shi, A.M.; Zhou, X.G.; Cai, W.Z. Comparative mitogenomic analysis of damsel bugs representing three tribes in the family Nabidae (Insecta: Hemiptera). PLoS ONE 2012, 7, e45925. [Google Scholar] [CrossRef]
  49. Song, F.; Li, H.; Jiang, P.; Zhou, X.; Liu, J.P.; Sun, C.H.; Vogler, A.P.; Cai, W.Z. Capturing the phylogeny of holometabola with mitochondrial genome data and Bayesian site-heterogeneous mixture models. Genome Biol. Evol. 2016, 8, 1411–1426. [Google Scholar] [CrossRef] [PubMed]
  50. Wei, Z.H.; Huang, X.Y.; Shi, A.M. First mitochondrial genome of subfamily Julodinae (Coleoptera, Buprestidae) with its phylogenetic implications. ZooKeys 2023, 1139, 165–182. [Google Scholar] [CrossRef] [PubMed]
  51. Tôyama, M. The systematic positions of some buprestid genera (Coleoptera, Buprestidae). Elytra 1987, 15, 1–11. [Google Scholar]
  52. Hołyński, R.B. Remarks on the general classification of Buprestidae Leach as applied to Maoraxiina. Folia Entomol. Hung. 1988, 49, 49–54. [Google Scholar]
  53. Hołyński, R.B. A reassessment of the internal classification of the Buprestidae Leach (Coleoptera). Cryst. Ser. Zool. 1993, 1, 1–42. [Google Scholar]
  54. Kubáň, V. New nomenclatorial and taxonomic acts, and comments. Buprestidae: Various groups. In Catalogue of Palaearctic Coleoptera; Löbl, I., Löbl, D., Eds.; Brill: Leiden, The Netherlands; Boston, MA, USA, 2016; Volume 3, pp. 19–27, 432–438, 456–470, 494–523, 554–574, 983. [Google Scholar]
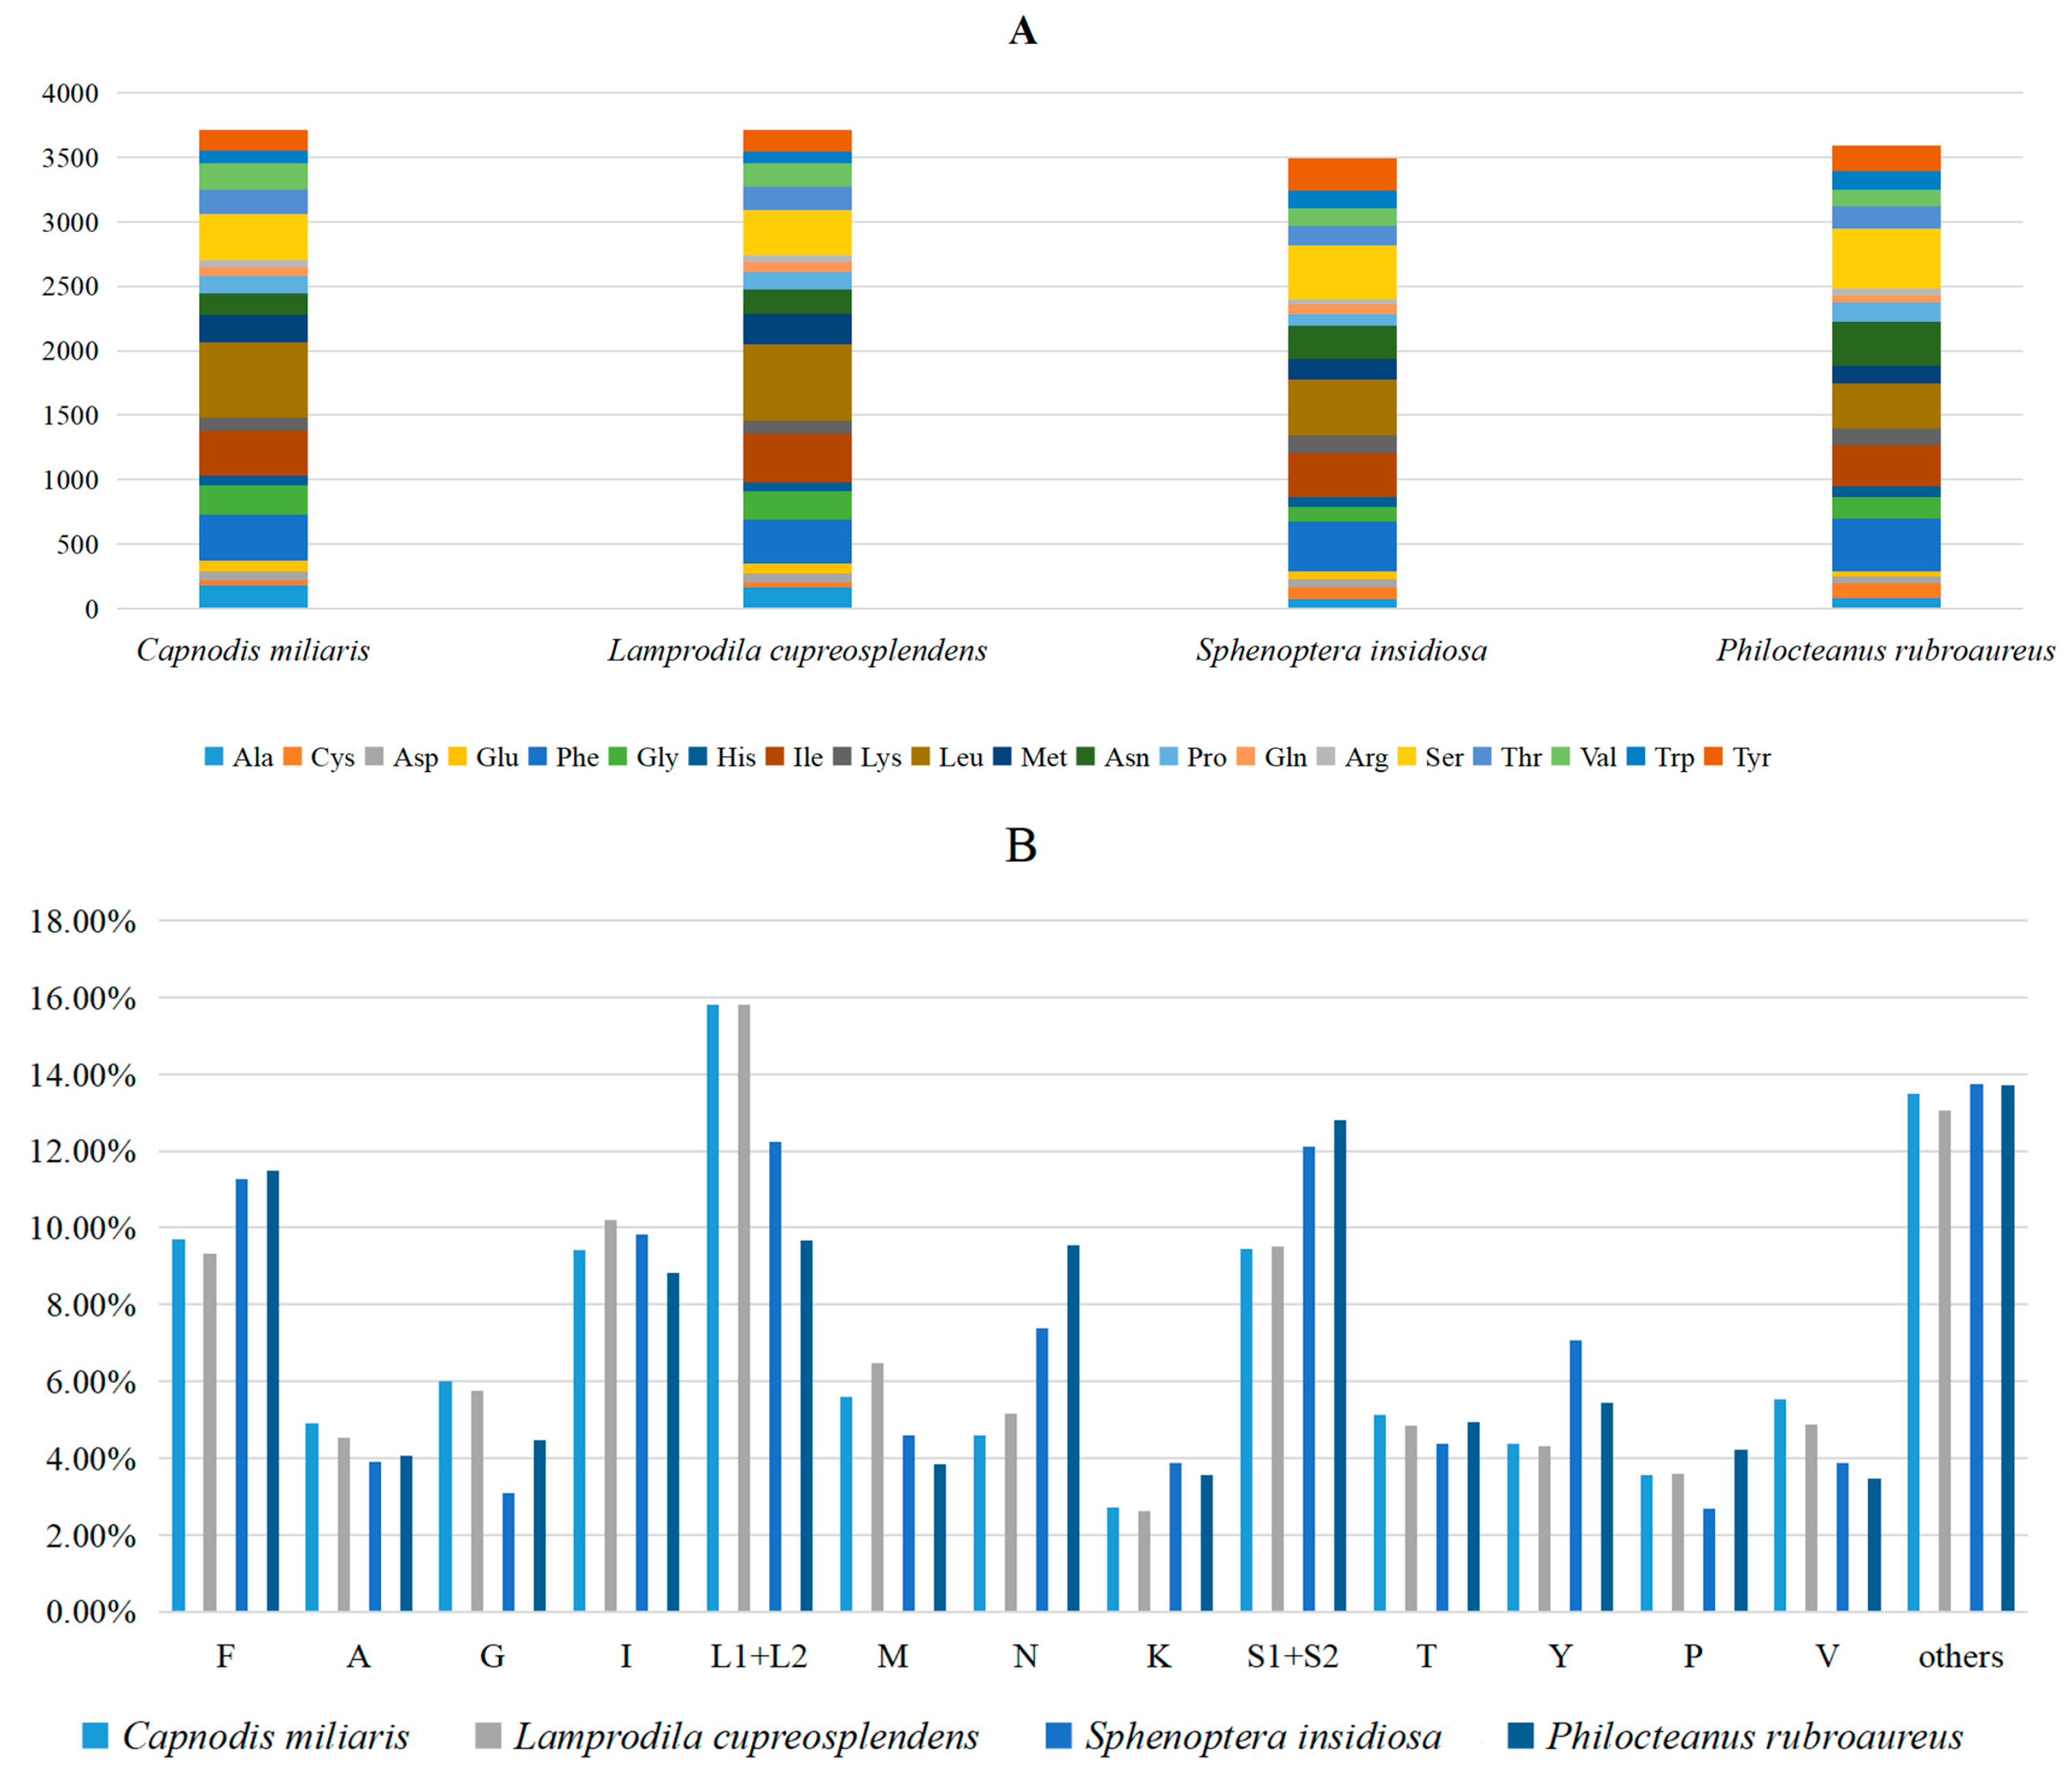
Figure 1. Amino acid composition analysis of four new mitogenome sequences. (A) Numbers of different amino acids. (B) Percentages of the top twelve amino acids. The stop codon is not included in these graphs.
Biomolecules 15 01531 g001
Figure 2. Relative synonymous codon usage of the four new sequenced mitogenome.
Biomolecules 15 01531 g002
Figure 3. The ratio of Ka/Ks of 13 PCGs in the four newly sequenced buprestid mitogenomes.
Biomolecules 15 01531 g003
Figure 4. Maximum likelihood tree of 39 Buprestidae based on 13 PCGs + 2 rRNAs. Values at nodes are bootstrap support values. Red names are the target species provided in this study.
Biomolecules 15 01531 g004
Figure 5. Bayesian tree of 39 Buprestidae based on 13 PCGs + 2 rRNAs. Values at nodes are posterior probability. Red names are the target species provided in this study.
Biomolecules 15 01531 g005
Table 1. Information of the four newly annotated Chrysochroinae mitogenomes.
GeneStrandPositionCodonsIntergenic
Nucleotides
FromToStartStop
trnIJ1/1/1/164/64/64/66 0/0/0/0
trnQN77/62/62/64145/130/130/132 12/−3/−3/−3
trnMJ145/130/130/132214/198/198/200 −1/−1/−1/−1
nad2J215/199/253/2011240/1221/1224/1220ATT/ATT/ATT/ATATAA/TAA/TAA/TAG0/0/54/0
trnWJ1239/1220/1223/12221305/1286/1288/1293 −2/−2/−2/1
trnCN1298/1279/1281/12861363/1340/1341/1346 −8/−8/−8/−8
trnYN1364/1341/1342/13471427/1404/1404/1411 0/0/0/0
cox1J1429/1406/1403/14042959/2936/2941/2944?/?/ACG/ATTT/T/TAA/T1/1/−2/−8
trnL2J2960/2937/2937/29453024/3001/3002/3010 0/0/−5/0
cox2J3025/3002/3051/30113712/3683/3725/3698ATA/ATA/ATA/ATTT/T/TAA/T0/0/48/0
trnKJ3713/3684/3691/36993783/3753/3761/3768 0/0/−35/0
trnDJ3783/3754/3761/37693847/3818/3826/3832 −1/0/−1/0
atp8J3848/3819/3827/39614003/3974/3985/4137ATC/ATA/ATT/ATCTAA/TAA/TAA/TAA0/0/0/128
atp6J3997/3968/3979/41314671/4642/4653/4805ATG/ATG/ATG/ATGTAA/TAA/TAA/TAA−7/−7/−7/−7
cox3J4671/4642/4653/48055457/5428/5440/5591ATG/ATG/ATG/ATGT/T/T/T−1/−1/−1/−1
trnGJ5458/5429/5440/55925521/5490/5503/5654 0/0/−1/0
nad3J5522/5491/5504/56555875/5844/5857/6008ATT/ATT/ATA/ATATAG/TAG/TAA/TAG0/0/0/0
trnAJ5874/5843/5863/60075935/5905/5928/6070 −2/−2/5/−2
trnRJ5935/5905/5928/60716001/5968/5994/6132 −1/−1/−1/0
trnNJ6001/5968/5994/61326065/6033/6058/6195 −1/−1/−1/−1
trnS1J6066/6034/6059/61966132/6100/6125/6262 0/0/0/−1
trnEJ6133/6101/6126/62656195/6162/6190/6326 0/0/0/2
trnFN6195/6162/6190/63266258/6225/6255/6389 −1/−1/−1/−1
nad5N6259/6226/6255/63997978/7945/7967/8106ATT/ATT/ATT/ATTT/T/TAA/T0/0/−1/9
trnHN7979/7946/7977/81108042/8009/8040/8171 0/0/9/3
nad4N8043/8010/8095/81499375/9342/9376/9507ATG/ATG/ATG/ATGT/T/T/TAA0/0/54/−24
nad4LN9369/9336/9370/95019656/9626/9660/9770ATG/ATG/ATG/ATGTAA/TAA/TAA/TAA−7/−7/−7/−7
trnTJ9659/9629/9663/97919724/9692/9727/9853 2/2/2/20
trnPN9725/9693/9727/98549789/97,575/9792/9918 0/0/0/0
nad6J9791/9759/9794/992310,294/10,262/10,303/10,423ATA/ATA/ATT/ATATAA/TAA/TAA/TAA1/1/1/4
cytbJ10,298/10,262/10,303/10,42311,440/11,404/11,445/11,562ATG/ATG/ATG/ATGTAG/TAG/TAG/TAG3/−1/−1/−1
trnS2J11,439/11,403/11,444/11,56111,506/11,470/11,510/11,628 −2/−2/−2/−2
nad1N11,543/11,489/11,528/11,64612,487/12,439/12,477/12,596TTG/TTG/ATA/TTGTAA/TAA/TAA/TAG36/18/16/17
trnL1N12,489/12,441/12,483/12,59712,552/12,504/12,542/12,660 1/1/22/0
rrnLN12,553/12,505/12,533/12,69413,842/13,790/13,759/13,878 0/0/−15/33
trnVN13,843/13,791/13,845/13,96213,912/13,860/13,914/14,031 0/0/17/83
rrnSN13,913/13,861/13,914/14,03314,649/14,587/14,538/14,639 0/0/−1/1
CR 14,650/14,588/14,695/14,64016,230/16,222/16,183/15,778 0/0/0/0
Note: The order of these four species in the table is as follows: C. miliaris, L. cupreosplendens, S. insidious and P. rubroaureus. ? represents ‘not determined’.
Table 2. Summarized mitogenomic characteristics of the four buprestid species investigated in this study.
SpeciesPCGsrRNAstRNAsA + T-Rich Region
Size
(bp)
A + T
(%)
A + T
Skew
Size
(bp)
A + T
(%)
A + T
Skew
Size
(bp)
A + T
(%)
A + T
Skew
Size
(bp)
A + T
(%)
A + T
Skew
C. miliaris11,15071.93−0.15201376.66−0.03143874.400.02163578.58−0.01
L. cupreosplendens11,15966.16−0.16202773.31−0.07145073.750.02158176.580.03
S.insidiosa11,03471.46−0.14207676.74−0.09145273.770.01148882.000.07
P. rubroaureus11,14067.92−0.12179072.18−0.16141070.850.03113875.660.24
Disclaimer/Publisher’s Note: The statements, opinions and data contained in all publications are solely those of the individual author(s) and contributor(s) and not of MDPI and/or the editor(s). MDPI and/or the editor(s) disclaim responsibility for any injury to people or property resulting from any ideas, methods, instructions or products referred to in the content.