
Conformational Modulation of Tissue Transglutaminase via Active Site Thiol Alkylating Agents: Size Does Not Matter

 , ,
, ,  and
and 
Abstract
1. Introduction
2. Materials and Methods
2.1. Protein Expression and Kinetic Assay
2.2. GTP Binding Assay
2.3. Native PAGE Assay
2.4. Capillary Electrophoresis Assay
2.5. Synthesis
3. Results and Discussion
3.1. Design
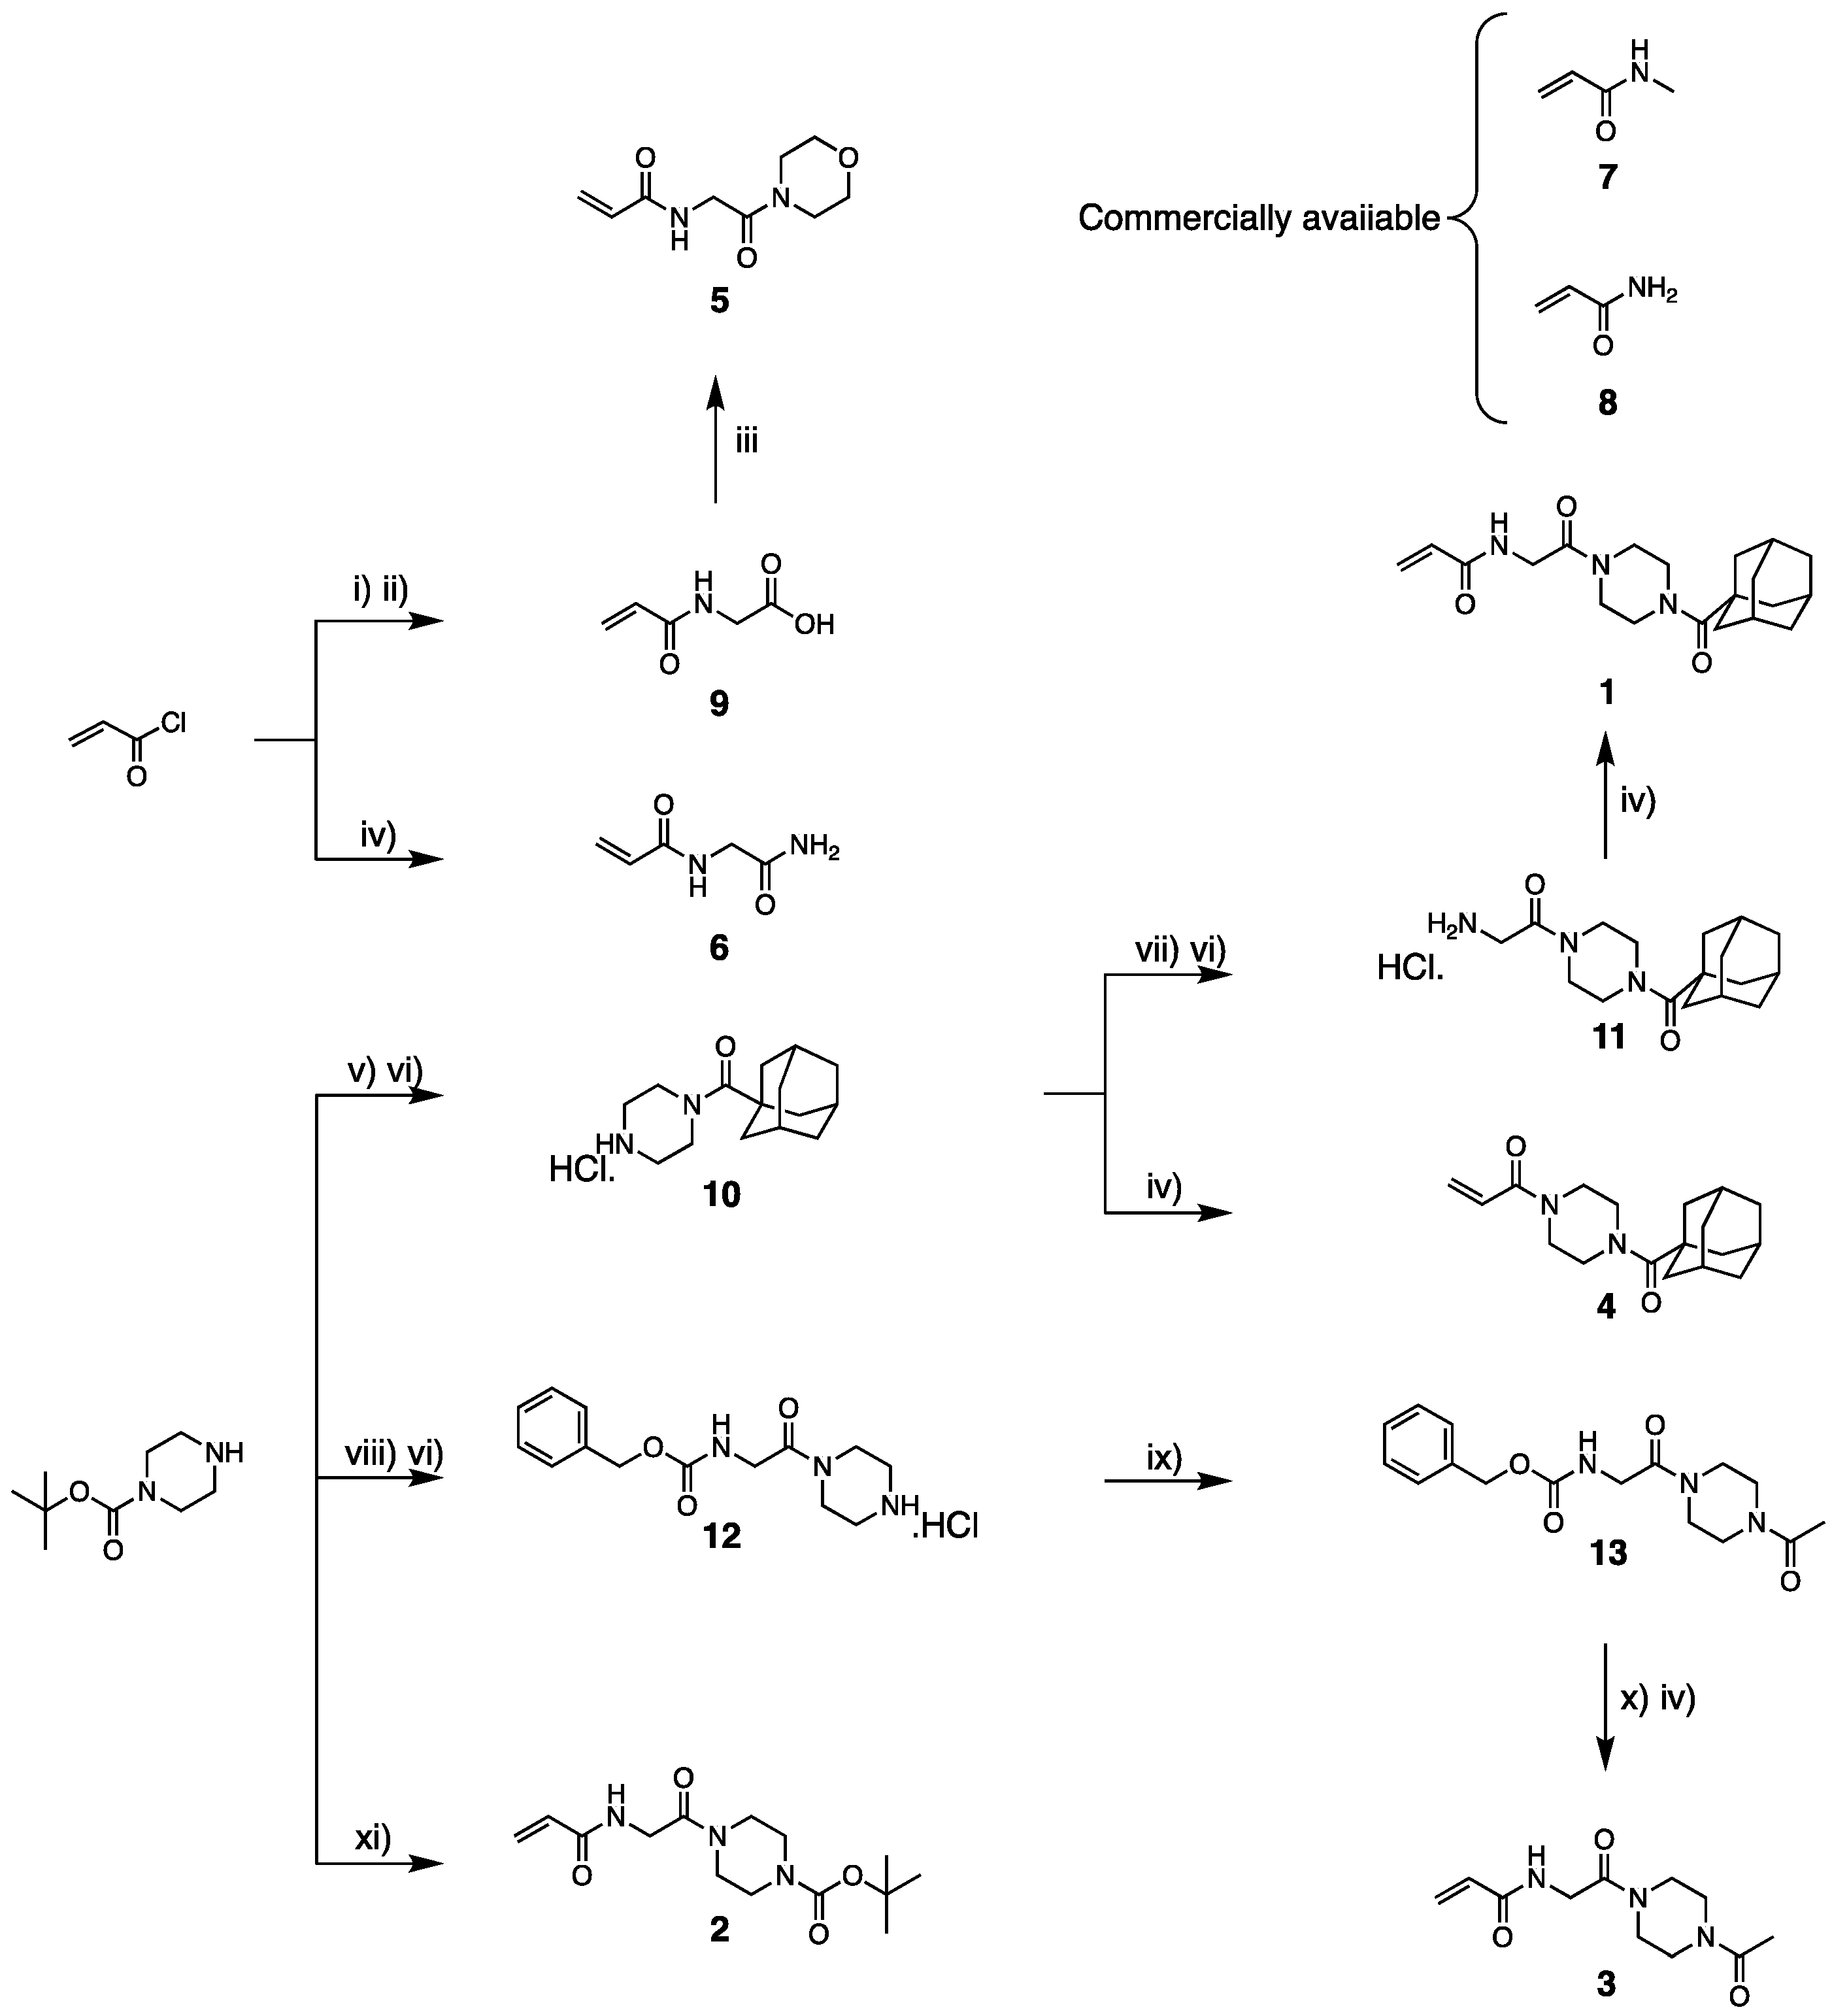
3.2. Synthesis
3.3. Kinetic Evaluation of Inhibition
3.4. GTP Binding Evaluation
3.5. Conformational Analysis by Native PAGE and Capillary Electrophoresis
4. Conclusions
Supplementary Materials
Author Contributions
Funding
Institutional Review Board Statement
Informed Consent Statement
Data Availability Statement
Conflicts of Interest
References
- Gundemir, S.; Colak, G.; Tucholski, J.; Johnson, G.V.W. Transglutaminase 2: A Molecular Swiss Army Knife. Biochim. Biophys. Acta (BBA)-Mol. Cell Res. 2012, 1823, 406–419. [Google Scholar] [CrossRef] [PubMed]
- Mehta, K.; Eckert, R.L. Transglutaminases: Family of Enzymes with Diverse Functions; Karger Medical and Scientific Publishers: Basel, Switzerland, 2005; Volume 38, ISBN 978-3-8055-7901-8. [Google Scholar]
- Keillor, J.W.; Clouthier, C.M.; Apperley, K.Y.P.; Akbar, A.; Mulani, A. Acyl Transfer Mechanisms of Tissue Transglutaminase. Bioorg. Chem. 2014, 57, 186–197. [Google Scholar] [CrossRef] [PubMed]
- Folk, J.E.; Cole, P.W. Identification of a Functional Cysteine Essential for the Activity of Guinea Pig Liver Transglutaminase. J. Biol. Chem. 1966, 241, 3238–3240. [Google Scholar] [CrossRef] [PubMed]
- Begg, G.E.; Carrington, L.; Stokes, P.H.; Matthews, J.M.; Wouters, M.A.; Husain, A.; Lorand, L.; Iismaa, S.E.; Graham, R.M. Mechanism of Allosteric Regulation of Transglutaminase 2 by GTP. Proc. Natl. Acad. Sci. USA 2006, 103, 19683–19688. [Google Scholar] [CrossRef] [PubMed]
- Pinkas, D.M.; Strop, P.; Brunger, A.T.; Khosla, C. Transglutaminase 2 Undergoes a Large Conformational Change upon Activation. PLoS Biol. 2007, 5, e327. [Google Scholar] [CrossRef] [PubMed]
- Iismaa, S.E.; Holman, S.; Wouters, M.A.; Lorand, L.; Graham, R.M.; Husain, A. Evolutionary Specialization of a Tryptophan Indole Group for Transition-State Stabilization by Eukaryotic Transglutaminases. Proc. Natl. Acad. Sci. USA 2003, 100, 12636–12641. [Google Scholar] [CrossRef] [PubMed]
- Eckert, R.L.; Kaartinen, M.T.; Nurminskaya, M.; Belkin, A.M.; Colak, G.; Johnson, G.V.W.; Mehta, K. Transglutaminase Regulation of Cell Function. Physiol. Rev. 2014, 94, 383–417. [Google Scholar] [CrossRef] [PubMed]
- Jeong, E.M.; Lee, K.B.; Kim, G.E.; Kim, C.M.; Lee, J.-H.; Kim, H.-J.; Shin, J.-W.; Kwon, M.; Park, H.H.; Kim, I.-G. Competitive Binding of Magnesium to Calcium Binding Sites Reciprocally Regulates Transamidase and GTP Hydrolysis Activity of Transglutaminase 2. Int. J. Mol. Sci. 2020, 21, 791. [Google Scholar] [CrossRef] [PubMed]
- Klöck, C.; Khosla, C. Regulation of the Activities of the Mammalian Transglutaminase Family of Enzymes. Protein Sci. 2012, 21, 1781–1791. [Google Scholar] [CrossRef]
- Katt, W.P.; Antonyak, M.A.; Cerione, R.A. Opening up about Tissue Transglutaminase: When Conformation Matters More than Enzymatic Activity. Med One 2018, 3, e180011. [Google Scholar] [CrossRef][Green Version]
- Lai, T.-S.; Slaughter, T.F.; Peoples, K.A.; Hettasch, J.M.; Greenberg, C.S. Regulation of Human Tissue Transglutaminase Function by Magnesium-Nucleotide Complexes. J. Biol. Chem. 1998, 273, 1776–1781. [Google Scholar] [CrossRef] [PubMed]
- Begg, G.E.; Holman, S.R.; Stokes, P.H.; Matthews, J.M.; Graham, R.M.; Iismaa, S.E. Mutation of a Critical Arginine in the GTP-Binding Site of Transglutaminase 2 Disinhibits Intracellular Cross-Linking Activity. J. Biol. Chem. 2006, 281, 12603–12609. [Google Scholar] [CrossRef] [PubMed]
- Paolella, G.; Sposito, S.; Romanelli, A.M.; Caputo, I. Type 2 Transglutaminase in Coeliac Disease: A Key Player in Pathogenesis, Diagnosis and Therapy. Int. J. Mol. Sci. 2022, 23, 7513. [Google Scholar] [CrossRef] [PubMed]
- Klöck, C.; DiRaimondo, T.R.; Khosla, C. Role of Transglutaminase 2 in Celiac Disease Pathogenesis. Semin. Immunopathol. 2012, 34, 513–522. [Google Scholar] [CrossRef] [PubMed]
- Shweke, N.; Boulos, N.; Jouanneau, C.; Vandermeersch, S.; Melino, G.; Dussaule, J.-C.; Chatziantoniou, C.; Ronco, P.; Boffa, J.-J. Tissue Transglutaminase Contributes to Interstitial Renal Fibrosis by Favoring Accumulation of Fibrillar Collagen through TGF-β Activation and Cell Infiltration. Am. J. Pathol. 2008, 173, 631–642. [Google Scholar] [CrossRef] [PubMed]
- Griffin, M.; Smith, L.L.; Wynne, J. Changes in Transglutaminase Activity in an Experimental Model of Pulmonary Fibrosis Induced by Paraquat. Br. J. Exp. Pathol. 1979, 60, 653–661. [Google Scholar] [PubMed]
- Han, A.L.; Kumar, S.; Fok, J.Y.; Tyagi, A.K.; Mehta, K. Tissue Transglutaminase Expression Promotes Castration-Resistant Phenotype and Transcriptional Repression of Androgen Receptor. Eur. J. Cancer 2014, 50, 1685–1696. [Google Scholar] [CrossRef] [PubMed]
- Ulukan, B.; Bihorac, A.; Sipahioglu, T.; Kiraly, R.; Fesus, L.; Telci, D. Role of Tissue Transglutaminase Catalytic and Guanosine Triphosphate-Binding Domains in Renal Cell Carcinoma Progression. ACS Omega 2020, 5, 28273–28284. [Google Scholar] [CrossRef]
- Kumar, A.; Hu, J.; LaVoie, H.A.; Walsh, K.B.; DiPette, D.J.; Singh, U.S. Conformational Changes and Translocation of Tissue-Transglutaminase to the Plasma Membranes: Role in Cancer Cell Migration. BMC Cancer 2014, 14, 256. [Google Scholar] [CrossRef]
- Mangala, L.S.; Mehta, K. Tissue Transglutaminase (TG2) in Cancer Biology. In Transglutaminases; KARGER: Basel, Switzerland, 2005; pp. 125–138. [Google Scholar]
- Keillor, J.W.; Apperley, K.Y.P.; Akbar, A. Inhibitors of Tissue Transglutaminase. Trends Pharmacol. Sci. 2015, 36, 32–40. [Google Scholar] [CrossRef]
- Eckert, R.L.; Fisher, M.L.; Grun, D.; Adhikary, G.; Xu, W.; Kerr, C. Transglutaminase Is a Tumor Cell and Cancer Stem Cell Survival Factor. Mol. Carcinog. 2015, 54, 947–958. [Google Scholar] [CrossRef] [PubMed]
- Fisher, M.L.; Keillor, J.W.; Xu, W.; Eckert, R.L.; Kerr, C. Transglutaminase Is Required for Epidermal Squamous Cell Carcinoma Stem Cell Survival. Mol. Cancer Res. 2015, 13, 1083–1094. [Google Scholar] [CrossRef] [PubMed]
- Schuppan, D.; Dieterich, W. A Molecular Warhead and Its Target. Chem. Biol. 2003, 10, 199–201. [Google Scholar] [CrossRef] [PubMed]
- Siegel, M.; Khosla, C. Transglutaminase 2 Inhibitors and Their Therapeutic Role in Disease States. Pharmacol. Ther. 2007, 115, 232–245. [Google Scholar] [CrossRef] [PubMed]
- Prime, M.E.; Brookfield, F.A.; Courtney, S.M.; Gaines, S.; Marston, R.W.; Ichihara, O.; Li, M.; Vaidya, D.; Williams, H.; Pedret-Dunn, A.; et al. Irreversible 4-Aminopiperidine Transglutaminase 2 Inhibitors for Huntington’s Disease. ACS Med. Chem. Lett. 2012, 3, 731–735. [Google Scholar] [CrossRef] [PubMed]
- Griffin, M.; Mongeot, A.; Collighan, R.; Saint, R.E.; Jones, R.A.; Coutts, I.G.C.; Rathbone, D.L. Synthesis of Potent Water-Soluble Tissue Transglutaminase Inhibitors. Bioorg. Med. Chem. Lett. 2008, 18, 5559–5562. [Google Scholar] [CrossRef] [PubMed]
- Duval, E.; Case, A.; Stein, R.L.; Cuny, G.D. Structure–Activity Relationship Study of Novel Tissue Transglutaminase Inhibitors. Bioorg. Med. Chem. Lett. 2005, 15, 1885–1889. [Google Scholar] [CrossRef] [PubMed]
- Akbar, A.; McNeil, N.M.R.; Albert, M.R.; Ta, V.; Adhikary, G.; Bourgeois, K.; Eckert, R.L.; Keillor, J.W. Structure–Activity Relationships of Potent, Targeted Covalent Inhibitors That Abolish Both the Transamidation and GTP Binding Activities of Human Tissue Transglutaminase. J. Med. Chem. 2017, 60, 7910–7927. [Google Scholar] [CrossRef] [PubMed]
- Keillor, J.W.; Chica, R.A.; Chabot, N.; Vinci, V.; Pardin, C.; Fortin, E.; Gillet, S.M.F.G.; Nakano, Y.; Kaartinen, M.T.; Pelletier, J.N.; et al. The Bioorganic Chemistry of Transglutaminase—From Mechanism to Inhibition and Engineering. Can. J. Chem. 2008, 86, 271–276. [Google Scholar] [CrossRef]
- Cundy, N.J.; Arciszewski, J.; Gates, E.W.J.; Acton, S.L.; Passley, K.D.; Awoonor-Williams, E.; Boyd, E.K.; Xu, N.; Pierson, É.; Fernandez-Ansieta, C.; et al. Novel Irreversible Peptidic Inhibitors of Transglutaminase 2. RSC Med. Chem. 2023, 14, 378–385. [Google Scholar] [CrossRef]
- Pardin, C.; Gillet, S.M.F.G.; Keillor, J.W. Synthesis and Evaluation of Peptidic Irreversible Inhibitors of Tissue Transglutaminase. Bioorg. Med. Chem. 2006, 14, 8379–8385. [Google Scholar] [CrossRef] [PubMed]
- Rangaswamy, A.M.M.; Navals, P.; Gates, E.W.J.; Shad, S.; Watt, S.K.I.; Keillor, J.W. Structure–Activity Relationships of Hydrophobic Alkyl Acrylamides as Tissue Transglutaminase Inhibitors. RSC Med. Chem. 2022, 13, 413–428. [Google Scholar] [CrossRef] [PubMed]
- Roy, I.; Smith, O.; Clouthier, C.M.; Keillor, J.W. Expression, Purification and Kinetic Characterisation of Human Tissue Transglutaminase. Protein Expr. Purif. 2013, 87, 41–46. [Google Scholar] [CrossRef] [PubMed]
- Leblanc, A.; Gravel, C.; Labelle, J.; Keillor, J.W. Kinetic Studies of Guinea Pig Liver Transglutaminase Reveal a General-Base-Catalyzed Deacylation Mechanism. Biochemistry 2001, 40, 8335–8342. [Google Scholar] [CrossRef] [PubMed]
- Kitz, R.; Wilson, I.B. Esters of Methanesulfonic Acid as Irreversible Inhibitors of Acetylcholinesterase. J. Biol. Chem. 1962, 237, 3245–3249. [Google Scholar] [CrossRef] [PubMed]
- Badarau, E.; Wang, Z.; Rathbone, D.L.; Costanzi, A.; Thibault, T.; Murdoch, C.E.; El Alaoui, S.; Bartkeviciute, M.; Griffin, M. Development of Potent and Selective Tissue Transglutaminase Inhibitors: Their Effect on TG2 Function and Application in Pathological Conditions. Chem. Biol. 2015, 22, 1347–1361. [Google Scholar] [CrossRef] [PubMed]
- de Macédo, P.; Marrano, C.; Keillor, J.W. A Direct Continuous Spectrophotometric Assay for Transglutaminase Activity. Anal. Biochem. 2000, 285, 16–20. [Google Scholar] [CrossRef] [PubMed]
- Pardin, C.; Roy, I.; Chica, R.A.; Bonneil, E.; Thibault, P.; Lubell, W.D.; Pelletier, J.N.; Keillor, J.W. Photolabeling of Tissue Transglutaminase Reveals the Binding Mode of Potent Cinnamoyl Inhibitors. Biochemistry 2009, 48, 3346–3353. [Google Scholar] [CrossRef] [PubMed]
- Mironov, G.G.; Clouthier, C.M.; Akbar, A.; Keillor, J.W.; Berezovski, M.V. Simultaneous Analysis of Enzyme Structure and Activity by Kinetic Capillary Electrophoresis–MS. Nat. Chem. Biol. 2016, 12, 918–922. [Google Scholar] [CrossRef]
- Clouthier, C.M.; Mironov, G.G.; Okhonin, V.; Berezovski, M.V.; Keillor, J.W. Real-Time Monitoring of Protein Conformational Dynamics in Solution Using Kinetic Capillary Electrophoresis. Angew. Chem. Int. Ed. 2012, 51, 12464–12468. [Google Scholar] [CrossRef]
- Stieler, M.; Weber, J.; Hils, M.; Kolb, P.; Heine, A.; Büchold, C.; Pasternack, R.; Klebe, G. Structure of Active Coagulation Factor XIII Triggered by Calcium Binding: Basis for the Design of Next-Generation Anticoagulants. Angew. Chem. Int. Ed. 2013, 52, 11930–11934. [Google Scholar] [CrossRef] [PubMed]
- Glatzel, S.; Badi, N.; Päch, M.; Laschewsky, A.; Lutz, J.-F. Well-Defined Synthetic Polymers with a Protein-like Gelation Behavior in Water. Chem. Commun. 2010, 46, 4517. [Google Scholar] [CrossRef] [PubMed]
- Auernheimer, J.; Dahmen, C.; Hersel, U.; Bausch, A.; Kessler, H. Photoswitched Cell Adhesion on Surfaces with RGD Peptides. J. Am. Chem. Soc. 2005, 127, 16107–16110. [Google Scholar] [CrossRef]
- Agha, K.A.; Abo-Dya, N.E.; Ibrahim, T.S.; Abdel-Aal, E.H.; Abdel-Samii, Z.K. N-Acylbenzotriazole: Convenient Approach for Protecting Group-Free Monoacylation of Symmetric Diamines. Monatshefte Chem.-Chem. Mon. 2020, 151, 589–598. [Google Scholar] [CrossRef]


| Comp | Length (Heavy Atoms) | KI (µM) | kinact (min−1) | kinact/KI (103 M−1 min−1) | kinact/KI (103 M−1 min−1) from Linear Regression |
|---|---|---|---|---|---|
| 1 | 16 | 3.2 ± 1.0 | 1.30 ± 0.20 | 412 ±142 | 294 ± 29 |
| 2 | 14 | 129 ± 53 | 1.80 ± 0.60 | 14.0 ± 7.0 | 11.6 ± 0.5 |
| 3 | 12 | 96 ± 17 | 0.46 ± 0.05 | 4.70 ± 1.00 | 2.69 ± 0.25 |
| 4 | 12 | 118 ± 59 | 0.52 ± 0.16 | 4.40 ± 2.30 | 2.79 ± 0.17 |
| 5 | 10 | 487 ± 161 | 1.80 ± 0.50 | 3.60 ± 1.50 | 2.81 ± 0.08 |
| 6 | 7 | 842 ± 25 | 0.42 ± 0.01 | 0.50 ± 0.02 | 0.35 ± 0.02 |
| 7 | 5 | 6980 ± 5050 | 5.30 ± 3.70 | 0.764 ± 0.760 | 0.730 ± 0.001 |
| 8 | 4 | 148 ± 68 | 0.70 ± 0.22 | 4.70 ± 2.60 | 3.15 ± 0.17 |
| Iodoacetamide a | 3 | 0.075 ± 11 a | 0.90 ± 0.06 a | 12,000 ± 1 a | n.a. |
Disclaimer/Publisher’s Note: The statements, opinions and data contained in all publications are solely those of the individual author(s) and contributor(s) and not of MDPI and/or the editor(s). MDPI and/or the editor(s) disclaim responsibility for any injury to people or property resulting from any ideas, methods, instructions or products referred to in the content. |
© 2024 by the authors. Licensee MDPI, Basel, Switzerland. This article is an open access article distributed under the terms and conditions of the Creative Commons Attribution (CC BY) license (https://creativecommons.org/licenses/by/4.0/).
Share and Cite
Navals, P.; Rangaswamy, A.M.M.; Kasyanchyk, P.; Berezovski, M.V.; Keillor, J.W. Conformational Modulation of Tissue Transglutaminase via Active Site Thiol Alkylating Agents: Size Does Not Matter. Biomolecules 2024, 14, 496. https://doi.org/10.3390/biom14040496
Navals P, Rangaswamy AMM, Kasyanchyk P, Berezovski MV, Keillor JW. Conformational Modulation of Tissue Transglutaminase via Active Site Thiol Alkylating Agents: Size Does Not Matter. Biomolecules. 2024; 14(4):496. https://doi.org/10.3390/biom14040496
Chicago/Turabian StyleNavals, Pauline, Alana M. M. Rangaswamy, Petr Kasyanchyk, Maxim V. Berezovski, and Jeffrey W. Keillor. 2024. "Conformational Modulation of Tissue Transglutaminase via Active Site Thiol Alkylating Agents: Size Does Not Matter" Biomolecules 14, no. 4: 496. https://doi.org/10.3390/biom14040496
APA StyleNavals, P., Rangaswamy, A. M. M., Kasyanchyk, P., Berezovski, M. V., & Keillor, J. W. (2024). Conformational Modulation of Tissue Transglutaminase via Active Site Thiol Alkylating Agents: Size Does Not Matter. Biomolecules, 14(4), 496. https://doi.org/10.3390/biom14040496