Article

Exploring SVA Insertion Polymorphisms in Shaping Differential Gene Expressions in the Central Nervous System

1
Perron Institute for Neurological and Translational Science, Perth, WA 6009, Australia
2
Department of Pharmacology and Therapeutics, Institute of Systems, Molecular and Integrative Biology, University of Liverpool, Liverpool L69 3BX, UK
3
Centre for Molecular Medicine and Innovative Therapeutics, Murdoch University, Perth, WA 6150, Australia
*
Author to whom correspondence should be addressed.
Biomolecules 2024, 14(3), 358; https://doi.org/10.3390/biom14030358
Submission received: 17 February 2024 / Revised: 11 March 2024 / Accepted: 14 March 2024 / Published: 17 March 2024
(This article belongs to the Special Issue Advances in Biomarkers for Neurodegenerative Diseases)

Abstract

:
Transposable elements (TEs) are repetitive elements which make up around 45% of the human genome. A class of TEs, known as SINE-VNTR-Alu (SVA), demonstrate the capacity to mobilise throughout the genome, resulting in SVA polymorphisms for their presence or absence within the population. Although studies have previously highlighted the involvement of TEs within neurodegenerative diseases, such as Parkinson’s disease and amyotrophic lateral sclerosis (ALS), the exact mechanism has yet to be identified. In this study, we used whole-genome sequencing and RNA sequencing data of ALS patients and healthy controls from the New York Genome Centre ALS Consortium to elucidate the influence of reference SVA elements on gene expressions genome-wide within central nervous system (CNS) tissues. To investigate this, we applied a matrix expression quantitative trait loci analysis and demonstrate that reference SVA insertion polymorphisms can significantly modulate the expression of numerous genes, preferentially in the trans position and in a tissue-specific manner. We also highlight that SVAs significantly regulate mitochondrial genes as well as genes within the HLA and MAPT loci, previously associated within neurodegenerative diseases. In conclusion, this study continues to bring to light the effects of polymorphic SVAs on gene regulation and further highlights the importance of TEs within disease pathology.

1. Introduction

Amyotrophic lateral sclerosis (ALS) is a fatal neurodegenerative disease, originally termed by the French neurologist Jean-Martin Charcot in 1869 to describe muscular atrophy (amyotrophic) and tissue scarring and the hardening of tissue within the lateral spinal cord [1,2]. ALS is the most common form of a motor neuron disease (MND) and is characterized by the progressive deterioration of both upper and lower motor neurons within the brain and spinal cord [2,3,4]. The incidence of this disease is 1.75–3 per 100,000 people per year and an increased incidence of 4–8 per 100,000 people per year in the highest ALS-risk age group (45–75 years old) [5,6]. Categorised as two groups, ALS can present as familial ALS, where at least one family member of the affected individual has ALS, accounting for up to 10% of ALS cases, or sporadic ALS (sALS), where the affected individual has no prior family history, which accounts for 90–95% of cases [7]. The clinical features of typical ALS patients consist of muscle spasticity, atrophy, muscle wasting, weakness, and death due to respiratory failure, with the average survival after symptom onset lying between 3–5 years [1,5,8,9].
Neurodegenerative diseases are complex disorders, involving both environmental- and genetic-factor interactions. Therefore, attempts to elucidate disease mechanisms and pathogenic genetic variants are essential. Previous research has identified more than 30 genes associated with ALS, highlighting four genes, SOD1, TARDBP (TDP-43), C9ORF72, and FUS, for harbouring pathogenic mutations, which cause the greatest number of ALS cases [10,11,12,13]. Although these four genes have been identified as major ALS-associated genes, a 2017 meta-analysis study demonstrated that within European and Asian populations, these genes only contribute to 47.7% and 5.2% of familial and sporadic cases, respectively [14]. Following the identification of these pathogenic mutations, several pathological mechanisms have been implicated in ALS pathogenesis including oxidative stress, mitochondrial dysfunction, axonal transport, inflammation, toxic protein aggregation, and RNA metabolism and toxicity [10]. In addition to identified genetic variants only explaining a small fraction of sporadic aetiology, twin studies have highlighted the importance of genetic risk factors within sporadic ALS, estimating a 61% heritability [15]. Therefore, as the exact causation of ALS is still undetermined, a better understanding of the disease pathogenesis and identification of genetic biomarkers is essential. To further investigate the missing heritability of ALS, Theunissen et al. proposed structural variations (SVs) as an area of potential significance [16]. SVs are classified as insertions, inversions, deletions, and microsatellites, usually of repetitive structure, that are predominantly present within non-coding DNA regions and contribute towards genomic variation [16,17]. Furthermore, SVs have demonstrated the ability to modulate gene expressions and have already been implicated in neurodegenerative diseases, such as the C9orf72 repeat expansion in ALS and frontotemporal dementia (FTD) [18,19]. Hence, as 99% of the human genome is non-coding DNA, continued research into these regions is crucial to provide new insights into disease pathogenesis and to identify new potential targets for therapeutics.
Repetitive DNA is a major contributor to structural genomic variation. One form of repetitive DNA is a group of endogenous transposable elements (TEs), which can exist in both a static form and a mobile form. TEs are categorised into two classes known as DNA transposons and retrotransposons, whereby the later class possesses the ability to propagate throughout the genome via a ‘copy-and-paste’ mechanism, involving an RNA intermediate [20]. This results in the insertion of a new retrotransposon copy at a new locus within the host genome. Originally dismissed as “junk” DNA, TEs are known to drive genetic diversity not only by contributing to the regulation and evolution of the genome but also by contributing to genetic instability and disease progression [21,22]. Previous research by Prudencio et al. highlighted the potential implication of retrotransposons in ALS through the analysis of repetitive-element expressions using RNA sequencing data from both healthy controls as well as C9orf72-expansion-positive carriers and sporadic ALS patients (C9orf72-negative) [23]. This research revealed that repetitive-element expressions, including retrotransposons, were significantly increased in ALS patients with the C9orf72 expansion in comparison to the C9orf72-negative patients and healthy controls, thus suggesting the involvement of retrotransposon in ALS [23]. However, until recently, these elements have been largely overlooked in relation to neurodegenerative diseases, even though TEs constitute around 45% of the human genome [24,25,26].
Retrotransposons are further subdivided into two groups, dependent on the presence of long terminal repeats (LTRs), known as LTR and non-LTR retrotransposons [21]. SINE-VNTR-Alu (SVA) elements are a member of the non-LTR retrotransposon family, which are typically 0.7–4 kb in length [27]. SVAs are classified by evolutionary age based on their SINE-R region into subfamily groups A–F, whereby subfamily SVA-F is the youngest in evolutionary history [28]. Full-length SVA elements contain a 5′ CT element, Alu-like region, GC-rich VNTR (variable-number tandem repeat), SINE (short interspersed nuclear element)-R domain and a 3′ poly-A tail [28,29,30] (Figure 1b). SVAs are major contributors to genetic diversity through a variety of different mechanisms, including acting as transcriptional regulators by providing alternative splice sites, polyadenylation signals, and promoters whilst harbouring sites for transcription factor (TF) binding, thus, modulating gene expressions [31]. SVAs are not only polymorphic in structure but ongoing mobilisation has resulted in SVAs being polymorphic for their presence or absence within the genome and thus are termed retrotransposon insertion polymorphisms (RIPs) [32]. This adds additional layers of complexity to gene expression dynamics, indicating that SVAs could be associated with a predisposition to diseases [33]. A prominent example of an SVA insertion exists within the TAF1 locus. Previous research has demonstrated that the SVA insertion within intron 32 of this gene is associated with the onset of X-linked dystonia parkinsonism (XDP) [34]. It is suggested that this insertion results in partial intron retention and a reduction in the mRNA expression of TAF1 [34,35]. In addition, variations within the CT element (ranging between 35 and 52 repeats) indicates an inverse correlation with the XDP age of onset [36].
Previous work within our group has shown that seven SVAs, polymorphic for their presence or absence, were significantly associated with Parkinson’s disease progression and differential gene expression in Parkinson’s disease (PD) patients using the Parkinson’s Progression Markers Initiative (PPMI) cohort [27,32]. This involved an SVA named SVA_67, which is located at the MAPT locus, a locus which has been implicated in neurodegenerative-disease risks including PD, FTD, and Alzheimer’s disease [37,38,39]. By using a clustered regularly interspaced short palindromic repeat (CRISPR) cell line knock-out model for SVA_67, we demonstrated that this SVA was significantly associated with the differential gene expressions of three genes at the MAPT locus, associated with neurodegeneration [40].
In this study, we analysed SVAs which are present in the human reference genome identified as RIPs in the cohort analysed, herein termed reference SVA RIPs, to investigate the general regulatory effects of SVAs on the brain. For this analysis, we used whole-genome sequencing (WGS) and transcriptomic data obtained from the New York Genome Centre (NYGC) ALS Consortium to elucidate the role of SVA insertion polymorphisms on gene expressions in central nervous system (CNS) tissues in healthy controls and ALS patients (Figure 1a). Our analysis demonstrated that reference SVA RIPs regulate single and multiple gene targets genome-wide within CNS tissues and display tissue-specific gene modulations by comparing spinal cord, cerebellum, motor cortex, and frontal cortex tissue analyses. Furthermore, we discovered that SVA RIPs influence the expression of genes at loci (HLA and MAPT) previously associated with ALS, highlighting that the SVA regulation of genes at this locus could be a potential mechanism involved in ALS pathology.

2. Materials and Methods

2.1. Genotyping Reference SVAs Polymorphic for Their Presence/Absence and Disease Associations from Whole-Genome Sequencing Data from ALS Consortium Dataset

Whole-genome sequencing (WGS) data from the New York Genome Centre (NYGC), as part of the ALS Consortium dataset, were obtained in cram file format and aligned to hg38. The ALS Consortium dataset contains data from individuals diagnosed with ALS-spectrum MND; other neurological disorders (Alzheimer’s, Parkinson’s disease etc); MND and ALS with other neurological disorders; along with non-neurological controls (healthy controls). The structural variant caller Delly2 (https://github.com/dellytools/delly, accessed on 1 September 2022), with default settings, was used to genotype the ALS Consortium cohort (4403 individuals) for previously identified reference SVA sites, as outlined in [41]. In total, 92 reference SVAs polymorphic for presence/absence [41] were used for a matrix eQTL and differential gene expression analysis. The nomenclature of SVAs in this study is consistent with our previous work [27,32,42]. We had 41 gDNA samples of individuals from a Parkinson’s cohort (PPMI) that were available to PCR validate bioinformatically determined polymorphisms for the presence/absence of a specific SVA of interest (SVA_67). All 41 genotypes identified by PCR, which determined the SVA_67 genotype as homozygous present (PP) and heterozygous (PA) and homozygous absent (AA), respectively, matched with the bioinformatically generated genotypes by Delly, which validated not only the reliability of the results from our previous study but also within the cohort used in this study.

2.2. RNA-Seq Differential Gene Expression Analysis

To elucidate the influence of SVA RIP genotypes on differential gene expressions, RNA-seq data from CNS tissues obtained from the NYGC ALS Consortium were analysed (https://www.nygenome.org/als-consortium/, accessed on 1 September 2022). For this analysis, both ALS cases and healthy controls were combined. The Salmon quantification tool was used to quantify gene-specific expression levels from previously obtained FASTQ files (https://salmon.readthedocs.io/en/latest/, accessed on 1 September 2022). Salmon-generated quant files were imported using the tximport function in R, and raw counts were extracted using the DESeqDataSetFromTximport. The DESeq2 R package Version 1.30.0 was implemented to normalise the raw counts through the median-of-ratios method. DESeq2 was also used to detect statistically significant differential gene expressions across SVA genotype groups (AA, PA, and PP), whereby P represents SVA presence and A represents SVA absence. The results of the analysis were visualised using the ggplot2 package Version 3.5.0 in R. The Kruskal–Wallis multiple comparison test (non-parametric) was applied to determine statistical significance between genotypes. The Wilcoxon test was used for pairwise comparisons to assess significant differences between genotypes, and obtained p values were corrected for multiple comparisons using the false discovery rate (FDR).

2.3. eQTL (Expression Quantitative Trait Loci) Analysis

Matrix eQTL was applied to evaluate the genetic loci (SVA elements) regulating the expression of nearby (cis) and distant (trans, >1 Mbp away) genes, using the matrixEQTL packageVersion 2.3 in R. For this analysis, the additive linear model was applied with normalised gene expression levels, chromosomal positions of SVAs (hg38), and covariates (sex and age). Effect-size estimates were reported as beta values from the matrix eQTL. The obtained p values were corrected for multiple testing, and the threshold was set to 0.05 for the FDR-corrected p values. In our study, the beta value represents the effect size of the presence of the SVA on gene expressions. This is also known as the slope coefficient. This value is generated from the linear regression model in the matrix eQTL and highlights positive (upregulation, β > 0) and negative (downregulation, β < 0) associations, respectively.

3. Results

3.1. SVA RIPs Act as eQTL Genome-Wide in CNS Tissues

To determine the impact of reference SVA RIPs on gene expression profiles, we analysed WGS and transcriptomic data of both ALS patients (n = 1544) and healthy controls (n = 359) from the ALS Consortium cohort. For this analysis, we initially combined data from different CNS tissues, including motor cortex, frontal cortex, cerebellum, occipital cortex, temporal cortex, hippocampus, and spinal cord tissues (Figure 2).
For the eQTL analysis, we assessed changes at a gene-based level. We demonstrate that 14,830 genomic loci were significantly differentially modulated by reference SVA insertion polymorphisms (FDR p < 0.05). Of these effects, 167 were cis regulated by SVA RIPs, whilst over 98% (14,663 targets) were trans regulated, where trans regulated is defined as genes regulated greater than 1 Mb away from the SVA site (Figure 3a). This indicates that most regulatory effects observed by these SVA RIPs impact target genes that are >1 Mb away from the SVA element itself and that these could be both direct and indirect effects (Figure 1c). In addition, single SVA elements had the capacity to regulate either a single gene or multiple gene targets. Our analysis identified that 92 reference SVA RIPs were responsible for the modulation of the 14,830 genomic loci, with SVA_16 affecting the greatest number of genes (917) (Figure 3b). Of these 92 SVA elements polymorphic for their presence or absence, 26 SVAs affect more than 200 genes in total, whilst the lowest number of targets for an SVA in this analysis was 6, indicating that all reference SVA RIPs analysed in this study had the ability to modulate expression profiles of multiple gene targets in the CNS (Figure 3b).

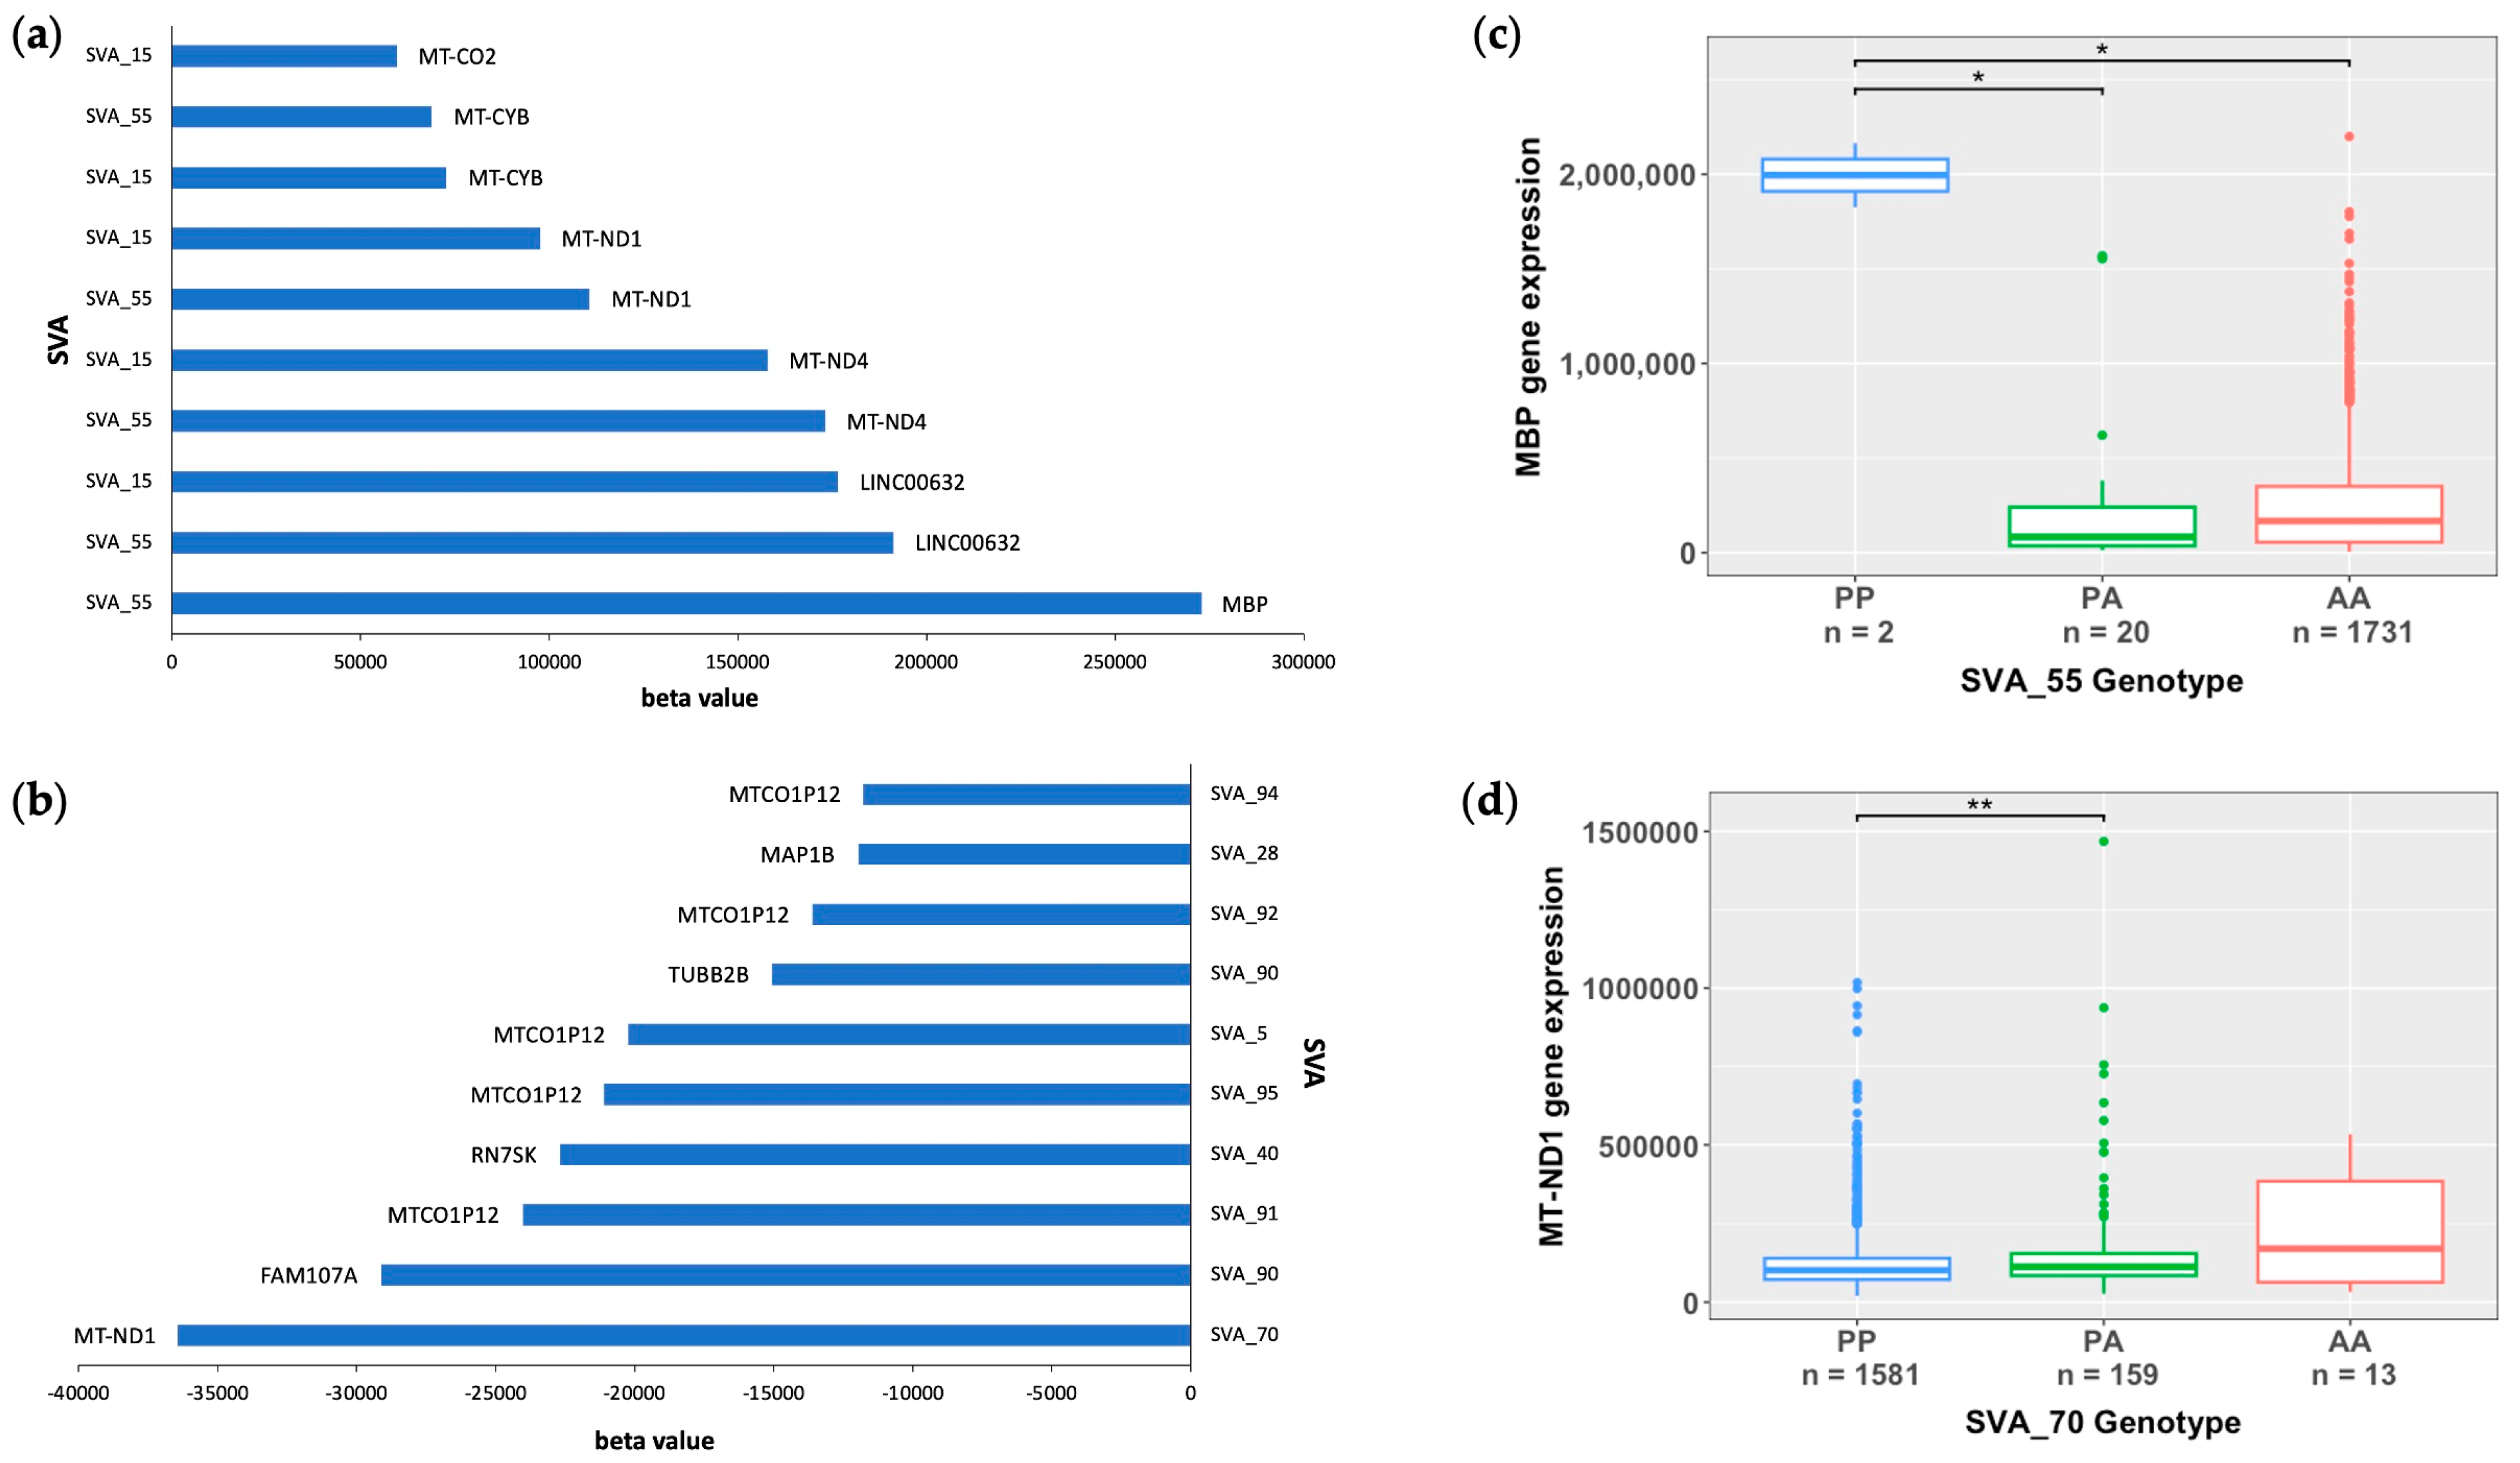
3.2. Mitochondrial Genes Are Significantly Modulated by SVA RIPs

To further investigate the capacity of reference SVA elements to act as eQTL, we analysed the beta values obtained from the eQTL analysis to determine the magnitude of the measured effects induced by SVA RIPs. The ten reference SVA RIPs with the greatest effect size on gene upregulation (highest beta value) and gene downregulation (lowest beta value), and the affected gene targets are displayed in Figure 4a,b. All top ten hits for the highest and lowest beta values are trans-regulatory effects. SVA_55 demonstrated the greatest increase in the activation of the MBP gene with a beta coefficient of 272,847, whilst SVA_70 demonstrated the greatest repressive effect of the MT-ND1 gene with a beta coefficient of −36,441 (FDR p < 0.05) (Figure 4a,b). Interestingly, it was noted that only two SVAs (SVA_55 and SVA_15) were responsible for the top ten hits regarding the effect size of gene activation. Furthermore, although the top hit for the effect size of gene repressions was SVA_70, modulating the MT-ND1 expression, our results also demonstrate that the presence of both SVA_15 and SVA_55 showed the opposite effect by upregulating the MT-ND1 expression (Figure 4a,b). To determine the impact of SVA presence on gene modulation in more detail, we examined the top hits for SVAs with the greatest effect on gene upregulation (SVA_55) and downregulation (SVA_70) independently. For MBP, the presence of two copies/alleles (PP genotype) of SVA_55 significantly upregulated MBP gene expressions compared to the presence of one copy of SVA_55 (PA genotype) or complete absence (AA genotype) (p = 0.0218) (Figure 4c). In comparison to the AA and PA genotypes, individuals with the PP genotype displayed a 9.5-fold and 19.2-fold increase in MBP gene expressions, respectively. In contrast, individuals homozygous present for SVA_70 demonstrated a significant repression of the MT-ND1 gene in comparison to individuals heterozygous for SVA_70, namely downregulating the gene expression of MT-ND1 by 55% (p = 0.0098) (Figure 4d). No statistical significance for differential gene expressions between the PP and AA genotype was obtained for the MT-ND1 expression using the Wilcoxon pairwise comparison with FDR-adjusted p values (FDR p < 0.05).
We next analysed the top ten most significant SVA effects based on FDR p values. The most significant effects observed (the lowest FDR p value) were SVA_67 acting on the genes MAPK8IP1P2 and ENSG00000285668.1, displaying an FDR p value of 1.93 × 10−303 (Table 1). This was followed by SVA_67 acting on the gene LRRC37A, with an FDR p value of 5.12 × 10−299 (Table 1). Intriguingly, 6/10 hits for highest significance were cis-specific effects on gene upregulation by SVA_24, SVA_33, and SVA_58 and gene downregulation by SVA_67. This is different to our previous results, as the top ten reference SVAs with the greatest effect size on upregulation and downregulation were all trans-regulatory effects. Table 1 also shows that the four most significant trans-specific effects induced by SVA_15, SVA_84, SVA_87, and SVA_93 all influenced the same mitochondrial gene, MTND4P24, whereby SVA_84, SVA_87, and SVA_93 increased gene expressions and SVA_15 repressed gene expressions. This demonstrates that multiple SVA RIPs can act on one gene, influencing gene regulation and simultaneously activating and repressing gene expressions.
To illustrate the impact of SVA_67 on target gene expressions, we investigated the specific influence of SVA_67 allele dosage on transcriptomic profiles of the respective target genes (Figure 5). As an example, this analysis is shown for the genes MAPK8IP1P2 and LRRC37A, whereby gene expressions were stratified by the SVA_67 genotype (PP, PA, and AA). An analysis using the Wilcoxon pairwise comparison with FDR-adjusted p values (FDR < 0.05) demonstrated that the presence of SVA_67 significantly downregulated the gene expression of both MAPK8IP1P2 and LRRC37A (p < 0.001) (Figure 5). Significant differences were observed between all genotype groups, PP vs. PA (MAPK8IP1P2 p = 7.33 × 10−237, LRRC37A p = 1.95 × 10−204); PP vs. AA (MAPK8IP1P2 p = 4.26 × 10−55, LRRC37A p = 1.06 × 10−39); and PA vs. AA (MAPK8IP1P2 p = 1.33 × 10⁷, LRRC37A p = 2.13 × 10⁻¹²), for both genes (Figure 5). For individuals homozygous absent for SVA_67, a change of 262-fold and 6-fold was observed for the gene expression of MAPK8IP1P2 and LRRC37A, respectively, in comparison to individuals homozygous present for SVA_67 (Figure 5).

3.3. SVA RIPs Demonstrate Cis Effects on HLA and MAPT Loci

To elucidate the impact of cis-acting SVA RIPs, we explored which SVA elements had the largest significant effects on genes regulated in cis, including gene upregulation (positive beta value) and downregulation (negative beta value) using beta values from the matrix eQTL analysis (FDR p < 0.05) (Figure 6). Here, we highlight that SVA_67 largely influences gene regulation in the cis of six different genes, including the upregulation of MAPT and LRRC37A4P and the downregulation of MAPK8IP1P2, LRRC37A2, LRRC37A, and KANSL1 (Figure 6a). SVA_67 was responsible for the two greatest increases in the gene activation of the MAPT and LRRC37A4P genes with beta coefficients of 1384 and 1101, respectively (Figure 6a). Interestingly, six of the ten most positive hits were effects induced on HLA genes by SVA_24, SVA_25, SVA_27, and SVA_88 (Figure 6a). Furthermore, we demonstrate that SVA_73 had the greatest effect out of all cis-regulatory effects with a beta coefficient of −2843 for the gene FCGBP, indicating a large inhibitory effect of FCGBP gene expressions (Figure 6b). FCGBP gene expressions are further repressed by SVA_72, the second highest hit in our analysis for the top ten SVAs with the greatest effect size on gene downregulation (Figure 6b).
To determine the influence of cis-acting SVA RIPs on gene regulation, we next analysed the gene expression patterns of the top two hits for the largest effects on gene upregulation and downregulation (Figure S1). The presence of either one (PA) or two (PP) SVA_67 alleles significantly upregulated both LRRC37A4P and MAPT gene expressions when tested using the Wilcoxon pairwise comparison with FDR-adjusted p values (FDR p < 0.05) (Figure S1a,b). In comparison to individuals homozygous absent for SVA_67, homozygous present and heterozygous individuals displayed a 447.3-fold (p = 1.04 × 10−40) and a 214.4-fold (p = 2.55 × 10−38) increase in LRRC37A4P expressions and a 1.4-fold (p = 2.53 × 10⁻⁹) and 1.2-fold (p = 2.51 × 10⁻⁴) increase in MAPT gene expressions, respectively (Figure S1a,b). An analysis of the top two hits for the greatest effect on gene downregulation displayed differing gene expression patterns between the influence of SVA_73 and SVA_72 on FCGBP gene expressions (Figure S1c,d). When comparing to the complete absence (AA) of SVA_73, the PA and PP genotype groups displayed a significant 3.7-fold (p = 3.61 × 10⁻²) and 10-fold (p = 2.61 × 10⁻³) increase in FCGBP gene expressions (Figure S1c). Although our analysis displayed that the presence of SVA_73 upregulates the FCGBP gene in comparison to AA individuals, FCGBP gene expressions are significantly repressed by 63% (p = 3.29 × 10⁻⁸) in the PP genotype group compared to the PA genotype group (Figure S1c). An analysis of SVA_72 highlighted that the homozygous presence of the SVA_72 allele significantly downregulated FCGBP gene expressions by 23% (p = 5.74 × 10⁻³) in comparison to its homozygous absence (Figure S1d). PP genotype individuals also displayed a significant reduction of 32% (p = 1.85 × 10⁻⁵) in FCGBP gene expressions in comparison to the PA genotype (Figure S1d). Similar to the SVA_73 gene expression analysis, individuals heterozygous for SVA_72 indicated a 1.2-fold (p = 4.23 × 10⁻¹) increase in FCGBP expressions; however, statistical significance was not achieved (Figure S1d).
As a recent genome-wide association study (GWAS) reported an association of the HLA locus with ALS risk [43,44], we investigated the influence that SVA RIPs have on cis-regulated HLA genes (Figures S2 and S3). This analysis demonstrated that the top ten hits for the greatest effect of SVA RIPs regarding upregulation was for HLA genes. We discovered a common gene expression pattern across all HLA genes analysed, demonstrating that individuals homozygous present for SVA RIPs (SVA_24, SVA_25, SVA_27, and SVA_88) significantly upregulate HLA genes in comparison to homozygous-absent individuals (p < 0.01) (Figures S2 and S3).

3.4. SVA RIPs Display Tissue-Specific Modulations of Gene Expressions

To investigate tissue-specific influences of reference SVA polymorphisms, we conducted an eQTL analysis on the CNS tissue types of spinal cord, cerebellum, motor cortex, and frontal cortex individually (Table 2 and Table 3). The temporal cortex, occipital cortex, and hippocampus tissues were excluded from this analysis due to the low n numbers. The result tables display the eQTL analysis from each individual tissue to allow for the determination of the top 40 hits for greatest effect size on gene upregulation (positive beta values) (Table 2) and downregulation (negative beta values) (Table 3). From this analysis, we established that a large proportion of the gene regulation effects were present within spinal cord tissues, displaying 27/40 and 26/40 tissue-specific hits for both gene upregulation and downregulation, respectively (Table 2 and Table 3). Furthermore, our analysis revealed that five SVAs (SVA_55, SVA_15, SVA_37, SVA_85, and SVA_4) were responsible for the 40 most positive beta values, and eight SVAs (SVA_90, SVA_5, SVA_87, SVA_93, SVA_30, SVA_70, SVA_84, SVA_91, SVA_16) were responsible for the 40 most negative beta values, all effects of which were in the trans position (Table 2 and Table 3). These data demonstrate the capability of SVAs to modulate the expression of multiple gene targets.
Moreover, the MBP gene located on chromosome 18 and the PLP1 gene located on the X chromosome were the most significantly upregulated and downregulated genes simultaneously (Table 2 and Table 3). Here, the gene expression of both genes was modulated in spinal cord tissues (Table 2 and Table 3). In addition, the genes MTURN and MOBP and mitochondrial genes (MTCO1P12, MT-ND1, MT-ND2, MT-ND3, MT-ND4, MT-ND5, MT-CO2, MT-CO3, and MT-CYB) appear multiple times within both gene upregulation and downregulation hits (Table 2 and Table 3). Upon an analysis of the whole tissue-specific dataset, the genes MBP, PLP1, MTURN, and MOBP were only regulated within spinal cord tissues, whilst the expression of mitochondrial genes (encoded by mitochondrial DNA) was modulated within spinal cord, cerebellum, and motor cortex tissues, while MTCO1P12 gene expressions were regulated in all four tissue types (Table 2 and Table 3). Thus, this illustrates that SVAs possess the capacity to influence tissue-specific gene expressions.

4. Discussion

In this study, we evaluated the role of reference SVAs polymorphic for their presence in the human genome to modulate gene expressions within CNS tissues of ALS patients and healthy controls. An analysis of the NYGC ALS Consortium dataset demonstrated that SVA RIPs significantly regulate gene expressions genome-wide and in a tissue-specific manner. This study continues to expand on our previous findings, demonstrating the capability of SVAs to differentially regulate gene expressions [31,42]. We have previously illustrated the capacity of SVAs to influence gene expressions within Parkinson’s disease, highlighting the role of SVA_67 to modulate genes at the MAPT locus within the PPMI cohort and a CRISPR deletion model [27,32,40]. This analysis further validates our previous research, illustrating the functional capacity of SVA_67 within neurodegenerative diseases and potentially expanding the importance of SVA_67 and the MAPT locus to ALS (Figure 5 and Figure 6). Therefore, this study not only emphasizes the correlation between SVA presence or absence and differential gene expressions but also the involvement of SVAs within disease pathology.
Using WGS data from the ALS Consortium for a matrix eQTL analysis, we not only identified that polymorphic SVA RIPs possess the ability to modify the expression of multiple target genes, but also many SVAs can regulate the gene expression of a single target. Of these SVA RIPs, a greater proportion of trans-regulatory effects were displayed in comparison to cis ones. Similarly, previous eQTL studies analysing RNA-seq data from the 1000 genome project and the PPMI cohort, respectively, identified the impact of TEs on gene expressions [42,45]. In line with our analysis, these studies highlighted that several TEs simultaneously modulate the gene expression of a single gene, that an individual TE can regulate the expression of multiple genes, and that a greater number of the TEs analysed were in the trans position [42,45]. A potential mechanism for trans-acting eQTLs could be through the binding of the CCCTC-binding factor (CTCF) to SVAs. It has been demonstrated that CTCF can bind the SVA VNTR in vitro, while the germline-expressed paralog CTCF-like can do this in vivo [46]. Through the co-operation with protein complex cohesion, CTCF plays a key role in three-dimensional chromatin regulation and chromatin looping, bringing promoters and regulatory elements within close proximity to activate or repress gene expressions [46,47]. An additional mechanism could be through indirect transcription factor (TF)-mediated associations. This suggests that SVAs influencing the expression of TF could indirectly regulate one or multiple TF gene targets, ultimately activating or repressing TF target gene expressions [45].
Upon the examination of beta values from the eQTL analysis, we determined that within the combined analysis of CNS tissues, SVA_55 demonstrated the greatest effect on myelin basic protein (MBP) gene upregulation (Figure 4). Following further analysis, we identified that through individual tissue analyses, the top hits for gene upregulation and downregulation were SVAs influencing MBP gene expressions (Table 2 and Table 3). However, MBP expressions were only significantly modulated within spinal cord tissues. MBP is a key protein involved in the myelination process, whereby myelin sheaths are formed around CNS axons by oligodendrocytes [48,49]. As oligodendrocyte loss and myelin dysfunction has recently been emphasized in neurodegenerative diseases, including ALS, it is essential to investigate the relationship between SVAs and MBP differential expressions [50,51]. Lorente Pons et al. demonstrated the potential significance of MBP in ALS through a post-mortem analysis of both sporadic ALS and C9orf72-related ALS cases, identifying a significant reduction in MBP protein abundance when normalised to the proteolipid protein (PLP) in the spinal cord corticospinal tracts in ALS cases in comparison to controls [52]. As MBP mRNA is transported to the myelin compartment by the RNA transport granule and PLP is transported as a protein, this suggests that the reduction in MBP could be due to an impaired mRNA transport [52]. Our data suggests that certain SVAs (SVA_90 and SVA_5) act to downregulate MBP gene expressions; therefore, SVAs could play a role in this mechanism, leading to the reduction in MBP protein levels observed in the ALS patients compared to the controls.
Our analysis also demonstrated that SVAs can activate (SVA_37) and repress (SVA_87 and SVA_93) PLP1, a form of PLP. PLP1 has previously been implicated in Pelizaeus–Merzbacher disease (PMD), an X-linked neurodegenerative disease, whereby mutations within this gene inhibit CNS myelination [53,54]. In addition, we demonstrate that the myelin-associated oligodendrocyte basic protein (MOBP) gene, the locus of which has been highlighted for ALS risk, is again potentially regulated by multiple SVAs (SVA_5, 15, 37, 55, 84, 85, 87, 91, and 93) only within the spinal cord [43]. Hence, SVA regulation could be a potential mechanism involved in ALS risk at the MOBP locus. Furthermore, our tissue-specific analysis showed that multiple mitochondrial genes (MT-ND1,2,3,4,5, MT-CYB, MT-CO2,3, and pseudogene MTCO1P12) were largely activated and repressed within all four tissues analysed. SVA_30 and SVA_70 displayed the greatest effects on mitochondrial genes, with SVA_30 modulating five targets and SVA_70 affecting four gene targets. As mitochondrial dysfunction is known to be implicated in other neurodegenerative diseases, including PD and Alzheimer’s disease as well as ALS, SVA regulation resulting in differential expressions could be an underlying mechanism involved in disease pathology [55,56].
Upon an analysis of CNS tissues from both ALS individuals and healthy controls, seven of the top ten cis-acting reference SVA RIPs imposed the greatest effects on the upregulation of genes at the human leukocyte antigen (HLA) locus (Figure 6a). Four SVAs are responsible for the effects on HLA gene expressions, whereby SVA_24 influences the expression of one gene (HLA-A), SVA_25 two genes (HLA-B and HLA-C), SVA_27 two genes (HLA-DRB1 and HLA-DRB5), and SVA_88 one gene (HLA-DQB1). HLA, also referred to as the major histocompatibility complex (MHC), acts to regulate both innate and adaptive immunity involved in the human immune response system [57]. The involvement of the immune response system in neurological diseases has been recognised, and the HLA locus has been highlighted as a region of importance in numerous neurodegenerative diseases, including ALS [57]. Various studies have investigated the significance and mechanism of HLA in ALS, demonstrating increased frequencies of HLA-A, HLA-B, and HLA-C alleles in ALS cases compared to controls [58,59,60,61]. A recent large-scale GWAS conducted by Van Rheenen et al. identified the HLA region as a locus significantly associated with ALS, further highlighting the importance of this locus [43]. Previous studies within our group have highlighted the capability of SVAs to modulate HLA gene expressions; analyses of whole-genome sequencing and transcriptomic data obtained from the whole blood of individuals within a PPMI cohort discovered that SVA_24, SVA_25, and SVA_27 modulate the expression of HLA-A, HLA-B, and HLA-C and HLA-DRB1 and HLA-DRB5, respectively [42,62]. This suggests that the modulation of HLA genes by SVAs could be a common mechanism within neurodegenerative diseases.
In conclusion, we show that SVAs demonstrate a significant impact on the expression of individual or numerous genes, including those previously associated with neurodegenerative diseases, such as ALS. Ultimately, the ability of SVAs to act as a regulatory domain can be an underappreciated source of genetic variation, and this may be involved in the mechanisms leading to diseases and disease progression. Here, differential gene expressions caused by TE polymorphism could be one mechanism. However, due to limitations, such as low n numbers for some SVA genotypes and CNS tissue types (occipital cortex, temporal cortex, and hippocampus), further research investigating the involvement of TEs in the pathogenesis of neurodegenerative diseases, specifically ALS, is crucial. In addition, due to the low n numbers in the ALS and control groups, an individual group analysis was not possible. Therefore, future experiments individually investigating the influence of SVAs in ALS patient and control groups is required. Furthermore, although this analysis continues to demonstrate the potential role of SVAs in neurodegenerative diseases, further experiments, such as those involving CRISPR, are essential to validate SVA-specific influences. For example, we have previously shown that SVA_67 deletion in a CRISPR model resulted in a significant increase in MAPT and LRRC37A gene expressions [40].

Supplementary Materials

The following supporting information can be downloaded at: https://www.mdpi.com/article/10.3390/biom14030358/s1, Figure S1: Boxplots of cis-acting SVA RIPs displaying the top two hits for largest effect size on both gene upregulation and downregulation. Figure S2: Boxplots of cis-acting SVA RIPs displaying four hits for the greatest effect size on gene upregulation. Figure S3: Boxplots of cis-acting SVA RIPs displaying three hits for the greatest effect size on gene upregulation.

Author Contributions

Conceptualization, L.S.H., A.F. and S.K.; methodology, L.S.H., A.F., A.L.P. and S.K.; formal analysis, L.S.H., A.F. and S.K.; writing—original draft preparation, L.S.H.; writing—review and editing, L.S.H., A.F., A.L.P., V.J.B., J.P.Q. and S.K. All authors have read and agreed to the published version of the manuscript.

Funding

This research was funded by the Andrzej Wlodarski Memorial Research Fund (A.F. and J.P.Q.), the Andrzej Wlodarski Memorial Research PhD scholarship (A.F.), the Multiple Sclerosis Western Australia and Perron Institute for Neurological and Translational Science (A.L.P. and S.K.), the Darby Rimmer Foundation (V.J.B. and J.P.Q.), and MNDA [reference number: Quinn/Apr20/875-791] (V.J.B., J.P.Q., A.L.P., and S.K.). This work was supported by resources provided by the Pawsey Supercomputing Centre, with funding from the Australian Government and the Government of Western Australia.

Institutional Review Board Statement

Not applicable.

Informed Consent Statement

The WGS and RNA sequencing data from the ALS Consortium were provided in a de-identified manner, with consent obtained by the participating consortia.

Data Availability Statement

The sequencing (RNA and WGS) data analysed in this study from the ALS Consortium were obtained upon application to the New York Genome Centre, and data requests can be made by completing a genetic data request form at [email protected]. Additional data from this study will be made available upon reasonable request.

Acknowledgments

We would like to acknowledge the ALS Consortium/Target ALS Human Postmortem Tissue Core, the New York Genome Centre for Genomics of Neurodegenerative Disease, the Amyotrophic Lateral Sclerosis Association, and the TOW Foundation for the RNA-sequencing data used in this publication.

Conflicts of Interest

The authors declare no conflicts of interest. The funders had no role in the design of the study; in the collection, analyses, or interpretation of data; in the writing of the manuscript; or in the decision to publish the results.

References

  1. Zarei, S.; Carr, K.; Reiley, L.; Diaz, K.; Guerra, O.; Altamirano, P.; Pagani, W.; Lodin, D.; Orozco, G.; Chinea, A. A Comprehensive Review of Amyotrophic Lateral Sclerosis. Surg. Neurol. Int. 2015, 6, 171. [Google Scholar] [CrossRef]
  2. Grad, L.I.; Rouleau, G.A.; Ravits, J.; Cashman, N.R. Clinical Spectrum of Amyotrophic Lateral Sclerosis (ALS). Cold Spring Harb. Perspect. Med. 2017, 7, a024117. [Google Scholar] [CrossRef]
  3. Rowland, L.P.; Shneider, N.A. Amyotrophic Lateral Sclerosis. N. Engl. J. Med. 2001, 344, 1688–1700. [Google Scholar] [CrossRef]
  4. Hardiman, O.; Al-Chalabi, A.; Chio, A.; Corr, E.M.; Logroscino, G.; Robberecht, W.; Shaw, P.J.; Simmons, Z.; Van Den Berg, L.H. Amyotrophic Lateral Sclerosis. Nat. Rev. Dis. Primers 2017, 3, 17071. [Google Scholar] [CrossRef]
  5. Masrori, P.; Van Damme, P. Amyotrophic Lateral Sclerosis: A Clinical Review. Euro J. Neurol. 2020, 27, 1918–1929. [Google Scholar] [CrossRef]
  6. Longinetti, E.; Fang, F. Epidemiology of Amyotrophic Lateral Sclerosis: An Update of Recent Literature. Curr. Opin. Neurol. 2019, 32, 771–776. [Google Scholar] [CrossRef]
  7. Mejzini, R.; Flynn, L.L.; Pitout, I.L.; Fletcher, S.; Wilton, S.D.; Akkari, P.A. ALS Genetics, Mechanisms, and Therapeutics: Where Are We Now? Front. Neurosci. 2019, 13, 1310. [Google Scholar] [CrossRef]
  8. Brown, R.H.; Al-Chalabi, A. Amyotrophic Lateral Sclerosis. N. Engl. J. Med. 2017, 377, 162–172. [Google Scholar] [CrossRef]
  9. Ajroud-Driss, S.; Siddique, T. Sporadic and Hereditary Amyotrophic Lateral Sclerosis (ALS). Biochim. Biophys. Acta BBA Mol. Basis Dis. 2015, 1852, 679–684. [Google Scholar] [CrossRef]
  10. Van Es, M.A.; Hardiman, O.; Chio, A.; Al-Chalabi, A.; Pasterkamp, R.J.; Veldink, J.H.; Van Den Berg, L.H. Amyotrophic Lateral Sclerosis. Lancet 2017, 390, 2084–2098. [Google Scholar] [CrossRef]
  11. Savage, A.L.; Schumann, G.G.; Breen, G.; Bubb, V.J.; Al-Chalabi, A.; Quinn, J.P. Retrotransposons in the Development and Progression of Amyotrophic Lateral Sclerosis. J. Neurol. Neurosurg. Psychiatry 2019, 90, 284–293. [Google Scholar] [CrossRef] [PubMed]
  12. Gregory, J.M.; Elliott, E.; McDade, K.; Bak, T.; Pal, S.; Chandran, S.; Abrahams, S.; Smith, C. Neuronal Clusterin Expression Is Associated with Cognitive Protection in Amyotrophic Lateral Sclerosis. Neuropathol. Appl. Neurobio 2020, 46, 255–263. [Google Scholar] [CrossRef] [PubMed]
  13. Suzuki, N.; Nishiyama, A.; Warita, H.; Aoki, M. Genetics of Amyotrophic Lateral Sclerosis: Seeking Therapeutic Targets in the Era of Gene Therapy. J. Hum. Genet. 2023, 68, 131–152. [Google Scholar] [CrossRef]
  14. Zou, Z.-Y.; Zhou, Z.-R.; Che, C.-H.; Liu, C.-Y.; He, R.-L.; Huang, H.-P. Genetic Epidemiology of Amyotrophic Lateral Sclerosis: A Systematic Review and Meta-Analysis. J. Neurol. Neurosurg. Psychiatry 2017, 88, 540–549. [Google Scholar] [CrossRef]
  15. Al-Chalabi, A.; Fang, F.; Hanby, M.F.; Leigh, P.N.; Shaw, C.E.; Ye, W.; Rijsdijk, F. An Estimate of Amyotrophic Lateral Sclerosis Heritability Using Twin Data. J. Neurol. Neurosurg. Psychiatry 2010, 81, 1324–1326. [Google Scholar] [CrossRef]
  16. Theunissen, F.; Flynn, L.L.; Anderton, R.S.; Mastaglia, F.; Pytte, J.; Jiang, L.; Hodgetts, S.; Burns, D.K.; Saunders, A.; Fletcher, S.; et al. Structural Variants May Be a Source of Missing Heritability in sALS. Front. Neurosci. 2020, 14, 47. [Google Scholar] [CrossRef]
  17. Roses, A.D.; Akkari, P.A.; Chiba-Falek, O.; Lutz, M.W.; Gottschalk, W.K.; Saunders, A.M.; Saul, B.; Sundseth, S.; Burns, D. Structural Variants Can Be More Informative for Disease Diagnostics, Prognostics and Translation than Current SNP Mapping and Exon Sequencing. Expert. Opin. Drug Metab. Toxicol. 2016, 12, 135–147. [Google Scholar] [CrossRef]
  18. GTEx Consortium; Chiang, C.; Scott, A.J.; Davis, J.R.; Tsang, E.K.; Li, X.; Kim, Y.; Hadzic, T.; Damani, F.N.; Ganel, L.; et al. The Impact of Structural Variation on Human Gene Expression. Nat. Genet. 2017, 49, 692–699. [Google Scholar] [CrossRef]
  19. Liscic, R.M. Als and Ftd: Insights into the Disease Mechanisms and Therapeutic Targets. Eur. J. Pharmacol. 2017, 817, 2–6. [Google Scholar] [CrossRef]
  20. Elbarbary, R.A.; Lucas, B.A.; Maquat, L.E. Retrotransposons as Regulators of Gene Expression. Science 2016, 351, aac7247. [Google Scholar] [CrossRef]
  21. Ayarpadikannan, S.; Kim, H.-S. The Impact of Transposable Elements in Genome Evolution and Genetic Instability and Their Implications in Various Diseases. Genom. Inf. 2014, 12, 98. [Google Scholar] [CrossRef]
  22. Cordaux, R.; Batzer, M.A. The Impact of Retrotransposons on Human Genome Evolution. Nat. Rev. Genet. 2009, 10, 691–703. [Google Scholar] [CrossRef]
  23. Prudencio, M.; Gonzales, P.K.; Cook, C.N.; Gendron, T.F.; Daughrity, L.M.; Song, Y.; Ebbert, M.T.W.; Van Blitterswijk, M.; Zhang, Y.-J.; Jansen-West, K.; et al. Repetitive Element Transcripts Are Elevated in the Brain of C9orf72 ALS/FTLD Patients. Hum. Mol. Genet. 2017, 26, 3421–3431. [Google Scholar] [CrossRef]
  24. Hancks, D.C.; Kazazian, H.H. Active Human Retrotransposons: Variation and Disease. Curr. Opin. Genet. Dev. 2012, 22, 191–203. [Google Scholar] [CrossRef]
  25. International Human Genome Sequencing Consortium. Initial Sequencing and Analysis of the Human Genome. Nature 2001, 409, 860–921. [Google Scholar] [CrossRef]
  26. De Koning, A.P.J.; Gu, W.; Castoe, T.A.; Batzer, M.A.; Pollock, D.D. Repetitive Elements May Comprise Over Two-Thirds of the Human Genome. PLoS Genet. 2011, 7, e1002384. [Google Scholar] [CrossRef]
  27. Fröhlich, A.; Pfaff, A.L.; Bubb, V.J.; Koks, S.; Quinn, J.P. Characterisation of the Function of a SINE-VNTR-Alu Retrotransposon to Modulate Isoform Expression at the MAPT Locus. Front. Mol. Neurosci. 2022, 15, 815695. [Google Scholar] [CrossRef]
  28. Wang, H.; Xing, J.; Grover, D.; Hedges, D.J.; Han, K.; Walker, J.A.; Batzer, M.A. SVA Elements: A Hominid-Specific Retroposon Family. J. Mol. Biol. 2005, 354, 994–1007. [Google Scholar] [CrossRef]
  29. Hancks, D.C.; Kazazian, H.H. SVA Retrotransposons: Evolution and Genetic Instability. Semin. Cancer Biol. 2010, 20, 234–245. [Google Scholar] [CrossRef]
  30. Shen, L.; Wu, L.C.; Sanlioglu, S.; Chen, R.; Mendoza, A.R.; Dangel, A.W.; Carroll, M.C.; Zipf, W.B.; Yu, C.Y. Structure and Genetics of the Partially Duplicated Gene RP Located Immediately Upstream of the Complement C4A and the C4B Genes in the HLA Class III Region. Molecular Cloning, Exon-Intron Structure, Composite Retroposon, and Breakpoint of Gene Duplication. J. Biol. Chem. 1994, 269, 8466–8476. [Google Scholar] [CrossRef]
  31. Savage, A.L.; Bubb, V.J.; Breen, G.; Quinn, J.P. Characterisation of the Potential Function of SVA Retrotransposons to Modulate Gene Expression Patterns. BMC Evol. Biol. 2013, 13, 101. [Google Scholar] [CrossRef]
  32. Pfaff, A.L.; Bubb, V.J.; Quinn, J.P.; Koks, S. Reference SVA Insertion Polymorphisms Are Associated with Parkinson’s Disease Progression and Differential Gene Expression. NPJ Park. Dis. 2021, 7, 44. [Google Scholar] [CrossRef]
  33. Quinn, J.P.; Bubb, V.J. SVA Retrotransposons as Modulators of Gene Expression. Mob. Genet. Elem. 2014, 4, e32102. [Google Scholar] [CrossRef]
  34. Makino, S.; Kaji, R.; Ando, S.; Tomizawa, M.; Yasuno, K.; Goto, S.; Matsumoto, S.; Tabuena, M.D.; Maranon, E.; Dantes, M.; et al. Reduced Neuron-Specific Expression of the TAF1 Gene Is Associated with X-Linked Dystonia-Parkinsonism. Am. J. Hum. Genet. 2007, 80, 393–406. [Google Scholar] [CrossRef]
  35. Aneichyk, T.; Hendriks, W.T.; Yadav, R.; Shin, D.; Gao, D.; Vaine, C.A.; Collins, R.L.; Domingo, A.; Currall, B.; Stortchevoi, A.; et al. Dissecting the Causal Mechanism of X-Linked Dystonia-Parkinsonism by Integrating Genome and Transcriptome Assembly. Cell 2018, 172, 897–909.e21. [Google Scholar] [CrossRef]
  36. Bragg, D.C.; Mangkalaphiban, K.; Vaine, C.A.; Kulkarni, N.J.; Shin, D.; Yadav, R.; Dhakal, J.; Ton, M.-L.; Cheng, A.; Russo, C.T.; et al. Disease Onset in X-Linked Dystonia-Parkinsonism Correlates with Expansion of a Hexameric Repeat within an SVA Retrotransposon in TAF1. Proc. Natl. Acad. Sci. USA 2017, 114, E11020–E11028. [Google Scholar] [CrossRef]
  37. Verpillat, P.; Camuzat, A.; Hannequin, D.; Thomas-Anterion, C.; Puel, M.; Belliard, S.; Dubois, B.; Didic, M.; Michel, B.-F.; Lacomblez, L.; et al. Association Between the Extended Tau Haplotype and Frontotemporal Dementia. Arch. Neurol. 2002, 59, 935. [Google Scholar] [CrossRef]
  38. Wider, C.; Vilariño-Güell, C.; Jasinska-Myga, B.; Heckman, M.G.; Soto-Ortolaza, A.I.; Cobb, S.A.; Aasly, J.O.; Gibson, J.M.; Lynch, T.; Uitti, R.J.; et al. Association of the MAPT Locus with Parkinson’s Disease. Euro. J. Neurol. 2010, 17, 483–486. [Google Scholar] [CrossRef]
  39. Sánchez-Juan, P.; Moreno, S.; De Rojas, I.; Hernández, I.; Valero, S.; Alegret, M.; Montrreal, L.; García González, P.; Lage, C.; López-García, S.; et al. The MAPT H1 Haplotype Is a Risk Factor for Alzheimer’s Disease in APOE Ε4 Non-Carriers. Front. Aging Neurosci. 2019, 11, 327. [Google Scholar] [CrossRef]
  40. Fröhlich, A.; Hughes, L.S.; Middlehurst, B.; Pfaff, A.L.; Bubb, V.J.; Koks, S.; Quinn, J.P. CRISPR Deletion of a SINE-VNTR-Alu (SVA_67) Retrotransposon Demonstrates Its Ability to Differentially Modulate Gene Expression at the MAPT Locus. Front. Neurol. 2023, 14, 1273036. [Google Scholar] [CrossRef]
  41. Pfaff, A.L.; Bubb, V.J.; Quinn, J.P.; Koks, S. A Genome-Wide Screen for the Exonisation of Reference SINE-VNTR-Alus and Their Expression in CNS Tissues of Individuals with Amyotrophic Lateral Sclerosis. Int. J. Mol. Sci. 2023, 24, 11548. [Google Scholar] [CrossRef]
  42. Koks, S.; Pfaff, A.L.; Bubb, V.J.; Quinn, J.P. Expression Quantitative Trait Loci (eQTLs) Associated with Retrotransposons Demonstrate Their Modulatory Effect on the Transcriptome. Int. J. Mol. Sci. 2021, 22, 6319. [Google Scholar] [CrossRef]
  43. Van Rheenen, W.; Van Der Spek, R.A.A.; Bakker, M.K.; Van Vugt, J.J.F.A.; Hop, P.J.; Zwamborn, R.A.J.; De Klein, N.; Westra, H.-J.; Bakker, O.B.; Deelen, P.; et al. Common and Rare Variant Association Analyses in Amyotrophic Lateral Sclerosis Identify 15 Risk Loci with Distinct Genetic Architectures and Neuron-Specific Biology. Nat. Genet. 2021, 53, 1636–1648. [Google Scholar] [CrossRef]
  44. Nona, R.J.; Greer, J.M.; Henderson, R.D.; McCombe, P.A. HLA and Amyotrophic Lateral Sclerosis: A Systematic Review and Meta-Analysis. Amyotroph. Lateral Scler. Front. Degener. 2023, 24, 24–32. [Google Scholar] [CrossRef]
  45. Wang, L.; Rishishwar, L.; Mariño-Ramírez, L.; Jordan, I.K. Human Population-Specific Gene Expression and Transcriptional Network Modification with Polymorphic Transposable Elements. Nucleic Acids. Res. 2017, 45, 2318–2328. [Google Scholar] [CrossRef]
  46. Pugacheva, E.M.; Teplyakov, E.; Wu, Q.; Li, J.; Chen, C.; Meng, C.; Liu, J.; Robinson, S.; Loukinov, D.; Boukaba, A.; et al. The Cancer-Associated CTCFL/BORIS Protein Targets Multiple Classes of Genomic Repeats, with a Distinct Binding and Functional Preference for Humanoid-Specific SVA Transposable Elements. Epigenetics Chromatin 2016, 9, 35. [Google Scholar] [CrossRef]
  47. Sun, X.; Zhang, J.; Cao, C. CTCF and Its Partners: Shaper of 3D Genome during Development. Genes 2022, 13, 1383. [Google Scholar] [CrossRef] [PubMed]
  48. Aggarwal, S.; Snaidero, N.; Pähler, G.; Frey, S.; Sánchez, P.; Zweckstetter, M.; Janshoff, A.; Schneider, A.; Weil, M.-T.; Schaap, I.A.T.; et al. Myelin Membrane Assembly Is Driven by a Phase Transition of Myelin Basic Proteins Into a Cohesive Protein Meshwork. PLoS Biol. 2013, 11, e1001577. [Google Scholar] [CrossRef] [PubMed]
  49. Kang, S.H.; Li, Y.; Fukaya, M.; Lorenzini, I.; Cleveland, D.W.; Ostrow, L.W.; Rothstein, J.D.; Bergles, D.E. Degeneration and Impaired Regeneration of Gray Matter Oligodendrocytes in Amyotrophic Lateral Sclerosis. Nat. Neurosci. 2013, 16, 571–579. [Google Scholar] [CrossRef] [PubMed]
  50. Raffaele, S.; Boccazzi, M.; Fumagalli, M. Oligodendrocyte Dysfunction in Amyotrophic Lateral Sclerosis: Mechanisms and Therapeutic Perspectives. Cells 2021, 10, 565. [Google Scholar] [CrossRef]
  51. Lubetzki, C.; Zalc, B.; Williams, A.; Stadelmann, C.; Stankoff, B. Remyelination in Multiple Sclerosis: From Basic Science to Clinical Translation. Lancet Neurol. 2020, 19, 678–688. [Google Scholar] [CrossRef]
  52. Lorente Pons, A.; Higginbottom, A.; Cooper-Knock, J.; Alrafiah, A.; Alofi, E.; Kirby, J.; Shaw, P.J.; Wood, J.D.; Highley, J.R. Oligodendrocyte Pathology Exceeds Axonal Pathology in White Matter in Human Amyotrophic Lateral Sclerosis. J. Pathol. 2020, 251, 262–271. [Google Scholar] [CrossRef]
  53. Hübner, C.A.; Orth, U.; Senning, A.; Steglich, C.; Kohlschütter, A.; Korinthenberg, R.; Gal, A. Seventeen Novel PLP1 Mutations in Patients with Pelizaeus-Merzbacher Disease: MUTATIONS IN BRIEF. Hum. Mutat. 2005, 25, 321–322. [Google Scholar] [CrossRef]
  54. Cloake, N.; Yan, J.; Aminian, A.; Pender, M.; Greer, J. PLP1 Mutations in Patients with Multiple Sclerosis: Identification of a New Mutation and Potential Pathogenicity of the Mutations. J. Clin. Med. 2018, 7, 342. [Google Scholar] [CrossRef]
  55. Cruz-Rivera, Y.E.; Perez-Morales, J.; Santiago, Y.M.; Gonzalez, V.M.; Morales, L.; Cabrera-Rios, M.; Isaza, C.E. A Selection of Important Genes and Their Correlated Behavior in Alzheimer’s Disease. JAD 2018, 65, 193–205. [Google Scholar] [CrossRef]
  56. Wang, Y.; Xu, E.; Musich, P.R.; Lin, F. Mitochondrial Dysfunction in Neurodegenerative Diseases and the Potential Countermeasure. CNS Neurosci. Ther. 2019, 25, 816–824. [Google Scholar] [CrossRef]
  57. Misra, M.K.; Damotte, V.; Hollenbach, J.A. The Immunogenetics of Neurological Disease. Immunology 2018, 153, 399–414. [Google Scholar] [CrossRef]
  58. Antel, J.P.; Arnason, B.G.W.; Fuller, T.C.; Lehrich, J.R. Histocompatibility Typing in Amyotrophic Lateral Sclerosis. Arch. Neurol. 1976, 33, 423–425. [Google Scholar] [CrossRef]
  59. Behan, P.; Durward, W.; Dick, H. Histocompatibility antigens associated with motor-neurone disease. Lancet 1976, 308, 803. [Google Scholar] [CrossRef]
  60. Jokelainen, M.; Tiilikainen, A.; Lapinleimu, K. Polio Antibodies and HLA Antigens in Amyotrophic Lateral Sclerosis. Tissue Antigens 1977, 10, 259–266. [Google Scholar] [CrossRef]
  61. Kott, E.; Livni, E.; Zamir, R.; Kuritzky, A. Cell-Mediated Immunity to Polio and HLA Antigens in Amyotrophic Lateral Sclerosis. Neurology 1979, 29, 1040. [Google Scholar] [CrossRef] [PubMed]
  62. Kulski, J.K.; Pfaff, A.L.; Marney, L.D.; Fröhlich, A.; Bubb, V.J.; Quinn, J.P.; Koks, S. Regulation of Expression Quantitative Trait Loci by SVA Retrotransposons within the Major Histocompatibility Complex. Exp. Biol. Med. 2023, 248, 2304–2318. [Google Scholar] [CrossRef] [PubMed]
Figure 1. General overview of this study, including the structure of a full-length SVA element and both cis- and trans-acting mechanisms. (a) This study incorporated whole-genome sequencing and transcriptomic data from the New York Genome Centre ALS Consortium cohort to investigate the ability of SVA retrotransposon insertion polymorphisms (RIPs) to act as expression quantitative trait loci (eQTL) within central nervous system (CNS) tissues. (b) Schematic of SVA structure, displaying a full-length SVA element consisting of a 5′ CT-rich hexamer repeat, an Alu-like region, a variable-number tandem repeat (VNTR), a SINE (short interspersed nuclear element)-R domain, and a 3′ poly-A tail. (c) The mechanism by which SVAs implement a cis- or trans-regulatory effect. Cis-regulatory effects are defined as effects observed by elements (SVA RIPs) which act to modulate the expression of genes less than 1 Mb away from the element site, whilst trans-regulatory effects are defined as effects observed by elements which act to modulate the expression of genes greater than 1 Mb away from the element site.
Biomolecules 14 00358 g001
Figure 2. Composition of tissues used in this study. For this study, CNS tissue data from healthy controls (COs) and ALS patients combined (n = 1903), which composed of spinal cord (n = 710), motor cortex (n = 440), frontal cortex (n = 335), cerebellum (n = 240), occipital cortex (n = 57), temporal cortex (n = 58), and hippocampus (n = 63), were included for our analysis.
Biomolecules 14 00358 g002
Figure 3. Overview of the number of genomic loci affected by SVA polymorphism following a matrix eQTL analysis of all CNS tissues. (a) Pie chart representing the composition of all significant differentially regulated genetic loci (n = 14,830), displaying the number of cis-regulatory (n = 167) and trans-regulatory (n = 14,663) effects exhibited by SVAs within all CNS tissues. (b) Bar chart displaying reference SVAs and the number of genome-wide gene targets. Each of the 92 analysed SVAs had a significant impact on multiple targets, with the lowest number of targets for one SVA being 6 (FDR p < 0.05). Only SVAs affecting more than 200 targets are displayed (n = 26). For this analysis, data from ALS individuals and healthy controls were combined.
Biomolecules 14 00358 g003
Figure 4. Reference SVA RIP elements with the greatest effect size from matrix eQTL analysis of all CNS tissues. (a,b) Clustered bar chart showing the top ten reference SVA RIPs across all CNS tissues with the greatest effect size on gene upregulation (positive beta values) (a) and gene downregulation (negative beta values) (b) from an eQTL analysis. SVA_55 demonstrated the greatest increase in the activation of the MBP gene with a beta coefficient of 272,847, whilst SVA_70 demonstrated the greatest repressive effect on the MT-ND1 gene with a beta coefficient of −36,441. (c) Boxplot of SVA_55 indicating MBP gene expressions stratified by the SVA_55 genotype. Genotypes PP (n = 2), PA (n = 20) and AA (n = 1731). Significant differences in MBP gene expressions were observed between the PP and PA group (p = 0.0218) and the PP and AA group (p = 0.0218). Subjects with the PP genotype displayed a 9.5-fold and 19.2-fold increase in MBP gene expressions in comparison to subjects with AA and PA genotypes, respectively. (d) Boxplot of SVA_70 displaying MT-ND1 gene expressions, stratified by the SVA_70 genotype. Genotypes PP (n = 1581), PA (n = 159), and AA (n = 13). A significant repression in MT-ND1 gene expressions of 55% was observed between the PP and PA subject groups (p = 0.0098). No statistical significance was obtained for differences between the PP and PA subject groups. For both boxplots, the significance of gene expression changes between groups was determined using the Wilcoxon pairwise comparison with FDR-adjusted p values (FDR p < 0.05). The PP, PA, and AA groups represent when there are two copies of the SVA present, one copy of the SVA present, and the complete absence of the SVA, respectively. * p < 0.05, ** p < 0.01.
Biomolecules 14 00358 g004
Figure 5. Boxplots of two of the most significant SVA_67 interactions with MAPK8IP1P2 and LRRC37A obtained from a matrix eQTL analysis. Both significant effects are cis-regulatory effects. Datapoints from both ALS individuals and healthy controls across all CNS tissues were combined, and the significance of gene expression changes between groups was determined using the Wilcoxon pairwise comparison with FDR-adjusted p values (FDR < 0.05). (a) Boxplot showing the association of the SVA_67 genotype with MAPK8IP1P2 gene expressions. Significant differences were observed between all groups for MAPK8IP1P2 expressions, namely PP and PA (p = 7.33 × 10−237), PP and AA (p = 4.26 × 10−55), and PA and AA (p = 1.33 × 10⁻⁷). (b) Boxplot showing the association of the SVA_67 genotype with LRRC37A gene expressions. Significant differences were observed between all groups for LRRC37A gene expressions, namely PP and PA (p = 1.95 × 10−204), PP and AA (p = 1.06 × 10−39), and PA and AA (p = 2.13 × 10⁻¹²). Fold change in expressions of 262-fold and 6-fold for MAPK8IP1P2 and LRRC37A, respectively, was observed for individuals with AA genotypes in comparison to PP genotypes. PP (n = 1183), PA (n = 500), and AA (n = 63). *** p < 0.001.
Biomolecules 14 00358 g005
Figure 6. Top ten cis-acting reference SVA elements with the greatest effects on gene upregulation and downregulation in CNS tissues. (a) Clustered bar chart displaying ten reference SVA RIPs with the greatest cis-regulatory effects on gene activation (most positive beta values) from a matrix eQTL analysis (FDR p < 0.05). SVA_67 is responsible for the two greatest increases in the activation of the genes LRRC37A4P and MAPT, displaying beta coefficients of 1384 and 1101, respectively. SVA_24 (HLA-A); SVA_25 (HLA-C and HLA-B); SVA_27 (HLA-DRB1, HLA-DRB5, and HLA-DQB1); and SVA_88 (HLA-DPA1) were shown to be responsible for the large increases in the activation of a series of HLA genes. (b) Clustered bar chart displaying ten reference SVA RIPs with the greatest cis-regulatory effects on gene downregulation (most negative beta values) from a matrix eQTL analysis (FDR p < 0.05). The two greatest repressive effects were on the FCGBP gene, regulated by both SVA_73 and SVA_72, demonstrating a beta coefficient of −2843 and −668, respectively. SVA_67 was responsible for four of these effects, by showing a downregulating effect, for the genes KANSL1, LRRC37A, LRRC37A2, and MAPK8IP1P2. This analysis combined datapoints from ALS individuals and healthy controls.
Biomolecules 14 00358 g006
Table 1. Top ten most significant reference SVA RIP effects from a matrix eQTL analysis of all CNS tissues. This analysis included the combination of both cis and trans effects as well as datapoints from both ALS individuals and healthy controls.
SVABeta ValueFalse Discovery Rate (FDR)Target GeneCis/trans Effect
SVA_67−131.21.93 × 10−303MAPK8IP1P2cis
SVA_67−5.21.93 × 10−303ENSG00000285668.1cis
SVA_67−315.15.12 × 10−299LRRC37Acis
SVA_87−126.23.02 × 10−224MTND4P24trans
SVA_93−126.24.22 × 10−224MTND4P24trans
SVA_84−63.14.22 × 10−224MTND4P24trans
SVA_584.13.89 × 10−211LLPH-DTcis
SVA_2412.35.06 × 10−201HLA-Kcis
SVA_1559.63.13 × 10−189MTND4P24trans
SVA_3348.48.84 × 10−188ZFAND2A-DTcis
Table 2. Top 40 significant reference SVA RIPs with the greatest effects on gene upregulation (most positive beta values) from a tissue-specific matrix eQTL analysis. This analysis included the combination of both cis and trans effects as well as datapoints from both ALS individuals and healthy controls.
SVAGene IDFDR p ValueBeta ValueGeneChrCis/transTissue
SVA_55ENSG00000197971.165.99 × 10−10638,804.662MBP18transSpinal Cord
SVA_15ENSG00000197971.163.59 × 10−7620,026.724MBP18transSpinal Cord
SVA_37ENSG00000197971.168.76 × 10−4585,791.502MBP18transSpinal Cord
SVA_85ENSG00000197971.162.08 × 10−3560,691.911MBP18transSpinal Cord
SVA_37ENSG00000123560.143.72 × 10−12168,441.474PLP1XtransSpinal Cord
SVA_55ENSG00000198888.21.47 × 10−5153,947.476MT-ND1MTtransSpinal Cord
SVA_55ENSG00000203930.125.97 × 10−4148,616.177LINC00632XtransMotor Cortex
SVA_15ENSG00000198888.21.62 × 10−3142,961.051MT-ND1MTtransSpinal Cord
SVA_55ENSG00000203930.121.25 × 10−16115,977.491LINC00632XtransSpinal Cord
SVA_15ENSG00000203930.121.86 × 10−8969,10.7666LINC00632XtransSpinal Cord
SVA_55ENSG00000180354.161.34× 10−2290,266.4311MTURN7transSpinal Cord
SVA_15ENSG00000123560.143.43 × 10−380,380.5623PLP1XtransSpinal Cord
SVA_85ENSG00000203930.124.76 × 10−378,457.5282LINC00632XtransSpinal Cord
SVA_15ENSG00000180354.161.86 × 10−1277,839.9088MTURN7transSpinal Cord
SVA_55ENSG00000198712.13.04 × 10−376,318.8326MT-CO2MTtransSpinal Cord
SVA_85ENSG00000180354.161.35 × 10−567,900.9382MTURN7transSpinal Cord
SVA_85ENSG00000237973.14.10 × 10−3366,702.2584MTCO1P121transMotor Cortex
SVA_37ENSG00000168314.183.50 × 10−965,555.4973MOBP3transSpinal Cord
SVA_85ENSG00000237973.11.01 × 10−3253,997.5748MTCO1P121transFrontal Cortex
SVA_15ENSG00000168314.185.02 × 10−953,362.8451MOBP3transSpinal Cord
SVA_55ENSG00000237973.13.61 × 10−2252,048.0183MTCO1P121transMotor Cortex
SVA_55ENSG00000168314.181.38 × 10−949,216.1425MOBP3transSpinal Cord
SVA_15ENSG00000237973.12.83 × 10−2648,449.3666MTCO1P121transMotor Cortex
SVA_85ENSG00000168314.183.76 × 10−447,350.2242MOBP3transSpinal Cord
SVA_85ENSG00000237973.18.82 × 10−4239,521.0532MTCO1P121transSpinal Cord
SVA_55ENSG00000064787.131.62 × 10−3036,504.4209BCAS120transSpinal Cord
SVA_37ENSG00000091513.161.65× 10−635,838.5557TF3transSpinal Cord
SVA_55ENSG00000237973.11.49 × 10−5933,728.2747MTCO1P121transSpinal Cord
SVA_4ENSG00000237973.13.59 × 10−1732,837.5825MTCO1P121transFrontal Cortex
SVA_37ENSG00000237973.11.52 × 10−2332,783.3654MTCO1P121transMotor Cortex
SVA_37ENSG00000237973.11.72 × 10−3132,728.512MTCO1P121transFrontal Cortex
SVA_15ENSG00000237973.18.40 × 10−4132,193.3558MTCO1P121transSpinal Cord
SVA_37ENSG00000099194.62.82 × 10−431,333.7253SCD10transSpinal Cord
SVA_85ENSG00000064787.133.78 × 10−1030,888.7058BCAS120transSpinal Cord
SVA_15ENSG00000237973.13.46 × 10−1430,602.307MTCO1P121transFrontal Cortex
SVA_15ENSG00000064787.131.97 × 10−1530,356.5865BCAS120transSpinal Cord
SVA_37ENSG00000237973.11.28 × 10−630,025.949MTCO1P121transCerebellum
SVA_15ENSG00000237973.15.29 × 10−1329,472.617MTCO1P121transCerebellum
SVA_55ENSG00000237973.12.00 × 10−827,693.2393MTCO1P121transFrontal Cortex
SVA_4ENSG00000237973.12.56 × 10−927,128.1241MTCO1P121transMotor Cortex
Table 3. Top 40 significant reference SVA RIPs with the greatest effects on gene downregulation (most negative beta values) from a tissue-specific matrix eQTL analysis. This analysis included the combination of both cis and trans effects as well as datapoints from both ALS individuals and healthy controls.
SVAGene IDFDR p-ValueBeta ValueGeneChrCis/transTissue
SVA_90ENSG00000197971.163.28 × 10−3−1,337,611.1MBP18transSpinal Cord
SVA_5ENSG00000197971.163.06 × 10−3−351,064.11MBP18transSpinal Cord
SVA_87ENSG00000123560.141.98 × 10−7−193,423.77PLP1XtransSpinal Cord
SVA_93ENSG00000123560.142.05 × 10−7−193,266.83PLP1XtransSpinal Cord
SVA_30ENSG00000198888.28.47 × 10−3−143,159.48MT-ND1MTtransCerebellum
SVA_70ENSG00000198886.21.029 × 10−2−133,464.74MT-ND4MTtransCerebellum
SVA_30ENSG00000198763.37.85 × 10−4−131,182.45MT-ND2MTtransMotor Cortex
SVA_30ENSG00000198938.26.86 × 10−3−111,339.82MT-CO3MTtransCerebellum
SVA_30ENSG00000198727.25.66 × 10−3−104,147.35MT-CYBMTtransCerebellum
SVA_84ENSG00000123560.142.11 × 10−7−96,556.036PLP1XtransSpinal Cord
SVA_30ENSG00000198786.27.25 × 10−3−94,294.133MT-ND5MTtransMotor Cortex
SVA_70ENSG00000198763.31.29 × 10−2−82,929.066MT-ND2MTtransCerebellum
SVA_90ENSG00000259001.36.14 × 10−3−73,740.939ENSG0000025900114transSpinal Cord
SVA_91ENSG00000203930.122.02 × 10−3−71,147.071LINC00632XtransSpinal Cord
SVA_87ENSG00000168314.183.60 × 10−4−67,162.942MOBP3transSpinal Cord
SVA_93ENSG00000168314.183.67 × 10−4−67,112.229MOBP3transSpinal Cord
SVA_91ENSG00000180354.162.99 × 10−5−57,438.97MTURN7transSpinal Cord
SVA_90ENSG00000168309.184.26 × 10−3−48,145.904FAM107A3transSpinal Cord
SVA_5ENSG00000180354.161.55 × 10−5−43,141.656MTURN7transSpinal Cord
SVA_70ENSG00000198712.16.03 × 10−3−43,049.326MT-CO2MTtransCerebellum
SVA_90ENSG00000168309.182.45 × 10−3−40,637.548FAM107A3transMotor Cortex
SVA_91ENSG00000168314.185.48 × 10−4−40,457.332MOBP3transSpinal Cord
SVA_90ENSG00000177575.132.99 × 10−19−36,552.585CD16312transSpinal Cord
SVA_84ENSG00000168314.183.83 × 10−4−33,494.891MOBP3transSpinal Cord
SVA_90ENSG00000087086.151.64 × 10−8−32,820.222FTL19transMotor Cortex
SVA_5ENSG00000168314.181.72 × 10−4−31,165.253MOBP3transSpinal Cord
SVA_16ENSG00000123560.148.97 × 10−7−31,144.963PLP1XtransSpinal Cord
SVA_91ENSG00000237973.16.16 × 10−30−29,834.037MTCO1P121transSpinal Cord
SVA_87ENSG00000173786.175.88 × 10−4−28,556.333CNP17transSpinal Cord
SVA_93ENSG00000173786.175.98 × 10−4−28,536.883CNP17transSpinal Cord
SVA_90ENSG00000137285.111.48 × 10−40−27,173.64TUBB2B6transMotor Cortex
SVA_5ENSG00000237973.13.92 × 10−10−24,995.474MTCO1P121transMotor Cortex
SVA_5ENSG00000237973.18.77 × 10−13−24,871.705MTCO1P121transFrontal Cortex
SVA_91ENSG00000064787.135.47 × 10−7−22,960.148BCAS120transSpinal Cord
SVA_93ENSG00000198840.23.12 × 10−3−22,049.981MT-ND3MTtransSpinal Cord
SVA_87ENSG00000198840.23.13 × 10−3−22,046.442MT-ND3MTtransSpinal Cord
SVA_90ENSG00000164733.221.39 × 10−4−21,828.547CTSB8transSpinal Cord
SVA_90ENSG00000079215.151.69 × 10−5−21,020.491SLC1A35transMotor Cortex
SVA_5ENSG00000237973.18.40 × 10−24−19,907.219MTCO1P121transSpinal Cord
SVA_87ENSG00000136541.151.45 × 10−10−19,551.323ERMN2transSpinal Cord
Disclaimer/Publisher’s Note: The statements, opinions and data contained in all publications are solely those of the individual author(s) and contributor(s) and not of MDPI and/or the editor(s). MDPI and/or the editor(s) disclaim responsibility for any injury to people or property resulting from any ideas, methods, instructions or products referred to in the content.

