

Differential Regulation of Hyaluronan Synthesis by Three Isoforms of Hyaluronan Synthases in Mammalian Cells


Abstract
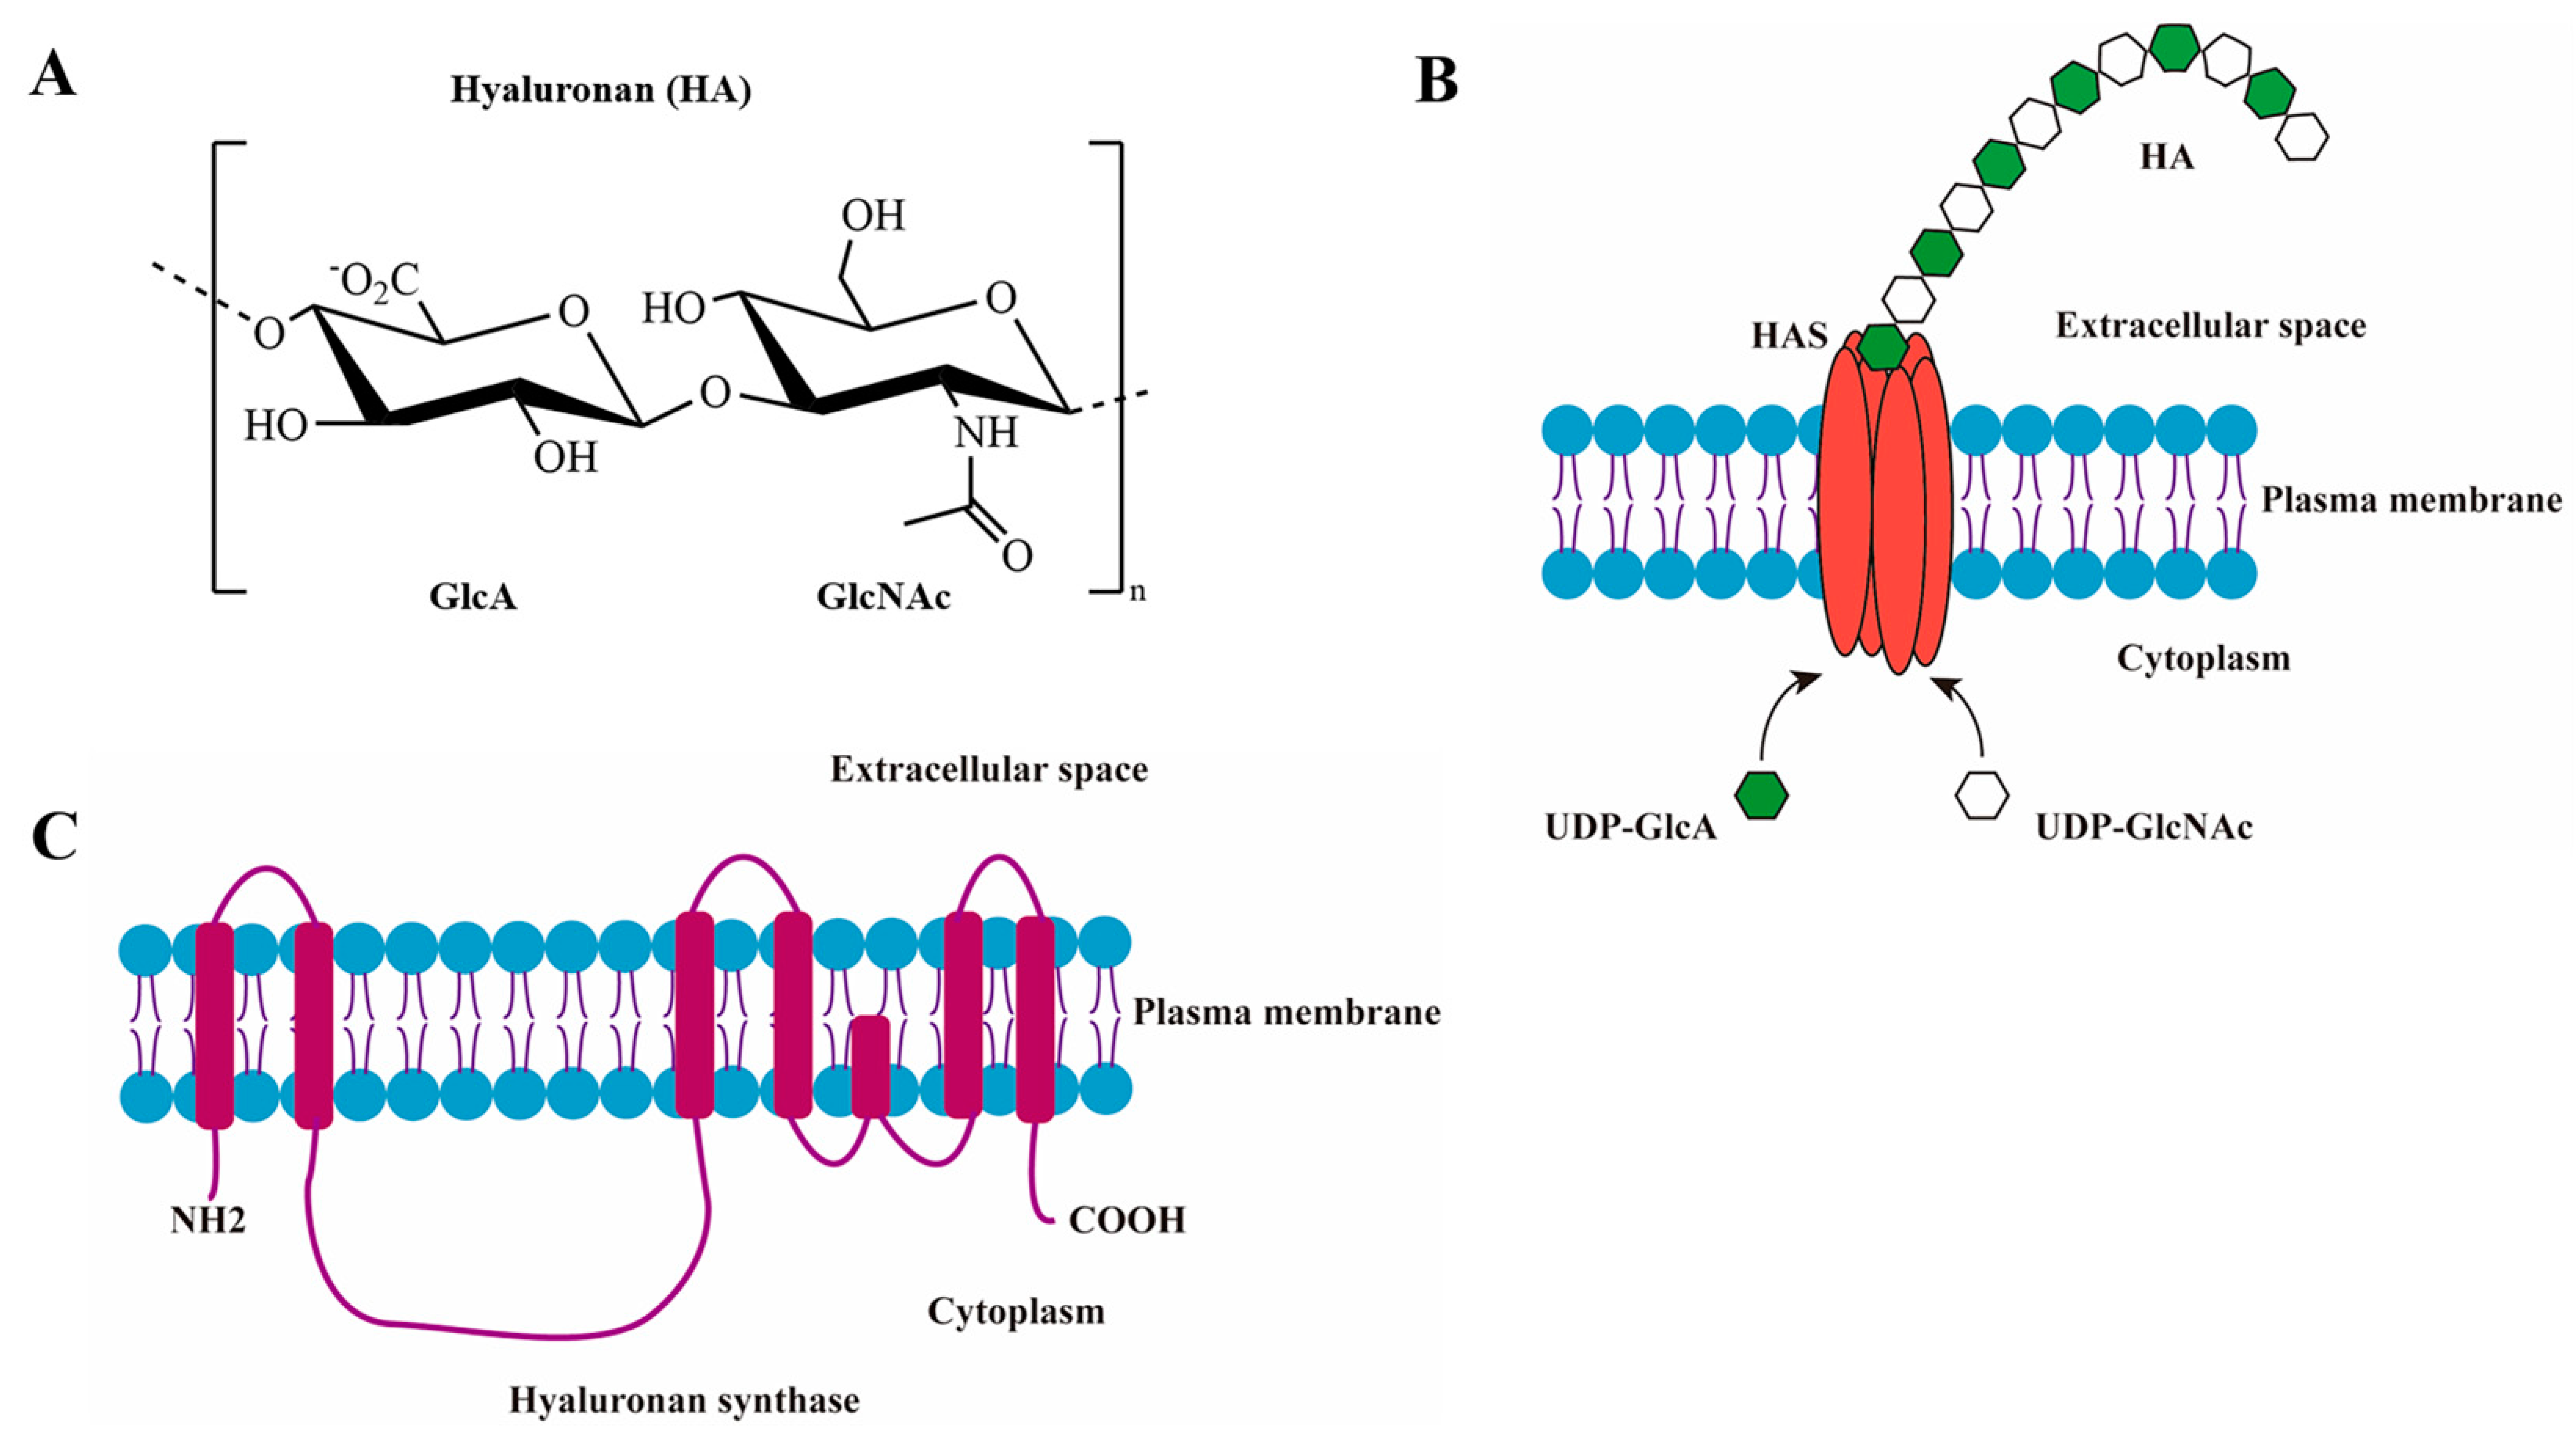
1. Introduction
2. Materials and Methods
2.1. Transient Expression of Human HAS1, HAS2, and HAS3 in HEK293F Cells
2.2. Protein Purification of Human HAS1, HAS2, and HAS3
2.3. Synthesis of HA Polysaccharides In Vitro
2.4. HA Analysis by Pulse-Field Gel Electrophoresis
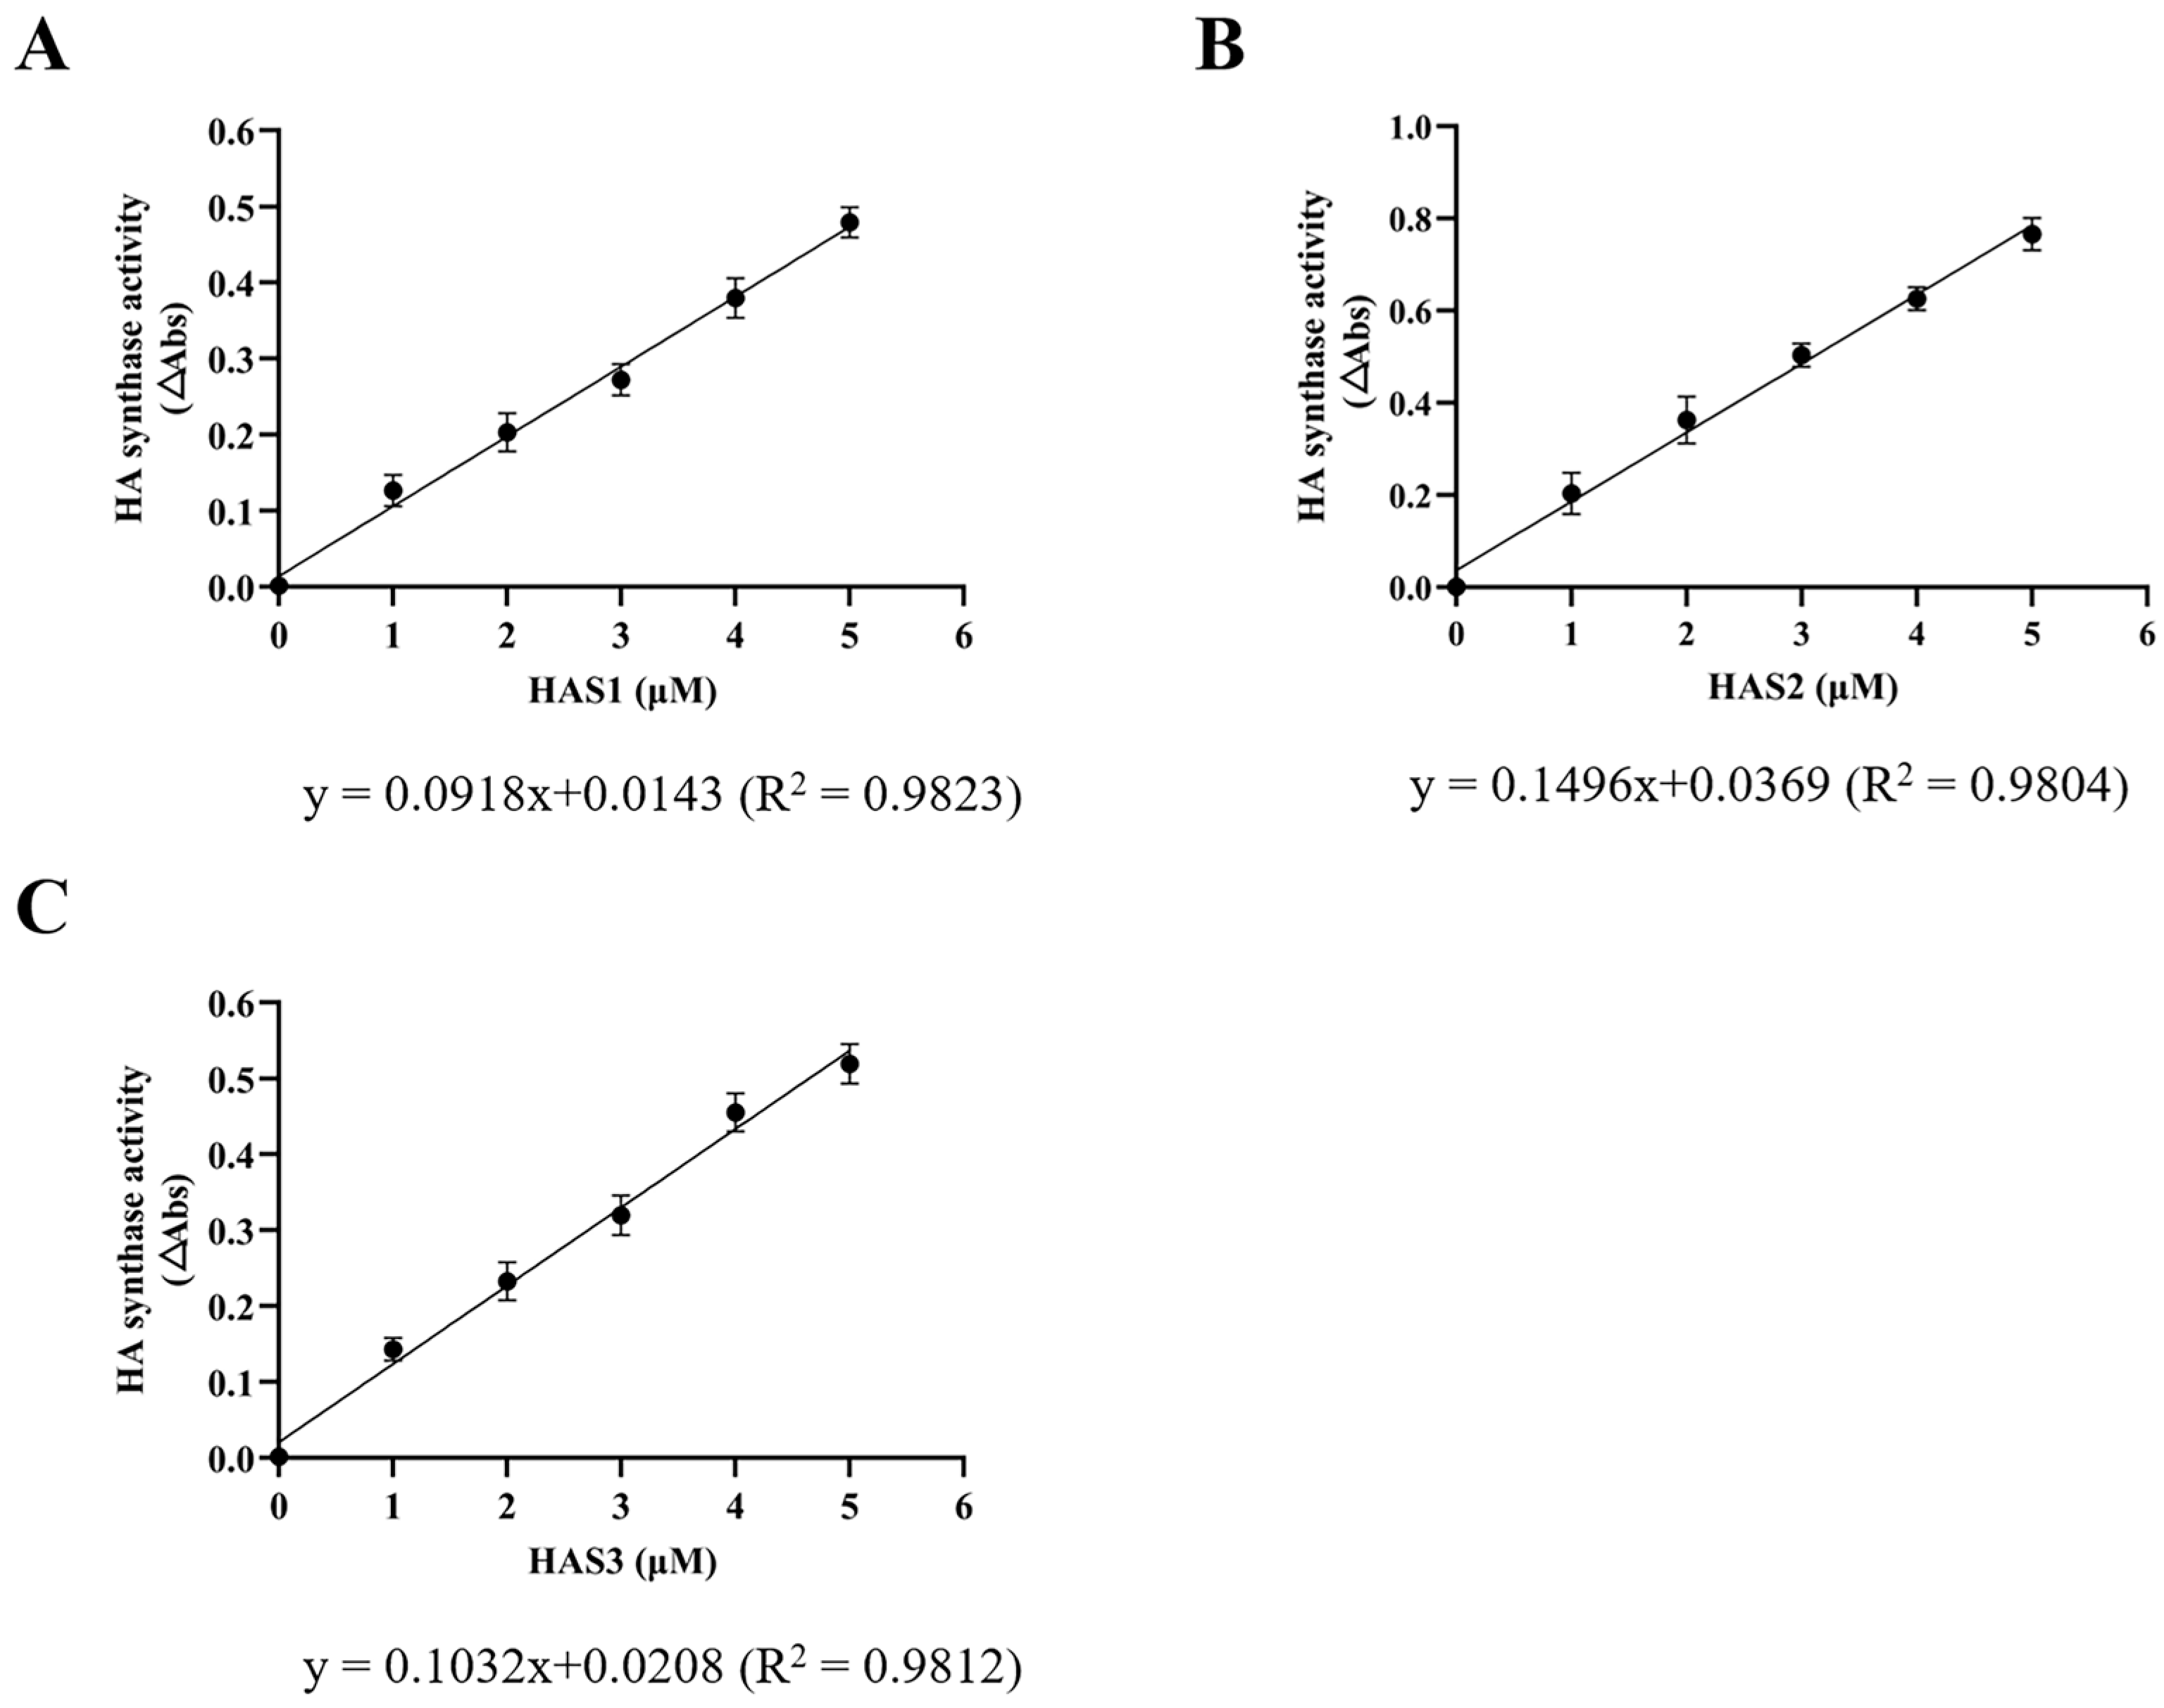
2.5. Enzyme-Coupled Activity Assay
2.6. ELISA Assay of Hyaluronan
3. Results
3.1. Bioinformatics Analysis of HAS1, HAS2, and HAS3
3.2. Expression and Purification of Recombinant Human HAS1, HAS2, and HAS3
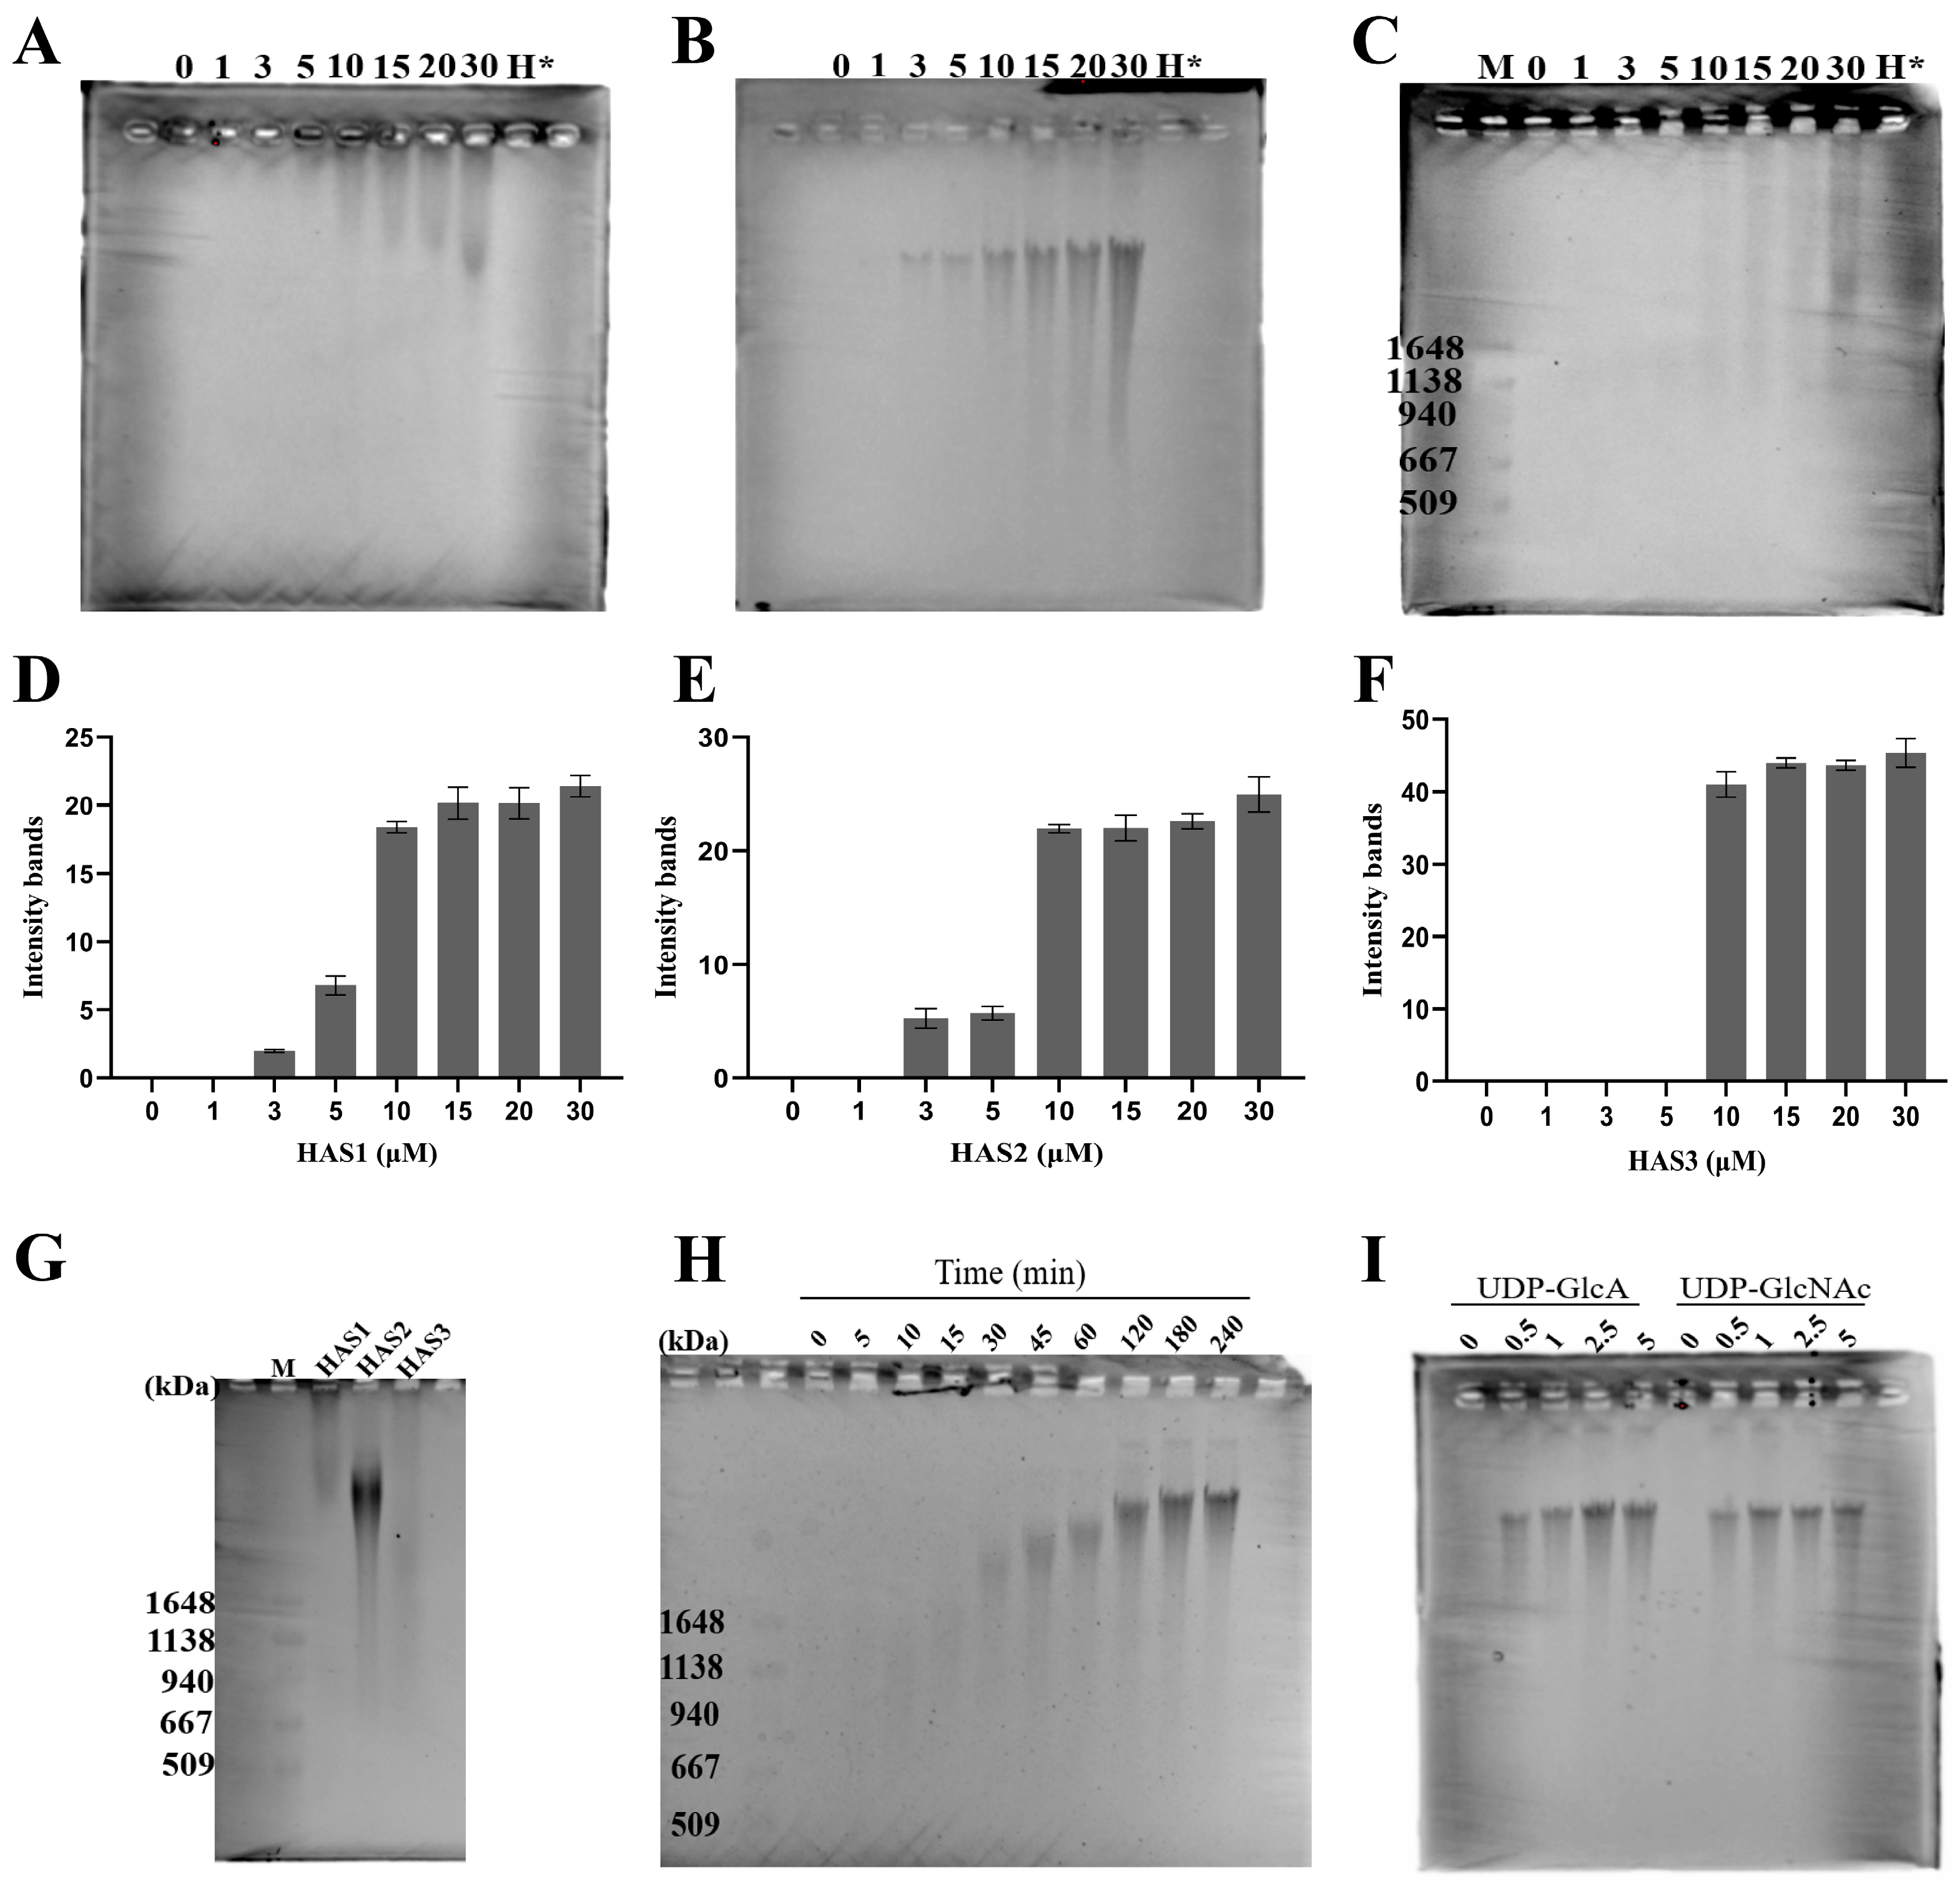
3.3. The Concentration of HA Polymer Synthesis Analyzed by Pulse-Field Gel Electrophoresis
3.4. Size Distribution of HA Synthesized by HAS1, HAS2, and HAS3
3.5. Monitoring the Progression of In Vitro HA Biosynthesis over Time
3.6. Sensitivity of HAS2 to UDP-GlcA and UDP-GlcNAc Substrates
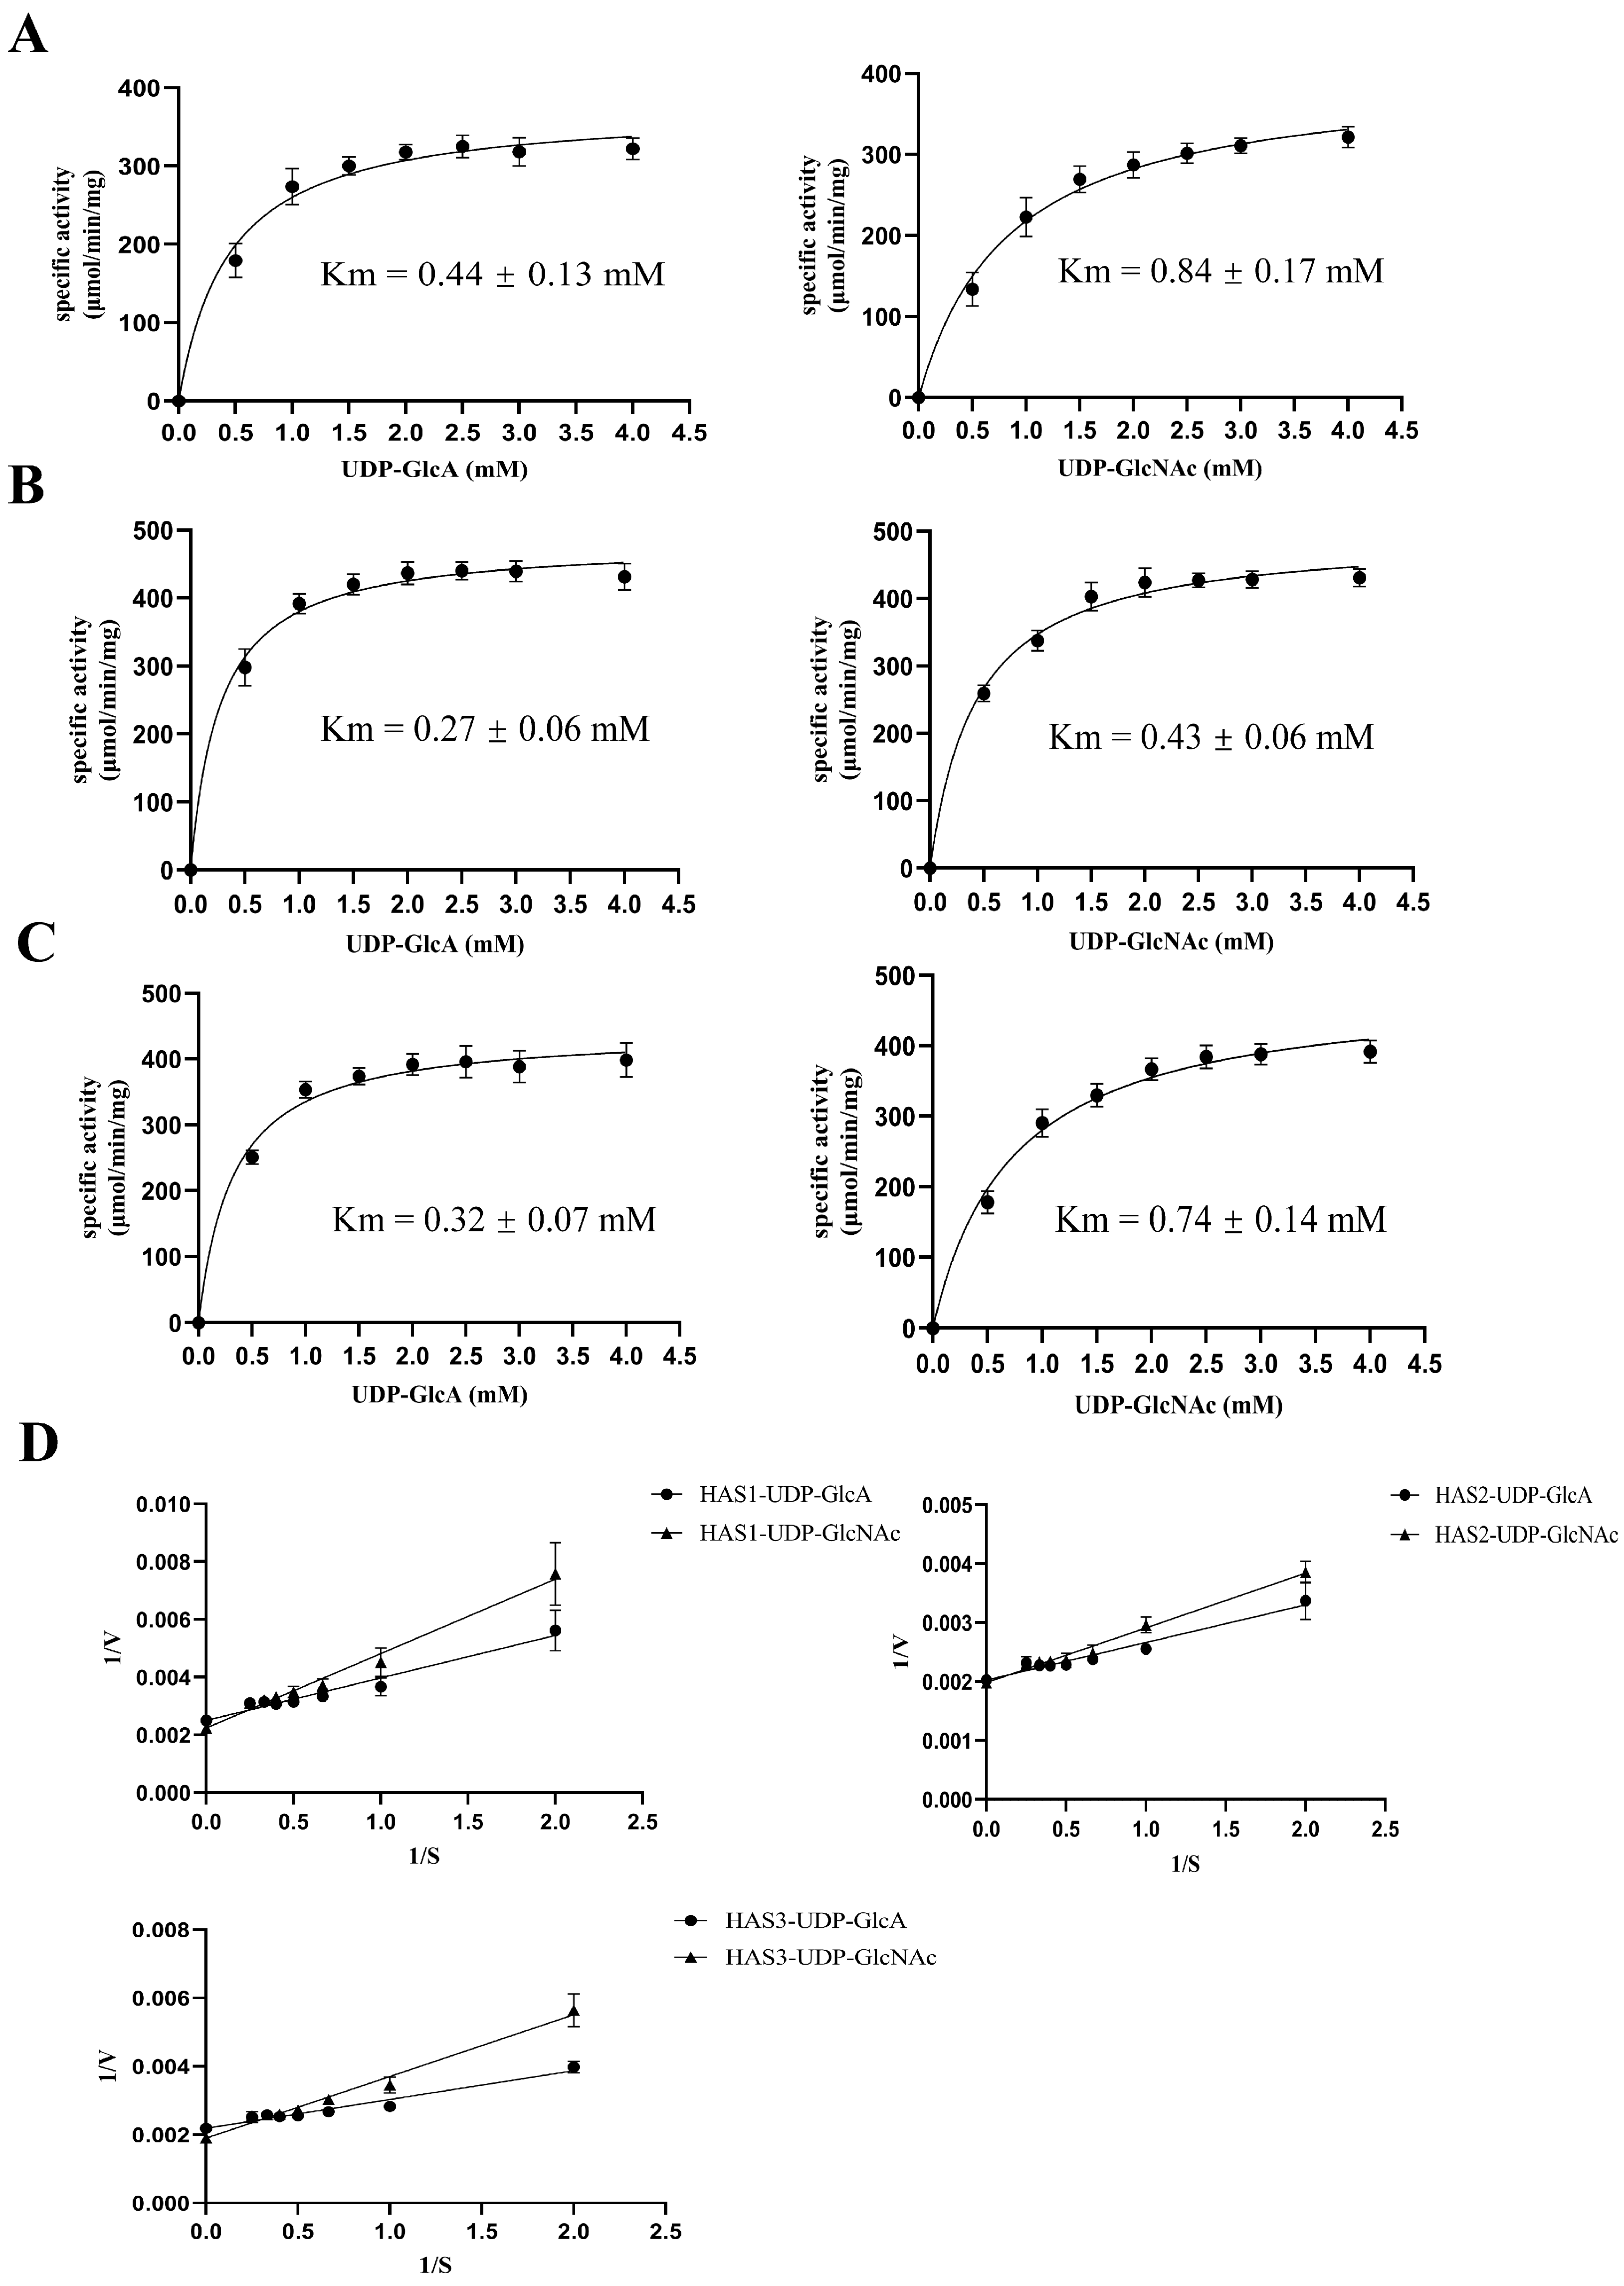
3.7. Kinetic Analyses of Membrane Proteins HAS1, HAS2, and HAS3
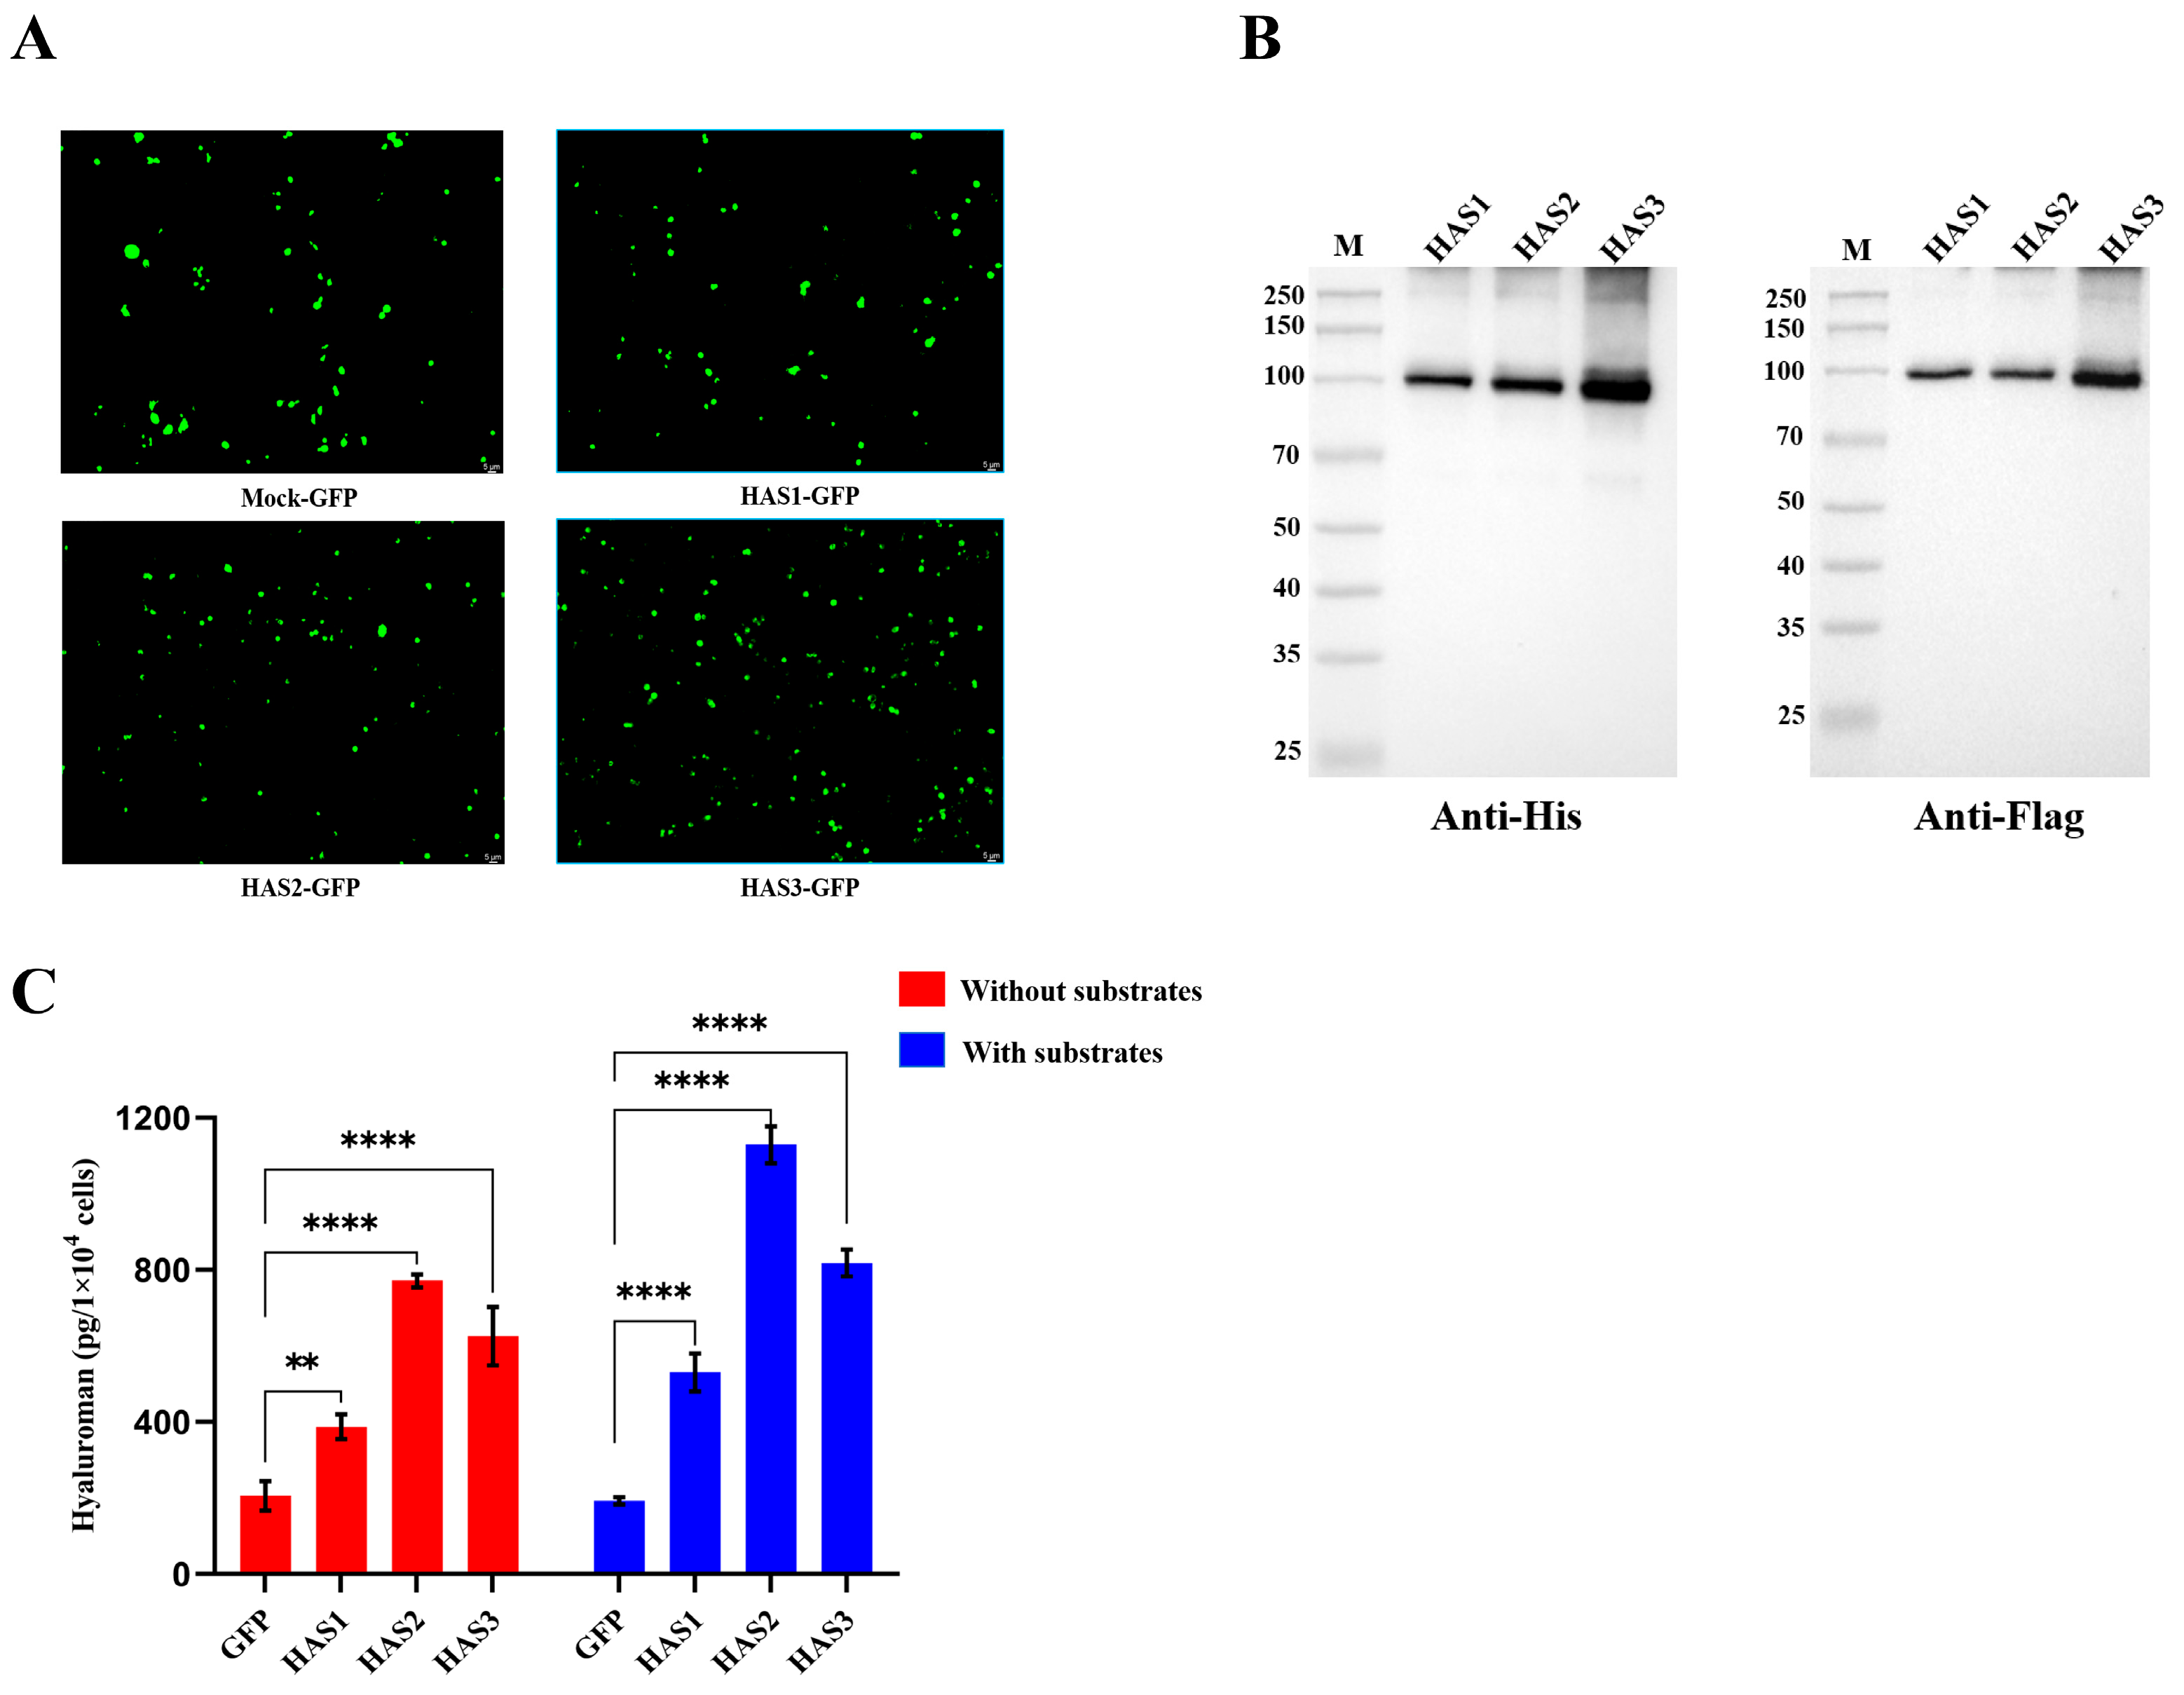
3.8. HAS1-GFP, HAS2-GFP, and HAS3-GFP Overexpressing 293T Cells Secreted Hyaluronan
4. Discussion
Supplementary Materials
Author Contributions
Funding
Institutional Review Board Statement
Informed Consent Statement
Data Availability Statement
Acknowledgments
Conflicts of Interest
References
- Kobayashi, T.; Chanmee, T.; Itano, N. Hyaluronan: Metabolism and Function. Biomolecules 2020, 10, 1525. [Google Scholar] [CrossRef] [PubMed]
- Averbeck, M.; Gebhardt, C.A.; Voigt, S.; Beilharz, S.; Anderegg, U.; Termeer, C.C.; Sleeman, J.P.; Simon, J.C. Differential regulation of hyaluronan metabolism in the epidermal and dermal compartments of human skin by UVB irradiation. J. Investig. Dermatol. 2007, 127, 687–697. [Google Scholar] [CrossRef]
- Stecco, C.; Stern, R.; Porzionato, A.; Macchi, V.; Masiero, S.; Stecco, A.; De Caro, R. Hyaluronan within fascia in the etiology of myofascial pain. Surg. Radiol. Anat. 2011, 33, 891–896. [Google Scholar] [CrossRef]
- Girish, K.S.; Kemparaju, K. The magic glue hyaluronan and its eraser hyaluronidase: A biological overview. Life Sci. 2007, 80, 1921–1943. [Google Scholar] [CrossRef]
- Heldin, P. Importance of hyaluronan biosynthesis and degradation in cell differentiation and tumor formation. Braz. J. Med. Biol. Res. 2003, 36, 967–973. [Google Scholar] [CrossRef] [PubMed]
- Sironen, R.K.; Tammi, M.; Tammi, R.; Auvinen, P.K.; Anttila, M.; Kosma, V.M. Hyaluronan in human malignancies. Exp. Cell Res. 2011, 317, 383–391. [Google Scholar] [CrossRef]
- Tammi, R.H.; Kultti, A.; Kosma, V.M.; Pirinen, R.; Auvinen, P.; Tammi, M.I. Hyaluronan in human tumors: Pathobiological and prognostic messages from cell-associated and stromal hyaluronan. Semin. Cancer Biol. 2008, 18, 288–295. [Google Scholar] [CrossRef] [PubMed]
- Aya, K.L.; Stern, R. Hyaluronan in wound healing: Rediscovering a major player. Wound Repair. Regen. 2014, 22, 579–593. [Google Scholar] [CrossRef]
- Stern, R.; Asari, A.A.; Sugahara, K.N. Hyaluronan fragments: An information-rich system. Eur. J. Cell Biol. 2006, 85, 699–715. [Google Scholar] [CrossRef]
- Wilson, E.; Knudson, W.; Newell-Litwa, K. Hyaluronan regulates synapse formation and function in developing neural networks. Sci. Rep. 2020, 10, 16459. [Google Scholar] [CrossRef]
- Salwowska, N.M.; Bebenek, K.A.; Żądło, D.A.; Wcisło-Dziadecka, D.L. Physiochemical properties and application of hyaluronic acid: A systematic review. J. Cosmet. Dermatol. 2016, 15, 520–526. [Google Scholar] [CrossRef] [PubMed]
- Ma, W.; Suh, W.H. Cost-Effective Cosmetic-Grade Hyaluronan Hydrogels for ReNcell VM Human Neural Stem Cell Culture. Biomolecules 2019, 9, 515. [Google Scholar] [CrossRef]
- Vitale, D.L.; Caon, I.; Parnigoni, A.; Sevic, I.; Spinelli, F.M.; Icardi, A.; Passi, A.; Vigetti, D.; Alaniz, L. Initial Identification of UDP-Glucose Dehydrogenase as a Prognostic Marker in Breast Cancer Patients, Which Facilitates Epirubicin Resistance and Regulates Hyaluronan Synthesis in MDA-MB-231 Cells. Biomolecules 2021, 11, 246. [Google Scholar] [CrossRef] [PubMed]
- Caon, I.; Parnigoni, A.; Viola, M.; Karousou, E.; Passi, A.; Vigetti, D. Cell Energy Metabolism and Hyaluronan Synthesis. J. Histochem. Cytochem. 2021, 69, 35–47. [Google Scholar] [CrossRef]
- Wilson, E.S.; Litwa, K. Synaptic Hyaluronan Synthesis and CD44-Mediated Signaling Coordinate Neural Circuit Development. Cells 2021, 10, 2574. [Google Scholar] [CrossRef] [PubMed]
- Heldermon, C.; DeAngelis, P.L.; Weigel, P.H. Topological organization of the hyaluronan synthase from Streptococcus pyogenes. J. Biol. Chem. 2001, 276, 2037–2046. [Google Scholar] [CrossRef] [PubMed]
- Weigel, P.H.; DeAngelis, P.L. Hyaluronan synthases: A decade-plus of novel glycosyltransferases. J. Biol. Chem. 2007, 282, 36777–36781. [Google Scholar] [CrossRef]
- Yoshida, M.; Itano, N.; Yamada, Y.; Kimata, K. In vitro synthesis of hyaluronan by a single protein derived from mouse HAS1 gene and characterization of amino acid residues essential for the activity. J. Biol. Chem. 2000, 275, 497–506. [Google Scholar] [CrossRef] [PubMed]
- Itano, N.; Kimata, K. Mammalian hyaluronan synthases. IUBMB Life 2002, 54, 195–199. [Google Scholar] [CrossRef]
- Ruppert, S.M.; Hawn, T.R.; Arrigoni, A.; Wight, T.N.; Bollyky, P.L. Tissue integrity signals communicated by high-molecular weight hyaluronan and the resolution of inflammation. Immunol. Res. 2014, 58, 186–192. [Google Scholar] [CrossRef]
- Muto, J.; Yamasaki, K.; Taylor, K.R.; Gallo, R.L. Engagement of CD44 by hyaluronan suppresses TLR4 signaling and the septic response to LPS. Mol. Immunol. 2009, 47, 449–456. [Google Scholar] [CrossRef] [PubMed]
- Soltés, L.; Mendichi, R.; Kogan, G.; Schiller, J.; Stankovska, M.; Arnhold, J. Degradative action of reactive oxygen species on hyaluronan. Biomacromolecules 2006, 7, 659–668. [Google Scholar] [CrossRef]
- Hoarau, A.; Polette, M.; Coraux, C. Lung Hyaluronasome: Involvement of Low Molecular Weight Ha (Lmw-Ha) in Innate Immunity. Biomolecules 2022, 12, 658. [Google Scholar] [CrossRef] [PubMed]
- Wu, M.; Cao, M.; He, Y.; Liu, Y.; Yang, C.; Du, Y.; Wang, W.; Gao, F. A novel role of low molecular weight hyaluronan in breast cancer metastasis. FASEB J. 2015, 29, 1290–1298. [Google Scholar] [CrossRef]
- Cyphert, J.M.; Trempus, C.S.; Garantziotis, S. Size Matters: Molecular Weight Specificity of Hyaluronan Effects in Cell Biology. Int. J. Cell Biol. 2015, 2015, 563818. [Google Scholar] [CrossRef]
- Pan, X.; Li, Z.; Zhou, Q.; Shen, H.; Wu, K.; Huang, X.; Chen, J.; Zhang, J.; Zhu, X.; Lei, J.; et al. Structure of the human voltage-gated sodium channel Nav1.4 in complex with β1. Science 2018, 362, eaau2486. [Google Scholar] [CrossRef]
- Nallamsetty, S.; Waugh, D.S. A generic protocol for the expression and purification of recombinant proteins in Escherichia coli using a combinatorial His6-maltose binding protein fusion tag. Nat. Protoc. 2007, 2, 383–391. [Google Scholar] [CrossRef] [PubMed]
- Shimada, H.; Kusakizako, T.; Dung Nguyen, T.H.; Nishizawa, T.; Hino, T.; Tominaga, M.; Nureki, O. The structure of lipid nanodisc-reconstituted TRPV3 reveals the gating mechanism. Nat. Struct. Mol. Biol. 2020, 27, 645–652. [Google Scholar] [CrossRef]
- Liu, N.; Gao, F.; Han, Z.; Xu, X.; Underhill, C.B.; Zhang, L. Hyaluronan synthase 3 overexpression promotes the growth of TSU prostate cancer cells. Cancer Res. 2001, 61, 5207–5214. [Google Scholar]
- Bai, K.J.; Spicer, A.P.; Mascarenhas, M.M.; Yu, L.; Ochoa, C.D.; Garg, H.G.; Quinn, D.A. The role of hyaluronan synthase 3 in ventilator-induced lung injury. Am. J. Respir. Crit. Care Med. 2005, 172, 92–98. [Google Scholar] [CrossRef]
- Kultti, A.; Zhao, C.; Singha, N.C.; Zimmerman, S.; Osgood, R.J.; Symons, R.; Jiang, P.; Li, X.; Thompson, C.B.; Infante, J.R.; et al. Accumulation of extracellular hyaluronan by hyaluronan synthase 3 promotes tumor growth and modulates the pancreatic cancer microenvironment. BioMed Res. Int. 2014, 2014, 817613. [Google Scholar] [CrossRef] [PubMed]
- Reiprich, S.; Hofbauer, E.; Kiderlen, S.; Clausen-Schaumann, H.; Böcker, W.; Aszódi, A.; Schönitzer, V. Adhesive Properties of the Hyaluronan Pericellular Coat in Hyaluronan Synthases Overexpressing Mesenchymal Stem Cells. Int. J. Mol. Sci. 2020, 21, 3827. [Google Scholar] [CrossRef] [PubMed]
- Maloney, F.P.; Kuklewicz, J.; Corey, R.A.; Bi, Y.; Ho, R.; Mateusiak, L.; Pardon, E.; Steyaert, J.; Stansfeld, P.J.; Zimmer, J. Structure, substrate recognition and initiation of hyaluronan synthase. Nature 2022, 604, 195–201. [Google Scholar] [CrossRef] [PubMed]
- Weigel, P.H. Hyaluronan Synthase: The Mechanism of Initiation at the Reducing End and a Pendulum Model for Polysaccharide Translocation to the Cell Exterior. Int. J. Cell Biol. 2015, 2015, 367579. [Google Scholar] [CrossRef]
- Górniak, I.; Stephens, Z.; Erramilli, S.K.; Gawda, T.; Kossiakoff, A.A.; Zimmer, J. Structural insights into translocation and tailored synthesis of hyaluronan. Nat. Struct. Mol. Biol. 2024. [Google Scholar] [CrossRef]
- Morgan, J.L.; Strumillo, J.; Zimmer, J. Crystallographic snapshot of cellulose synthesis and membrane translocation. Nature 2013, 493, 181–186. [Google Scholar] [CrossRef]
- Ren, Z.; Chhetri, A.; Guan, Z.; Suo, Y.; Yokoyama, K.; Lee, S.Y. Structural basis for inhibition and regulation of a chitin synthase from Candida albicans. Nat. Struct. Mol. Biol. 2022, 29, 653–664. [Google Scholar] [CrossRef]
- Tlapak-Simmons, V.L.; Baggenstoss, B.A.; Kumari, K.; Heldermon, C.; Weigel, P.H. Kinetic characterization of the recombinant hyaluronan synthases from Streptococcus pyogenes and Streptococcus equisimilis. J. Biol. Chem. 1999, 274, 4246–4253. [Google Scholar] [CrossRef]
- Rilla, K.; Oikari, S.; Jokela, T.A.; Hyttinen, J.M.; Kärnä, R.; Tammi, R.H.; Tammi, M.I. Hyaluronan synthase 1 (HAS1) requires higher cellular UDP-GlcNAc concentration than HAS2 and HAS3. J. Biol. Chem. 2013, 288, 5973–5983. [Google Scholar] [CrossRef]
- Itano, N.; Sawai, T.; Yoshida, M.; Lenas, P.; Yamada, Y.; Imagawa, M.; Shinomura, T.; Hamaguchi, M.; Yoshida, Y.; Ohnuki, Y.; et al. Three isoforms of mammalian hyaluronan synthases have distinct enzymatic properties. J. Biol. Chem. 1999, 274, 25085–25092. [Google Scholar] [CrossRef]


Disclaimer/Publisher’s Note: The statements, opinions and data contained in all publications are solely those of the individual author(s) and contributor(s) and not of MDPI and/or the editor(s). MDPI and/or the editor(s) disclaim responsibility for any injury to people or property resulting from any ideas, methods, instructions or products referred to in the content. |
© 2024 by the authors. Licensee MDPI, Basel, Switzerland. This article is an open access article distributed under the terms and conditions of the Creative Commons Attribution (CC BY) license (https://creativecommons.org/licenses/by/4.0/).
Share and Cite
Wang, J.; Wu, Z.; Cao, L.; Long, F. Differential Regulation of Hyaluronan Synthesis by Three Isoforms of Hyaluronan Synthases in Mammalian Cells. Biomolecules 2024, 14, 1567. https://doi.org/10.3390/biom14121567
Wang J, Wu Z, Cao L, Long F. Differential Regulation of Hyaluronan Synthesis by Three Isoforms of Hyaluronan Synthases in Mammalian Cells. Biomolecules. 2024; 14(12):1567. https://doi.org/10.3390/biom14121567
Chicago/Turabian StyleWang, Jie, Zhikun Wu, Longtao Cao, and Feng Long. 2024. "Differential Regulation of Hyaluronan Synthesis by Three Isoforms of Hyaluronan Synthases in Mammalian Cells" Biomolecules 14, no. 12: 1567. https://doi.org/10.3390/biom14121567
APA StyleWang, J., Wu, Z., Cao, L., & Long, F. (2024). Differential Regulation of Hyaluronan Synthesis by Three Isoforms of Hyaluronan Synthases in Mammalian Cells. Biomolecules, 14(12), 1567. https://doi.org/10.3390/biom14121567