Abstract
Insulin is amongst the human genome’s most well-studied genes/proteins due to its connection to metabolic health. Within this article, we review literature and data to build a knowledge base of Insulin (INS) genetics that influence transcription, transcript processing, translation, hormone maturation, secretion, receptor binding, and metabolism while highlighting the future needs of insulin research. The INS gene region has 2076 unique variants from population genetics. Several variants are found near the transcriptional start site, enhancers, and following the INS transcripts that might influence the readthrough fusion transcript INS–IGF2. This INS–IGF2 transcript splice site was confirmed within hundreds of pancreatic RNAseq samples, lacks drift based on human genome sequencing, and has possible elevated expression due to viral regulation within the liver. Moreover, a rare, poorly characterized African population-enriched variant of INS–IGF2 results in a loss of the stop codon. INS transcript UTR variants rs689 and rs3842753, associated with type 1 diabetes, are found in many pancreatic RNAseq datasets with an elevation of the 3′UTR alternatively spliced INS transcript. Finally, by combining literature, evolutionary profiling, and structural biology, we map rare missense variants that influence preproinsulin translation, proinsulin processing, dimer/hexamer secretory storage, receptor activation, and C-peptide detection for quasi-insulin blood measurements.
1. Introduction
Diabetes or prediabetes impacts 1 in 3 individuals within the United States [1], costing $237 billion each year, or 1 of every 4 dollars spent on health care within the United States [2]. Diabetes mellitus is diagnosed as hyperglycemia higher than the threshold blood glucose concentration, resulting in microvascular end-organ damage. Hyperglycemia is the sequelae of numerous pathophysiological processes resulting from either the pancreatic beta-cells’ inability to secrete enough insulin or their systemic resistance to insulin.
Type 1 diabetes (T1D) is associated with the decreased production of insulin through the destruction of pancreatic beta cells [3,4], requiring expensive, lifelong recombinant insulin injections [5]. Genome-wide association studies (GWAS) and epigenetic profiling have yielded insights into T1D risk factors of the immune system, such as the contributions of T-cells, pancreatic acinar, and ductal cells to disease pathology [6]. In multiple independent studies, the rs689 variant of the insulin gene (INS) was identified as the most significant locus for T1D risk when masking the large effect size of HLA loci [6,7,8].
Rare genomic variants within INS and other genes have recently been identified to elevate odds for T1D and neonatal/monogenic diabetes [8,9]. Monogenic diabetes by itself is uncommon. Advances in various molecular techniques and our immune understanding of T1D may one day lead to a cure for T1D through increasing the body’s natural insulin production [10]. The drive to develop precision therapy wherein the individual patient is better managed requires a comprehensive understanding of diverse axes of biology. These axes include homeostatic context, genomic variation, chromatin signals that mark genes as active or repressed in tissues, expressed transcripts, and increased knowledge of lifestyle/environmental risk factors. However, diagnoses, treatment options, and investments in T1D insights come with an increasing socioeconomic and racial disparity that must be addressed [11].
Contrary to T1D, Type 2 diabetes (T2D) is associated with a developed resistance to insulin, accounting for ~90% of individuals with diabetes [12,13,14]. T2D results in the elevation of blood glucose, which, if uncontrolled, can result in pathologies including myocardial infarction, stroke, amputation, renal disease, eye damage, neuropathy, and increased tumor burden [15]. Public health strategies have struggled to slow the epidemic, even in countries with the greatest financial and scientific resources. There are 12 drug classes currently approved by the U.S. Food and Drug Administration (FDA) to control blood glucose and modify disease course, but these drugs do not provide a cure or result in the remission of disease. These agents are often prescribed based on nonmedical considerations such as cost, patient preference, or comorbidities not accounting for biological mechanisms. Thus, balancing glucose levels through diet or pharmacology (Metformin, sulfonylureas, meglitinides, pioglitazone, and α-glucosidase inhibitors) within T2D patients is of top priority [16]. However, T2D is undiagnosed or uncontrolled in many individuals, with socioeconomic and racial disparity playing a role [17,18,19]. In advanced or uncontrolled T2D, insulin production is often hindered through decreased pancreatic beta cell mass, yielding similarities to T1D [20]. Genetic variants in genes involved in insulin gene regulation, protein processing, and secretion were identified as risk factors for T2D [21,22].
In addition to the complex system of genetic variance that can affect diabetes, an individual’s environment can also play a significant role. For example, an increase in body mass index and diagnosis of obesity can disrupt the endocrine pathways that increase diabetes incidence [23]. Geographical areas with limited access to nutritious food options, called food deserts, were linked to increased obesity and diabetes, including among youth [24,25]. Low-income neighborhoods often lack outdoor areas and facilities for residents to safely engage in physical activity, exacerbating health issues and making it difficult for even motivated residents to exercise [26]. Air pollution from highways contributes to poor cardiovascular health and may also directly contribute to an increased risk for obesity and diabetes [26,27,28].
In attempts to improve community health, some urban planners have begun to advocate for a focus on creating ‘walkable neighborhoods’, designing new city blocks, and even removing old infrastructure in a way that encourages pedestrian and bicycle travel and ensures easy access to parks and quality grocery stores [27]. An analysis of existing neighborhoods shows that more walkable neighborhoods are associated with lower obesity rates, and that residents also had lower predicted ten-year cardiovascular disease risks than their counterparts in less walkable neighborhoods [28,29]. Many population groups with a high risk of diabetes live in communities disproportionately impacted by urban planning, air pollution, low income and food deserts. We must carefully interpret the genetic component of diabetes risk based on the inheritance of functional variants relative to cultural inheritance and community dynamics [30]. Here, we provide a genomic dissection of INS variants as an example of functional interactions between genetics and environment, which might apply to other metabolic genes.
The decreasing cost of whole genome sequencing and the broader application of these techniques [31] has provided new opportunities to investigate the genetic factors associated with T1D and T2D. Larger-scale sequencing projects such as gnomAD [32], All of Us [33,34], and the UK biobank [35] have yielded diverse racial/cultural genomes that can be connected to medical insights for diabetes diagnosis, treatments, and complications. Genetic studies can inform the risk of diabetic complications but often rely on GWAS and less on an individual’s genome, yielding many cultural/population disparities [31]. Multiple forms of neonatal/monogenic diabetes were identified using advanced genome sequencing strategies [36,37,38], which can be applied independent of socioeconomic and population background through which GWAS can be biased. In addition, a more complex polygenetic understanding of diabetes can be devised for each individual through a network of genes/variants involved in beta cell function and insulin mechanisms of action, which can be integrated with medical data to determine a patient’s diabetes risk score [39,40,41].
The advancement of sequencing has discovered thousands of variants connected to insulin, many with little characterization. Characterizing the nature of variants within INS and those that affect proteins involved in the synthesis and secretion of insulin is vital to achieving personalized diabetic treatment. This article summarizes all known variants, both rare and common, of the INS gene while highlighting genes/proteins that might be associated with the altered synthetic capacity of insulin. The article reflects a literature and data review of INS. This ranges from how variants influence INS expression and splicing to how missense variants contribute to insulin misfolding, mislocalization, and receptor binding alterations.
2. Results
2.1. INS Genomic Location
The Insulin gene (INS) was found on chromosome 11 in the p15.5 region (Figure 1A). It is found between Tyrosine Hydroxylase (TH), Insulin-like Growth Factor 2 (IGF2), and IGF2 noncoding antisense transcript (IGF2-AS) [42], as can be seen in Figure 1B. Several known splicing derivatives exist for each gene, with IGF2 having multiple known transcriptional start sites (TSS), and there is a known merged transcript of INS and IGF2 (INS–IGF2) resulting from transcriptional readthrough. The protein coded by INS–IGF2 is a 200 amino acid protein (UniProt F8WCM5) composed of the first 62 amino acids of insulin followed by a frameshift that differs from the IGF2 coding sequence. This transcript was associated with insulinomas and autoimmunity [43,44]. The sequence of INS and INS–IGF2 exons was well-conserved throughout vertebrates (Figure 1B, conservation). While there are many known datasets for gene regulation in this region and thousands of human genomic variants, little work has been done so far to integrate this knowledge into the complex regulation of beta cells and INS expression. One of the strongest gene regulation datasets for pancreatic islets comes from the Roadmap Epigenomics project [45], where the measurement of six different epigenetic marks from 98 different human cells/tissues (including pancreatic islets) annotates transcriptional regulation and multiple enhancers near INS in islet cells (Figure 1B, 18-state Genome Annotation). Transcription factors, including PDX1, NEUROD1, and MAFA, are known to control pancreatic beta cell development and INS transcription [46,47,48,49].
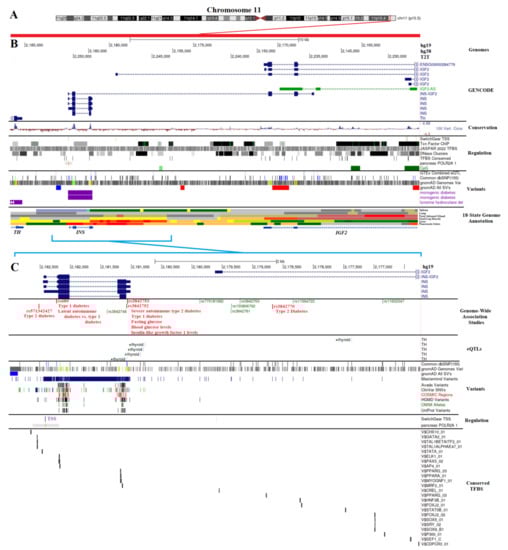
Figure 1.
Genomic region of insulin. (A) The map of chromosome 11 with the Insulin (INS) gene region in red on the chr1(p15.5) segment. (B) Genome browser annotation (UCSC, https://genome.ucsc.edu/ (accessed on 6 December 2022) for a region near INS (hg19-chr11:2,161,620–2,185,936, hg38-chr11:2,140,390–2,164,706, T2T-chr11:2,228,043–2,254,072). This covers the region between Tyrosine Hydroxylase (TH) and Insulin-like growth factor 2 (IGF2). At the top are the chromosome labels for three different human genome releases (hg19, hg38, and T2T). Below are known splicing isoforms of GENCODE, conservation (blue peaks represent conserved regions), various regulation datasets, known human variants, and the Roadmap Epigenomics 18-state genome annotation of several tissues, with pancreatic islets shown at the bottom. (C) Zoomed-in view of INS marked in cyan on Panel B (hg19-chr11:2,176,237–2,182,988, hg38-chr11:2,155,007–2,161,758, T2T-chr11:2,242,655–2,251,112). Shown are known Genome-Wide Association Study (GWAS) loci for biological traits with diabetes-connected SNPs in red, known expression quantitative trait loci (eQTLs) from GTEx, known human variants from various databases, known regulation sites, and conserved transcription factor binding sites (TFBS). All panel colors from the UCSC genome browser extractions can be found within track information within the browser, as we have used default color schemes from UCSC.
Therefore, we further zoomed into the INS islet regulation region (hg19-chr11:2,176,237–2,182,988) to extract functional genetic variants (Figure 1C). Several GWAS loci were found in this region for T1D (rs3842753, rs689), T2D (rs3842770, rs571342427), severe autoimmune type 2 diabetes (rs3842753), glucose levels (rs3842753, rs3842752), and IGF1 levels (rs3842752) based on the GWAS catalog (Figure 1C, red text) [8,50,51,52,53,54,55,56,57,58,59,60]. It is somewhat surprising, however, that no variants were connected to INS expression levels within this region through the expression of quantitative trait loci (eQTLs). The eQTL strategy links common variants to the dysregulation of transcription within the GTEx consortium [61]. Variants in this region were only associated with altered TH expression (Figure 1C, eQTLs), which is likely due to the underpowered pancreas dataset of GTEx that prevents INS eQTL mapping.
We extracted genomic variants for the entire region of Figure 1C (hg19 chr11: chr11:2,176,237–2,182,988) from multiple sources, including the dbSNP database of common alleles [62], gnomAD genomes database of diverse genomes [32], Avada literature-extracted variants [63], ClinVar database of clinical rare disease genomes [64], and UniProt protein annotated variants [65]. The gnomAD allele frequency for different population backgrounds of these variants is available at https://doi.org/10.6084/m9.figshare.21917124.v1 (accessed on 6 December 2022). All variants were processed for transcription factor binding site (TFBS) alterations, transcript alterations, and protein changes.
2.2. Variants near INS with Genome-Wide Association Traits
The rs689 variant (https://genetics.opentargets.org/variant/11_2160994_A_T (accessed on 6 December 2022) is the most significant variant from GWAS for T1D [6,7,8,66,67] and is associated with latent autoimmune diabetes in adults [68,69,70] and atypical T2D [71,72]. This variant is highly associated with the development of islet autoantibodies to insulin, likely contributing to the initial development of T1D [73,74,75,76]. The variant is associated with B-cell anergy alteration [77]. However, it is not significantly associated with alterations in regulator T-cells [78].
rs689 was found in linkage disequilibrium with most of the T1D GWAS catalog variants found near INS (Figure 2A), including the highly correlated rs3842753 (R2 of 1) and rs3842727 (R2 of 0.89). The p-values of rs3842727 for various traits were far below that of rs689, suggesting that rs3842727 is not the lead SNP for functionality. However, the p-values of rs3842753 and rs689 for various traits were highly similar, with subtly more significance in rs689 for traits (Figure 2B,C). Outside of T1D, rs689/rs3842753 is associated with insulin-like growth factor 1 levels (IGF-1) [79,80], paternally inherited IGF-2 levels at birth [81], age of diagnosis for T1D [82], starting insulin within one year of diagnosis [83], size at birth [84], hemoglobin A1c levels [79], blood glucose levels [79], and the age at which diabetes was diagnosed [83].
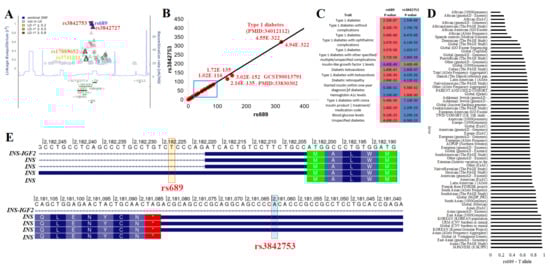
Figure 2.
Top LD block for insulin and diabetes. (A) Linkage disequilibrium map of rs689, with other T1D associated SNPs labeled. Those in red have >0.8 R2 with rs689, orange, >0.5 R2, and yellow, >0.2 R2. Shown below is the location of genes with green lines representing the gene location. The blue line represents the recombination rates across the region. (B) Open Target Genetics extracted −log10 p-values from various associations for rs689 (x-axis) relative to rs3842753. The black line shows a 1-to-1 relationship. (C) p-values are shown for various traits in the Panel B cyan box for both SNPs. The more significant values are shown in red. (D) The rs689 T allele frequency from various genomic datasets ranked from lowest to most frequent. (E) The genomic location (hg19) for rs689 and rs3842753 relative to transcripts of INS. Amino acids are labeled in boxes, the UTRs are represented as blue lines, and the intron segments are represented with arrowed lines.
These two variants are found throughout all populations but show enrichment within Japanese, Asian, Vietnamese, Korean, and South Asian populations, with the lowest levels observed in African/African American populations (Figure 2D). Both variants fall at potentially functional locations. rs689 was found within the 5′UnTranslated Region (5′UTR) of one INS transcript and near the 5′UTR splice site of the rest of the transcripts (Figure 2E). In silico and biochemical assays have suggested that the change does result in ex vivo splicing changes by the U2 small nuclear ribonucleoprotein [85,86,87], yet to the best of our knowledge, this has not been observed within human samples. rs3842753 was found within the 3′UTR for most of the INS transcripts (Figure 2E). We performed additional data analysis with various tools to further add annotation to this and all other INS variants.
2.3. Variants near INS from Genomic Databases
Around the INS gene are 2076 unique gnomAD variants from 76,156 genome sequences of humans with diverse population backgrounds [32]. Each of these variants was run through the Variant Effect Predictor (VEP) [88] for annotations of transcripts and regulation (Figure 3A,B). The allele count of variants is highly variable, with 30 unique variants found with >1000 allele counts in gnomAD and 6134 unique annotations from VEP (Figure 3A). Each variant can have multiple annotations due to the multiple transcripts of INS and INS–IGF2. Of VEP annotations, 61.4% were downstream of a transcript, 15.9% were upstream of a transcript, 10.5% were within introns, 4.7% were within noncoding transcripts, 3.5% were within regulatory regions, 1.1% were missense, 1.1% were 5′UTR, 0.6% were synonymous within a transcript, and 0.5% were 3′UTR (Figure 3B). In addition to gnomAD, we also addressed the outcomes of variants from ClinVar (pathogenic variants are in red, likely pathogenic variants are in orange, and variants of uncertain significance (VUS) are in gray), UniProt (cyan), and Avada (magenta), with the majority resulting in missense changes (Figure 3C).
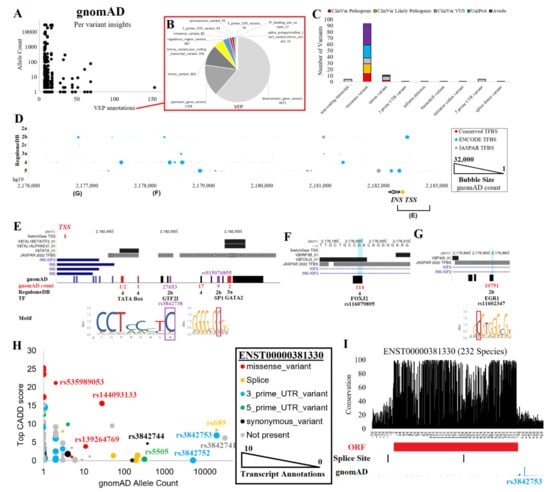
Figure 3.
INS variants. (A) gnomAD variants for the region shown in Figure 1C. The x-axis shows the number of VEP annotations for each unique variant, and the y-axis shows the gnomAD allele count. (B) The red box calls out the breakdown of VEP annotations over all variants. (C) Unique variant annotations for ClinVar, UniProt, and Avada. (D) Noncoding variant annotations. The x-axis shows the genome coordinates (hg19), the y-axis shows the RegulomeDB score, and the bubble size represents the gnomAD count. Red dots denote those within a conserved transcription factor binding site (TFBS), cyan dots for those within a known ENCODE ChIP-Seq binding event, and gray dots for those within a JASPAR-predicted TFBS. Below is the INS transcriptional start site (TSS) and two regions covered in Panels E-G. (E) Annotation of variants within the promoter of INS. The TSS is shown in red. Conserved TFBS and JASPAR are shown above INS transcripts. On the bottom are the gnomAD variant counts for RegulomeDB predictions or for those that fall within a conserved TFBS. (F) A downstream enhancer site with rs116079895 that is predicted to alter a FOXJ2 conserved TFBS. (G) A downstream enhancer site with rs11602347 predicted using RegulomeDB to alter an EGR1 binding site. (H) Transcript annotations from VEP. Colors represent the labeled ENST00000381330 annotations, the primary INS transcript. The INS transcript annotations found outside of ENST00000381330 are in gray. The x-axis shows the gnomAD allele count, the y-axis shows the top CADD score for functionality, and the bubble size shows the number of transcript annotations for each variant. (I) Conservation of 232 species transcripts for ENST00000381330 at the RNA base level. Below are the open reading frame (ORF), transcript splice sites, and gnomAD allele counts.
To annotate noncoding variants, we utilized various datasets of gene regulation, including conserved TFBS [89], ENCODE transcription factor binding sites [90], JASPAR transcription factor binding profiles [91], and RegulomeDB [92]. These metrics were plotted relative to genome location and gnomAD allele counts (Figure 3D). The RegulomeDB variants of 2a and 2b fall within potential TFBS that overlap foot-printing assays of gene regulation and within gene regulation sites of the Roadmap Epigenomics initiative [45], and they are likely to impact transcriptional regulation. Those within conserved TFBS likely impact critical binding events for gene regulation. Addressing these two groups, several variants were found near the TSS of INS (Figure 3E) or within two downstream regulation sites (Figure 3F–G).
The INS TSS region contained both common and rare variants from gnomAD (Figure 3E). The most common variant within the TSS, rs3842738, had a gnomAD allele count of 27,653 and was found in all populations. The variant has a weak significant association with ubiquitin carboxyl-terminal hydrolase 8 levels [93]. The variant rs3842738 had a RegulomeDB score of 2b, falling within a GTF2I binding site and active TSS within endocrine pancreas tissue. Other RegulomeDB-found potentially impactive variants include rs915076855 (nine allele count, SP1 binding site) and rs1262751704 (two allele count, GATA2 in conserved TFBS), both of which are rare. Three rare variants of gnomAD fell within conserved TFBS, including rs1157485249, rs557938186, and rs1456326746 within the TATA box region. The TATA box is a critical activation component bound by the TATA box binding protein (TBP) near a TSS that regulates the recruitment of polymerases for active transcription [94,95]. The conservation of this TATA box and rare variants raises questions about whether variants such as these could result in T1D or T2D due to heterozygous decreased/increased expression of INS. Accurately understanding gene regulation and rare variants’ influences on INS or other genes is one of the most critical future research needs.
Other rare variants of possible regulation can be found outside of the TSS. For example, a downstream regulation region contained conserved TFBS for HNF3B and forkhead transcription factors (Figure 3F), which are critical for islet and pancreas development [96,97]. Within this region is the African/African American-enriched variant rs116079895. Another downstream regulation region contains a conserved P300 TFBS and a variant rs11602347, which has a RegulomeDB score of 2b (Figure 3G). The variant overlaps ChiP-Seq peaks for both TAF15 and EGR1, falling within the footprint motif of EGR1. While EGR1 is well known to modulate insulin effects on various metabolic/endocrine cells [98], EGR1 can modify INS expression levels [99]. Various environmental factors, such as the hepatitis C virus, were shown to activate IGF2 by modulating EGR1 regulation [100]. As the rs11602347 variant falls between INS and IGF2, this is an interesting potential EGR1 regulation site requiring further wet lab analysis. The variant is found in all population backgrounds and is significantly associated with serum 25-hydroxyvitamin D levels [101] and T1D [6,7,8], despite having only 0.27 R2 with rs689.
Next, we addressed the role of gnomAD variants that fell within INS or INS–IGF2 transcripts using the VEP-generated CADD scores (Figure 3H), which integrate multiple datasets to calculate a variant’s deleteriousness [102]. The ENST00000381330 transcript was the primary INS transcript and had 48 variants annotated to it, including missense, splicing, 3′UTR, 5′UTR, and synonymous variants (Figure 3I). An additional 226 variants were annotated to other INS or INS–IGF2 transcripts. The rs689 variant was found at a splice site of ENST00000381330 and within a 5′UTR of ENSG00000254647. rs3842741 was also found in the 5′UTR of ENSG00000254647. The high R2 SNP to rs689, rs3842753, and the closely located rs3842752 were found in the 3′UTR of ENST00000381330. The variant rs5505 was found in the 5′UTR of ENST00000381330 and is enriched within non-Finnish Europeans but has no known trait associations. Three rare missense variants were observed within ENST00000381330, including rs144093133 (p.G75D, CADD 15.63, 28 allele counts in African/African Americans), rs139264769 (p.S76N, CADD 3.89, 11 allele counts in African/African Americans), and rs535989053 (p.A2T, CADD 21.2, 2 allele counts in East Asians). We next turned to the analysis of RNAseq reads for INS expression levels and their correlation to common variants.
2.4. INS Transcripts and Splicing
We started by analyzing 17,382 human samples of 54 tissues of GTEx [61] for INS, INS–IGF2, and INSR (the Insulin Receptor). GTEx contains tissue RNAseq collected from relatively healthy individuals who often had lethal-based trauma and donated their samples to science. INS transcripts were relatively unique to the pancreas, whereas INS–IGF2 was expressed in the pancreas and the liver (Figure 4A). INSR was expressed in all tissues with elevation in spleen and ovary samples.
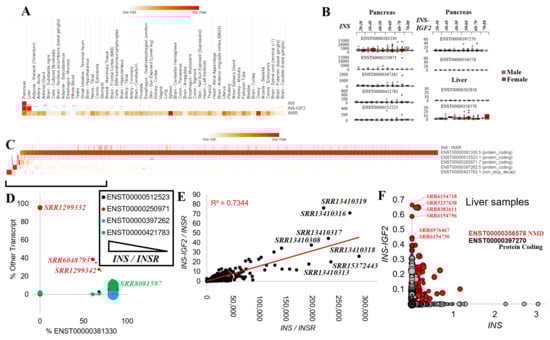
Figure 4.
Expression of Insulin (INS) in public datasets. (A) GTEx average expression of INS, INS–IGF2, and INSR over various tissues. The heat map shows the max expression of each gene in red. (B) Box and whisker plots for the various INS (left) or INS–IGF2 (right) transcripts in the pancreas and liver relative to each age group of samples. Male samples are shown in gray, and female samples are shown in red. (C) Heat map of INS/INSR ratio and each of the five transcripts of INS for 1360 “Pancreas”, “Islets”, or “Langerhans” human RNAseq samples. Values for INS represent the percent of total INS levels for each transcript. (D) Individual sample breakdown from Panel C for those with <90% of the transcript abundance for ENST00000381330 (x-axis) shown relative to the other transcripts. The size of the bubble represents the total INS/INSR levels. (E) Normalized values for INS (x-axis) and INS–IGF2 (y-axis) relative to INSR for various pancreas RNAseq BioProjects. The red line is the best-fit trendline with the R2 shown. (F) The expression of INS and INS-IFG2 in transcripts per million from 1901 “liver” or “hepatocyte” human RNAseq samples. The red transcripts are those of INS–IGF2 ENST00000356578. The size of the bubble represents the expression of Albumin (ALB), a marker of hepatocytes.
There were five INS, two INS–IGF2, and seven INSR transcripts. ENST00000381330 (INS-202) was the highest expressed INS transcript and coded for a 110 amino acid protein. ENST00000397262 (INS-203) and ENST00000250971 (INS-201) also coded for the 110 amino acid protein but had 5′UTR alterations. Transcript ENST00000512523 (INS-204) had an early termination that resulted in a 98 amino acid protein. ENST00000421783 (INS-205) utilized alternative splicing within the ORF of INS, resulting in a frameshift of protein sequence, and is predicted to result in non-stop decay, a process where transcripts are degraded because they lack a stop codon [103]. INS–IGF2 had two known transcripts: ENST00000397270 (INS–IGF2-202, 828 nucleotides), which coded for a 200 amino acid protein and ENST00000356578 (INS–IGF2-201, 1706 nucleotides), which also coded for the 200 amino acid protein but with multiple spliced 3′UTR exons, which is predicted to be degraded by nonsense-mediated decay (NMD).
Each of the five INS and two INS–IGF2 transcripts were processed for GTEx pancreas expression (328 samples), breaking down the distribution of expression between male and female patients of various age groups (Figure 4B). The INS ENST00000381330 transcript showed the highest levels, balanced over all age groups and between sexes. It should be noted that the number of outliers increased with the age of the patients from whom the samples originated. The four other INS transcripts had far lower expression while also showing the presence of a few samples with outlier levels. The INS–IGF2 ENST00000397270 was identified within the pancreas, whereas the NMD-regulated longer ENST00000356578 showed expression in the liver (Figure 4B).
To expand these insights further, we explored the expression of INS and INS–IGF2 in RNAseq datasets of the pancreas and liver deposited into the NCBI SRA database. There were 22 BioProjects containing 816 samples with INS expression (Table 1). Of the INS transcripts, ENST00000381330 was broadly expressed, with a few samples having high levels of the other spliced forms of INS (Figure 4C). Those samples with below 90% use of ENST00000381330 for INS and still having a high level of INS normalized to the INSR (Figure 4D) included high uses of ENST00000250971 within sample SRR1299332 (young patient beta cells), SRR6048793 (male, 23-year-old, non-diabetic islets), and SRR1299342 (young patient beta cells). ENST00000421783, the noted transcript for degradation by nonstop decay, was used within sample SRR8081597 (female, 12-year-old, non-diabetic islets). As rare variants associated with neonatal diabetes were identified to induce additional de novo splice alterations [104,105], there is a further need for surveillance within neonatal diabetes for splice-altering INS variants.

Table 1.
BioProjects with INS expression from pancreas.
Individual samples showed a high correlation (R2 = 0.7344, Figure 4E) of the INS and INS–IGF2 transcripts, whereas several samples had a higher-than-expected expression of INS–IGF2. Most of the samples with high INS–IGF2 were from BioProject PRJNA691365, which is an RNAseq of isolated human pancreatic beta-cells. Within the liver samples, INS–IGF2 was elevated within a handful of samples, with noted higher levels of the NMD-regulated transcript (Figure 4F). It is interesting to note that of the top 20 samples with this elevated INS–IGF2 NMD transcript, nine had a hepatitis B/C viral infection (SRR5237638, SRR8382611, SRR8382605, SRR5237640, SRR8382623, SRR5237643, SRR8382602, SRR8382621, SRR8382601).
NMD is a mechanism that degrades transcripts with splice sites within the 3′UTR, preventing the production of proteins that might be damaging to the cell due to nonsense mutations [106,107,108]. The NMD molecular components are regulated by various cellular pathways, such as endoplasmic reticulum (ER) stress and immune activation [109,110]. Within the pancreatic beta-cells, NMD regulation is influenced by inflammatory cytokines and ER stress, resulting in changes to insulin biosynthesis [111].
The NMD process is involved in protecting cells from nonsense mutations and disease states and was shown to be critical for regulating intracellular viruses [112]. Many viruses thus evolve mechanisms to suppress the NMD pathway [113]. Within T1D, growing evidence of viral infections, including enteroviruses, rubella, mumps, rotavirus, parvovirus cytomegalovirus, hepatitis, and the common cold, was associated with the development of beta-cell autoimmunity [114,115,116,117]. Animal models of infection confirmed this association [118]. The engraftment of virally infected beta-cells from one mouse to another confers the risk of T1D [119].
In tissues such as the liver, environmental factors can alter the NMD pathway, resulting in increased transcripts normally degraded by NMD. Their elevation increases the potential for non-alcoholic fatty liver disease, hepatocellular carcinoma, alcoholic liver disease, insulin resistance, and T2D [120,121,122]. The hepatitis C virus (HCV) inhibits the NMD process [123]. What is striking is the relationship between liver disease, diabetes, and HCV, where insulin resistance and signaling are known to be altered [124,125,126]. Nearly one out of three individuals with liver cirrhosis also have diabetes, with the majority suffering from hepatogenous diabetes (HD) [127]. HCV is one of the main factors for developing liver cirrhosis and HD [128,129,130]. HD is distinct from T2D, with normal fasting glucose and beta-cell dysfunction, and it is usually independent of body mass index [131,132,133]. Interestingly, many of the factors of immune alterations that are altered by viral NMD suppression, such as tumor necrosis factor-alpha, are also associated with HCV-induced HD [134]. The observation of such strong associations between the viral regulation of NMD, the viral mechanisms of both T1D and HD, the role of INS–IGF2 in insulin autoantibody production, and the odd INS–IGF2 NMD-regulated transcript expression warrants future investigations.
2.5. Variants within Insulin Transcripts
We developed a list of transcripts with each common variant identified to fall within INS. We identified using the main INS isoform, ENST00000381330, that rs3842753 was the predominant genotype of the RNAseq samples (58%, Figure 5A), followed by rs3842753/rs3842752 (25%), and rs3842753/Wild Type (WT, 7%). In our analysis, we did include a sequence with rs3842753 and rs3842752 in combination, as these are within 14 bases of each other and could be observed together in RNA sequence reads. However, we never saw any RNAseq reads where the two variants were physically connected, suggesting they segregate independently. Bringing each genotype group together with total INS/INSR normalized expression levels showed that samples with the rs3842753 variant were more likely to have outliers of high expression (Figure 5B). Interestingly, of the samples that were compound heterozygous for rs3842753 and rs3842752, there tended to be a higher frequency of rs3842752 within their ENST00000381330 transcripts. However, samples with the highest INS/INSR expressions tended to be closer to 50% variant frequency (Figure 5C).
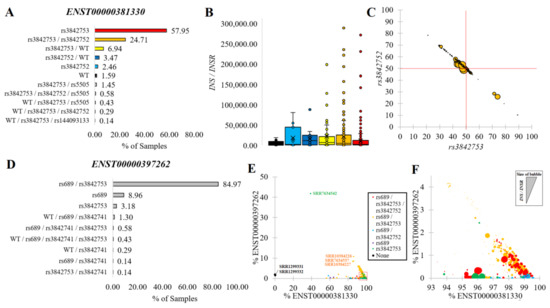
Figure 5.
INS variants within transcripts. (A) The percentage of samples with transcripts annotated with unique and combinations of variants within ENST00000381330. (B) Box and whisker plots for INS/INSR normalized levels for groups as colored in Panel A. (C) The percent of ENST00000381330 reads containing rs3842753 (x-axis) relative to rs3842752 (y-axis) for compound heterozygous samples of rs3842753/rs3842752. The size of the bubble represents the INS/INSR normalized value. The red lines are at the 50% level. (D) The percentage of samples with transcripts annotated combination of variants for ENST00000397262. (E) Combination of Panels (A) and (D) for labeling each sample’s final genotype (colors) relative to the % of total transcripts coming from ENST00000381330 (x-axis) and relative to ENST00000397262 (y-axis). (F) Zoomed-in view of the Panel E red box with the bubble size representing the INS/INSR normalized value.
The rs689 variant in LD with rs3842753 (Figure 2A) was present only in the ENST00000397262 transcript. Surprisingly, 85% of RNAseq samples had the combination of both variants (rs689/rs3842753) in this transcript (Figure 5D), suggesting the isoform is primarily coded only when variants are present. Those samples where the expression of ENST00000397262 was high relative to ENST00000381330 had the presence of both rs689/rs3842753 (red and orange, Figure 5E,F). This suggests that due to the high penetrance of signal in RNAseq, the alteration of the 5′UTR splicing change of ENST00000397262 was likely the result of rs689.
2.6. Insulin Signal Peptide Missense Variants
Synthesis of the insulin protein starts with the initiation of translation of an mRNA encoding preproinsulin, with many factors impacting this process and increasing the risk of disease [135]. INS transcripts engage with the ribosome to make a 110 amino acid protein. This protein is composed of the signal peptide, B-chain, C-chain, and A-chain in which all of these regions have conserved amino acids and known missense variants (Figure 6A). To aid in interpreting these variants, we assessed the PDB for structures of insulin, where there are a few structures of proinsulin and many structures of mature insulin consisting of the A- and B-chains (Figure 6B).
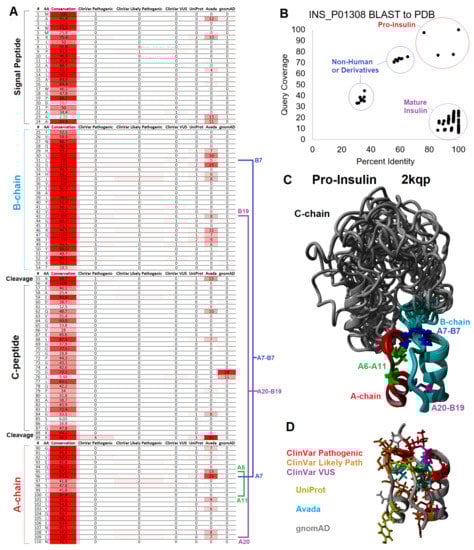
Figure 6.
Mapping of variants to insulin structure. (A) Table of conservation and missense variants from ClinVar, UniProt, Avada, and gnomAD impacting the preproinsulin molecule listed by amino acid. Cystines involved in disulfide bonding are marked in blue (A7-B7), magenta (A20-B19), and green (A6-A11) with labeling for A- and B-chain numbering. (B) BLAST analysis of sequences within the PDB similar to human preproinsulin (UniProt O01308) with the percent identity of the sequence from the structure shown on the x-axis and the coverage of sequence on the y-axis. (C) Structure models of human proinsulin from PDB file 2kqp showing the aligned top twenty models. The B-chain is colored cyan, C-chain in gray, A-chain in red, and disulfide bonds as colored in Panel A. (D) The A- and B-chain are the same orientation as Panel C but colored for human variants, where red represents ClinVar variants identified as pathogenic, orange represents ClinVar variants identified as likely pathogenic, magenta represents ClinVar variants of uncertain significance (VUS), yellow represents UniProt-annotated variants, cyan represents Avada-annotated variants, and gray represents gnomAD-observed variants.
The first 24 amino acids coded for a signal peptide that is critical for incorporating insulin into the rough ER for the secretory pathway of exocytosis [136]. There are no structures of the signal peptide for full preproinsulin within a lipid membrane. Thus, the interpretation of clinical variants relies on knowledge of signal peptide biology. The signal peptide was formed by multiple conserved hydrophobic amino acids (MALWMRLLPLLALLALWGPDPAAA, Figure 6A). Once protein synthesis is started on a ribosome, the signal peptide can be inserted within a lipid bilayer of the rough ER [137]. These hydrophobic amino acids, when altered, can result in neonatal/monogenic or early-onset diabetes. These include ClinVar-identified pathogenic and likely pathogenic variants at R6, P9, and A24, with additional literature annotated leucine amino acid 13 changed to arginine (L13R) [138].
The insertion of preproinsulin into the lipid membrane of the ER can be accomplished in two ways: cotranslational translocation, in which the signal peptide synthesis by the ribosome drives membrane insertion, or posttranslational translocation, where translocons guide the fully synthesized signal peptide into the membrane [139]. Most signal peptides rely on the signal recognition particle (SRP) complex, which binds the signal peptide and couples the complex to a translocon [140]. The insulin signal peptide alone appears to have weak gating potential. It requires translocon assistance driven by the translocon-associated protein (TRAP) complex, which requires multiple prolines of the insulin signal peptide [141]. The deletion of TRAP components from organisms results in the disruption of insulin biosynthesis [142]. HSP70 and several other cochaperones interact to prevent the aggregation of cytosolic peptides waiting for translocation into the ER [143]. Once engaged with the SRP or TRAP complex, the peptide must be inserted into the ER via post-translation translocation [139]. The conserved polar basic arginine (R6) of preproinsulin is required to engage with the ER translocon SEC61 that assists in the signal peptide insertion within the lipid membrane [139]. Arginine mutations to cysteine or histidine at amino acid six are associated with neonatal or early-onset diabetes [144,145].
With many genes involved in ribosome engagement, the association of the signal peptide to the rough ER, translocation of the signal peptide, continued ribosomal synthesis, termination of ribosomal synthesis, and folding within the ER, it is logical that variants within many of these genes of the pancreatic beta-cells could be associated with diabetes. Not only can genetic variants impact this process, but the health of the ER can also be associated with dysfunction of insulin synthesis. More research is needed to understand preproinsulin of the ER in healthy versus diseased beta cells and how additional variants may impact this process [146].
2.7. Insulin Structural Missense Variants
After incorporating the signal peptide into the lipid membrane, the preproinsulin is fully synthesized by the ribosome. This ER membrane-bound protein can then fold and be processed. While a large portion of newly synthesized proteins are degraded within cells, insulin within the beta-cells is very efficiently produced with prevented degradation [147], suggesting the existence of some critical ER processes for protein protection with unknown roles of genetic variants on this process. Within the protein sequence of insulin, there is evidence of conservation regarding foldability, successful post-translational modifications, the formation of dimer/hexamer storage units, and successful activation of the insulin receptor (Figure 6, Figure 7 and Figure 8) [139,148].
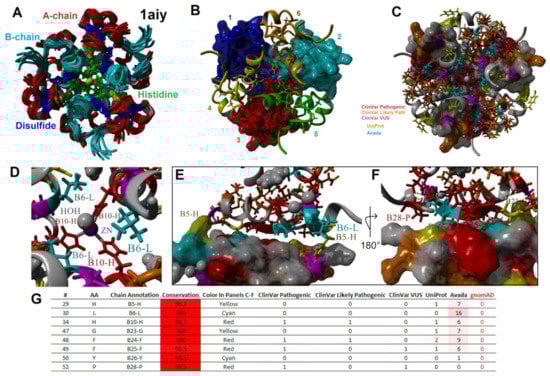
Figure 7.
Mapping variants to the multimeric state of insulin. (A–C) The PDB file 1aiy shown in the same orientation but colored various ways. Panel A shows the A-chain in red, B-chain in cyan, disulfide bonds in blue, histidine in green, and zinc in magenta for the top ten predicted models of the NMR structure. Panel B shows the top model of Panel A for the six different insulin molecules (both A- and B-chains) in different colors, with the first zinc coordination site molecules shown as surface plots and the other zinc sites as ribbon plots. Panel C uses the same coloring as Figure 6D for human variants. (D) A zoomed view of one Zn coordination site using the coloring of Panel C for human variants. Labeled residues are those that make contact between multiple subunits. (E,F) Zoomed view of contact residues between different insulin molecules. Labeled amino acids have a human variant. Panel F is a 180-degree rotation of Panel E. (G) Table of missense variants forming contacts within the hexamer subunits.
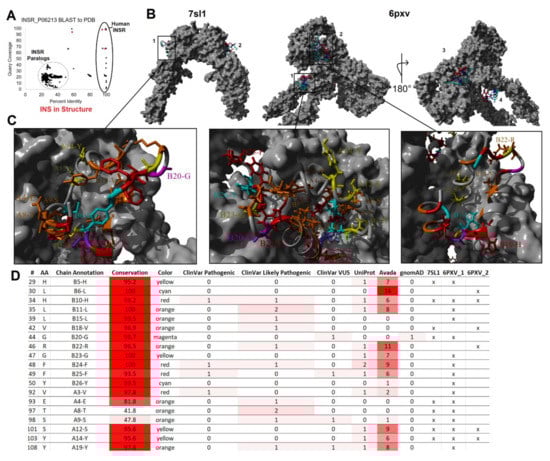
Figure 8.
Mapping variants to insulin and insulin receptor interaction. (A) BLAST analysis of sequences within the PDB similar to human insulin receptor (UniProt P06213) with the percent identity of the sequence from the structure shown on the x-axis and the coverage of sequence on the y-axis. Spots in red are present in Figure 6B, meaning they represent insulin and insulin receptor interactions. (B) The model of the full insulin receptor (gray) from PBD files 7sl1 and 6pxv. Insulin is colored with A-chain in red and B-chain in cyan with two insulin bound for 7sl1 and four for 6pxv. (C) Zoomed-in view of insulin docking with the receptor as called out in Panel B. Coloring of insulin is based on Figure 6D. (D) Table of insulin missense variants that form contacts from one of the three binding states of Panel C. The last three columns label the structures that contacts are found for insulin receptor with an x.
Three disulfide bonds maintain insulin’s structure [149] where variants of 3/6 cysteines are found pathogenic or likely pathogenic within ClinVar for neonatal diabetes (C43G-VCV000021114.5, C96S-VCV000068730.1, C96Y-VCV000013387.6, C96R-VCV000918067.1, C109F-VCV001526011.1). All four cysteine amino acids involved in inter-chain disulfide bonds are known to be involved in monogenic diabetes based on the literature [145]. The formation of these bonds and, thus, the folding of insulin requires specific environments within the pancreatic beta-cells and their organelles [150]. Significant post-translational processing is needed with organelle-specific steps and stages of insulin trafficking [136]. The successful folding of ER-bound preproinsulin requires oxidoreductases and chaperone proteins to prevent disulfide-linked aggregate formation. The cytosolic processing of insulin due to truncation of the signal peptide results in a lack of proper disulfide bond formation and folding [151].
The ER-folded protein must then be trafficked through the Golgi apparatus and processed to mature insulin. The preproinsulin is found in the lumen of the rough ER, where signal peptidases cleave the signal peptide at amino acid 25 [152]. The timing of folding and cleavage relative to relocalization from the ER to the Golgi is rather complex, where variants that impact folding can result in retention within the ER [153]. Variants at amino acid 23 of the signal peptide, such as A23S, do not disrupt cleavage. The more conserved amino acid 24 with a changed S24D inhibits cleavage and results in ER retention [154]. Changes to amino acid 24 were associated with autosomal-dominant neonatal/monogenic diabetes [9,154,155,156]. A24D is one of three variants that accounts for 46% of cases of neonatal diabetes [145], with the advanced progression of secondary complications, including brain lesions [157].
Proinsulin consists of 3 chains: the B-chain (amino acids 25–54) that folds together with the A-chain (amino acids 90–110), both of which are connected by the C-chain (amino acids 57–87). The A- and B-chains have high conservation, whereas the C-chain is more divergent throughout vertebrate species (Figure 6A). Of the C-chain segments, only the known cleavage sites show high conservation (>95% across vertebrate species), suggesting that much of the folding dynamics of the proinsulin are driven by A- and B-chains, where the C-chain serves a role in tethering the intramolecular collapse. From NMR studies of proinsulin, model confidence suggests well-ordered A- and B-chains with less determinability of amino acid locations within the C-chain (Figure 6C), potentially indicative of C-chain disorder [158].
As with most proteins, hydrophobic collapse drives the initial seeding of the proinsulin structure through a complex, driven folding landscape [159,160]. Most importantly, several aromatic residues provide initial stable states for proinsulin folding [161]. These hydrophobic and aromatic residues within the core of the A- and B-chains include F49 and Y50 of the B-chain (B25 and B26 using chain numbers) and I91, V92, I99, L102, L105, and Y108 of the A-chain (A2, A3, A10, A13, A16, and A19). Most of these residues have vertebrate conservation >95% (Figure 6A). The F49L, V92L, and Y108C are known pathogenic or likely pathogenic variants for monogenic/neonatal diabetes [145,162,163,164,165] that fall in the core of mature insulin (Figure 6D).
2.8. Insulin Maturation, Storage, Secretion, and Receptor Activation Variants
Once the signal peptide has been cleaved within the ER, the protein continues folding into storage and secretion conformations. The folding of proinsulin appears to be a significant challenge for pancreatic beta-cells, with multiple environmental factors such as chronic ER stress influencing folding and resulting in the degradation of proinsulin [166,167,168]. One of the primary impairments of proinsulin folding is the formation of intramolecular disulfide alternative pairing, often through forming A6/A11 with A7/B7 mispairings, resulting in aggregated fibrils [169,170]. Thus, the regulation and formation of the intramolecular disulfide bonds are critical for insulin biosynthesis, yet the role of other missense variants altering this regulation is under-studied.
Folded proinsulin forms a noncovalent homodimer structure and is transported from the ER to the Golgi complex, where it is packaged into secretory granules for maturation [136,171]. The insulin dimer is stabilized in part by an aromatic triplet consisting of residues F48, F49, and Y50 (B24–B26) [172,173]. The homodimer utilizes amino acids F48, F49, and Y50 of the B-chain (B24–B26) [174], which forms a beta-sheet that hydrogen bonds between the monomers [175]. Two of these sites (F48, F49) are known to have variants associated with pathogenic monogenic diabetes (Figure 6A), with F48C being one of the three most common insulin variants in neonatal diabetes [145]. The Y50 (B26) was also shown to interact with the insulin receptor. Alteration of Y50 revealed that the conservation of the aromatic triplet is linked to dimer (and higher order hexamer) formation and receptor activation [172,176].
Following proinsulin transport to the Golgi complex, the C-peptide is cleaved to produce mature insulin. Not all proinsulin in the secretory granules is processed to remove the C-peptide, with multiple environmental factors such as inflammation influencing the balance of proinsulin to insulin [177,178,179]. Removal of the C-peptide within the Golgi complex and the secretory granules occurs at sites of basic amino acids (R55, R56, K88, R89) and involves different Ca-dependent endoproteases [180,181,182]. The cleavage of the B- to C-chains is more pH-sensitive than that of the C- to A-chain cleavage [183]. All four basic residues are highly conserved, with R55 and R89 having known pathogenic variants (Figure 6A) for familial hyper-insulinemia and neonatal diabetes [145,184,185]. The R89C is amongst the three most common causes of neonatal diabetes [145].
Insulin is organized into crystalline state regions within secretory granules, whereas the C-peptide is found in the surrounding fluid [186]. The ZnT8 and SLC30A8 transporters found within the granules are involved in the transport and accumulation of intra-granule Zn [187]. This high Zn concertation transforms the insulin dimers into hexamer structures through H34 (B10) histidine coordination (Figure 7), resulting in the crystalline state [175]. Hexamers are formed from a trimer of dimers coordinated around two Zn+2 ions (Figure 7A,B) [188]. The additional presence of other molecules, such as chloride and phenol, can impact the allosteric structure of the hexamer [189]. The mapping of variants to the hexamer structure (Figure 7C) [190] showed the H34 (B10) amino acid variant as well as H34D, which is associated with neonatal diabetes [163,165], to fall on the Zn binding site (Figure 7D). Additional residues with known disease variants that fall within hexamer structure contacts (Figure 7E–G) include H29, L30, G47, F48, F49, Y50, and P52 (B5, B6, B23, B24, B25, B26, and B28). Following the release within the blood, the Zn level is far lower and prevents the continued hexamer complex.
The around three-hour maturation process [180] of insulin containing secretory granules finishes with docking near the plasma membrane [191]. The beta-cells are stimulated for granule release by various dietary components, notably glucose, with multiple components of the pathway possible targets of the genetic etiology of diabetes [192]. Secretion is altered by amino acid, lipid, and incretin hormones [193]. Insulin-containing granule release also results in the release of other endocrine regulators, including the processed C-peptide, amyloid polypeptide, IGF2, secretogranins, GABA, and ATP [194].
Circulating insulin is found as a monomer without known carrier proteins. Unlike IGF-1, which is regulated in the blood by IGFBPs, insulin diverges in sequence to not interact with these circulating carrier proteins [195,196]. Once circulating, insulin can bind to the insulin receptor expressed in nearly every tissue and cell (Figure 4A). Similar to the insulin structure, the hydrophobic and beta-sheet segments are involved in receptor binding [197]; however, multiple conformations of binding were observed in two different receptor binding sites [198,199,200,201] (Figure 8). Recent advances in cryo-EM and crystallography have allowed the nearly complete human insulin receptor structure to be solved with insulin binding, as seen from the BLAST of the PDB (Figure 8A). The dimeric insulin receptor, upon binding, undergoes an allosteric alteration to activate the intracellular tyrosine kinase [202]. Mapping the variants from our screen to the binding sites of two different solved full receptor and insulin interactions (Figure 8B) showed potential for diabetes-associated variants at amino acids H29, L30, H34, L35, L39, V42, G44, R46, G47, F48, F49, Y50, V92, E93, T97, S98, S101, Y103, and Y108 (Figure 8C,D). Variation within the insulin receptor and autoantibodies to the receptor can also result in insulin resistance [203,204,205,206], requiring further work from the receptor perspective.
Insulin is cleared from the blood through receptor binding, liver degradation, and kidney filtration [207,208]. The hepatic pathway clears an estimated 50–80% of circulating insulin with enzymes such as CEACAM1 [209,210]. Within the kidney, following glucose-stimulated elevation, insulin can be filtered at higher rates with increased urine abundance [211]. The exogenous delivery of insulin also results in increased urine protein levels [212]. Alterations to many of these clearance pathways can impact diabetic risk [213,214,215,216]. Within the kidney, there is a high correlation between insulin resistance and glomerular filtration rates during chronic kidney disease [217,218]. The role of insulin variants on clearance pathways has not been explored in depth.
C-peptide is equally secreted with insulin [219]. Secreted C-peptide was shown to possess neuroprotective [220] and renal-protective functions [221], suggesting that it is not inert but has endocrine properties [222]. The C-peptide has an insulin-independent activation of surface G-protein-coupled receptors [223]. Exogenous delivery of proinsulin has some elevated hepatic localization and adverse clinical effects [224]. While the C-chain displays weak selection (Figure 6A), several amino acids are highly conserved, including E59, L68, G75, L77, and E83. These amino acids could be critical to proinsulin processing and folding [225], or they could be involved in some unknown role of secreted C-peptide. The G75D variant (rs144093133) is the most common gnomAD missense variant within the INS gene to have predicted detrimental function (Figure 3H). It results in the addition of polar acidic amino acid, is found to be heterozygous in 0.2% of African/African American individuals, and has an odds ratio of 17 for type 2 diabetes [226], suggesting variants within the C-peptide are vastly under-studied.
As insulin is very difficult to measure in the blood, the C-peptide is commonly used to measure, as a proxy, blood insulin levels [227]. Measurement of the C-peptide has shown utility in understanding the clinical progression of diabetes and measuring endogenous insulin production in patients with exogenous insulin treatment [228,229]. As the C-peptide is usually measured through immunoreactivity or mass spectrometry [230,231,232], amino acid changes could impede accurate measurements. The change of the inert glycine at amino acid 75 to the acidic aspartic acid should significantly impact the antibody binding of immunoreactivity while also resulting in peak shifting in mass spec. The diversity of antibody sources is highly correlated with the diversity of C-peptide measurements [233]. We speculate that rare variants of the C-peptide remain one of the most underappreciated components of insulin biology.
Generally, in the healthy state of pancreatic beta cells, the maturation of proinsulin is complete before secretion. In some states of disease and beta-cell dysfunction, proinsulin secretion increases [234]. Proinsulin has a significantly longer half-life in blood relative to insulin due to decreased hepatic clearance [235,236]. Like insulin, proinsulin can also bind to the insulin receptor. However, in healthy states, it represents a small portion of the ligand–receptor complex [237] and binds with a 100-fold lower affinity [238,239]. However, the alternatively spliced insulin receptor found in fetal tissue and cancer cells has a higher affinity for proinsulin [240]. This receptor isoform is similarly bound by IGF-2 [241] and involved in embryonic regulation [242], which suggests the secreted proinsulin may play a role in development, such as that of the pancreas. When considered with this view, a seemingly insignificant C-chain mutation could result in a differentiation trajectory change during embryonic development, potentially causing a predisposition to disease before an individual is born.
2.9. Animal Models and Insulin Gene Duplication
Model organisms have provided insights into insulin biology and diabetes, with multiple reviews published on this topic [243,244,245,246]. From a genomics perspective of these models, the genome duplication of insulin within mouse, rat, and zebrafish is striking. Most functional amino acids with variants discussed are found within both insulin copies of these species (Figure 9). Within mice, the knockout of either insulin gene (Ins1-NP_032412, Ins2-NP_032413) can influence signaling and diabetic progression [247], with the Ins2 gene knockout more critical for age-dependent hyper insulinemia and T1D [248]. Within the rat, the two insulin copies (Ins1-NP_062002, Ins2-NP_062003) have similar functions [249], but differences in the 5′ flanking sequence impact expression of the two genes [250]. Within zebrafish, the two insulin copies (ins-NP_571131, insb-NP_001034153) were suggested to play a role in glucose homeostasis, with ins found expressed within the pancreas and insb more broadly [251]. It should be noted that the hexamer important to B10 histidine is changed to a serine in the protein coded by insb (green, Figure 9), suggesting it may be more divergent in pancreatic function than ins.
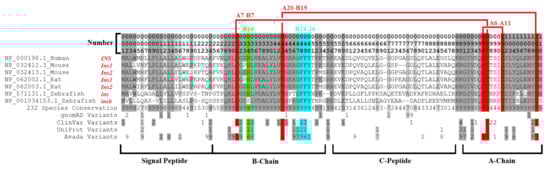
Figure 9.
Compiled insulin alignment data including duplication copies of mouse, rat, and zebrafish. The numbers listed at the top can be read as the first digit representing the hundreds place, followed by the tens, and the last number as the single digit. For conservation and all listed human variants, a value of nine is the highest, representing anything ≥9. The conservation is shown as the percent of 232 vertebrate species, where 9 = 100–90% conserved, 9 = 80–90%, and so on. Conserved sites at 7 or higher are gray, with those 9 in darker gray. Red are disulfide bonds, cyan is the dimer region, and green is the hexamer site.
2.10. INS–IGF2 Protein Sequence
The INS gene is located on the same DNA strand as IGF2, with potential readthrough and splicing joining the two into the INS–IGF2 transcript. Within metabolic endocrinology, INS–IGF2 is not the only known readthrough event. The Endospanin coding gene has readthrough for the leptin receptor, which enhances and broadens the leptin receptor expression profile [252]. While some groups have suggested the readthrough transcript of INS–IGF2 to be an “artifact” with 20,000 times lower expression in beta cells than INS [253], there is strong support that the readthrough is present and functional within the pancreas. Deep human resequencing of RNA has elucidated the transcript to be present in the placenta, liver, pancreas, fat, and ovary [254]. Within the pancreas, targeted analysis shows the persistence of INS–IGF2 even when the INS promoter is inactive [255]. Within pediatric T1D, serum autoantibodies show elevated INS–IGF2 immunoreactivity relative to controls [256]. Terrestrial vertebrates share synteny between the two genes [257]. In rats and mice, Ins2 is syntenic with Igf2 and located proximally to each other, with proteomics revealing rodent fusion proteins [258]. Within the pig, the intergenic segment of these two genes more similarly reflects the human sequence than the rodent [259]. The INS–IGF2 readthrough transcript is annotated in 10 additional species (Ursus americanus-LOC123775522, Puma concolor-LOC112852063, Camelus dromedarius-LOC105106405, Rattus norvegicus-LOC102548568, Ictidomys tridecemlineatus-LOC120889510, Bison bison bison-LOC104987751, Lynx canadensis-LOC115526480, Trichechus manatus latirostris-LOC105755980, Camelus ferus-LOC106729876, and Arvicola amphibius-LOC119800954).
The two human INS–IGF2 transcripts code for the same protein (Figure 10). The resulting protein has a conservation of the insulin signal peptide, B-chain, and the cleavage site between the B-chain and C-chain (Figure 10A). Within the first several amino acids of the C-chain is the alternatively used splice site that creates a unique sequence from the IGF2 5′UTR. Taking 20 bases before and after the splice site nucleotides (underlined, Figure 10A), this sequence is highly unique to humans INS–IGF2 based on BLAST to the Nucleotide Collection (Figure 10B). This uniqueness allows for the use of the sequence within human RNAseq extraction insights, as no other human transcript matches it with this level of statistical cutoffs. We show that samples annotated with high levels of ENST00000397270 based on quasi-alignment have high levels of reads unique to this splice site (Figure 10C). However, samples with elevated NMD-regulated ENST00000356578 tend to have lower levels of unique splice site reads, suggesting that the extended UTR of the transcript enhances the TPM mapping within quasi-aligners. Few pancreatic long-read datasets (PacBio or Nanopore) are available as of 2022, which will be a critical technique in characterizing fusion transcripts such as INS–IGF2.
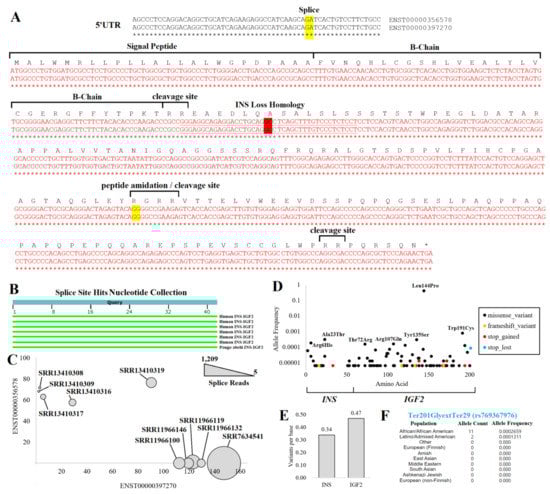
Figure 10.
INS–IGF2 protein insights. (A) Nucleotide to amino acid alignment for the two INS–IGF2 transcripts. Splice sites are highlighted in yellow, with the fusion splice site highlighted in red. The underlined sequence was used for the unique detection of fusion splicing. The nucleotide sequence on top is from ENST00000356578. and the bottom is from ENST00000397270. The INS Loss Homology site is where the INS–IGF2 diverges from INS sequence. (B) Nucleotide collection BLAST hits of the underlined sequence for unique fusion splicing. (C) SRA BLAST hits of fusion splice sites (bubble size) for ten RNAseq samples relative to Salmon-based annotations of each INS–IGF2 transcript. (D) The gnomAD version 3 variants of the fusion transcript show the allele frequency (y-axis) relative to the amino acid location (x-axis) for variants that influence the protein. (E) The probability of unique variants per base found within the protein’s INS or the IGF2 region. (F) Allele frequencies from various populations for the INS–IGF2 loss of stop codon variant.
From the protein sequence, it should be noted that following the splice site between INS and IGF2, there is a large ORF (Figure 10A). This sequence is out of frame from the normal IGF2 ORF, with most of the sequence found within the IGF2 5′UTR. This sequence has no known protein structures or homology to other human proteins. The presence of multiple polar basic, ER-regulated cleavage sites within the IGF2 portion is striking, suggesting cleavage products of the protein if made in the rough ER. As most 5′UTRs are selected for lack of an open reading frame, the remaining protein size seems to be selected to avoid an earlier stop codon.
With so many human genomes sequenced, there would be a high probability of observing missense and nonsense variants within the gene if the fusion protein was nonfunctional. However, according to gnomAD, the frequency of missense variants is 0.01 standard deviations relative to all other genes of the genome, and that of nonsense variants is 0.06, suggesting there is a lack of negative selective pressure within human genomes that maintains the function of the ORF. Only eight ultra-rare (observed 1–2 individuals) frameshift or nonsense variants are seen from 76,125 whole genome sequences, with 6/8 of them located in the IGF2 region (Figure 10D). Of the missense variants, most are also rare. The Leu144Pro change (rs10770125) is found in 62% of Amish and 56% of Finnish European ancestry individuals, whereas only 18% of African American ancestry individuals have the variant. Its association with T1D (https://genetics.opentargets.org/variant/11_2147784_A_G, accessed on 6 December 2022) is likely due to its LD with rs689 (0.22 R2). All other missense variants are below allele frequency for GWAS and, thus, not associated with any known traits. Interestingly, the number of variants per base within the INS and the IGF2 region are not that different (Figure 10E), suggesting that the pressure to maintain insulin amino acids is very similar to the IGF2-coded region of INS–IGF2 protein.
The most surprising variant observed in gnomAD within 13 individuals was the loss of the stop codon for INS–IGF2. This variant results in a stop codon change to glycine resulting in 28 additional amino acids (p.Ter201GlyextTer29, rs769367976). The change occurred in 11 African/African American individuals (Figure 10F), suggesting a major under-explored potential variant of INS–IGF2.
The most challenging area of insulin genetics is understanding noncoding variants that might influence INS readthrough potential. Imprinting is critical to this INS and IGF2 region [260,261,262], with methylation alterations in different cell types [263]. It was suggested that this fusion transcript can have oncogenic properties and is expressed in various cancers [44,264]. This suggests that readthrough and transcript fusion may have an inheritance or environmental regulation. The polymerase must continue unopposed on the DNA for readthrough between the two genes. This means various insulators and transcriptional repression complexes must not be present. How rare variants impact readthrough has never been explored. We show that several regulation sites between INS and IGF2 (Figure 3F,G) have potential variants that influence transcription factor binding. Thus, we anticipate that noncoding variants influencing readthrough may be a promising new avenue for diabetic and metabolic research.
3. Discussion and Future Directions
The American Diabetes Association (ADA) in its consensus report on developing precision medicine guidelines identified being able to define discrete subgroups within diabetes as crucial to developing insights into etiology, prognosis, planning treatment, and monitoring response [265]. As a greater number of individuals are sequenced, more pathogenic variants will be identified. Because next-generation genome sequencing is getting cheaper and faster, there is increased funding from hospitals, coverage from insurance companies, and research organization investments to expand into more diverse individuals. Metabolic health will likely become a significant initiative for understanding genomic etiology by integrating everyone’s genetics with other clinical metrics. Many lessons learned in this review for insulin will apply to other metabolic genes. The role of rare noncoding or transcript processing site (splice and UTR) variants remains one of the most challenging aspects of insulin biology from genome sequencing. Divergent splicing and the resulting proteins remain underexplored, as highlighted here for the importance of INS–IGF2 transcripts in diabetes. Further investments in RNAseq and, more importantly, long-read sequencing strategies (such as PacBio and Nanopore) will continue advancing our knowledge of metabolic transcripts and their expression changes in disease states.
Next, there must be additional investments into understanding the epigenetics of metabolic tissues such as pancreatic islet cells, something we showed is incredibly lacking relative to many other cell types. Advances in the understanding of pancreatic beta cell biology will also lead to the treatment of disease in the future. New tools such as induced pluripotent stem cells might enhance our ability to generate these datasets in healthy and diseased states. Stem cell replacement therapies of beta cells hold promise as a potential cure, but significant technical problems still prevent this treatment from being used clinically [266]. Integrating diverse datasets is necessary to develop a more robust working knowledge of how genetics can influence insulin biology and to effectively understand an individual’s risk of developing diabetes and diabetic complications. As we showed within this article through a review of literature and data, much work is still to be done in defining genetics for one of the most well-studied human genes. These future research needs of insulin reflect the current limitations for nearly every human gene, serving as an example to guide future genetic investments.
The genetics of insulin shows highly penetrant rare variants, common high-risk alleles with lower penetrance, and what appear to be genetic modulators influenced by environmental factors. Variants within one gene can result in monogenic/neonatal diabetes, T1D, insulin resistance, T2D, hepatic diabetes, or glucose signaling alterations. The plasticity of diabetes and diabetic outcomes has remained a critical challenge in endocrinology. The regulation of INS transcription, transcript splicing, transcript regulation (especially by variable UTR regions), translation of preproinsulin, processing/maturation of proinsulin, secretion, receptor binding, and metabolism can all be modified to impact insulin biology (Figure 11). Direct INS variants can differentially influence various portions of these pathways, resulting in diverse phenotypes depending on where/how the variant changes molecular biology.
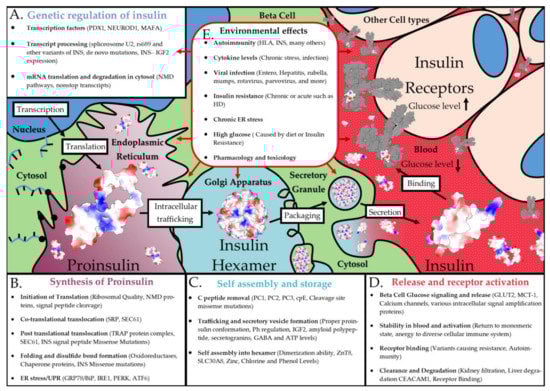
Figure 11.
Environmental effects on the synthesis of insulin. Shown are factors involved in INS transcriptional regulation (A), proinsulin synthesis (B), insulin assembly/storage (C), and insulin release/receptor activation (D). This is shown overtop of an artistic rendering of the complex insulin biosynthesis. (E) Environmental factors that can potentially impact every step described in the prior panels.
The rs689 variant confers the most significant p-value of all T1D, yet it only has an odds ratio of 1.5–2.3. Thus, it is found throughout a large portion of the population without disease. This suggests either polygenic risk (the interaction of multiple independent risk variants) or that something from the environment influences this variant’s mechanism. Multiple other loci confer similar odds ratios for T1D and are from various pathways, suggesting that some polygenic insights are necessary to understand insulin within the complex T1D genetics. Yet, environmental factors may hold more insights into why many variants have low penetrance for T1D. As our RNAseq analyses have shown, there is a promise for understanding how components such as viral infections or cellular/ER stress might interact with risk alleles such as rs689 to result in T1D development.
Understanding the entire process of insulin biosynthesis and the many components involved will be crucial in future diabetic research. While this article focused on the locations of current known variants within solved protein structures, a wealth of knowledge of the biophysics of insulin dynamics needs additional integration into the larger variant potential for interpretations. The role of genetic variants in any of the insulin biosynthesis steps could modulate the risk of diabetes. Many transcription factors can impact insulin transcriptional regulation, whereas transcripts are regulated by splicing factors, NMD pathways, and mRNA processing from the nucleus to ribosomes (Figure 11A). The synthesis of proinsulin requires translation initiation machinery, folding chaperones, and multiple ER components (Figure 11B). The folding and storage of insulin require enzymes, Zn transporters, and secretory vesicle machinery (Figure 11C). Insulin release and bioactivity involve multiple cellular receptors, secretory vesicle exocytosis machinery, insulin receptor downstream signaling, and insulin clearance pathways (Figure 11D). The receptor interaction and metabolism pathways represent one of the most exciting aspects of insulin precision medicine, as it may hold additional answers for therapeutic derivative choices within each individual. Nearly every one of the steps within Figure 11 is error-prone with the potential for genetic and environmental interactions to impact insulin synthesis. Similar to our literature and data review performed here for insulin, every one of the proteins involved in insulin biology could benefit from a detailed exploration of genetic variants and disease involvement.
Genetics alone are not the only way of modifying these complex steps of insulin biology, but multiple factors of the environment can also impact these pathways (Figure 11E). One of the environmental components of insulin that is well-studied is the role of ER stress [267,268,269,270,271]. Chronic ER stress caused by the increased need for insulin synthesis can potentially cause beta cell de-differentiation and death. Genes linked to ER membrane homeostasis, such as WFS1, were connected to maturity-onset diabetes of the young [272]. Genetic variants were shown to result in the development of ER stress-induced diabetes in mice when exposed to a high-fat diet [273], suggesting that genetics and environment can interact with ER stress and diabetes risk.
Many other environmental factors can influence insulin biology (Figure 11E). While it is largely unknown why, the immune system can develop antibodies to insulin, which is potentially connected to some unknown regulation of INS–IGF2 [44,274,275,276]. Transcriptional alterations through factors such as TCF1, TCF2, HNF4A, IPF4, NEUROD1, and TCF7L2 were linked to various types of diabetes, with several directly connected to altering insulin biosynthesis [277,278,279]. As discussed in Section 2.4, multiple viruses can increase the risk of diabetes, with a need to further understand direct viral regulation on INS–IGF2 NMD-regulated transcripts and ER stress. While we provided examples of a few environmental factors that can regulate insulin, there are likely many other mechanisms. As we move forward, it will be essential to build these environmental factors into our genetic modeling of insulin biology and diabetic risks.
Pancreatic beta cell biology is incredibly complex with thousands of molecular interactions and pathways. Genetic risk can cause disease in any of these pathways; however, that risk might not become activated unless an environmental factor interacts with these genetics. As we have demonstrated in previous sections with the analysis of public pancreatic RNAseq datasets, there is a need for increased research into the role of the environment on transcription, splicing, and protein production. Because there are many possible variables in population environmental studies, big data research methods should be used to integrate genetic risk through GWAS and RNAseq analyses. With these newer big data strategies, it will be possible to develop our knowledge of mechanisms for diabetic genetics through environmental interactions that have been elusive until now.
4. Methods
All genome browser data was extracted from the UCSC Genome Browser [280] on 1 November 2022. On the same day, the GWAS traits were extracted from the GWAS catalog [50], the top SNP traits for INS variants were extracted from Open Targets Genetics [281], and variant population frequencies were extracted from dbSNP [62]. Linkage disequilibria for top variants were extracted using the SNiPA tool [282]. All extracted variants were processed through the Ensembl Variant Effect Predictor (VEP) [88] on 8 November 2022 with all possible tools turned on. Noncoding variants were run through the RegulomeDB tool for gene regulation insights [92]. Nucleotide sequences of INS were extracted from the NCBI ortholog [283] and aligned using Mega tools [284] with ClustalW [285]. Amino Acid sequences were aligned using COBALT [286].
GTEx expression data [61] of INS, INS–IGF2, and INSR were extracted from the transcript per million (TPM) version 8 file (https://storage.googleapis.com/gtex_analysis_v8/rna_seq_data/GTEx_Analysis_2017-06-05_v8_RNASeQCv1.1.9_gene_tpm.gct.gz, accessed on 6 December 2022). FASTQ files from the NCBI SRA for pancreas or liver were downloaded using the SRA toolkit [287]. The files were aligned to human Gencode 42 transcriptome [288] using Salmon [289]. Heatmaps were generated using the Broad Institutes Morpheus tool [290].
All protein coordinate files were sourced from the RCSB’s protein data bank [291]. Molecular graphics and analyses (hydrogen bond approximation and electrostatic surface coloring) were performed with UCSF ChimeraX, developed by the Resource for Biocomputing, Visualization, and Informatics at the University of California, San Francisco [292]. Figure 8A,B interaction color groups are based on known structural interactions from the extended data of Table 1 of [293], of which the information was originally published in [201].
Author Contributions
Conceptualization, T.W.C. and J.W.P.; methodology, T.W.C. and J.W.P.; formal analysis, T.W.C., A.M.W., J.T.M., N.E.A., S.R., C.P.B. and J.W.P.; data curation, T.W.C., A.M.W., J.T.M. and J.W.P.; writing—original draft preparation, T.W.C., A.M.W., J.T.M., N.E.A., S.R., C.P.B. and J.W.P.; writing—review and editing, T.W.C., A.M.W., J.T.M., N.E.A., S.R., C.P.B. and J.W.P.; visualization, T.W.C. and J.W.P.; supervision, S.R., C.P.B. and J.W.P.; project administration, T.W.C. and J.W.P.; funding acquisition, S.R., C.P.B. and J.W.P. All authors have read and agreed to the published version of the manuscript.
Funding
This research was funded by the Gerber Foundation (to JWP), National Institutes of Health (K01ES025435 to JWP), and Michigan State University.
Institutional Review Board Statement
Not applicable.
Informed Consent Statement
Not applicable.
Data Availability Statement
A compiled file of raw data from figures is available at https://doi.org/10.6084/m9.figshare.21597261.v1 (accessed on 6 December 2022). This file contains the following eight tabs: All Variants VEP: All gnomAD variants around INS with Ensembl Variant Effect Predictor data analysis; INS Regulation Var: The annotation of various regulation datasets for variants around INS; INS Amino Acids: conservation and variation data for insulin amino acids; Pancreas BioProject: compiled analysis of RNAseq projects from pancreas; Pancreas Samples: individual RNAseq samples of pancreas; Liver BioProject: compiled analysis of RNAseq projects from liver; Liver Samples: individual RNAseq samples of liver; INSR Amino Acids: conservation and variation data for insulin receptor amino acids. The gnomAD allele frequencies for variants around INS can be found at https://doi.org/10.6084/m9.figshare.21917124.v1 (accessed on 6 December 2022). Variants are ranked based on the highest frequency for one population group. Columns are colored based on the following key: gray: variant details; yellow: variant annotations; orange: total gnomAD 3.1.2 allele counts from all populations; red: highest allele frequency and population group with that frequency; cyan: allele frequencies for different populations. BLAST analysis of INS and INSR structures within the PDB at https://doi.org/10.6084/m9.figshare.21919194.v1 (accessed on 6 December 2022). Protein alignment files can be found at https://doi.org/10.6084/m9.figshare.21923289.v1 (accessed on 6 December 2022). All figures from the paper are available as original TIFF files at https://doi.org/10.6084/m9.figshare.21923781.v1 (accessed on 6 December 2022).
Conflicts of Interest
The authors declare no conflict of interest.
References
- Boyle, J.P.; Thompson, T.J.; Gregg, E.W.; Barker, L.E.; Williamson, D.F. Projection of the Year 2050 Burden of Diabetes in the US Adult Population: Dynamic Modeling of Incidence, Mortality, and Prediabetes Prevalence. Popul. Health Metr. 2010, 8, 29. [Google Scholar] [CrossRef] [PubMed]
- American Diabetes Association. Economic Costs of Diabetes in the U.S. in 2017. Diabetes Care 2018, 41, 917–928. [Google Scholar] [CrossRef] [PubMed]
- Daneman, D. Type 1 Diabetes. Lancet 2006, 367, 847–858. [Google Scholar] [CrossRef] [PubMed]
- Atkinson, M.A.; Eisenbarth, G.S.; Michels, A.W. Type 1 Diabetes. Lancet 2014, 383, 69–82. [Google Scholar] [CrossRef] [PubMed]
- Chiu, N.; Aggarwal, R.; Hernandez, I.; Wadhera, R.; Dejong, C.; Tseng, C.-W.; Yeh, R.W.; Kazi, D.S. Spending on Insulin by U.S. Payers and Patients From 2008 to 2017. Diabetes Care 2022, 45, e163–e164. [Google Scholar] [CrossRef] [PubMed]
- Chiou, J.; Geusz, R.J.; Okino, M.-L.; Han, J.Y.; Miller, M.; Melton, R.; Beebe, E.; Benaglio, P.; Huang, S.; Korgaonkar, K.; et al. Interpreting Type 1 Diabetes Risk with Genetics and Single-Cell Epigenomics. Nature 2021, 594, 398–402. [Google Scholar] [CrossRef]
- Inshaw, J.R.J.; Sidore, C.; Cucca, F.; Stefana, M.I.; Crouch, D.J.M.; McCarthy, M.I.; Mahajan, A.; Todd, J.A. Analysis of Overlapping Genetic Association in Type 1 and Type 2 Diabetes. Diabetologia 2021, 64, 1342–1347. [Google Scholar] [CrossRef]
- Forgetta, V.; Manousaki, D.; Istomine, R.; Ross, S.; Tessier, M.-C.; Marchand, L.; Li, M.; Qu, H.-Q.; Bradfield, J.P.; Grant, S.F.A.; et al. Rare Genetic Variants of Large Effect Influence Risk of Type 1 Diabetes. Diabetes 2020, 69, 784–795. [Google Scholar] [CrossRef]
- Støy, J.; Edghill, E.L.; Flanagan, S.E.; Ye, H.; Paz, V.P.; Pluzhnikov, A.; Below, J.E.; Hayes, M.G.; Cox, N.J.; Lipkind, G.M.; et al. Insulin Gene Mutations as a Cause of Permanent Neonatal Diabetes. Proc. Natl. Acad. Sci. USA 2007, 104, 15040–15044. [Google Scholar] [CrossRef]
- Roep, B.O.; Montero, E.; van Tienhoven, R.; Atkinson, M.A.; Schatz, D.A.; Mathieu, C. Defining a Cure for Type 1 Diabetes: A Call to Action. Lancet Diabetes Endocrinol. 2021, 9, 553–555. [Google Scholar] [CrossRef]
- Shulman, R.; Nakhla, M.; Daneman, D. The Ongoing Transmutation of Type 1 Diabetes: Disparities in Care and Outcomes. Can. J. Diabetes 2021, 45, 381–382. [Google Scholar] [CrossRef] [PubMed]
- Chatterjee, S.; Khunti, K.; Davies, M.J. Type 2 Diabetes. Lancet 2017, 389, 2239–2251. [Google Scholar] [CrossRef] [PubMed]
- De Fronzo, R.A.; Ferrannini, E.; Groop, L.; Henry, R.R.; Herman, W.H.; Holst, J.J.; Hu, F.B.; Kahn, C.R.; Raz, I.; Shulman, G.I.; et al. Type 2 Diabetes Mellitus. Nat. Rev. Dis. Prim. 2015, 1, 15019. [Google Scholar] [CrossRef] [PubMed]
- Olokoba, A.B.; Obateru, O.A.; Olokoba, L.B. Type 2 Diabetes Mellitus: A Review of Current Trends. Oman Med. J. 2012, 27, 269–273. [Google Scholar] [CrossRef]
- Gregg, E.W.; Sattar, N.; Ali, M.K. The Changing Face of Diabetes Complications. Lancet Diabetes Endocrinol. 2016, 4, 537–547. [Google Scholar] [CrossRef]
- Tahrani, A.A.; Barnett, A.H.; Bailey, C.J. Pharmacology and Therapeutic Implications of Current Drugs for Type 2 Diabetes Mellitus. Nat. Rev. Endocrinol. 2016, 12, 566–592. [Google Scholar] [CrossRef]
- Zhang, Q.; Wang, Y.; Huang, E.S. Changes in Racial/Ethnic Disparities in the Prevalence of Type 2 Diabetes by Obesity Level among US Adults. Ethn. Health 2009, 14, 439–457. [Google Scholar] [CrossRef]
- Tatulashvili, S.; Fagherazzi, G.; Dow, C.; Cohen, R.; Fosse, S.; Bihan, H. Socioeconomic Inequalities and Type 2 Diabetes Complications: A Systematic Review. Diabetes Metab. 2020, 46, 89–99. [Google Scholar] [CrossRef]
- LaVeist, T.A.; Thorpe, R.J.; Galarraga, J.E.; Bower, K.M.; Gary-Webb, T.L. Environmental and Socio-Economic Factors as Contributors to Racial Disparities in Diabetes Prevalence. J. Gen. Intern. Med. 2009, 24, 1144–1148. [Google Scholar] [CrossRef]
- Guillausseau, P.-J.; Meas, T.; Virally, M.; Laloi-Michelin, M.; Médeau, V.; Kevorkian, J.-P. Abnormalities in Insulin Secretion in Type 2 Diabetes Mellitus. Diabetes Metab. 2008, 34 (Suppl. 2), S43–S48. [Google Scholar] [CrossRef]
- Rosengren, A.H.; Braun, M.; Mahdi, T.; Andersson, S.A.; Travers, M.E.; Shigeto, M.; Zhang, E.; Almgren, P.; Ladenvall, C.; Axelsson, A.S.; et al. Reduced Insulin Exocytosis in Human Pancreatic β-Cells with Gene Variants Linked to Type 2 Diabetes. Diabetes 2012, 61, 1726–1733. [Google Scholar] [CrossRef]
- Müssig, K.; Staiger, H.; Machicao, F.; Häring, H.-U.; Fritsche, A. Genetic Variants in MTNR1B Affecting Insulin Secretion. Ann. Med. 2010, 42, 387–393. [Google Scholar] [CrossRef]
- Lazar, M.A. How Obesity Causes Diabetes: Not a Tall Tale. Science 2005, 307, 373–375. [Google Scholar] [CrossRef]
- Gordon, C.; Purciel-Hill, M.; Ghai, N.R.; Kaufman, L.; Graham, R.; Van Wye, G. Measuring Food Deserts in New York City’s Low-Income Neighborhoods. Health Place 2011, 17, 696–700. [Google Scholar] [CrossRef]
- Liese, A.D.; Lamichhane, A.P.; Garzia, S.C.A.; Puett, R.C.; Porter, D.E.; Dabelea, D.; D’Agostino, R.B.; Standiford, D.; Liu, L. Neighborhood Characteristics, Food Deserts, Rurality, and Type 2 Diabetes in Youth: Findings from a Case-Control Study. Health Place 2018, 50, 81–88. [Google Scholar] [CrossRef]
- Sallis, J.F.; Slymen, D.J.; Conway, T.L.; Frank, L.D.; Saelens, B.E.; Cain, K.; Chapman, J.E. Income Disparities in Perceived Neighborhood Built and Social Environment Attributes. Health Place 2011, 17, 1274–1283. [Google Scholar] [CrossRef]
- Talen, E.; Koschinsky, J. The Walkable Neighborhood: A Literature Review. Int. J. Sustain. Land Use Urban Plan. 2013, 1, 42–63. [Google Scholar] [CrossRef]
- Kowaleski-Jones, L.; Zick, C.; Smith, K.R.; Brown, B.; Hanson, H.; Fan, J. Walkable Neighborhoods and Obesity: Evaluating Effects with a Propensity Score Approach. SSM Popul. Health 2018, 6, 9–15. [Google Scholar] [CrossRef]
- Howell, N.A.; Tu, J.V.; Moineddin, R.; Chu, A.; Booth, G.L. Association Between Neighborhood Walkability and Predicted 10-Year Cardiovascular Disease Risk: The CANHEART (Cardiovascular Health in Ambulatory Care Research Team) Cohort. J. Am. Heart Assoc. 2019, 8, e013146. [Google Scholar] [CrossRef]
- Barroso, I. Genetics of Type 2 Diabetes. Diabet. Med. 2005, 22, 517–535. [Google Scholar] [CrossRef]
- Prokop, J.W.; May, T.; Strong, K.; Bilinovich, S.M.; Bupp, C.; Rajasekaran, S.; Worthey, E.A.; Lazar, J. Genome Sequencing in the Clinic: The Past, Present, and Future of Genomic Medicine. Physiol. Genom. 2018, 50, 563–579. [Google Scholar] [CrossRef] [PubMed]
- Karczewski, K.J.; Francioli, L.C.; Tiao, G.; Cummings, B.B.; Alföldi, J.; Wang, Q.; Collins, R.L.; Laricchia, K.M.; Ganna, A.; Birnbaum, D.P.; et al. The Mutational Constraint Spectrum Quantified from Variation in 141,456 Humans. Nature 2020, 581, 434–443. [Google Scholar] [CrossRef] [PubMed]
- Chandler, P.D.; Clark, C.R.; Zhou, G.; Noel, N.L.; Achilike, C.; Mendez, L.; Ramirez, A.H.; Loperena-Cortes, R.; Mayo, K.; Cohn, E.; et al. Hypertension Prevalence in the All of Us Research Program among Groups Traditionally Underrepresented in Medical Research. Sci. Rep. 2021, 11, 12849. [Google Scholar] [CrossRef] [PubMed]
- Chan, A.X.; McDermott Iv, J.J.; Lee, T.C.; Ye, G.Y.; Shahrvini, B.; Radha Saseendrakumar, B.; Baxter, S.L. Associations between Healthcare Utilization and Access and Diabetic Retinopathy Complications Using All of Us Nationwide Survey Data. PLoS ONE 2022, 17, e0269231. [Google Scholar] [CrossRef] [PubMed]
- Said, M.A.; Verweij, N.; van der Harst, P. Associations of Combined Genetic and Lifestyle Risks with Incident Cardiovascular Disease and Diabetes in the UK Biobank Study. JAMA Cardiol. 2018, 3, 693–702. [Google Scholar] [CrossRef]
- Cirulli, E.T.; Goldstein, D.B. Uncovering the Roles of Rare Variants in Common Disease through Whole-Genome Sequencing. Nat. Rev. Genet. 2010, 11, 415–425. [Google Scholar] [CrossRef]
- Almind, K.; Doria, A.; Kahn, C.R. Putting the Genes for Type II Diabetes on the Map. Nat. Med. 2001, 7, 277–279. [Google Scholar] [CrossRef]
- Zhang, H.; Colclough, K.; Gloyn, A.L.; Pollin, T.I. Monogenic Diabetes: A Gateway to Precision Medicine in Diabetes. J. Clin. Invest. 2021, 131, 142244. [Google Scholar] [CrossRef]
- Ye, Y.; Chen, X.; Han, J.; Jiang, W.; Natarajan, P.; Zhao, H. Interactions Between Enhanced Polygenic Risk Scores and Lifestyle for Cardiovascular Disease, Diabetes, and Lipid Levels. Circ. Genom. Precis. Med. 2021, 14, e003128. [Google Scholar] [CrossRef]
- Forrest, I.S.; Chaudhary, K.; Paranjpe, I.; Vy, H.M.T.; Marquez-Luna, C.; Rocheleau, G.; Saha, A.; Chan, L.; Van Vleck, T.; Loos, R.J.F.; et al. Genome-Wide Polygenic Risk Score for Retinopathy of Type 2 Diabetes. Hum. Mol. Genet. 2021, 30, 952–960. [Google Scholar] [CrossRef]
- Tremblay, J.; Haloui, M.; Attaoua, R.; Tahir, R.; Hishmih, C.; Harvey, F.; Marois-Blanchet, F.-C.; Long, C.; Simon, P.; Santucci, L.; et al. Polygenic Risk Scores Predict Diabetes Complications and Their Response to Intensive Blood Pressure and Glucose Control. Diabetologia 2021, 64, 2012–2025. [Google Scholar] [CrossRef]
- Xiong, Y.; Jia, M.; Yuan, J.; Zhang, C.; Zhu, Y.; Kuang, X.; Lan, L.; Wang, X. STAT3-regulated Long Non-coding RNAs Lnc-7SK and Lnc-IGF2-AS Promote Hepatitis C Virus Replication. Mol. Med. Rep. 2015, 12, 6738–6744. [Google Scholar] [CrossRef]
- Kanatsuna, N.; Taneera, J.; Vaziri-Sani, F.; Wierup, N.; Larsson, H.E.; Delli, A.; Skärstrand, H.; Balhuizen, A.; Bennet, H.; Steiner, D.F.; et al. Autoimmunity against INS-IGF2 Protein Expressed in Human Pancreatic Islets. J. Biol. Chem. 2013, 288, 29013–29023. [Google Scholar] [CrossRef]
- Johannessen, L.E.; Panagopoulos, I.; Haugvik, S.-P.; Gladhaug, I.P.; Heim, S.; Micci, F. Upregulation of INS-IGF2 Read-through Expression and Identification of a Novel INS-IGF2 Splice Variant in Insulinomas. Oncol. Rep. 2016, 36, 2653–2662. [Google Scholar] [CrossRef]
- Roadmap Epigenomics Consortium; Kundaje, A.; Meuleman, W.; Ernst, J.; Bilenky, M.; Yen, A.; Heravi-Moussavi, A.; Kheradpour, P.; Zhang, Z.; Wang, J.; et al. Integrative Analysis of 111 Reference Human Epigenomes. Nature 2015, 518, 317–330. [Google Scholar] [CrossRef]
- Bernardo, A.S.; Hay, C.W.; Docherty, K. Pancreatic Transcription Factors and Their Role in the Birth, Life and Survival of the Pancreatic Beta Cell. Mol. Cell. Endocrinol. 2008, 294, 1–9. [Google Scholar] [CrossRef]
- Rutter, G.A.; Pullen, T.J.; Hodson, D.J.; Martinez-Sanchez, A. Pancreatic β-Cell Identity, Glucose Sensing and the Control of Insulin Secretion. Biochem. J. 2015, 466, 203–218. [Google Scholar] [CrossRef]
- Rutter, G.A.; Tavaré, J.M.; Palmer, D.G. Regulation of Mammalian Gene Expression by Glucose. News Physiol. Sci. 2000, 15, 149–154. [Google Scholar] [CrossRef]
- Poitout, V.; Hagman, D.; Stein, R.; Artner, I.; Robertson, R.P.; Harmon, J.S. Regulation of the Insulin Gene by Glucose and Fatty Acids. J. Nutr. 2006, 136, 873–876. [Google Scholar] [CrossRef]
- MacArthur, J.; Bowler, E.; Cerezo, M.; Gil, L.; Hall, P.; Hastings, E.; Junkins, H.; McMahon, A.; Milano, A.; Morales, J.; et al. The New NHGRI-EBI Catalog of Published Genome-Wide Association Studies (GWAS Catalog). Nucleic Acids Res. 2017, 45, D896–D901. [Google Scholar] [CrossRef]
- Ng, M.C.Y.; Shriner, D.; Chen, B.H.; Li, J.; Chen, W.-M.; Guo, X.; Liu, J.; Bielinski, S.J.; Yanek, L.R.; Nalls, M.A.; et al. Meta-Analysis of Genome-Wide Association Studies in African Americans Provides Insights into the Genetic Architecture of Type 2 Diabetes. PLoS Genet. 2014, 10, e1004517. [Google Scholar] [CrossRef] [PubMed]
- Mansour Aly, D.; Dwivedi, O.P.; Prasad, R.B.; Käräjämäki, A.; Hjort, R.; Thangam, M.; Åkerlund, M.; Mahajan, A.; Udler, M.S.; Florez, J.C.; et al. Genome-Wide Association Analyses Highlight Etiological Differences Underlying Newly Defined Subtypes of Diabetes. Nat. Genet. 2021, 53, 1534–1542. [Google Scholar] [CrossRef] [PubMed]
- Sakaue, S.; Kanai, M.; Tanigawa, Y.; Karjalainen, J.; Kurki, M.; Koshiba, S.; Narita, A.; Konuma, T.; Yamamoto, K.; Akiyama, M.; et al. A Cross-Population Atlas of Genetic Associations for 220 Human Phenotypes. Nat. Genet. 2021, 53, 1415–1424. [Google Scholar] [CrossRef]
- Chen, J.; Spracklen, C.N.; Marenne, G.; Varshney, A.; Corbin, L.J.; Luan, J.; Willems, S.M.; Wu, Y.; Zhang, X.; Horikoshi, M.; et al. The Trans-Ancestral Genomic Architecture of Glycemic Traits. Nat. Genet. 2021, 53, 840–860. [Google Scholar] [CrossRef] [PubMed]
- Sinnott-Armstrong, N.; Tanigawa, Y.; Amar, D.; Mars, N.; Benner, C.; Aguirre, M.; Venkataraman, G.R.; Wainberg, M.; Ollila, H.M.; Kiiskinen, T.; et al. Genetics of 35 Blood and Urine Biomarkers in the UK Biobank. Nat. Genet. 2021, 53, 185–194. [Google Scholar] [CrossRef] [PubMed]
- Zhu, M.; Xu, K.; Chen, Y.; Gu, Y.; Zhang, M.; Luo, F.; Liu, Y.; Gu, W.; Hu, J.; Xu, H.; et al. Identification of Novel T1D Risk Loci and Their Association with Age and Islet Function at Diagnosis in Autoantibody-Positive T1D Individuals: Based on a Two-Stage Genome-Wide Association Study. Diabetes Care 2019, 42, 1414–1421. [Google Scholar] [CrossRef]
- Cousminer, D.L.; Ahlqvist, E.; Mishra, R.; Andersen, M.K.; Chesi, A.; Hawa, M.I.; Davis, A.; Hodge, K.M.; Bradfield, J.P.; Zhou, K.; et al. First Genome-Wide Association Study of Latent Autoimmune Diabetes in Adults Reveals Novel Insights Linking Immune and Metabolic Diabetes. Diabetes Care 2018, 41, 2396–2403. [Google Scholar] [CrossRef]
- Onengut-Gumuscu, S.; Chen, W.-M.; Burren, O.; Cooper, N.J.; Quinlan, A.R.; Mychaleckyj, J.C.; Farber, E.; Bonnie, J.K.; Szpak, M.; Schofield, E.; et al. Fine Mapping of Type 1 Diabetes Susceptibility Loci and Evidence for Colocalization of Causal Variants with Lymphoid Gene Enhancers. Nat. Genet. 2015, 47, 381–386. [Google Scholar] [CrossRef]
- Plagnol, V.; Howson, J.M.M.; Smyth, D.J.; Walker, N.; Hafler, J.P.; Wallace, C.; Stevens, H.; Jackson, L.; Simmonds, M.J.; Type 1 Diabetes Genetics Consortium; et al. Genome-Wide Association Analysis of Autoantibody Positivity in Type 1 Diabetes Cases. PLoS Genet. 2011, 7, e1002216. [Google Scholar] [CrossRef]
- Mahajan, A.; Taliun, D.; Thurner, M.; Robertson, N.R.; Torres, J.M.; Rayner, N.W.; Payne, A.J.; Steinthorsdottir, V.; Scott, R.A.; Grarup, N.; et al. Fine-Mapping Type 2 Diabetes Loci to Single-Variant Resolution Using High-Density Imputation and Islet-Specific Epigenome Maps. Nat. Genet. 2018, 50, 1505–1513. [Google Scholar] [CrossRef]
- GTEx Consortium the GTEx Consortium Atlas of Genetic Regulatory Effects across Human Tissues. Science 2020, 369, 1318–1330. [CrossRef]
- Sherry, S.T.; Ward, M.H.; Kholodov, M.; Baker, J.; Phan, L.; Smigielski, E.M.; Sirotkin, K. DbSNP: The NCBI Database of Genetic Variation. Nucleic Acids Res. 2001, 29, 308–311. [Google Scholar] [CrossRef]
- Birgmeier, J.; Deisseroth, C.A.; Hayward, L.E.; Galhardo, L.M.T.; Tierno, A.P.; Jagadeesh, K.A.; Stenson, P.D.; Cooper, D.N.; Bernstein, J.A.; Haeussler, M.; et al. AVADA: Toward Automated Pathogenic Variant Evidence Retrieval Directly from the Full-Text Literature. Genet. Med. 2020, 22, 362–370. [Google Scholar] [CrossRef]
- Landrum, M.J.; Lee, J.M.; Benson, M.; Brown, G.; Chao, C.; Chitipiralla, S.; Gu, B.; Hart, J.; Hoffman, D.; Hoover, J.; et al. ClinVar: Public Archive of Interpretations of Clinically Relevant Variants. Nucleic Acids Res. 2016, 44, D862–D868. [Google Scholar] [CrossRef]
- UniProt Consortium. UniProt: A Hub for Protein Information. Nucleic Acids Res. 2015, 43, D204–D212. [Google Scholar] [CrossRef]
- Massarenti, L.; Aniol-Nielsen, C.; Enevold, C.; Toft-Hansen, H.; Nielsen, C.H. Influence of Insulin Receptor Single Nucleotide Polymorphisms on Glycaemic Control and Formation of Anti-Insulin Antibodies in Diabetes Mellitus. Int. J. Mol. Sci. 2022, 23, 6481. [Google Scholar] [CrossRef]
- Ayabe, T.; Fukami, M.; Ogata, T.; Kawamura, T.; Urakami, T.; Kikuchi, N.; Yokota, I.; Ihara, K.; Takemoto, K.; Mukai, T.; et al. Variants Associated with Autoimmune Type 1 Diabetes in Japanese Children: Implications for Age-Specific Effects of Cis-Regulatory Haplotypes at 17q12-Q21. Diabet. Med. 2016, 33, 1717–1722. [Google Scholar] [CrossRef]
- Hernández, M.; Nóvoa-Medina, Y.; Faner, R.; Palou, E.; Esquerda, A.; Castelblanco, E.; Wägner, A.M.; Mauricio, D. Genetics: Is LADA Just Late Onset Type 1 Diabetes? Front. Endocrinol. 2022, 13, 916698. [Google Scholar] [CrossRef]
- Ramu, D.; Perumal, V.; Paul, S.F.D. Association of Common Type 1 and Type 2 Diabetes Gene Variants with Latent Autoimmune Diabetes in Adults: A Meta-Analysis. J. Diabetes 2019, 11, 484–496. [Google Scholar] [CrossRef]
- Cervin, C.; Lyssenko, V.; Bakhtadze, E.; Lindholm, E.; Nilsson, P.; Tuomi, T.; Cilio, C.M.; Groop, L. Genetic Similarities between Latent Autoimmune Diabetes in Adults, Type 1 Diabetes, and Type 2 Diabetes. Diabetes 2008, 57, 1433–1437. [Google Scholar] [CrossRef]
- Sokhi, J.; Sikka, R.; Raina, P.; Kaur, R.; Matharoo, K.; Arora, P.; Bhanwer, A. Association of Genetic Variants in INS (Rs689), INSR (Rs1799816) and PP1G.G (Rs1799999) with Type 2 Diabetes (T2D): A Case-Control Study in Three Ethnic Groups from North-West India. Mol. Genet. Genom. 2016, 291, 205–216. [Google Scholar] [CrossRef]
- Fabregat, M.; Fernandez, M.; Javiel, G.; Vitarella, G.; Mimbacas, A. The Genetic Profile from HLA and Non-HLA Loci Allows Identification of Atypical Type 2 Diabetes Patients. J. Diabetes Res. 2015, 2015, 485132. [Google Scholar] [CrossRef] [PubMed]
- Krischer, J.P.; Liu, X.; Lernmark, Å.; Hagopian, W.A.; Rewers, M.J.; She, J.-X.; Toppari, J.; Ziegler, A.-G.; Akolkar, B.; TEDDY Study Group. Predictors of the Initiation of Islet Autoimmunity and Progression to Multiple Autoantibodies and Clinical Diabetes: The TEDDY Study. Diabetes Care 2022, 45, 2271–2281. [Google Scholar] [CrossRef] [PubMed]
- Lempainen, J.; Laine, A.-P.; Hammais, A.; Toppari, J.; Simell, O.; Veijola, R.; Knip, M.; Ilonen, J. Non-HLA Gene Effects on the Disease Process of Type 1 Diabetes: From HLA Susceptibility to Overt Disease. J. Autoimmun. 2015, 61, 45–53. [Google Scholar] [CrossRef] [PubMed]
- Lempainen, J.; Härkönen, T.; Laine, A.; Knip, M.; Ilonen, J. Finnish Pediatric Diabetes Register Associations of Polymorphisms in Non-HLA Loci with Autoantibodies at the Diagnosis of Type 1 Diabetes: INS and IKZF4 Associate with Insulin Autoantibodies. Pediatr. Diabetes 2013, 14, 490–496. [Google Scholar] [CrossRef] [PubMed]
- Ilonen, J.; Hammais, A.; Laine, A.-P.; Lempainen, J.; Vaarala, O.; Veijola, R.; Simell, O.; Knip, M. Patterns of β-Cell Autoantibody Appearance and Genetic Associations during the First Years of Life. Diabetes 2013, 62, 3636–3640. [Google Scholar] [CrossRef]
- Smith, M.J.; Rihanek, M.; Wasserfall, C.; Mathews, C.E.; Atkinson, M.A.; Gottlieb, P.A.; Cambier, J.C. Loss of B-Cell Anergy in Type 1 Diabetes Is Associated with High-Risk HLA and Non-HLA Disease Susceptibility Alleles. Diabetes 2018, 67, 697–703. [Google Scholar] [CrossRef]
- Valta, M.; Gazali, A.M.; Viisanen, T.; Ihantola, E.-L.; Ekman, I.; Toppari, J.; Knip, M.; Veijola, R.; Ilonen, J.; Lempainen, J.; et al. Type 1 Diabetes Linked PTPN22 Gene Polymorphism Is Associated with the Frequency of Circulating Regulatory T Cells. Eur. J. Immunol. 2020, 50, 581–588. [Google Scholar] [CrossRef]
- Barton, A.R.; Sherman, M.A.; Mukamel, R.E.; Loh, P.-R. Whole-Exome Imputation within UK Biobank Powers Rare Coding Variant Association and Fine-Mapping Analyses. Nat. Genet. 2021, 53, 1260–1269. [Google Scholar] [CrossRef]
- Landmann, E.; Kollerits, B.; Kreuder, J.G.; Blum, W.F.; Kronenberg, F.; Rudloff, S. Influence of Polymorphisms in Genes Encoding for Insulin-like Growth Factor (IGF)-I, Insulin, and IGF-Binding Protein (IGFBP)-3 on IGF-I, IGF-II, and IGFBP-3 Levels in Umbilical Cord Plasma. Horm. Res. Paediatr. 2012, 77, 341–350. [Google Scholar] [CrossRef]
- Adkins, R.M.; Fain, J.N.; Krushkal, J.; Klauser, C.K.; Magann, E.F.; Morrison, J.C. Association between Paternally Inherited Haplotypes Upstream of the Insulin Gene and Umbilical Cord IGF-II Levels. Pediatr. Res. 2007, 62, 451–455. [Google Scholar] [CrossRef]
- Howson, J.M.M.; Walker, N.M.; Smyth, D.J.; Todd, J.A. Type I Diabetes Genetics Consortium Analysis of 19 Genes for Association with Type I Diabetes in the Type I Diabetes Genetics Consortium Families. Genes Immun. 2009, 10 (Suppl. 1), S74–S84. [Google Scholar] [CrossRef]
- Ge, T.; Chen, C.-Y.; Neale, B.M.; Sabuncu, M.R.; Smoller, J.W. Phenome-Wide Heritability Analysis of the UK Biobank. PLoS Genet. 2017, 13, e1006711. [Google Scholar] [CrossRef]
- Adkins, R.M.; Krushkal, J.; Klauser, C.K.; Magann, E.F.; Morrison, J.C.; Somes, G. Association between Small for Gestational Age and Paternally Inherited 5’ Insulin Haplotypes. Int. J. Obes. 2008, 32, 372–380. [Google Scholar] [CrossRef]
- Lages, A.; Proud, C.G.; Holloway, J.W.; Vorechovsky, I. Thioflavin T Monitoring of Guanine Quadruplex Formation in the Rs689-Dependent INS Intron 1. Mol. Ther. Nucleic Acids 2019, 16, 770–777. [Google Scholar] [CrossRef]
- Kralovicova, J.; Lages, A.; Patel, A.; Dhir, A.; Buratti, E.; Searle, M.; Vorechovsky, I. Optimal Antisense Target Reducing INS Intron 1 Retention Is Adjacent to a Parallel G Quadruplex. Nucleic Acids Res. 2014, 42, 8161–8173. [Google Scholar] [CrossRef]
- Kralovicova, J.; Vorechovsky, I. Allele-Specific Recognition of the 3’ Splice Site of INS Intron 1. Hum. Genet. 2010, 128, 383–400. [Google Scholar] [CrossRef]
- McLaren, W.; Gil, L.; Hunt, S.E.; Riat, H.S.; Ritchie, G.R.S.; Thormann, A.; Flicek, P.; Cunningham, F. The Ensembl Variant Effect Predictor. Genome Biol. 2016, 17, 122. [Google Scholar] [CrossRef]
- Wingender, E. The TRANSFAC Project as an Example of Framework Technology That Supports the Analysis of Genomic Regulation. Brief. Bioinform. 2008, 9, 326–332. [Google Scholar] [CrossRef]
- Partridge, E.C.; Chhetri, S.B.; Prokop, J.W.; Ramaker, R.C.; Jansen, C.S.; Goh, S.-T.; Mackiewicz, M.; Newberry, K.M.; Brandsmeier, L.A.; Meadows, S.K.; et al. Occupancy Maps of 208 Chromatin-Associated Proteins in One Human Cell Type. Nature 2020, 583, 720–728. [Google Scholar] [CrossRef]
- Castro-Mondragon, J.A.; Riudavets-Puig, R.; Rauluseviciute, I.; Lemma, R.B.; Turchi, L.; Blanc-Mathieu, R.; Lucas, J.; Boddie, P.; Khan, A.; Manosalva Pérez, N.; et al. JASPAR 2022: The 9th Release of the Open-Access Database of Transcription Factor Binding Profiles. Nucleic Acids Res. 2022, 50, D165–D173. [Google Scholar] [CrossRef] [PubMed]
- Boyle, A.P.; Hong, E.L.; Hariharan, M.; Cheng, Y.; Schaub, M.A.; Kasowski, M.; Karczewski, K.J.; Park, J.; Hitz, B.C.; Weng, S.; et al. Annotation of Functional Variation in Personal Genomes Using RegulomeDB. Genome Res. 2012, 22, 1790–1797. [Google Scholar] [CrossRef] [PubMed]
- Gilly, A.; Park, Y.-C.; Png, G.; Barysenka, A.; Fischer, I.; Bjørnland, T.; Southam, L.; Suveges, D.; Neumeyer, S.; Rayner, N.W.; et al. Whole-Genome Sequencing Analysis of the Cardiometabolic Proteome. Nat. Commun. 2020, 11, 6336. [Google Scholar] [CrossRef] [PubMed]
- Juo, Z.S.; Chiu, T.K.; Leiberman, P.M.; Baikalov, I.; Berk, A.J.; Dickerson, R.E. How Proteins Recognize the TATA Box. J. Mol. Biol. 1996, 261, 239–254. [Google Scholar] [CrossRef]
- Sawadogo, M.; Roeder, R.G. Interaction of a Gene-Specific Transcription Factor with the Adenovirus Major Late Promoter Upstream of the TATA Box Region. Cell 1985, 43, 165–175. [Google Scholar] [CrossRef]
- Kaestner, K.H. The Hepatocyte Nuclear Factor 3 (HNF3 or FOXA) Family in Metabolism. Trends Endocrinol. Metab. 2000, 11, 281–285. [Google Scholar] [CrossRef]
- Buteau, J.; Accili, D. Regulation of Pancreatic Beta-Cell Function by the Forkhead Protein FoxO1. Diabetes Obes. Metab. 2007, 9 (Suppl. 2), 140–146. [Google Scholar] [CrossRef]
- Mohtar, O.; Ozdemir, C.; Roy, D.; Shantaram, D.; Emili, A.; Kandror, K.V. Egr1 Mediates the Effect of Insulin on Leptin Transcription in Adipocytes. J. Biol. Chem. 2019, 294, 5784–5789. [Google Scholar] [CrossRef]
- Eto, K.; Kaur, V.; Thomas, M.K. Regulation of Insulin Gene Transcription by the Immediate-Early Growth Response Gene Egr-1. Endocrinology 2006, 147, 2923–2935. [Google Scholar] [CrossRef]
- Lee, S.; Park, U.; Lee, Y.I. Hepatitis C Virus Core Protein Transactivates Insulin-like Growth Factor II Gene Transcription through Acting Concurrently on Egr1 and Sp1 Sites. Virology 2001, 283, 167–177. [Google Scholar] [CrossRef]
- Manousaki, D.; Mitchell, R.; Dudding, T.; Haworth, S.; Harroud, A.; Forgetta, V.; Shah, R.L.; Luan, J.; Langenberg, C.; Timpson, N.J.; et al. Genome-Wide Association Study for Vitamin D Levels Reveals 69 Independent Loci. Am. J. Hum. Genet. 2020, 106, 327–337. [Google Scholar] [CrossRef]
- Rentzsch, P.; Witten, D.; Cooper, G.M.; Shendure, J.; Kircher, M. CADD: Predicting the Deleteriousness of Variants throughout the Human Genome. Nucleic Acids Res. 2019, 47, D886–D894. [Google Scholar] [CrossRef]
- Klauer, A.A.; van Hoof, A. Degradation of MRNAs That Lack a Stop Codon: A Decade of Nonstop Progress. Wiley Interdiscip. Rev. RNA 2012, 3, 649–660. [Google Scholar] [CrossRef]
- Garin, I.; Perez de Nanclares, G.; Gastaldo, E.; Harries, L.W.; Rubio-Cabezas, O.; Castaño, L. Permanent Neonatal Diabetes Caused by Creation of an Ectopic Splice Site within the INS Gene. PLoS ONE 2012, 7, e29205. [Google Scholar] [CrossRef]
- Panova, A.V.; Klementieva, N.V.; Sycheva, A.V.; Korobko, E.V.; Sosnovtseva, A.O.; Krasnova, T.S.; Karpova, M.R.; Rubtsov, P.M.; Tikhonovich, Y.V.; Tiulpakov, A.N.; et al. Aberrant Splicing of INS Impairs Beta-Cell Differentiation and Proliferation by ER Stress in the Isogenic IPSC Model of Neonatal Diabetes. Int. J. Mol. Sci. 2022, 23, 8824. [Google Scholar] [CrossRef]
- Prokop, J.W.; Jdanov, V.; Savage, L.; Morris, M.; Lamb, N.; VanSickle, E.; Stenger, C.L.; Rajasekaran, S.; Bupp, C.P. Computational and Experimental Analysis of Genetic Variants. Compr. Physiol. 2022, 12, 3303–3336. [Google Scholar] [CrossRef]
- Hentze, M.W.; Kulozik, A.E. A Perfect Message: RNA Surveillance and Nonsense-Mediated Decay. Cell 1999, 96, 307–310. [Google Scholar] [CrossRef]
- Hauer, C.; Sieber, J.; Schwarzl, T.; Hollerer, I.; Curk, T.; Alleaume, A.-M.; Hentze, M.W.; Kulozik, A.E. Exon Junction Complexes Show a Distributional Bias toward Alternatively Spliced MRNAs and against MRNAs Coding for Ribosomal Proteins. Cell Rep. 2016, 16, 1588–1603. [Google Scholar] [CrossRef]
- Hug, N.; Longman, D.; Cáceres, J.F. Mechanism and Regulation of the Nonsense-Mediated Decay Pathway. Nucleic Acids Res. 2016, 44, 1483–1495. [Google Scholar] [CrossRef]
- Embree, C.M.; Abu-Alhasan, R.; Singh, G. Features and Factors That Dictate If Terminating Ribosomes Cause or Counteract Nonsense-Mediated MRNA Decay. J. Biol. Chem. 2022, 298, 102592. [Google Scholar] [CrossRef]
- Ghiasi, S.M.; Krogh, N.; Tyrberg, B.; Mandrup-Poulsen, T. The No-Go and Nonsense-Mediated RNA Decay Pathways Are Regulated by Inflammatory Cytokines in Insulin-Producing Cells and Human Islets and Determine β-Cell Insulin Biosynthesis and Survival. Diabetes 2018, 67, 2019–2037. [Google Scholar] [CrossRef] [PubMed]
- Leon, K.; Ott, M. An “Arms Race” between the Nonsense-Mediated MRNA Decay Pathway and Viral Infections. Semin. Cell Dev. Biol. 2020, 111, 101–107. [Google Scholar] [CrossRef] [PubMed]
- Balistreri, G.; Bognanni, C.; Mühlemann, O. Virus Escape and Manipulation of Cellular Nonsense-Mediated MRNA Decay. Viruses 2017, 9, 24. [Google Scholar] [CrossRef] [PubMed]
- Op de Beeck, A.; Eizirik, D.L. Viral Infections in Type 1 Diabetes Mellitus--Why the β Cells? Nat. Rev. Endocrinol. 2016, 12, 263–273. [Google Scholar] [CrossRef]
- Spagnuolo, I.; Patti, A.; Sebastiani, G.; Nigi, L.; Dotta, F. The Case for Virus-Induced Type 1 Diabetes. Curr. Opin. Endocrinol. Diabetes Obes. 2013, 20, 292–298. [Google Scholar] [CrossRef]
- Mason, A.L.; Lau, J.Y.; Hoang, N.; Qian, K.; Alexander, G.J.; Xu, L.; Guo, L.; Jacob, S.; Regenstein, F.G.; Zimmerman, R.; et al. Association of Diabetes Mellitus and Chronic Hepatitis C Virus Infection. Hepatology 1999, 29, 328–333. [Google Scholar] [CrossRef]
- Coppieters, K.T.; Boettler, T.; von Herrath, M. Virus Infections in Type 1 Diabetes. Cold Spring Harb. Perspect. Med. 2012, 2, a007682. [Google Scholar] [CrossRef]
- Van der Werf, N.; Kroese, F.G.M.; Rozing, J.; Hillebrands, J.-L. Viral Infections as Potential Triggers of Type 1 Diabetes. Diabetes Metab. Res. Rev. 2007, 23, 169–183. [Google Scholar] [CrossRef]
- Gallagher, G.R.; Brehm, M.A.; Finberg, R.W.; Barton, B.A.; Shultz, L.D.; Greiner, D.L.; Bortell, R.; Wang, J.P. Viral Infection of Engrafted Human Islets Leads to Diabetes. Diabetes 2015, 64, 1358–1369. [Google Scholar] [CrossRef]
- Baralle, M.; Baralle, F.E. Alternative Splicing and Liver Disease. Ann. Hepatol. 2021, 26, 100534. [Google Scholar] [CrossRef]
- Wu, P.; Zhang, M.; Webster, N.J.G. Alternative RNA Splicing in Fatty Liver Disease. Front. Endocrinol. 2021, 12, 613213. [Google Scholar] [CrossRef]
- Webster, N.J.G. Alternative RNA Splicing in the Pathogenesis of Liver Disease. Front. Endocrinol. 2017, 8, 133. [Google Scholar] [CrossRef]
- Ramage, H.R.; Kumar, G.R.; Verschueren, E.; Johnson, J.R.; Von Dollen, J.; Johnson, T.; Newton, B.; Shah, P.; Horner, J.; Krogan, N.J.; et al. A Combined Proteomics/Genomics Approach Links Hepatitis C Virus Infection with Nonsense-Mediated MRNA Decay. Mol. Cell 2015, 57, 329–340. [Google Scholar] [CrossRef] [PubMed]
- Moscatiello, S.; Manini, R.; Marchesini, G. Diabetes and Liver Disease: An Ominous Association. Nutr. Metab. Cardiovasc. Dis. 2007, 17, 63–70. [Google Scholar] [CrossRef] [PubMed]
- García-Compeán, D.; González-González, J.A.; Lavalle-González, F.J.; González-Moreno, E.I.; Villarreal-Pérez, J.Z.; Maldonado-Garza, H.J. Current Concepts in Diabetes Mellitus and Chronic Liver Disease: Clinical Outcomes, Hepatitis C Virus Association, and Therapy. Dig. Dis. Sci. 2016, 61, 371–380. [Google Scholar] [CrossRef] [PubMed]
- Harrison, S.A. Liver Disease in Patients with Diabetes Mellitus. J. Clin. Gastroenterol. 2006, 40, 68–76. [Google Scholar] [CrossRef]
- Garcia-Compean, D.; Jaquez-Quintana, J.O.; Gonzalez-Gonzalez, J.A.; Maldonado-Garza, H. Liver Cirrhosis and Diabetes: Risk Factors, Pathophysiology, Clinical Implications and Management. World J. Gastroenterol. 2009, 15, 280–288. [Google Scholar] [CrossRef]
- Ahmadieh, H.; Azar, S.T. Liver Disease and Diabetes: Association, Pathophysiology, and Management. Diabetes Res. Clin. Pract. 2014, 104, 53–62. [Google Scholar] [CrossRef]
- Lin, C.-Y.; Adhikary, P.; Cheng, K. Cellular Protein Markers, Therapeutics, and Drug Delivery Strategies in the Treatment of Diabetes-Associated Liver Fibrosis. Adv. Drug Deliv. Rev. 2021, 174, 127–139. [Google Scholar] [CrossRef]
- Simó, R.; Hernández, C.; Genescà, J.; Jardí, R.; Mesa, J. High Prevalence of Hepatitis C Virus Infection in Diabetic Patients. Diabetes Care 1996, 19, 998–1000. [Google Scholar] [CrossRef]
- Kumar, R. Hepatogenous Diabetes: An Underestimated Problem of Liver Cirrhosis. Indian J. Endocrinol. Metab. 2018, 22, 552–559. [Google Scholar] [CrossRef] [PubMed]
- Hsieh, P.-S.; Hsieh, Y.-J. Impact of Liver Diseases on the Development of Type 2 Diabetes Mellitus. World J. Gastroenterol. 2011, 17, 5240–5245. [Google Scholar] [CrossRef] [PubMed]
- Allison, M.E.; Wreghitt, T.; Palmer, C.R.; Alexander, G.J. Evidence for a Link between Hepatitis C Virus Infection and Diabetes Mellitus in a Cirrhotic Population. J. Hepatol. 1994, 21, 1135–1139. [Google Scholar] [CrossRef] [PubMed]
- Shintani, Y.; Fujie, H.; Miyoshi, H.; Tsutsumi, T.; Tsukamoto, K.; Kimura, S.; Moriya, K.; Koike, K. Hepatitis C Virus Infection and Diabetes: Direct Involvement of the Virus in the Development of Insulin Resistance. Gastroenterology 2004, 126, 840–848. [Google Scholar] [CrossRef] [PubMed]
- Arneth, B. Insulin Gene Mutations and Posttranslational and Translocation Defects: Associations with Diabetes. Endocrine 2020, 70, 488–497. [Google Scholar] [CrossRef]
- Vakilian, M.; Tahamtani, Y.; Ghaedi, K. A Review on Insulin Trafficking and Exocytosis. Gene 2019, 706, 52–61. [Google Scholar] [CrossRef]
- Von Heijne, G. The Signal Peptide. J. Membr. Biol. 1990, 115, 195–201. [Google Scholar] [CrossRef]
- Hussain, S.; Mohd Ali, J.; Jalaludin, M.Y.; Harun, F. Permanent Neonatal Diabetes Due to a Novel Insulin Signal Peptide Mutation. Pediatr. Diabetes 2013, 14, 299–303. [Google Scholar] [CrossRef]
- Liu, M.; Weiss, M.A.; Arunagiri, A.; Yong, J.; Rege, N.; Sun, J.; Haataja, L.; Kaufman, R.J.; Arvan, P. Biosynthesis, Structure, and Folding of the Insulin Precursor Protein. Diabetes Obes. Metab. 2018, 20, 28–50. [Google Scholar] [CrossRef]
- Kellogg, M.K.; Miller, S.C.; Tikhonova, E.B.; Karamyshev, A.L. SRPassing Co-Translational Targeting: The Role of the Signal Recognition Particle in Protein Targeting and MRNA Protection. Int. J. Mol. Sci. 2021, 22, 6284. [Google Scholar] [CrossRef]
- Kriegler, T.; Kiburg, G.; Hessa, T. Translocon-Associated Protein Complex (TRAP) Is Crucial for Co-Translational Translocation of Pre-Proinsulin. J. Mol. Biol. 2020, 432, 166694. [Google Scholar] [CrossRef]
- Li, X.; Itani, O.A.; Haataja, L.; Dumas, K.J.; Yang, J.; Cha, J.; Flibotte, S.; Shih, H.-J.; Delaney, C.E.; Xu, J.; et al. Requirement for Translocon-Associated Protein (TRAP) α in Insulin Biogenesis. Sci. Adv. 2019, 5, eaax0292. [Google Scholar] [CrossRef]
- Karunanayake, C.; Page, R.C. Cytosolic Protein Quality Control Machinery: Interactions of Hsp70 with a Network of Co-Chaperones and Substrates. Exp. Biol. Med. 2021, 246, 1419–1434. [Google Scholar] [CrossRef]
- Boesgaard, T.W.; Pruhova, S.; Andersson, E.A.; Cinek, O.; Obermannova, B.; Lauenborg, J.; Damm, P.; Bergholdt, R.; Pociot, F.; Pisinger, C.; et al. Further Evidence That Mutations in INS Can Be a Rare Cause of Maturity-Onset Diabetes of the Young (MODY). BMC Med. Genet. 2010, 11, 42. [Google Scholar] [CrossRef]
- Edghill, E.L.; Flanagan, S.E.; Patch, A.-M.; Boustred, C.; Parrish, A.; Shields, B.; Shepherd, M.H.; Hussain, K.; Kapoor, R.R.; Malecki, M.; et al. Insulin Mutation Screening in 1,044 Patients with Diabetes: Mutations in the INS Gene Are a Common Cause of Neonatal Diabetes but a Rare Cause of Diabetes Diagnosed in Childhood or Adulthood. Diabetes 2008, 57, 1034–1042. [Google Scholar] [CrossRef]
- Liu, M.; Huang, Y.; Xu, X.; Li, X.; Alam, M.; Arunagiri, A.; Haataja, L.; Ding, L.; Wang, S.; Itkin-Ansari, P.; et al. Normal and Defective Pathways in Biogenesis and Maintenance of the Insulin Storage Pool. J. Clin. Invest. 2021, 131, e142240. [Google Scholar] [CrossRef]
- Gehart, H.; Ricci, R. Saving the Neck from Scission. Commun. Integr. Biol. 2013, 6, e23098. [Google Scholar] [CrossRef]
- Lawrence, M.C. Understanding Insulin and Its Receptor from Their Three-Dimensional Structures. Mol. Metab. 2021, 52, 101255. [Google Scholar] [CrossRef]
- Chang, S.-G.; Choi, K.-D.; Jang, S.-H.; Shin, H.-C. Role of Disulfide Bonds in the Structure and Activity of Human Insulin. Mol. Cells 2003, 16, 323–330. [Google Scholar]
- Arunagiri, A.; Haataja, L.; Pottekat, A.; Pamenan, F.; Kim, S.; Zeltser, L.M.; Paton, A.W.; Paton, J.C.; Tsai, B.; Itkin-Ansari, P.; et al. Proinsulin Misfolding Is an Early Event in the Progression to Type 2 Diabetes. eLife 2019, 8, e44532. [Google Scholar] [CrossRef]
- Weiss, M.; Steiner, D.F.; Philipson, L.H. Insulin Biosynthesis, Secretion, Structure, and Structure-Activity Relationships. In Endotext; Feingold, K.R., Anawalt, B., Boyce, A., Chrousos, G., de Herder, W.W., Dhatariya, K., Dungan, K., Hershman, J.M., Hofland, J., Kalra, S., et al., Eds.; MDText.com, Inc.: South Dartmouth, MA, USA, 2000. [Google Scholar]
- Dalbey, R.E.; Lively, M.O.; Bron, S.; van Dijl, J.M. The Chemistry and Enzymology of the Type I Signal Peptidases. Protein Sci. 1997, 6, 1129–1138. [Google Scholar] [CrossRef] [PubMed]
- Meur, G.; Simon, A.; Harun, N.; Virally, M.; Dechaume, A.; Bonnefond, A.; Fetita, S.; Tarasov, A.I.; Guillausseau, P.-J.; Boesgaard, T.W.; et al. Insulin Gene Mutations Resulting in Early-Onset Diabetes: Marked Differences in Clinical Presentation, Metabolic Status, and Pathogenic Effect through Endoplasmic Reticulum Retention. Diabetes 2010, 59, 653–661. [Google Scholar] [CrossRef] [PubMed]
- Liu, M.; Lara-Lemus, R.; Shan, S.; Wright, J.; Haataja, L.; Barbetti, F.; Guo, H.; Larkin, D.; Arvan, P. Impaired Cleavage of Preproinsulin Signal Peptide Linked to Autosomal-Dominant Diabetes. Diabetes 2012, 61, 828–837. [Google Scholar] [CrossRef] [PubMed]
- Rajan, S.; Eames, S.C.; Park, S.-Y.; Labno, C.; Bell, G.I.; Prince, V.E.; Philipson, L.H. In Vitro Processing and Secretion of Mutant Insulin Proteins That Cause Permanent Neonatal Diabetes. Am. J. Physiol. Endocrinol. Metab. 2010, 298, E403–E410. [Google Scholar] [CrossRef]
- Polak, M.; Dechaume, A.; Cavé, H.; Nimri, R.; Crosnier, H.; Sulmont, V.; de Kerdanet, M.; Scharfmann, R.; Lebenthal, Y.; Froguel, P.; et al. Heterozygous Missense Mutations in the Insulin Gene Are Linked to Permanent Diabetes Appearing in the Neonatal Period or in Early Infancy: A Report from the French ND (Neonatal Diabetes) Study Group. Diabetes 2008, 57, 1115–1119. [Google Scholar] [CrossRef]
- Dimova, R.; Tankova, T.; Gergelcheva, I.; Tournev, I.; Konstantinova, M. A Family with Permanent Neonatal Diabetes Due to a Novel Mutation in INS Gene. Diabetes Res. Clin. Pr. 2015, 108, e28–e30. [Google Scholar] [CrossRef]
- Yang, Y.; Hua, Q.-X.; Liu, J.; Shimizu, E.H.; Choquette, M.H.; Mackin, R.B.; Weiss, M.A. Solution Structure of Proinsulin: Connecting Domain Flexibility and Prohormone Processing. J. Biol. Chem. 2010, 285, 7847–7851. [Google Scholar] [CrossRef]
- Todorova, N.; Marinelli, F.; Piana, S.; Yarovsky, I. Exploring the Folding Free Energy Landscape of Insulin Using Bias Exchange Metadynamics. J. Phys. Chem. B 2009, 113, 3556–3564. [Google Scholar] [CrossRef]
- Rege, N.K.; Liu, M.; Yang, Y.; Dhayalan, B.; Wickramasinghe, N.P.; Chen, Y.-S.; Rahimi, L.; Guo, H.; Haataja, L.; Sun, J.; et al. Evolution of Insulin at the Edge of Foldability and Its Medical Implications. Proc. Natl. Acad. Sci. USA 2020, 117, 29618–29628. [Google Scholar] [CrossRef]
- Weiss, M.A.; Nguyen, D.T.; Khait, I.; Inouye, K.; Frank, B.H.; Beckage, M.; O’Shea, E.; Shoelson, S.E.; Karplus, M.; Neuringer, L.J. Two-Dimensional NMR and Photo-CIDNP Studies of the Insulin Monomer: Assignment of Aromatic Resonances with Application to Protein Folding, Structure, and Dynamics. Biochemistry 1989, 28, 9855–9873. [Google Scholar] [CrossRef]
- Yang, Y.; Chan, L. Monogenic Diabetes: What It Teaches Us on the Common Forms of Type 1 and Type 2 Diabetes. Endocr. Rev. 2016, 37, 190–222. [Google Scholar] [CrossRef]
- Nishi, M.; Nanjo, K. Insulin Gene Mutations and Diabetes. J. Diabetes Investig. 2011, 2, 92–100. [Google Scholar] [CrossRef]
- Støy, J.; Steiner, D.F.; Park, S.-Y.; Ye, H.; Philipson, L.H.; Bell, G.I. Clinical and Molecular Genetics of Neonatal Diabetes Due to Mutations in the Insulin Gene. Rev. Endocr. Metab. Disord. 2010, 11, 205–215. [Google Scholar] [CrossRef]
- Park, S.-Y.; Ye, H.; Steiner, D.F.; Bell, G.I. Mutant Proinsulin Proteins Associated with Neonatal Diabetes Are Retained in the Endoplasmic Reticulum and Not Efficiently Secreted. Biochem. Biophys. Res. Commun. 2010, 391, 1449–1454. [Google Scholar] [CrossRef]
- Arunagiri, A.; Haataja, L.; Cunningham, C.N.; Shrestha, N.; Tsai, B.; Qi, L.; Liu, M.; Arvan, P. Misfolded Proinsulin in the Endoplasmic Reticulum during Development of Beta Cell Failure in Diabetes. Ann. N. Y. Acad. Sci. 2018, 1418, 5–19. [Google Scholar] [CrossRef]
- Allen, J.R.; Nguyen, L.X.; Sargent, K.E.G.; Lipson, K.L.; Hackett, A.; Urano, F. High ER Stress in Beta-Cells Stimulates Intracellular Degradation of Misfolded Insulin. Biochem. Biophys. Res. Commun. 2004, 324, 166–170. [Google Scholar] [CrossRef]
- Costes, S. Targeting Protein Misfolding to Protect Pancreatic Beta-Cells in Type 2 Diabetes. Curr. Opin. Pharmacol. 2018, 43, 104–110. [Google Scholar] [CrossRef]
- Brange, J.; Andersen, L.; Laursen, E.D.; Meyn, G.; Rasmussen, E. Toward Understanding Insulin Fibrillation. J. Pharm. Sci. 1997, 86, 517–525. [Google Scholar] [CrossRef]
- Choi, J.H.; May, B.C.H.; Wille, H.; Cohen, F.E. Molecular Modeling of the Misfolded Insulin Subunit and Amyloid Fibril. Biophys. J. 2009, 97, 3187–3195. [Google Scholar] [CrossRef]
- Haataja, L.; Snapp, E.; Wright, J.; Liu, M.; Hardy, A.B.; Wheeler, M.B.; Markwardt, M.L.; Rizzo, M.A.; Arvan, P. Proinsulin Intermolecular Interactions during Secretory Trafficking in Pancreatic β Cells. J. Biol. Chem. 2013, 288, 1896–1906. [Google Scholar] [CrossRef]
- Weiss, M.A.; Lawrence, M.C. A Thing of Beauty: Structure and Function of Insulin’s “Aromatic Triplet”. Diabetes Obes. Metab. 2018, 20, 51–63. [Google Scholar] [CrossRef] [PubMed]
- Gorai, B.; Vashisth, H. Progress in Simulation Studies of Insulin Structure and Function. Front. Endocrinol. 2022, 13, 908724. [Google Scholar] [CrossRef]
- Raghunathan, S.; El Hage, K.; Desmond, J.L.; Zhang, L.; Meuwly, M. The Role of Water in the Stability of Wild-Type and Mutant Insulin Dimers. J. Phys. Chem. B 2018, 122, 7038–7048. [Google Scholar] [CrossRef] [PubMed]
- Derewenda, U.; Derewenda, Z.; Dodson, G.G.; Hubbard, R.E.; Korber, F. Molecular Structure of Insulin: The Insulin Monomer and Its Assembly. Br. Med. Bull. 1989, 45, 4–18. [Google Scholar] [CrossRef] [PubMed]
- Pandyarajan, V.; Phillips, N.B.; Rege, N.; Lawrence, M.C.; Whittaker, J.; Weiss, M.A. Contribution of TyrB26 to the Function and Stability of Insulin. J. Biol. Chem. 2016, 291, 12978–12990. [Google Scholar] [CrossRef]
- Hostens, K.; Pavlovic, D.; Zambre, Y.; Ling, Z.; Van Schravendijk, C.; Eizirik, D.L.; Pipeleers, D.G. Exposure of Human Islets to Cytokines Can Result in Disproportionately Elevated Proinsulin Release. J. Clin. Invest. 1999, 104, 67–72. [Google Scholar] [CrossRef]
- Kahn, S.E.; Halban, P.A. Release of Incompletely Processed Proinsulin Is the Cause of the Disproportionate Proinsulinemia of NIDDM. Diabetes 1997, 46, 1725–1732. [Google Scholar] [CrossRef]
- Grill, V.; Pigon, J.; Hartling, S.G.; Binder, C.; Efendic, S. Effects of Dexamethasone on Glucose-Induced Insulin and Proinsulin Release in Low and High Insulin Responders. Metabolism 1990, 39, 251–258. [Google Scholar] [CrossRef]
- Davidson, H.W.; Rhodes, C.J.; Hutton, J.C. Intraorganellar Calcium and PH Control Proinsulin Cleavage in the Pancreatic Beta Cell via Two Distinct Site-Specific Endopeptidases. Nature 1988, 333, 93–96. [Google Scholar] [CrossRef]
- Goodge, K.A.; Hutton, J.C. Translational Regulation of Proinsulin Biosynthesis and Proinsulin Conversion in the Pancreatic Beta-Cell. Semin. Cell Dev. Biol. 2000, 11, 235–242. [Google Scholar] [CrossRef]
- Smeekens, S.P.; Montag, A.G.; Thomas, G.; Albiges-Rizo, C.; Carroll, R.; Benig, M.; Phillips, L.A.; Martin, S.; Ohagi, S.; Gardner, P. Proinsulin Processing by the Subtilisin-Related Proprotein Convertases Furin, PC2, and PC3. Proc. Natl. Acad. Sci. USA 1992, 89, 8822–8826. [Google Scholar] [CrossRef]
- Orci, L.; Halban, P.; Perrelet, A.; Amherdt, M.; Ravazzola, M.; Anderson, R.G. PH-Independent and -Dependent Cleavage of Proinsulin in the Same Secretory Vesicle. J. Cell Biol. 1994, 126, 1149–1156. [Google Scholar] [CrossRef]
- Shibasaki, Y.; Kawakami, T.; Kanazawa, Y.; Akanuma, Y.; Takaku, F. Posttranslational Cleavage of Proinsulin Is Blocked by a Point Mutation in Familial Hyperproinsulinemia. J. Clin. Invest. 1985, 76, 378–380. [Google Scholar] [CrossRef]
- Rhodes, C.J.; Alarcón, C. What Beta-Cell Defect Could Lead to Hyperproinsulinemia in NIDDM? Some Clues from Recent Advances Made in Understanding the Proinsulin-Processing Mechanism. Diabetes 1994, 43, 511–517. [Google Scholar] [CrossRef]
- Michael, J.; Carroll, R.; Swift, H.H.; Steiner, D.F. Studies on the Molecular Organization of Rat Insulin Secretory Granules. J. Biol. Chem. 1987, 262, 16531–16535. [Google Scholar] [CrossRef]
- Davidson, H.W.; Wenzlau, J.M.; O’Brien, R.M. Zinc Transporter 8 (ZnT8) and β Cell Function. Trends Endocrinol. Metab. 2014, 25, 415–424. [Google Scholar] [CrossRef]
- Mukherjee, S.; Mondal, S.; Deshmukh, A.A.; Gopal, B.; Bagchi, B. What Gives an Insulin Hexamer Its Unique Shape and Stability? Role of Ten Confined Water Molecules. J. Phys. Chem. B 2018, 122, 1631–1637. [Google Scholar] [CrossRef]
- Weiss, M.A. The Structure and Function of Insulin: Decoding the TR Transition. Vitam. Horm. 2009, 80, 33–49. [Google Scholar] [CrossRef]
- Chang, X.; Jorgensen, A.M.; Bardrum, P.; Led, J.J. Solution Structures of the R6 Human Insulin Hexamer. Biochemistry 1997, 36, 9409–9422. [Google Scholar] [CrossRef]
- Omar-Hmeadi, M.; Idevall-Hagren, O. Insulin Granule Biogenesis and Exocytosis. Cell. Mol. Life Sci. 2021, 78, 1957–1970. [Google Scholar] [CrossRef]
- Newsholme, P.; Krause, M. Nutritional Regulation of Insulin Secretion: Implications for Diabetes. Clin. Biochem. Rev. 2012, 33, 35–47. [Google Scholar] [PubMed]
- Secretion of Insulin in Response to Diet and Hormones. Pancreapedia Exocrine Pancreas Knowledge Base; Version 2; American Pancreatic Association, Posted 23 December 2020. Available online: https://doi.org/10.3998/panc.2020.16 (accessed on 6 December 2022).
- Suckale, J.; Solimena, M. The Insulin Secretory Granule as a Signaling Hub. Trends Endocrinol. Metab. 2010, 21, 599–609. [Google Scholar] [CrossRef] [PubMed]
- Kelley, K.M.; Schmidt, K.E.; Berg, L.; Sak, K.; Galima, M.M.; Gillespie, C.; Balogh, L.; Hawayek, A.; Reyes, J.A.; Jamison, M. Comparative Endocrinology of the Insulin-like Growth Factor-Binding Protein. J. Endocrinol. 2002, 175, 3–18. [Google Scholar] [CrossRef] [PubMed]
- Froesch, E.R.; Zapf, J. Insulin-like Growth Factors and Insulin: Comparative Aspects. Diabetologia 1985, 28, 485–493. [Google Scholar] [CrossRef] [PubMed]
- Pullen, R.A.; Lindsay, D.G.; Wood, S.P.; Tickle, I.J.; Blundell, T.L.; Wollmer, A.; Krail, G.; Brandenburg, D.; Zahn, H.; Gliemann, J.; et al. Receptor-Binding Region of Insulin. Nature 1976, 259, 369–373. [Google Scholar] [CrossRef] [PubMed]
- Papaioannou, A.; Kuyucak, S.; Kuncic, Z. Molecular Dynamics Simulations of Insulin: Elucidating the Conformational Changes That Enable Its Binding. PLoS ONE 2015, 10, e0144058. [Google Scholar] [CrossRef]
- Li, J.; Park, J.; Mayer, J.P.; Webb, K.J.; Uchikawa, E.; Wu, J.; Liu, S.; Zhang, X.; Stowell, M.H.B.; Choi, E.; et al. Synergistic Activation of the Insulin Receptor via Two Distinct Sites. Nat. Struct. Mol. Biol. 2022, 29, 357–368. [Google Scholar] [CrossRef]
- Uchikawa, E.; Choi, E.; Shang, G.; Yu, H.; Bai, X.-C. Activation Mechanism of the Insulin Receptor Revealed by Cryo-EM Structure of the Fully Liganded Receptor-Ligand Complex. eLife 2019, 8, e48630. [Google Scholar] [CrossRef]
- Menting, J.G.; Whittaker, J.; Margetts, M.B.; Whittaker, L.J.; Kong, G.K.-W.; Smith, B.J.; Watson, C.J.; Záková, L.; Kletvíková, E.; Jiráček, J.; et al. How Insulin Engages Its Primary Binding Site on the Insulin Receptor. Nature 2013, 493, 241–245. [Google Scholar] [CrossRef]
- De Meyts, P. Insulin/Receptor Binding: The Last Piece of the Puzzle? What Recent Progress on the Structure of the Insulin/Receptor Complex Tells Us (or Not) about Negative Cooperativity and Activation. Bioessays 2015, 37, 389–397. [Google Scholar] [CrossRef]
- Accili, D.; Cama, A.; Barbetti, F.; Kadowaki, H.; Kadowaki, T.; Taylor, S.I. Insulin Resistance Due to Mutations of the Insulin Receptor Gene: An Overview. J. Endocrinol. Invest. 1992, 15, 857–864. [Google Scholar] [CrossRef]
- Taylor, S.I.; Cama, A.; Accili, D.; Barbetti, F.; Quon, M.J.; de la Luz Sierra, M.; Suzuki, Y.; Koller, E.; Levy-Toledano, R.; Wertheimer, E. Mutations in the Insulin Receptor Gene. Endocr. Rev. 1992, 13, 566–595. [Google Scholar] [CrossRef]
- Flier, J.S.; Kahn, C.R.; Jarrett, D.B.; Roth, J. Characterization of Antibodies to the Insulin Receptor: A Cause of Insulin-Resistant Diabetes in Man. J. Clin. Invest. 1976, 58, 1442–1449. [Google Scholar] [CrossRef]
- Flier, J.S.; Kahn, C.R.; Roth, J.; Bar, R.S. Antibodies That Impair Insulin Receptor Binding in an Unusual Diabetic Syndrome with Severe Insulin Resistance. Science 1975, 190, 63–65. [Google Scholar] [CrossRef]
- Najjar, S.M.; Perdomo, G. Hepatic Insulin Clearance: Mechanism and Physiology. Physiology 2019, 34, 198–215. [Google Scholar] [CrossRef]
- Najjar, S.M.; Caprio, S.; Gastaldelli, A. Insulin Clearance in Health and Disease. Annu. Rev. Physiol. 2023, 85, 1. [Google Scholar] [CrossRef]
- Leissring, M.A.; González-Casimiro, C.M.; Merino, B.; Suire, C.N.; Perdomo, G. Targeting Insulin-Degrading Enzyme in Insulin Clearance. Int. J. Mol. Sci. 2021, 22, 2235. [Google Scholar] [CrossRef]
- Poy, M.N.; Yang, Y.; Rezaei, K.; Fernström, M.A.; Lee, A.D.; Kido, Y.; Erickson, S.K.; Najjar, S.M. CEACAM1 Regulates Insulin Clearance in Liver. Nat. Genet. 2002, 30, 270–276. [Google Scholar] [CrossRef]
- Rubenstein, A.H.; Mako, M.E.; Horwitz, D.L. Insulin and the Kidney. Nephron 1975, 15, 306–326. [Google Scholar] [CrossRef]
- Rubenstein, A.H.; Spitz, I. Role of the Kidney in Insulin Metabolism and Excretion. Diabetes 1968, 17, 161–169. [Google Scholar] [CrossRef]
- Duckworth, W.C.; Bennett, R.G.; Hamel, F.G. Insulin Degradation: Progress and Potential. Endocr. Rev. 1998, 19, 608–624. [Google Scholar] [CrossRef] [PubMed]
- Koh, H.-C.E.; Cao, C.; Mittendorfer, B. Insulin Clearance in Obesity and Type 2 Diabetes. Int. J. Mol. Sci. 2022, 23, 596. [Google Scholar] [CrossRef] [PubMed]
- Valera Mora, M.E.; Scarfone, A.; Calvani, M.; Greco, A.V.; Mingrone, G. Insulin Clearance in Obesity. J. Am. Coll. Nutr. 2003, 22, 487–493. [Google Scholar] [CrossRef] [PubMed]
- Bizzotto, R.; Tricò, D.; Natali, A.; Gastaldelli, A.; Muscelli, E.; De Fronzo, R.A.; Arslanian, S.; Ferrannini, E.; Mari, A. New Insights on the Interactions Between Insulin Clearance and the Main Glucose Homeostasis Mechanisms. Diabetes Care 2021, 44, 2115–2123. [Google Scholar] [CrossRef]
- Spoto, B.; Pisano, A.; Zoccali, C. Insulin Resistance in Chronic Kidney Disease: A Systematic Review. Am. J. Physiol. Ren. Physiol. 2016, 311, F1087–F1108. [Google Scholar] [CrossRef]
- Wiseman, M.J.; Saunders, A.J.; Keen, H.; Viberti, G. Effect of Blood Glucose Control on Increased Glomerular Filtration Rate and Kidney Size in Insulin-Dependent Diabetes. N. Engl. J. Med. 1985, 312, 617–621. [Google Scholar] [CrossRef]
- Jones, A.G.; Hattersley, A.T. The Clinical Utility of C-Peptide Measurement in the Care of Patients with Diabetes. Diabet. Med. 2013, 30, 803–817. [Google Scholar] [CrossRef]
- Kamiya, H.; Zhang, W.; Ekberg, K.; Wahren, J.; Sima, A.A.F. C-Peptide Reverses Nociceptive Neuropathy in Type 1 Diabetes. Diabetes 2006, 55, 3581–3587. [Google Scholar] [CrossRef]
- Samnegård, B.; Jacobson, S.H.; Jaremko, G.; Johansson, B.-L.; Ekberg, K.; Isaksson, B.; Eriksson, L.; Wahren, J.; Sjöquist, M. C-Peptide Prevents Glomerular Hypertrophy and Mesangial Matrix Expansion in Diabetic Rats. Nephrol. Dial. Transpl. 2005, 20, 532–538. [Google Scholar] [CrossRef]
- Johansson, J.; Ekberg, K.; Shafqat, J.; Henriksson, M.; Chibalin, A.; Wahren, J.; Jörnvall, H. Molecular Effects of Proinsulin C-Peptide. Biochem. Biophys. Res. Commun. 2002, 295, 1035–1040. [Google Scholar] [CrossRef]
- Rigler, R.; Pramanik, A.; Jonasson, P.; Kratz, G.; Jansson, O.T.; Nygren, P.; Stâhl, S.; Ekberg, K.; Johansson, B.; Uhlén, S.; et al. Specific Binding of Proinsulin C-Peptide to Human Cell Membranes. Proc. Natl. Acad. Sci. USA 1999, 96, 13318–13323. [Google Scholar] [CrossRef]
- Galloway, J.A.; Hooper, S.A.; Spradlin, C.T.; Howey, D.C.; Frank, B.H.; Bowsher, R.R.; Anderson, J.H. Biosynthetic Human Proinsulin. Review of Chemistry, in Vitro and in Vivo Receptor Binding, Animal and Human Pharmacology Studies, and Clinical Trial Experience. Diabetes Care 1992, 15, 666–692. [Google Scholar] [CrossRef]
- Steiner, D.F. On the Role of the Proinsulin C-Peptide. Diabetes 1978, 27 (Suppl. 1), 145–148. [Google Scholar] [CrossRef]
- Mahajan, A.; Wessel, J.; Willems, S.M.; Zhao, W.; Robertson, N.R.; Chu, A.Y.; Gan, W.; Kitajima, H.; Taliun, D.; Rayner, N.W.; et al. Refining the Accuracy of Validated Target Identification through Coding Variant Fine-Mapping in Type 2 Diabetes. Nat. Genet. 2018, 50, 559–571. [Google Scholar] [CrossRef]
- Little, R.R.; Wielgosz, R.I.; Josephs, R.; Kinumi, T.; Takatsu, A.; Li, H.; Stein, D.; Burns, C. Implementing a Reference Measurement System for C-Peptide: Successes and Lessons Learned. Clin. Chem. 2017, 63, 1447–1456. [Google Scholar] [CrossRef]
- Kuzuya, H.; Blix, P.M.; Horwitz, D.L.; Steiner, D.F.; Rubenstein, A.H. Determination of Free and Total Insulin and C-Peptide in Insulin-Treated Diabetics. Diabetes 1977, 26, 22–29. [Google Scholar] [CrossRef]
- Davis, A.K.; DuBose, S.N.; Haller, M.J.; Miller, K.M.; DiMeglio, L.A.; Bethin, K.E.; Goland, R.S.; Greenberg, E.M.; Liljenquist, D.R.; Ahmann, A.J.; et al. Prevalence of Detectable C-Peptide According to Age at Diagnosis and Duration of Type 1 Diabetes. Diabetes Care 2015, 38, 476–481. [Google Scholar] [CrossRef]
- Bonser, A.M.; Garcia-Webb, P. C-Peptide Measurement: Methods and Clinical Utility. Crit. Rev. Clin. Lab. Sci. 1984, 19, 297–352. [Google Scholar] [CrossRef]
- Little, R.R.; Rohlfing, C.L.; Tennill, A.L.; Madsen, R.W.; Polonsky, K.S.; Myers, G.L.; Greenbaum, C.J.; Palmer, J.P.; Rogatsky, E.; Stein, D.T. Standardization of C-Peptide Measurements. Clin. Chem. 2008, 54, 1023–1026. [Google Scholar] [CrossRef]
- Leighton, E.; Sainsbury, C.A.; Jones, G.C. A Practical Review of C-Peptide Testing in Diabetes. Diabetes Ther. 2017, 8, 475–487. [Google Scholar] [CrossRef]
- Faber, O.K.; Binder, C.; Markussen, J.; Heding, L.G.; Naithani, V.K.; Kuzuya, H.; Blix, P.; Horwitz, D.L.; Rubenstein, A.H. Characterization of Seven C-Peptide Antisera. Diabetes 1978, 27 (Suppl. 1), 170–177. [Google Scholar] [CrossRef] [PubMed]
- Halban, P.A. Proinsulin Processing in the Regulated and the Constitutive Secretory Pathway. Diabetologia 1994, 37 (Suppl. 2), S65–S72. [Google Scholar] [CrossRef] [PubMed]
- Stoll, R.W.; Touber, J.L.; Menahan, L.A.; Williams, R.H. Clearance of Porcine Insulin, Proinsulin, and Connecting Peptide by the Isolated Rat Liver. Proc. Soc. Exp. Biol. Med. 1970, 133, 894–896. [Google Scholar] [CrossRef] [PubMed]
- Rubenstein, A.H.; Pottenger, L.A.; Mako, M.; Getz, G.S.; Steiner, D.F. The Metabolism of Proinsulin and Insulin by the Liver. J. Clin. Invest. 1972, 51, 912–921. [Google Scholar] [CrossRef]
- Peavy, D.E.; Brunner, M.R.; Duckworth, W.C.; Hooker, C.S.; Frank, B.H. Receptor Binding and Biological Potency of Several Split Forms (Conversion Intermediates) of Human Proinsulin. Studies in Cultured IM-9 Lymphocytes and in Vivo and in Vitro in Rats. J. Biol. Chem. 1985, 260, 13989–13994. [Google Scholar] [CrossRef]
- Peavy, D.E.; Abram, J.D.; Frank, B.H.; Duckworth, W.C. In Vitro Activity of Biosynthetic Human Proinsulin. Receptor Binding and Biologic Potency of Proinsulin and Insulin in Isolated Rat Adipocytes. Diabetes 1984, 33, 1062–1067. [Google Scholar] [CrossRef]
- Prager, R.; Schernthaner, G. Receptor Binding Properties of Human Insulin (Recombinant DNA) and Human Proinsulin and Their Interaction at the Receptor Site. Diabetes Care 1982, 5 (Suppl. 2), 104–106. [Google Scholar] [CrossRef]
- Malaguarnera, R.; Sacco, A.; Voci, C.; Pandini, G.; Vigneri, R.; Belfiore, A. Proinsulin Binds with High Affinity the Insulin Receptor Isoform A and Predominantly Activates the Mitogenic Pathway. Endocrinology 2012, 153, 2152–2163. [Google Scholar] [CrossRef]
- Papaioannou, A.; Kuyucak, S.; Kuncic, Z. Elucidating the Activation Mechanism of the Insulin-Family Proteins with Molecular Dynamics Simulations. PLoS ONE 2016, 11, e0161459. [Google Scholar] [CrossRef]
- Frasca, F.; Pandini, G.; Scalia, P.; Sciacca, L.; Mineo, R.; Costantino, A.; Goldfine, I.D.; Belfiore, A.; Vigneri, R. Insulin Receptor Isoform A, a Newly Recognized, High-Affinity Insulin-like Growth Factor II Receptor in Fetal and Cancer Cells. Mol. Cell. Biol. 1999, 19, 3278–3288. [Google Scholar] [CrossRef]
- Storlien, L.H.; Higgins, J.A.; Thomas, T.C.; Brown, M.A.; Wang, H.Q.; Huang, X.F.; Else, P.L. Diet Composition and Insulin Action in Animal Models. Br. J. Nutr. 2000, 83 (Suppl. 1), S85–S90. [Google Scholar] [CrossRef]
- Sah, S.P.; Singh, B.; Choudhary, S.; Kumar, A. Animal Models of Insulin Resistance: A Review. Pharmacol. Rep. 2016, 68, 1165–1177. [Google Scholar] [CrossRef]
- King, A.J.F. The Use of Animal Models in Diabetes Research. Br. J. Pharmacol. 2012, 166, 877–894. [Google Scholar] [CrossRef]
- Rees, D.A.; Alcolado, J.C. Animal Models of Diabetes Mellitus. Diabet. Med. 2005, 22, 359–370. [Google Scholar] [CrossRef]
- Moriyama, H.; Abiru, N.; Paronen, J.; Sikora, K.; Liu, E.; Miao, D.; Devendra, D.; Beilke, J.; Gianani, R.; Gill, R.G.; et al. Evidence for a Primary Islet Autoantigen (Preproinsulin 1) for Insulitis and Diabetes in the Nonobese Diabetic Mouse. Proc. Natl. Acad. Sci. USA 2003, 100, 10376–10381. [Google Scholar] [CrossRef]
- Mehran, A.E.; Templeman, N.M.; Brigidi, G.S.; Lim, G.E.; Chu, K.-Y.; Hu, X.; Botezelli, J.D.; Asadi, A.; Hoffman, B.G.; Kieffer, T.J.; et al. Hyperinsulinemia Drives Diet-Induced Obesity Independently of Brain Insulin Production. Cell Metab. 2012, 16, 723–737. [Google Scholar] [CrossRef]
- Clark, J.L.; Steiner, D.F. Insulin Biosynthesis in the Rat: Demonstration of Two Proinsulins. Proc. Natl. Acad. Sci. USA 1969, 62, 278–285. [Google Scholar] [CrossRef]
- Edlund, T.; Walker, M.D.; Barr, P.J.; Rutter, W.J. Cell-Specific Expression of the Rat Insulin Gene: Evidence for Role of Two Distinct 5’ Flanking Elements. Science 1985, 230, 912–916. [Google Scholar] [CrossRef]
- Papasani, M.R.; Robison, B.D.; Hardy, R.W.; Hill, R.A. Early Developmental Expression of Two Insulins in Zebrafish (Danio Rerio). Physiol. Genom. 2006, 27, 79–85. [Google Scholar] [CrossRef]
- Londraville, R.L.; Prokop, J.W.; Duff, R.J.; Liu, Q.; Tuttle, M. On the Molecular Evolution of Leptin, Leptin Receptor, and Endospanin. Front. Endocrinol. 2017, 8, 58. [Google Scholar] [CrossRef]
- Wernersson, R.; Frogne, T.; Rescan, C.; Hansson, L.; Bruun, C.; Grønborg, M.; Jensen, J.N.; Madsen, O.D. Analysis Artefacts of the INS-IGF2 Fusion Transcript. BMC Mol. Biol. 2015, 16, 13. [Google Scholar] [CrossRef] [PubMed]
- Bailetti, D.; Sentinelli, F.; Prudente, S.; Cimini, F.A.; Barchetta, I.; Totaro, M.; Di Costanzo, A.; Barbonetti, A.; Leonetti, F.; Cavallo, M.G.; et al. Deep Resequencing of 9 Candidate Genes Identifies a Role for ARAP1 and IGF2BP2 in Modulating Insulin Secretion Adjusted for Insulin Resistance in Obese Southern Europeans. Int. J. Mol. Sci. 2022, 23, 1221. [Google Scholar] [CrossRef] [PubMed]
- Wasserfall, C.; Nick, H.S.; Campbell-Thompson, M.; Beachy, D.; Haataja, L.; Kusmartseva, I.; Posgai, A.; Beery, M.; Rhodes, C.; Bonifacio, E.; et al. Persistence of Pancreatic Insulin MRNA Expression and Proinsulin Protein in Type 1 Diabetes Pancreata. Cell Metab. 2017, 26, 568–575. [Google Scholar] [CrossRef] [PubMed]
- Kanatsuna, N.; Delli, A.; Andersson, C.; Nilsson, A.-L.; Vaziri-Sani, F.; Larsson, K.; Carlsson, A.; Cedervall, E.; Jönsson, B.; Neiderud, J.; et al. Doubly Reactive INS-IGF2 Autoantibodies in Children with Newly Diagnosed Autoimmune (Type 1) Diabetes. Scand. J. Immunol. 2015, 82, 361–369. [Google Scholar] [CrossRef]
- Rotwein, P. The Insulin-like Growth Factor 2 Gene and Locus in Nonmammalian Vertebrates: Organizational Simplicity with Duplication but Limited Divergence in Fish. J. Biol. Chem. 2018, 293, 15912–15932. [Google Scholar] [CrossRef]
- Brosch, M.; Saunders, G.I.; Frankish, A.; Collins, M.O.; Yu, L.; Wright, J.; Verstraten, R.; Adams, D.J.; Harrow, J.; Choudhary, J.S.; et al. Shotgun Proteomics Aids Discovery of Novel Protein-Coding Genes, Alternative Splicing, and “Resurrected” Pseudogenes in the Mouse Genome. Genome Res. 2011, 21, 756–767. [Google Scholar] [CrossRef]
- Amarger, V.; Nguyen, M.; Van Laere, A.-S.; Braunschweig, M.; Nezer, C.; Georges, M.; Andersson, L. Comparative Sequence Analysis of the INS-IGF2-H19 Gene Cluster in Pigs. Mamm. Genome 2002, 13, 388–398. [Google Scholar] [CrossRef]
- Sleutels, F.; Tjon, G.; Ludwig, T.; Barlow, D.P. Imprinted Silencing of Slc22a2 and Slc22a3 Does Not Need Transcriptional Overlap between Igf2r and Air. EMBO J. 2003, 22, 3696–3704. [Google Scholar] [CrossRef]
- Rotwein, P. The Complex Genetics of Human Insulin-like Growth Factor 2 Are Not Reflected in Public Databases. J. Biol. Chem. 2018, 293, 4324–4333. [Google Scholar] [CrossRef]
- Monk, D.; Sanches, R.; Arnaud, P.; Apostolidou, S.; Hills, F.A.; Abu-Amero, S.; Murrell, A.; Friess, H.; Reik, W.; Stanier, P.; et al. Imprinting of IGF2 P0 Transcript and Novel Alternatively Spliced INS-IGF2 Isoforms Show Differences between Mouse and Human. Hum. Mol. Genet. 2006, 15, 1259–1269. [Google Scholar] [CrossRef]
- Radhakrishnan, V.K.; Ravichandran, K.; Eke, C.; Ortiz-Vicil, A.; Tan, Q.; De León, M.; De León, D.D. Methylation of a Newly Identified Region of the INS-IGF2 Gene Determines IGF2 Expression in Breast Cancer Tumors and in Breast Cancer Cells. Oncotarget 2020, 11, 3904. [Google Scholar] [CrossRef]
- Barresi, V.; Cosentini, I.; Scuderi, C.; Napoli, S.; Di Bella, V.; Spampinato, G.; Condorelli, D.F. Fusion Transcripts of Adjacent Genes: New Insights into the World of Human Complex Transcripts in Cancer. Int. J. Mol. Sci. 2019, 20, 5252. [Google Scholar] [CrossRef]
- Chung, W.K.; Erion, K.; Florez, J.C.; Hattersley, A.T.; Hivert, M.-F.; Lee, C.G.; McCarthy, M.I.; Nolan, J.J.; Norris, J.M.; Pearson, E.R.; et al. Precision Medicine in Diabetes: A Consensus Report from the American Diabetes Association (ADA) and the European Association for the Study of Diabetes (EASD). Diabetes Care 2020, 43, 1617–1635. [Google Scholar] [CrossRef]
- Bourgeois, S.; Sawatani, T.; Van Mulders, A.; De Leu, N.; Heremans, Y.; Heimberg, H.; Cnop, M.; Staels, W. Towards a Functional Cure for Diabetes Using Stem Cell-Derived Beta Cells: Are We There Yet? Cells 2021, 10, 191. [Google Scholar] [CrossRef]
- Kim, M.-K.; Kim, H.-S.; Lee, I.-K.; Park, K.-G. Endoplasmic Reticulum Stress and Insulin Biosynthesis: A Review. Exp. Diabetes Res. 2012, 2012, 509437. [Google Scholar] [CrossRef]
- Guerrero-Hernández, A.; Leon-Aparicio, D.; Chavez-Reyes, J.; Olivares-Reyes, J.A.; DeJesus, S. Endoplasmic Reticulum Stress in Insulin Resistance and Diabetes. Cell Calcium 2014, 56, 311–322. [Google Scholar] [CrossRef]
- Ozcan, U.; Cao, Q.; Yilmaz, E.; Lee, A.-H.; Iwakoshi, N.N.; Ozdelen, E.; Tuncman, G.; Görgün, C.; Glimcher, L.H.; Hotamisligil, G.S. Endoplasmic Reticulum Stress Links Obesity, Insulin Action, and Type 2 Diabetes. Science 2004, 306, 457–461. [Google Scholar] [CrossRef]
- Nakatani, Y.; Kaneto, H.; Kawamori, D.; Yoshiuchi, K.; Hatazaki, M.; Matsuoka, T.; Ozawa, K.; Ogawa, S.; Hori, M.; Yamasaki, Y.; et al. Involvement of Endoplasmic Reticulum Stress in Insulin Resistance and Diabetes. J. Biol. Chem. 2005, 280, 847–851. [Google Scholar] [CrossRef]
- Salvadó, L.; Palomer, X.; Barroso, E.; Vázquez-Carrera, M. Targeting Endoplasmic Reticulum Stress in Insulin Resistance. Trends Endocrinol. Metab. 2015, 26, 438–448. [Google Scholar] [CrossRef]
- Maltoni, G.; Franceschi, R.; Di Natale, V.; Al-Qaisi, R.; Greco, V.; Bertorelli, R.; De Sanctis, V.; Quattrone, A.; Mantovani, V.; Cauvin, V.; et al. Next Generation Sequencing Analysis of MODY-X Patients: A Case Report Series. J. Pers. Med. 2022, 12, 1613. [Google Scholar] [CrossRef]
- Alam, M.; Arunagiri, A.; Haataja, L.; Torres, M.; Larkin, D.; Kappler, J.; Jin, N.; Arvan, P. Predisposition to Proinsulin Misfolding as a Genetic Risk to Diet-Induced Diabetes. Diabetes 2021, 70, 2580–2594. [Google Scholar] [CrossRef] [PubMed]
- Dean, B.M.; Becker, F.; McNally, J.M.; Tarn, A.C.; Schwartz, G.; Gale, E.A.; Bottazzo, G.F. Insulin Autoantibodies in the Pre-Diabetic Period: Correlation with Islet Cell Antibodies and Development of Diabetes. Diabetologia 1986, 29, 339–342. [Google Scholar] [CrossRef] [PubMed]
- Potter, K.N.; Wilkin, T.J. The Molecular Specificity of Insulin Autoantibodies. Diabetes Metab. Res. Rev. 2000, 16, 338–353. [Google Scholar] [CrossRef] [PubMed]
- Atkinson, M.A.; Maclaren, N.K.; Riley, W.J.; Winter, W.E.; Fisk, D.D.; Spillar, R.P. Are Insulin Autoantibodies Markers for Insulin-Dependent Diabetes Mellitus? Diabetes 1986, 35, 894–898. [Google Scholar] [CrossRef]
- Habener, J.F.; Stoffers, D.A. A Newly Discovered Role of Transcription Factors Involved in Pancreas Development and the Pathogenesis of Diabetes Mellitus. Proc. Assoc. Am. Physicians 1998, 110, 12–21. [Google Scholar]
- Mitchell, S.M.S.; Frayling, T.M. The Role of Transcription Factors in Maturity-Onset Diabetes of the Young. Mol. Genet. Metab. 2002, 77, 35–43. [Google Scholar] [CrossRef]
- Damcott, C.M.; Pollin, T.I.; Reinhart, L.J.; Ott, S.H.; Shen, H.; Silver, K.D.; Mitchell, B.D.; Shuldiner, A.R. Polymorphisms in the Transcription Factor 7-like 2 (TCF7L2) Gene Are Associated with Type 2 Diabetes in the Amish: Replication and Evidence for a Role in Both Insulin Secretion and Insulin Resistance. Diabetes 2006, 55, 2654–2659. [Google Scholar] [CrossRef]
- Navarro Gonzalez, J.; Zweig, A.S.; Speir, M.L.; Schmelter, D.; Rosenbloom, K.R.; Raney, B.J.; Powell, C.C.; Nassar, L.R.; Maulding, N.D.; Lee, C.M.; et al. The UCSC Genome Browser Database: 2021 Update. Nucleic Acids Res. 2021, 49, D1046–D1057. [Google Scholar] [CrossRef]
- Ghoussaini, M.; Mountjoy, E.; Carmona, M.; Peat, G.; Schmidt, E.M.; Hercules, A.; Fumis, L.; Miranda, A.; Carvalho-Silva, D.; Buniello, A.; et al. Open Targets Genetics: Systematic Identification of Trait-Associated Genes Using Large-Scale Genetics and Functional Genomics. Nucleic Acids Res. 2021, 49, D1311–D1320. [Google Scholar] [CrossRef]
- Arnold, M.; Raffler, J.; Pfeufer, A.; Suhre, K.; Kastenmüller, G. SNiPA: An Interactive, Genetic Variant-Centered Annotation Browser. Bioinformatics 2015, 31, 1334–1336. [Google Scholar] [CrossRef]
- Brown, G.R.; Hem, V.; Katz, K.S.; Ovetsky, M.; Wallin, C.; Ermolaeva, O.; Tolstoy, I.; Tatusova, T.; Pruitt, K.D.; Maglott, D.R.; et al. Gene: A Gene-Centered Information Resource at NCBI. Nucleic Acids Res. 2015, 43, D36–D42. [Google Scholar] [CrossRef]
- Tamura, K.; Peterson, D.; Peterson, N.; Stecher, G.; Nei, M.; Kumar, S. MEGA5: Molecular Evolutionary Genetics Analysis Using Maximum Likelihood, Evolutionary Distance, and Maximum Parsimony Methods. Mol. Biol. Evol. 2011, 28, 2731–2739. [Google Scholar] [CrossRef]
- Thompson, J.D.; Higgins, D.G.; Gibson, T.J. CLUSTAL W: Improving the Sensitivity of Progressive Multiple Sequence Alignment through Sequence Weighting, Position-Specific Gap Penalties and Weight Matrix Choice. Nucleic Acids Res. 1994, 22, 4673–4680. [Google Scholar] [CrossRef]
- Papadopoulos, J.S.; Agarwala, R. COBALT: Constraint-Based Alignment Tool for Multiple Protein Sequences. Bioinformatics 2007, 23, 1073–1079. [Google Scholar] [CrossRef]
- Leinonen, R.; Sugawara, H.; Shumway, M. The Sequence Read Archive. Nucleic Acids Res. 2011, 39, D19–D21. [Google Scholar] [CrossRef]
- Frankish, A.; Diekhans, M.; Ferreira, A.-M.; Johnson, R.; Jungreis, I.; Loveland, J.; Mudge, J.M.; Sisu, C.; Wright, J.; Armstrong, J.; et al. GENCODE Reference Annotation for the Human and Mouse Genomes. Nucleic Acids Res. 2019, 47, D766–D773. [Google Scholar] [CrossRef]
- Patro, R.; Duggal, G.; Love, M.I.; Irizarry, R.A.; Kingsford, C. Salmon Provides Fast and Bias-Aware Quantification of Transcript Expression. Nat. Methods 2017, 14, 417–419. [Google Scholar] [CrossRef]
- Starruß, J.; de Back, W.; Brusch, L.; Deutsch, A. Morpheus: A User-Friendly Modeling Environment for Multiscale and Multicellular Systems Biology. Bioinformatics 2014, 30, 1331–1332. [Google Scholar] [CrossRef]
- Berman, H.M.; Westbrook, J.; Feng, Z.; Gilliland, G.; Bhat, T.N.; Weissig, H.; Shindyalov, I.N.; Bourne, P.E. The Protein Data Bank. Nucleic Acids Res. 2000, 28, 235–242. [Google Scholar] [CrossRef]
- Pettersen, E.F.; Goddard, T.D.; Huang, C.C.; Meng, E.C.; Couch, G.S.; Croll, T.I.; Morris, J.H.; Ferrin, T.E. UCSF ChimeraX: Structure Visualization for Researchers, Educators, and Developers. Protein Sci. 2021, 30, 70–82. [Google Scholar] [CrossRef]
- Scapin, G.; Dandey, V.P.; Zhang, Z.; Prosise, W.; Hruza, A.; Kelly, T.; Mayhood, T.; Strickland, C.; Potter, C.S.; Carragher, B. Structure of the Insulin Receptor–Insulin Complex by Single-Particle Cryo-EM Analysis. Nature 2018, 556, 122–125. [Google Scholar] [CrossRef] [PubMed]
Disclaimer/Publisher’s Note: The statements, opinions and data contained in all publications are solely those of the individual author(s) and contributor(s) and not of MDPI and/or the editor(s). MDPI and/or the editor(s) disclaim responsibility for any injury to people or property resulting from any ideas, methods, instructions or products referred to in the content. |
© 2023 by the authors. Licensee MDPI, Basel, Switzerland. This article is an open access article distributed under the terms and conditions of the Creative Commons Attribution (CC BY) license (https://creativecommons.org/licenses/by/4.0/).