

Characteristic Binding Landscape of Estrogen Receptor-α36 Protein Enhances Promising Cancer Drug Design


Abstract
:1. Introduction
2. Methodology
2.1. Homology Modeling
2.2. Active Site Identification
2.3. Molecular Docking Calculations
2.4. Molecular Dynamics (MD) Simulations [33]
2.5. Thermodynamic Parameter Calculations
3. Results and Discussion
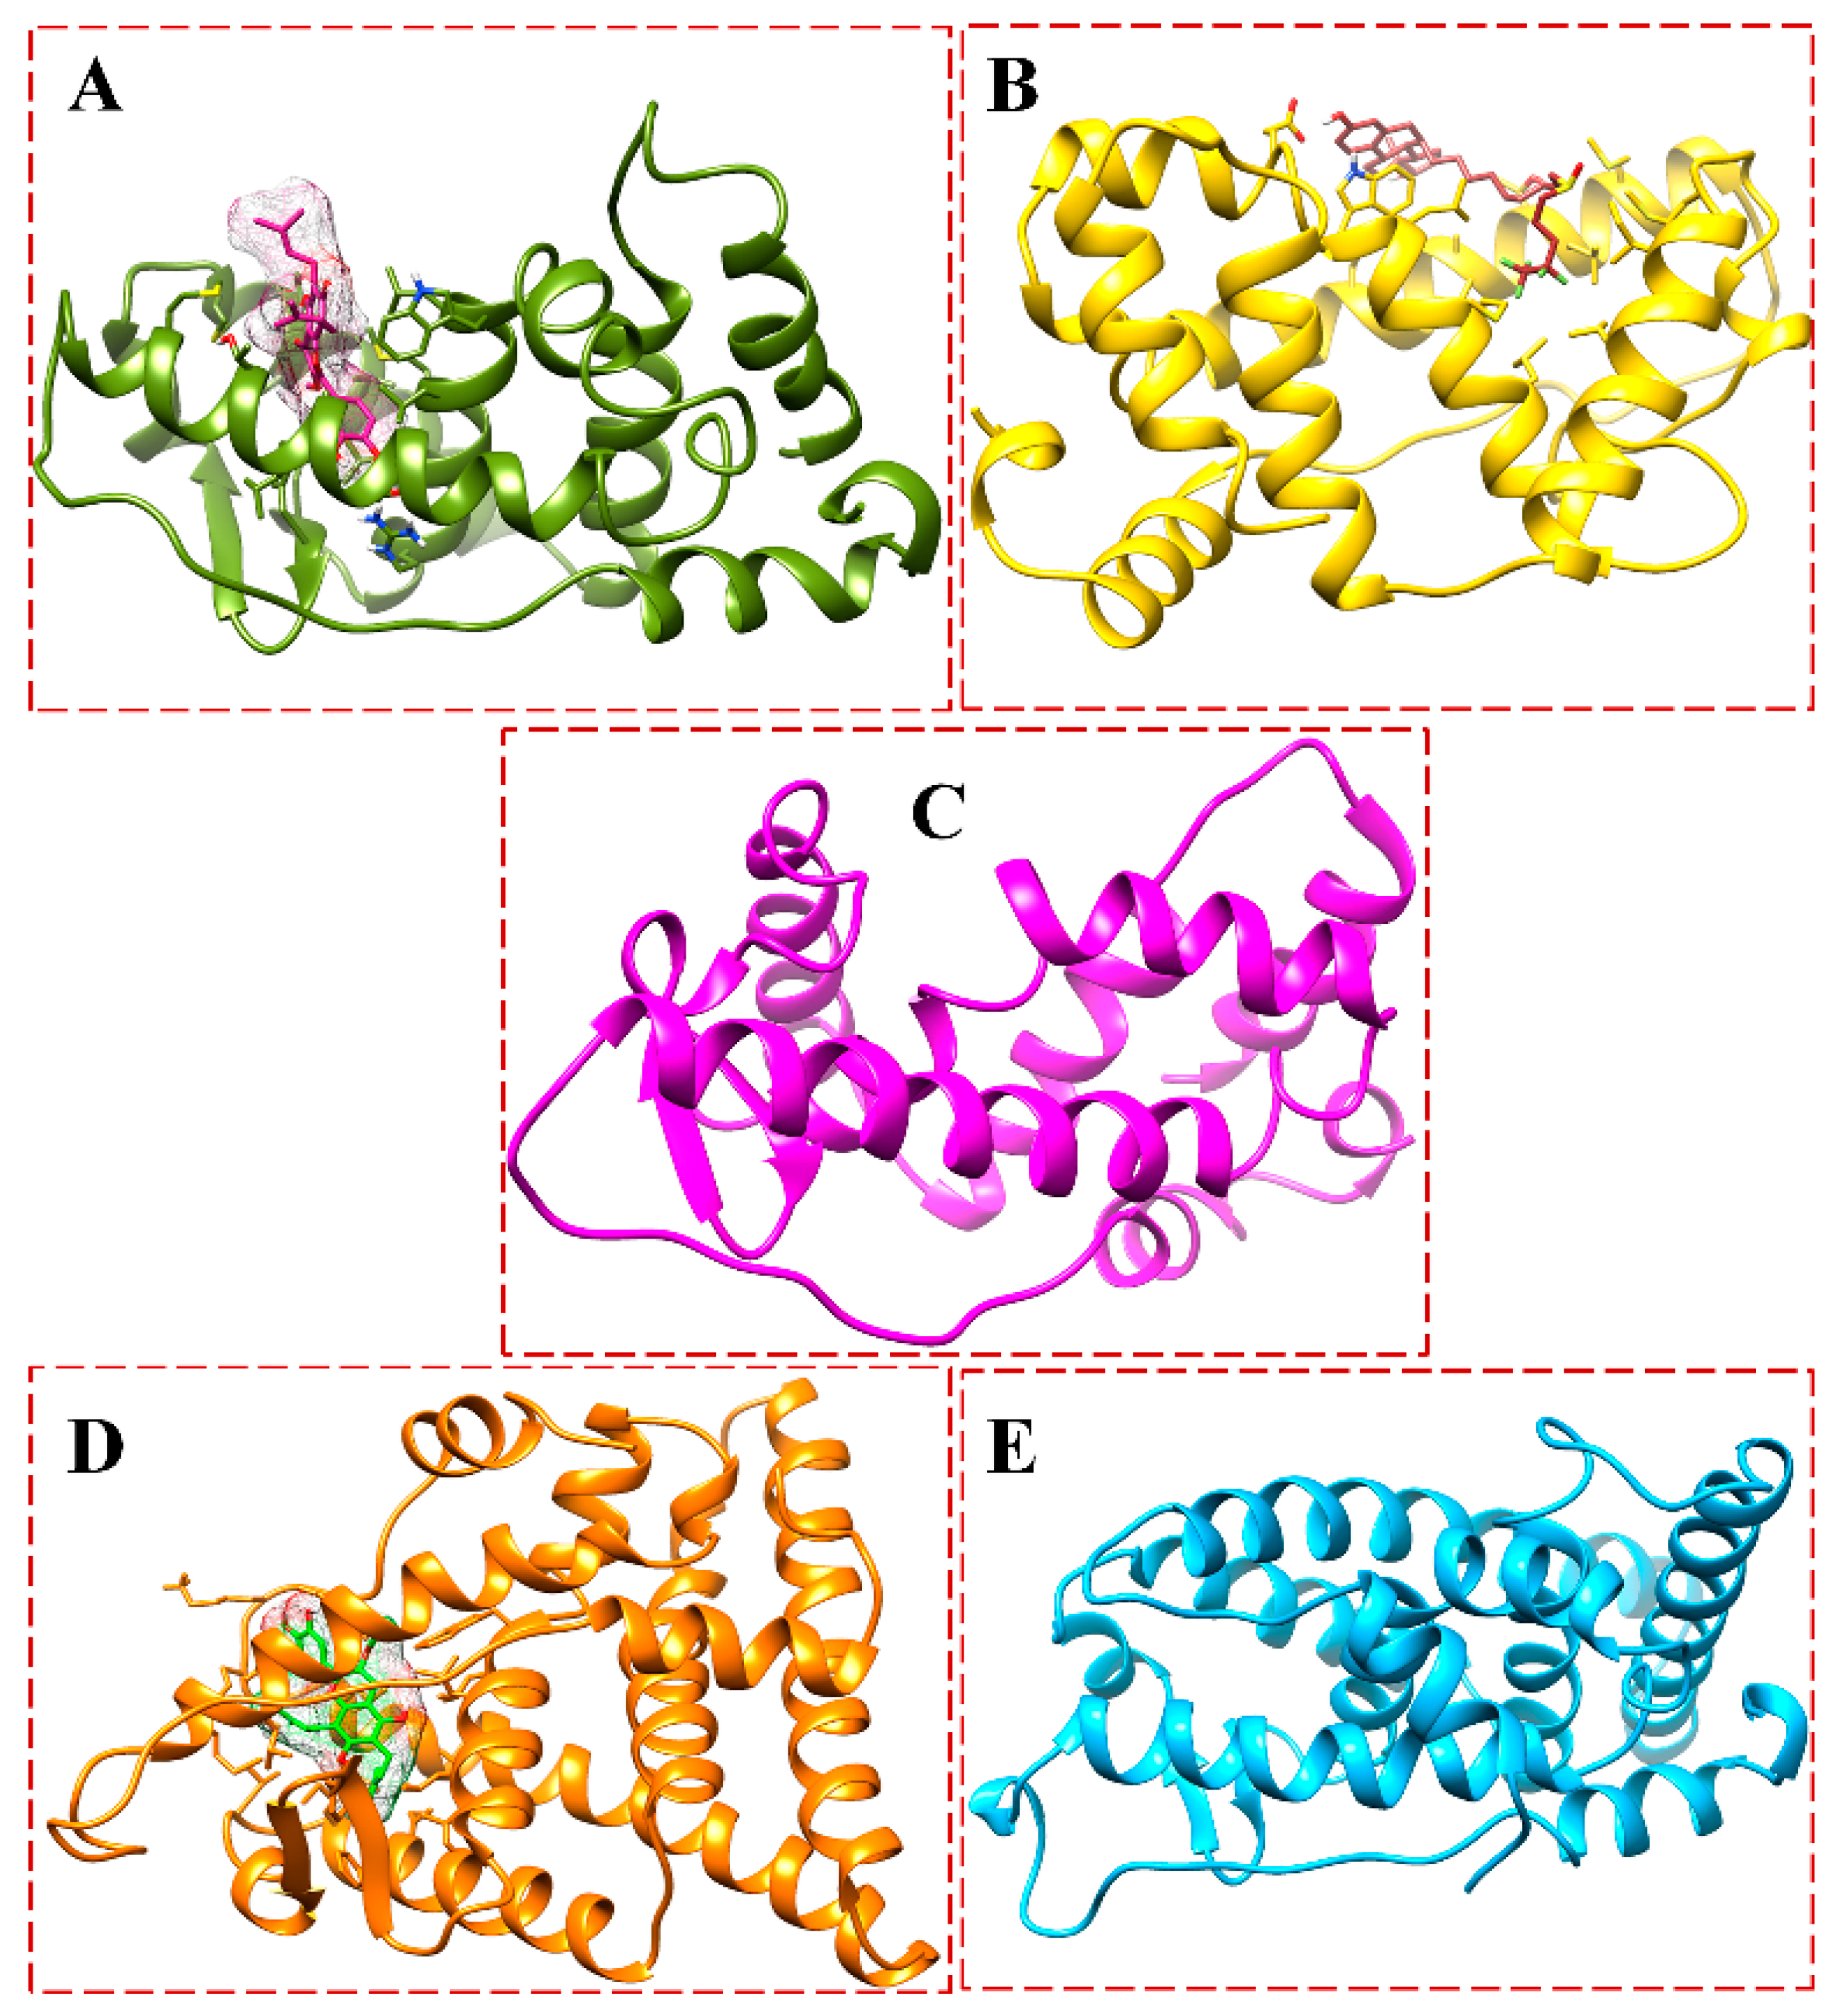
3.1. Structure of the ER-α36 Model and Its Binding Pockets
3.2. Docking Affinity of the Ligands Bound to ER-α36 and ER-α66
3.3. Molecular Dynamics Simulation Analysis
3.3.1. Thermodynamics Calculations Using MMGB(PB)SA Methods
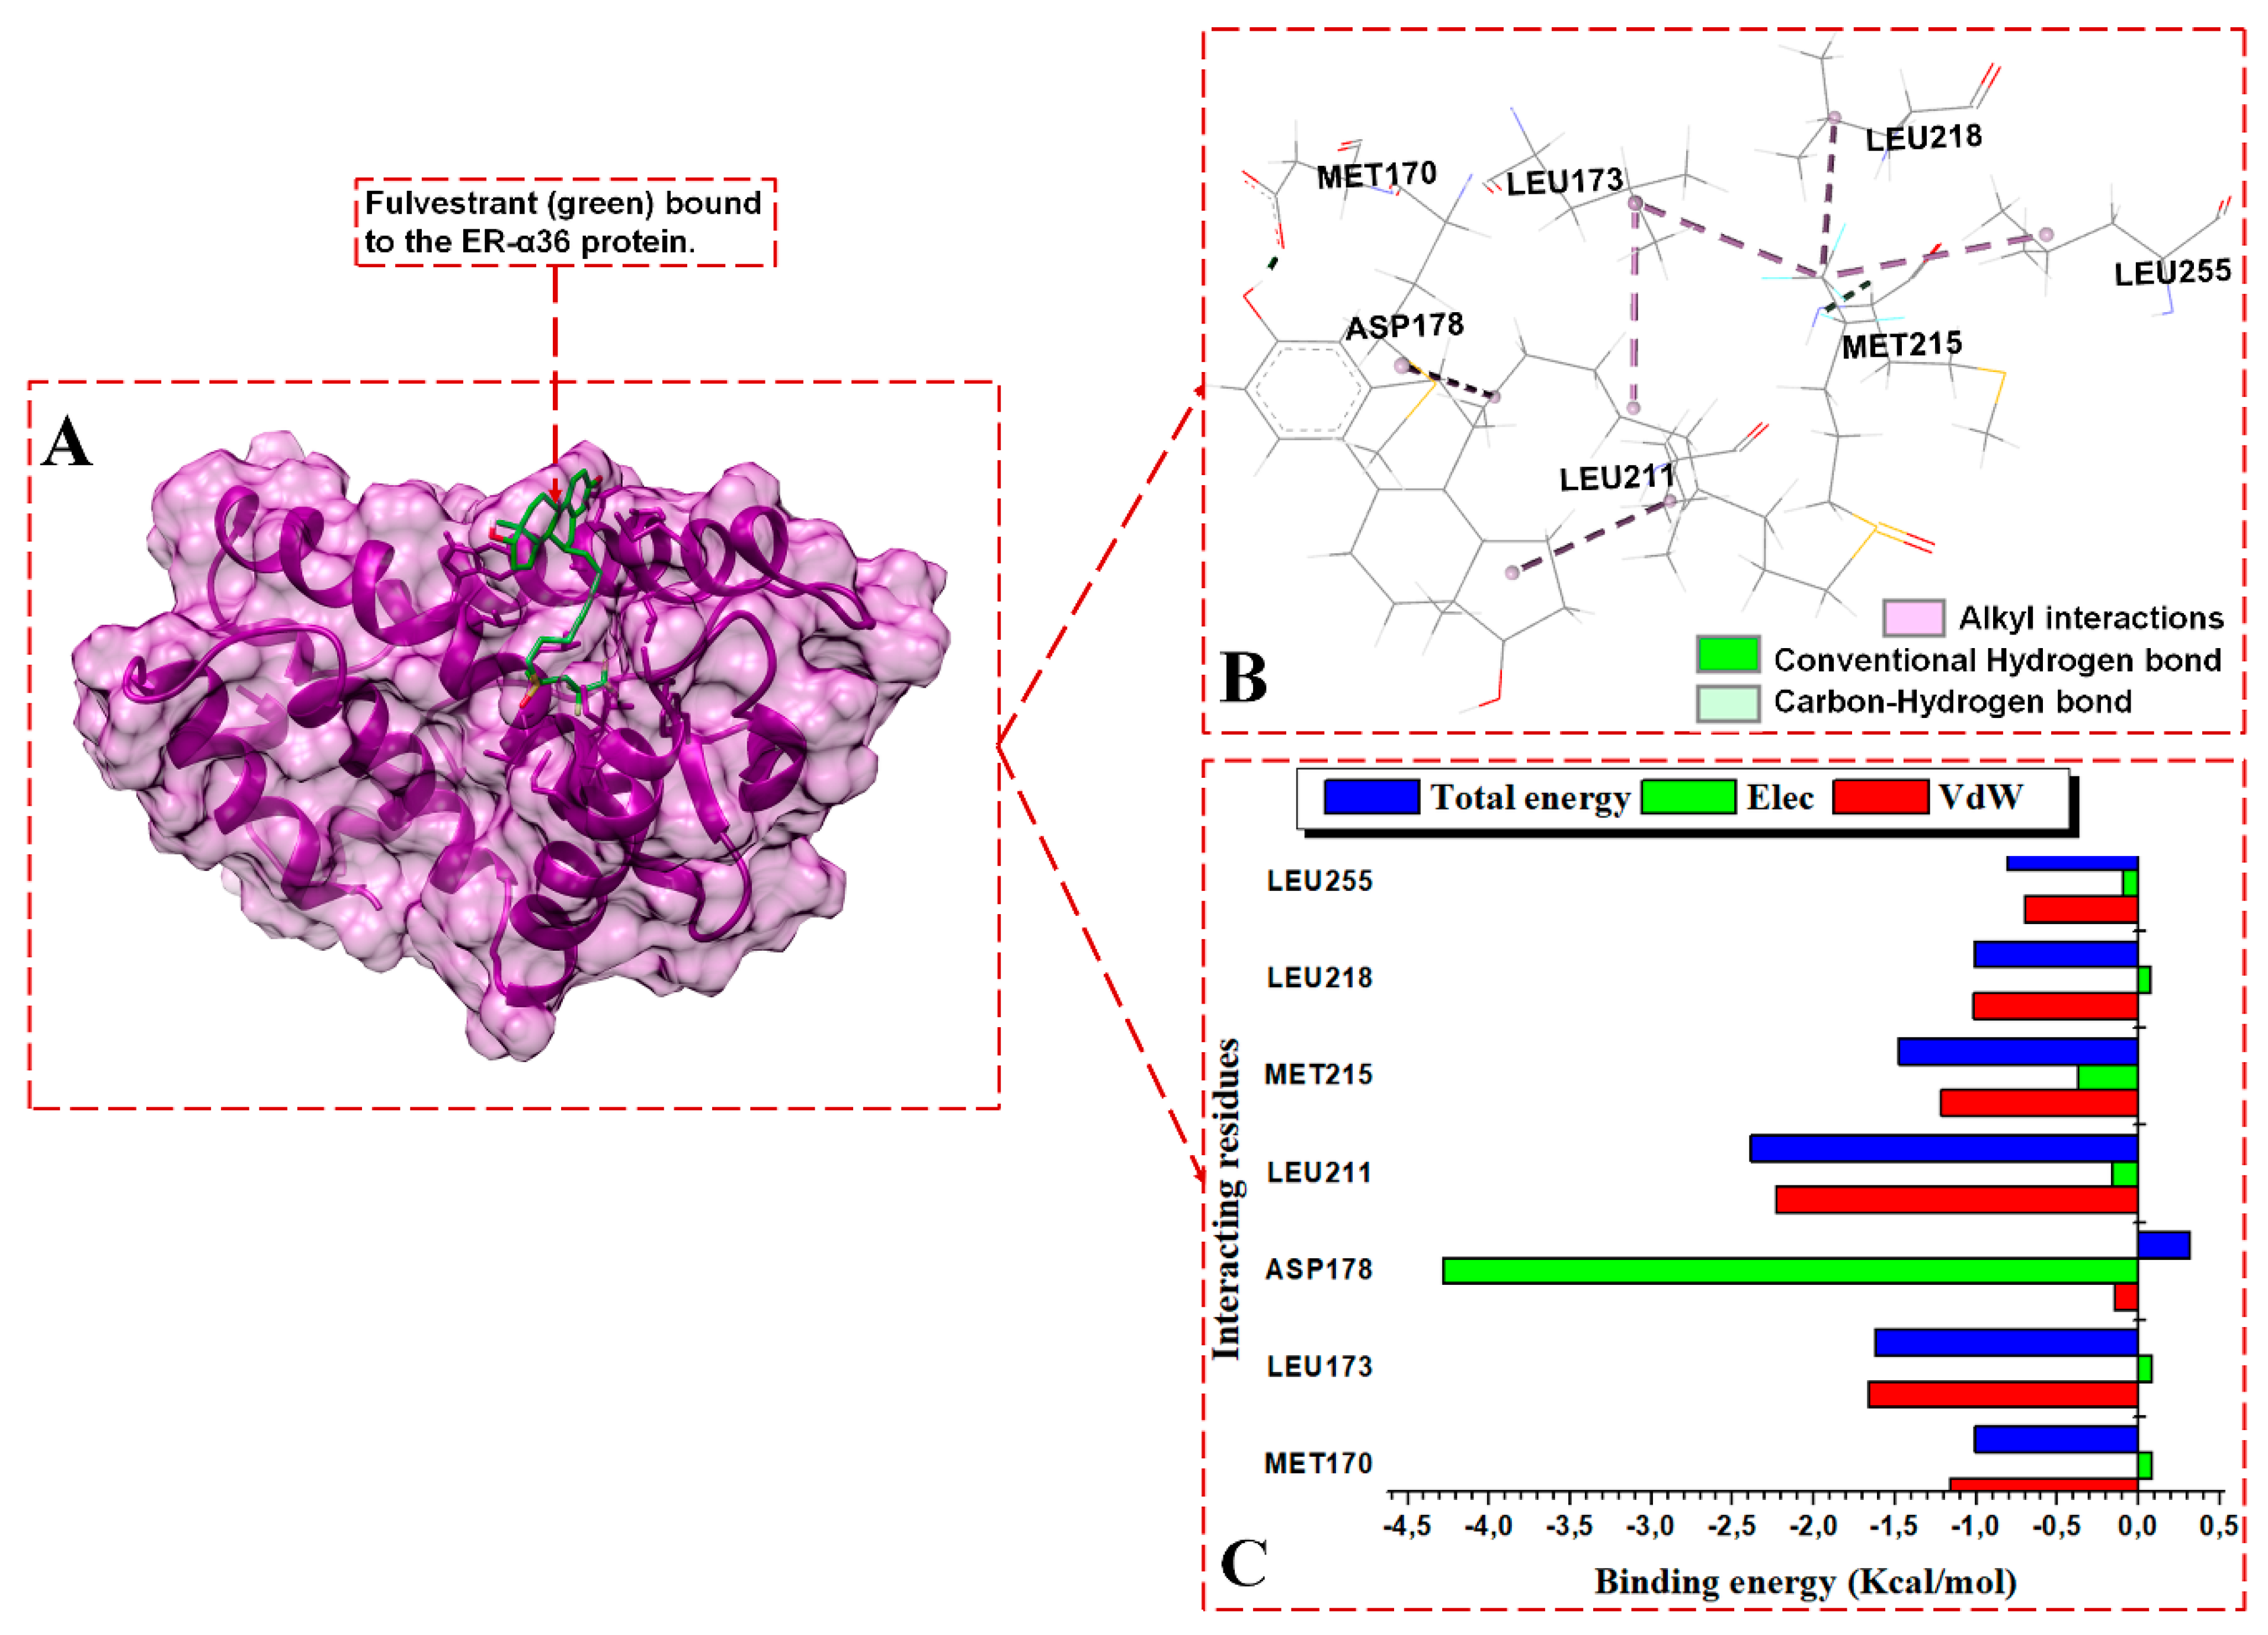
3.3.2. Contrasting the Interaction Channels of the ER-α Variants Systems
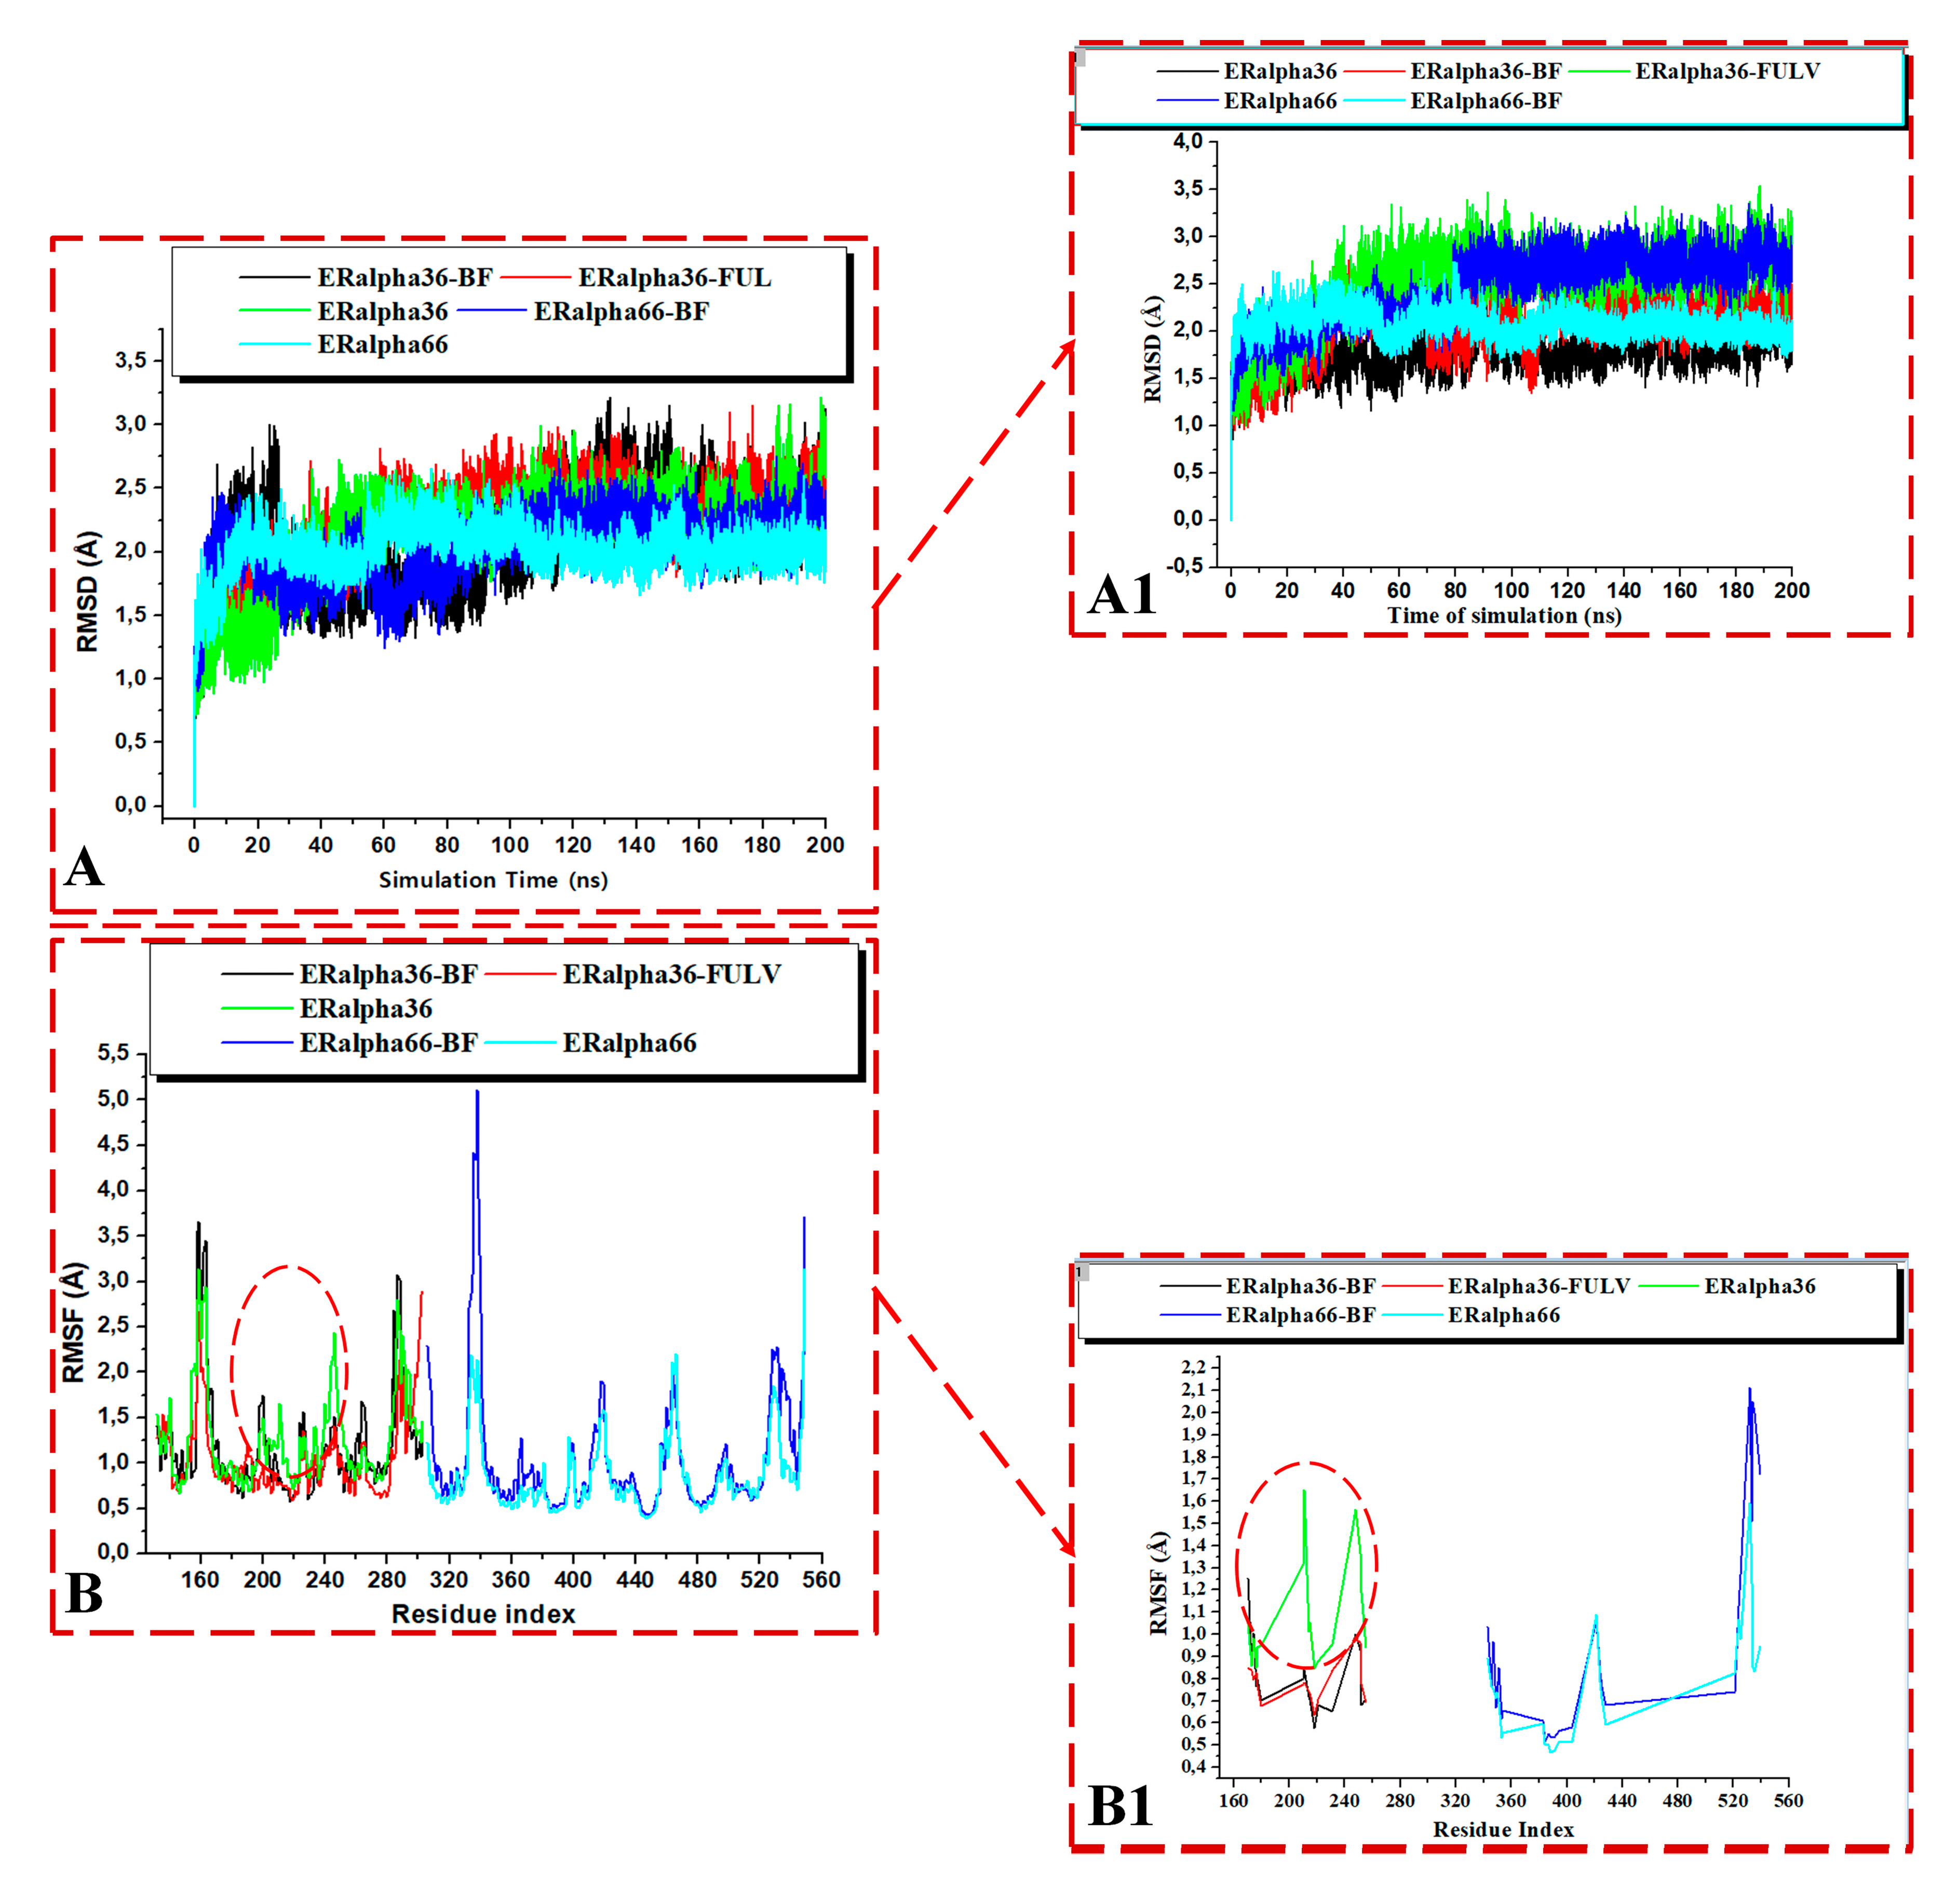
3.3.3. Comparative Stability and Flexibility of Estrogen Receptor Variants
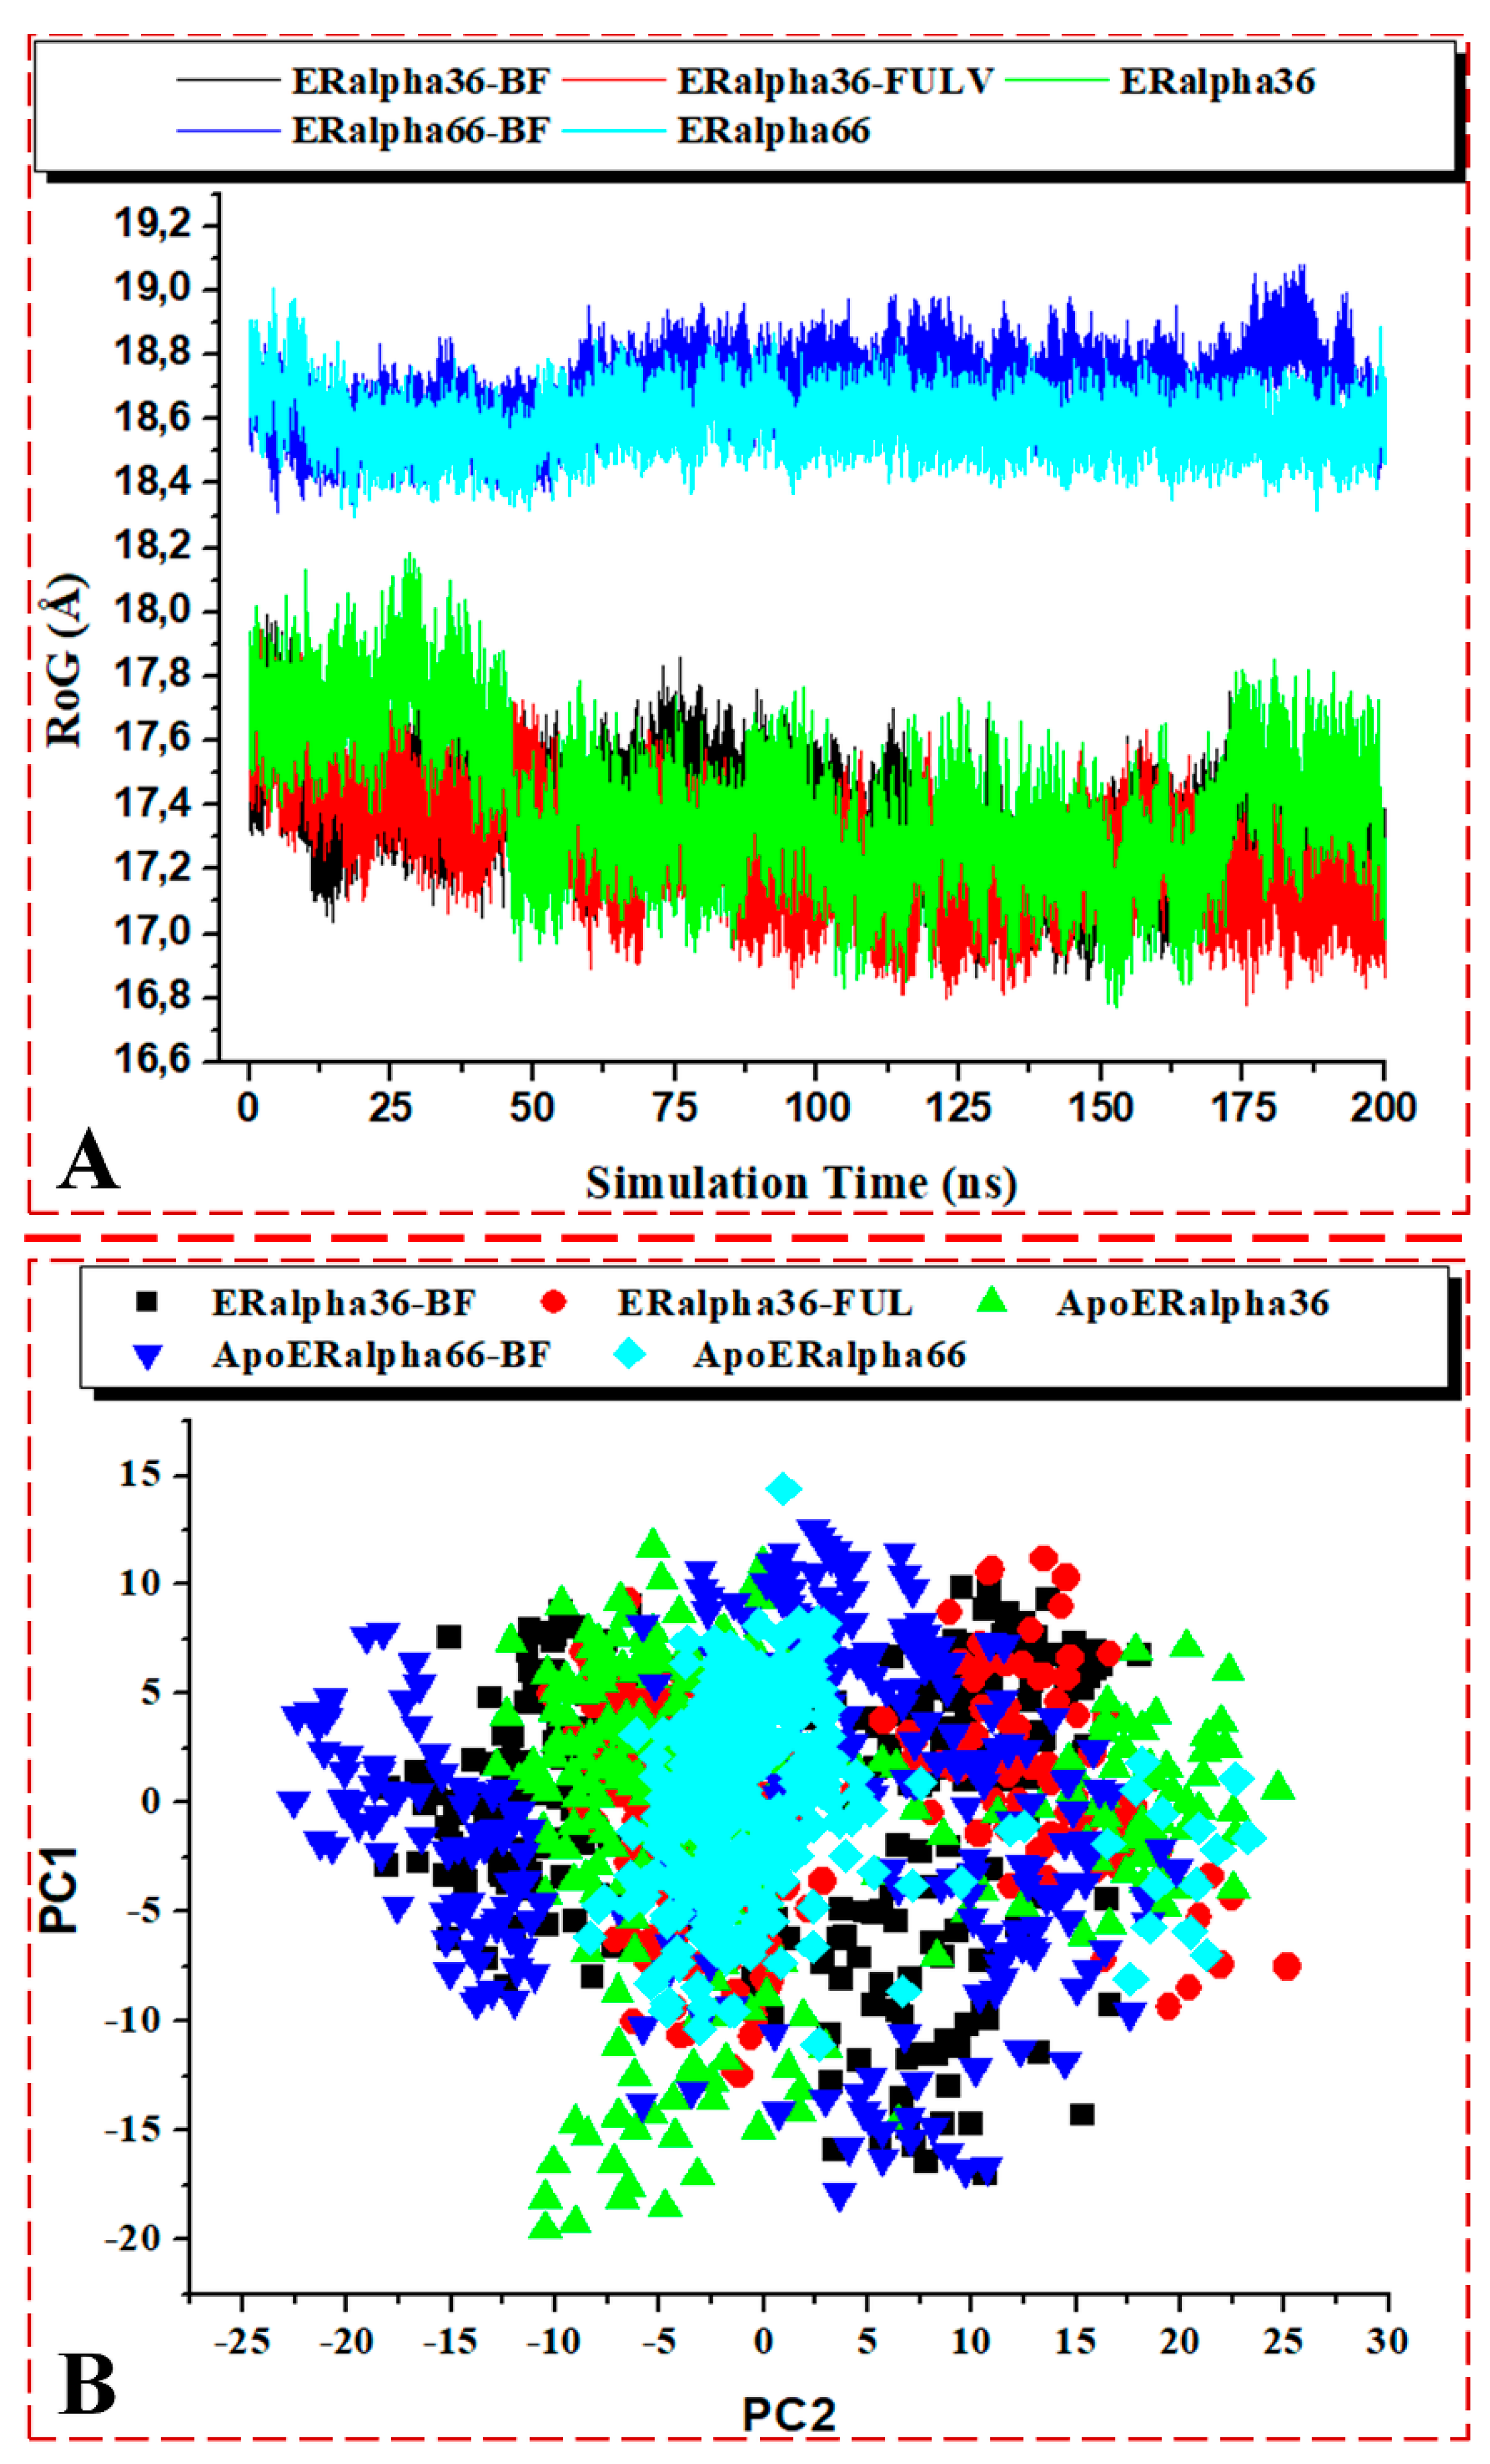
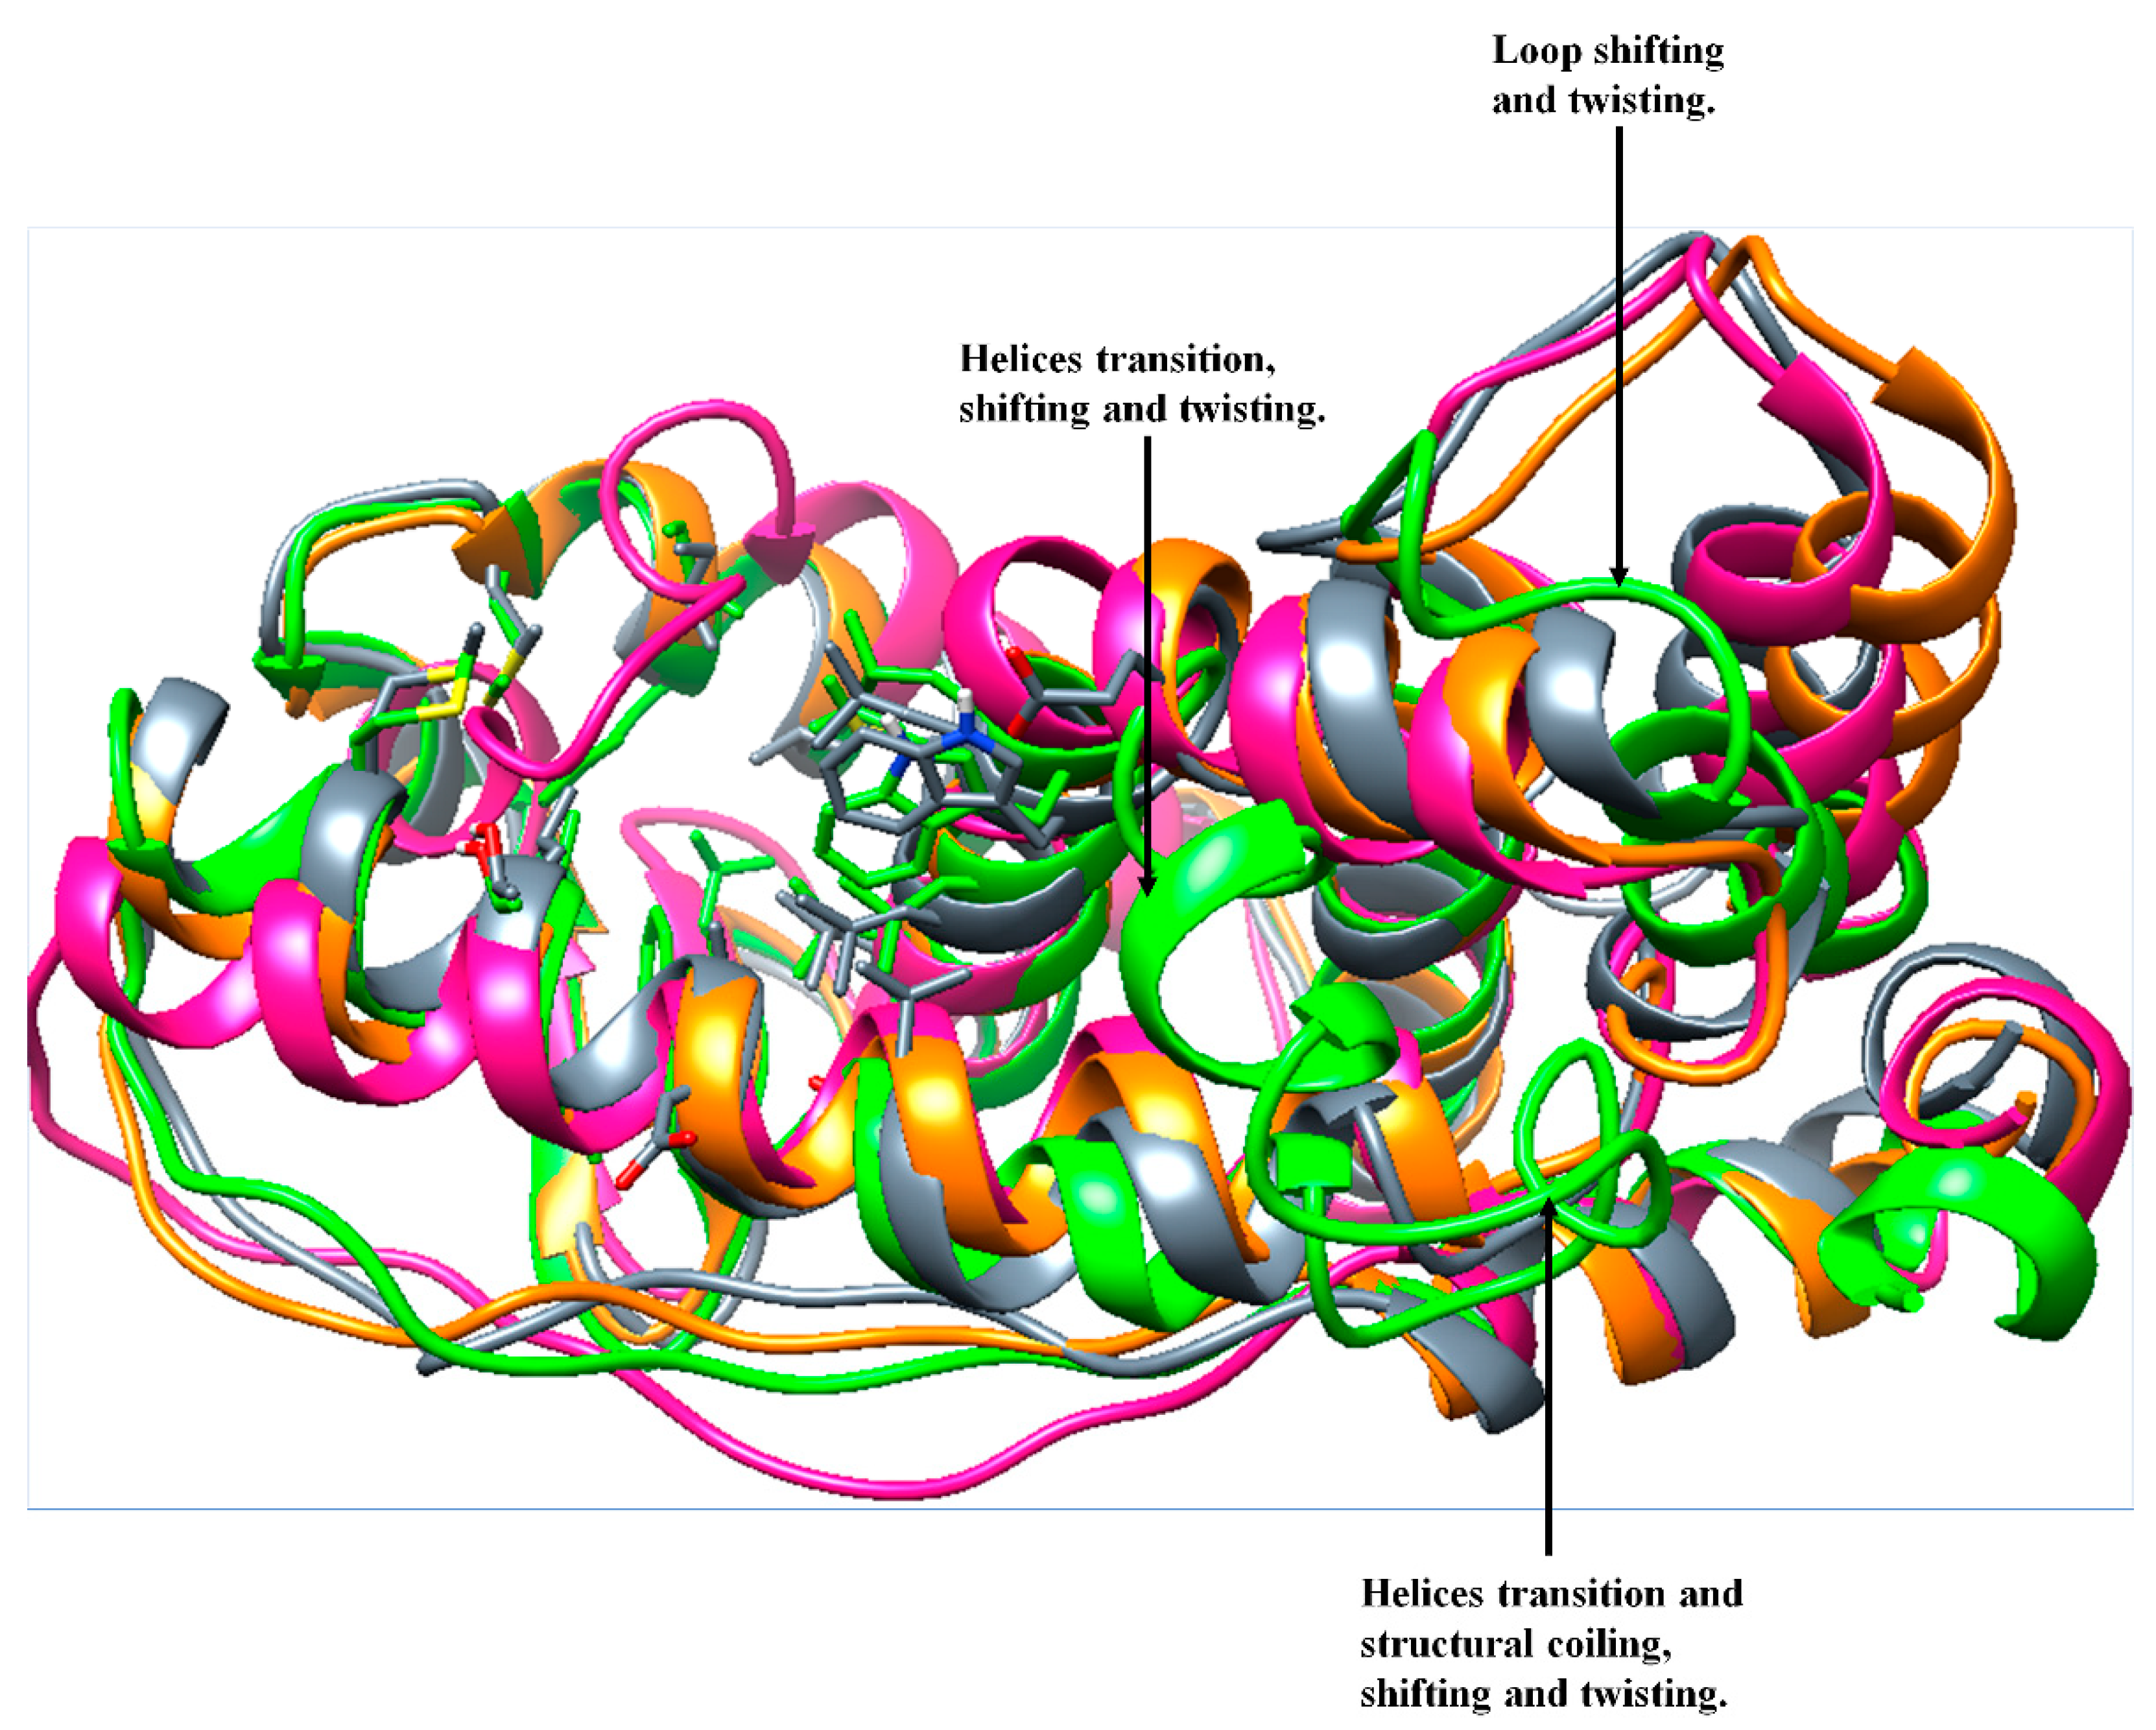
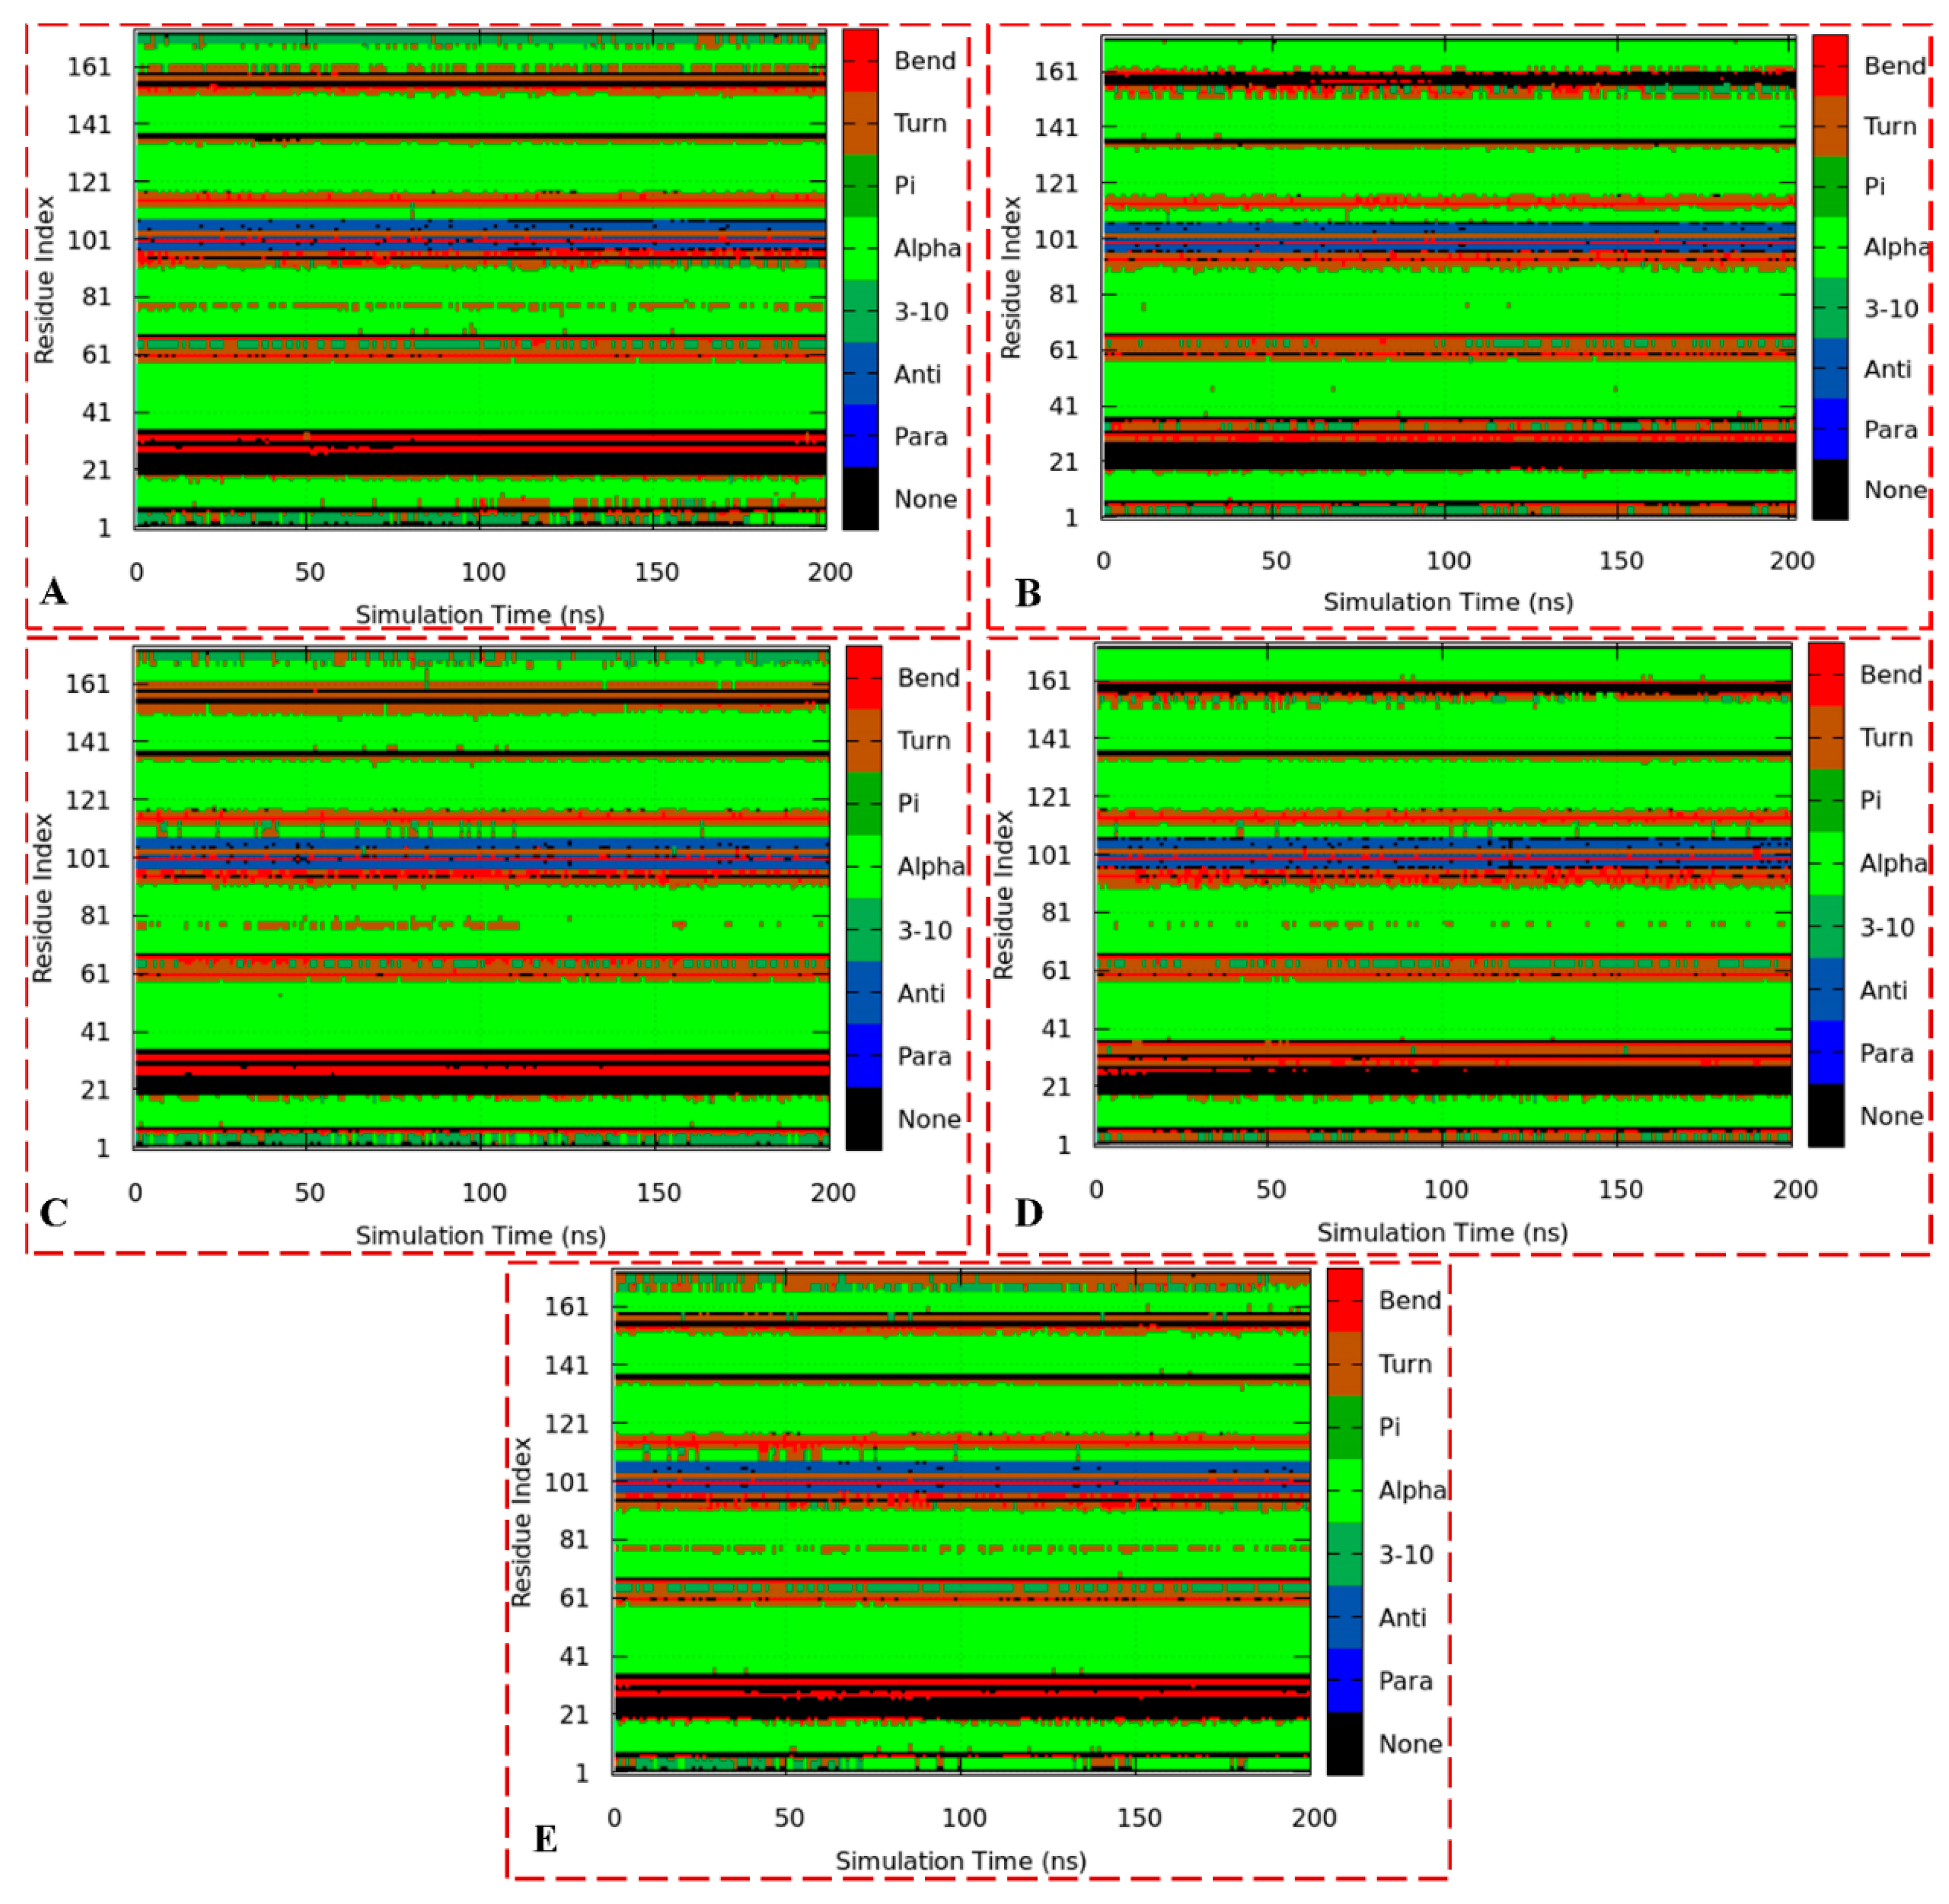
3.3.4. Analysis of RoG, PCA, and DSSP
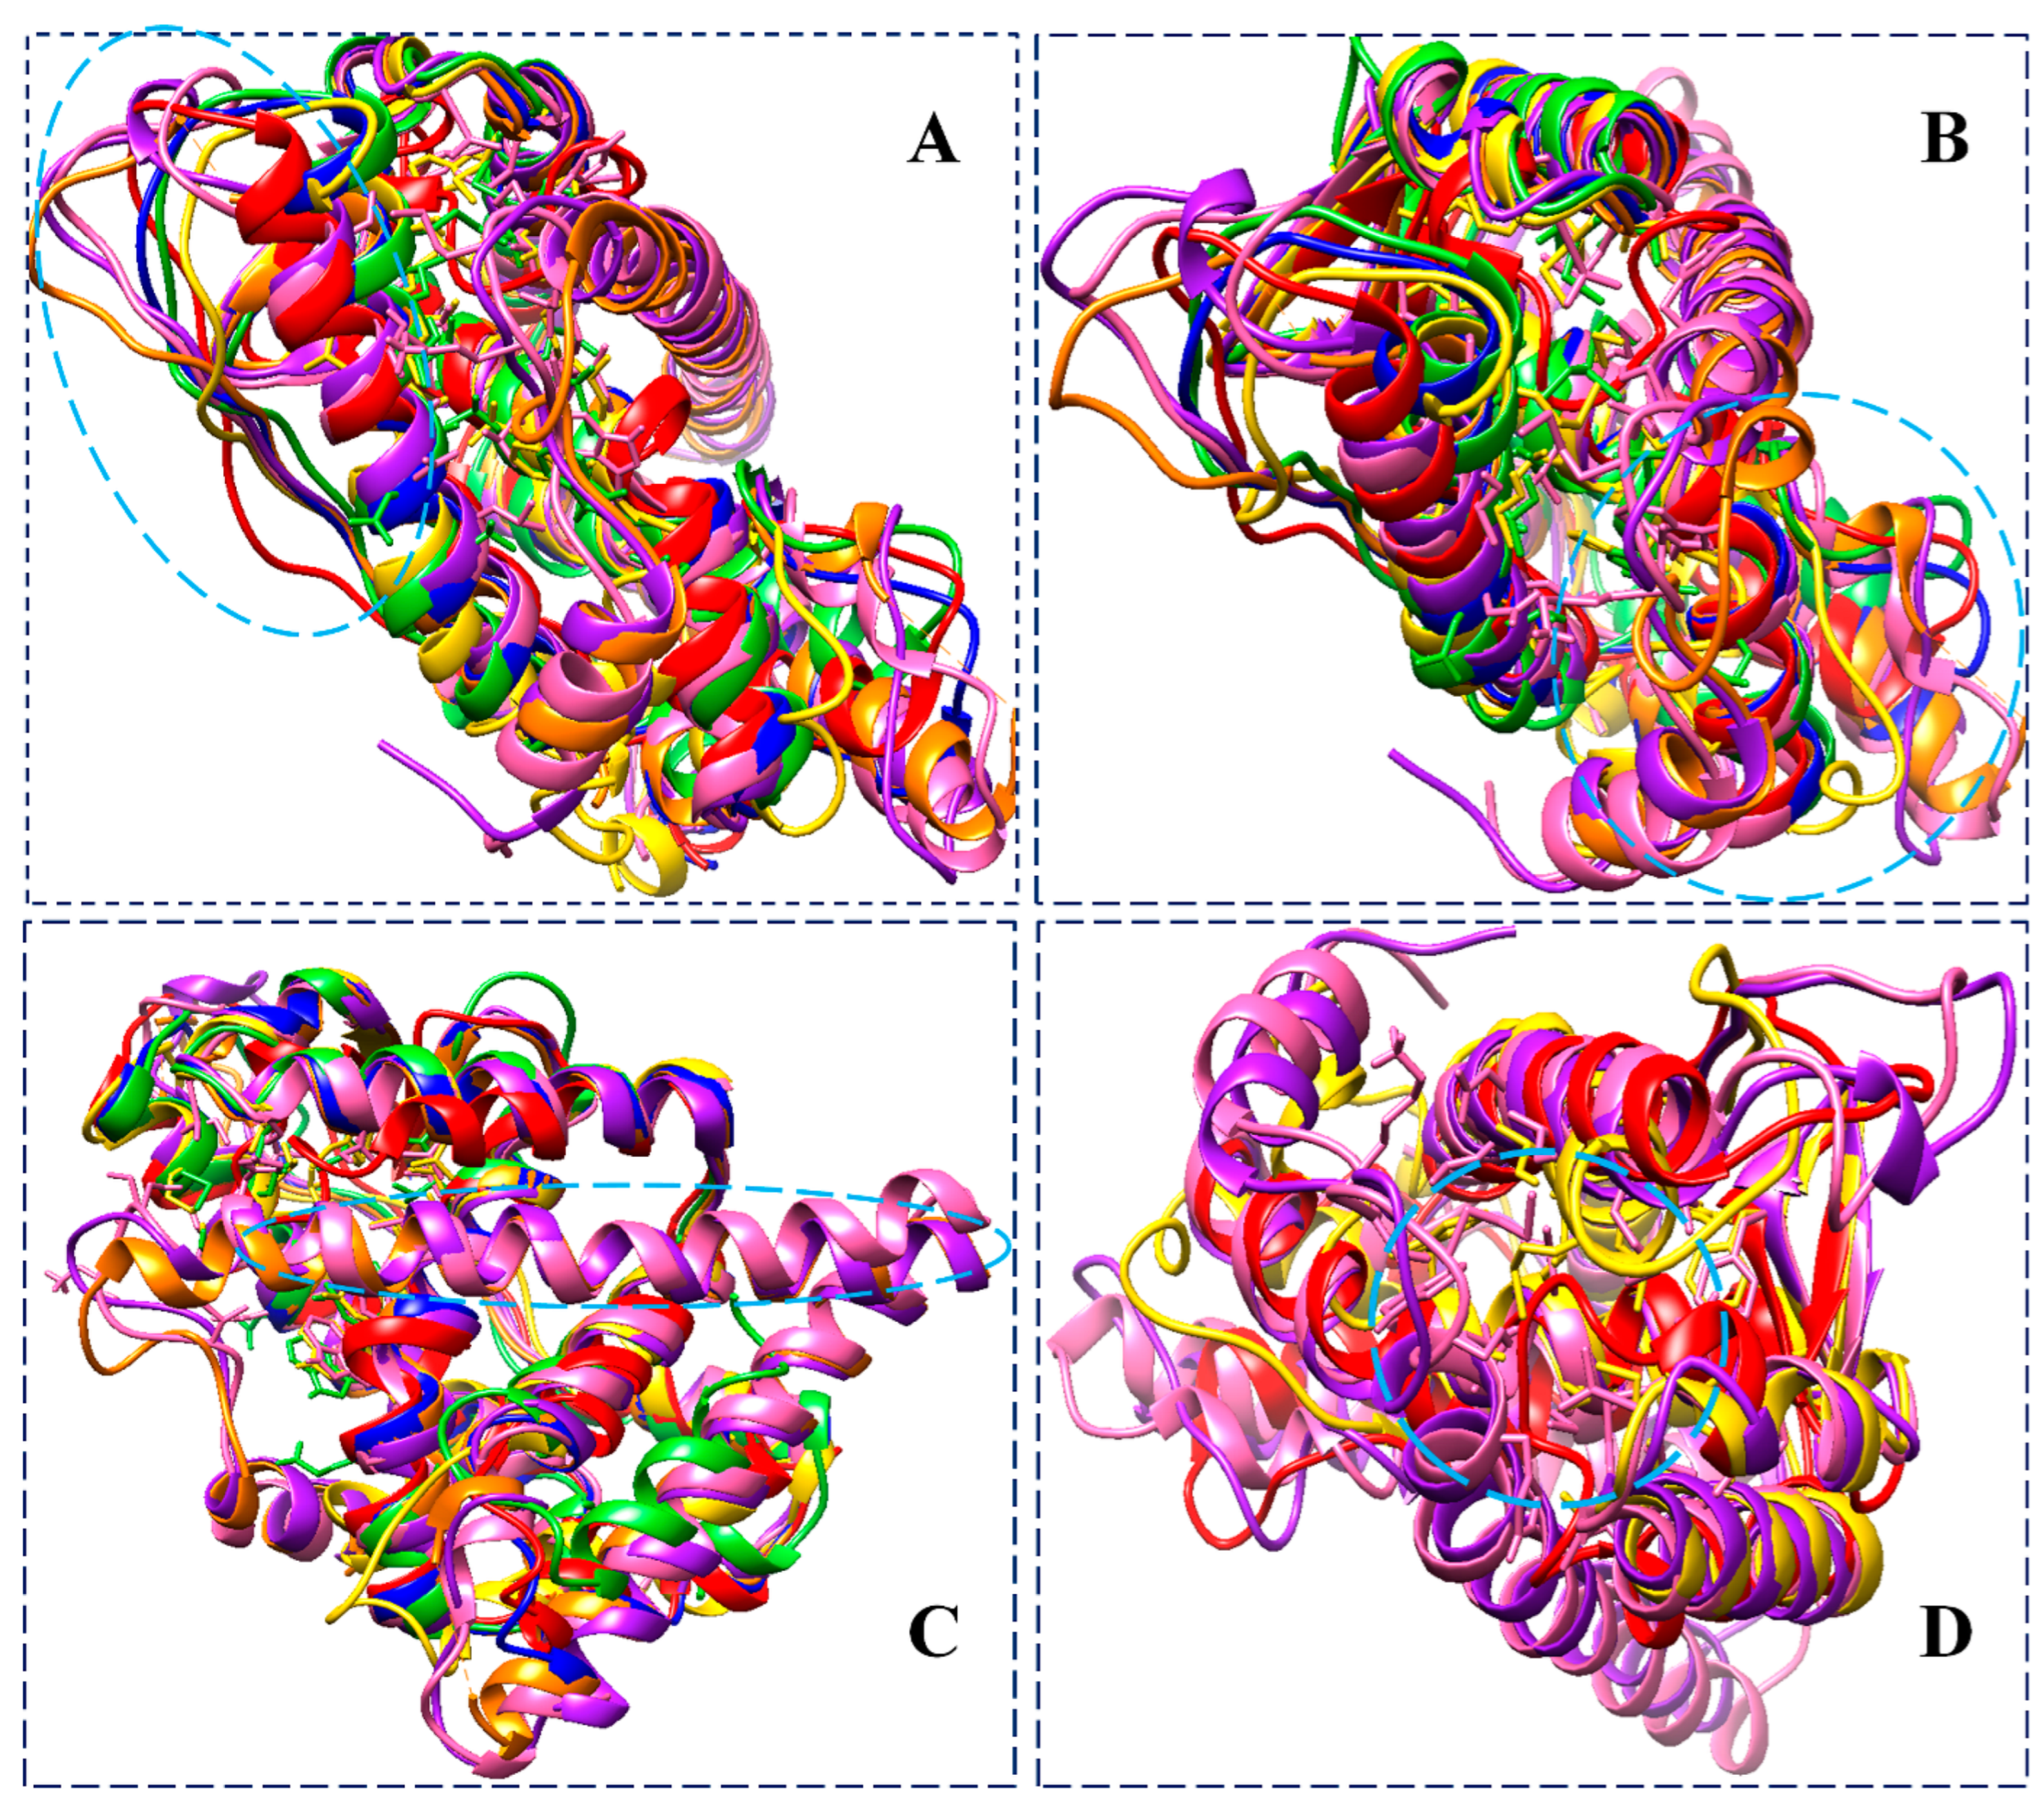
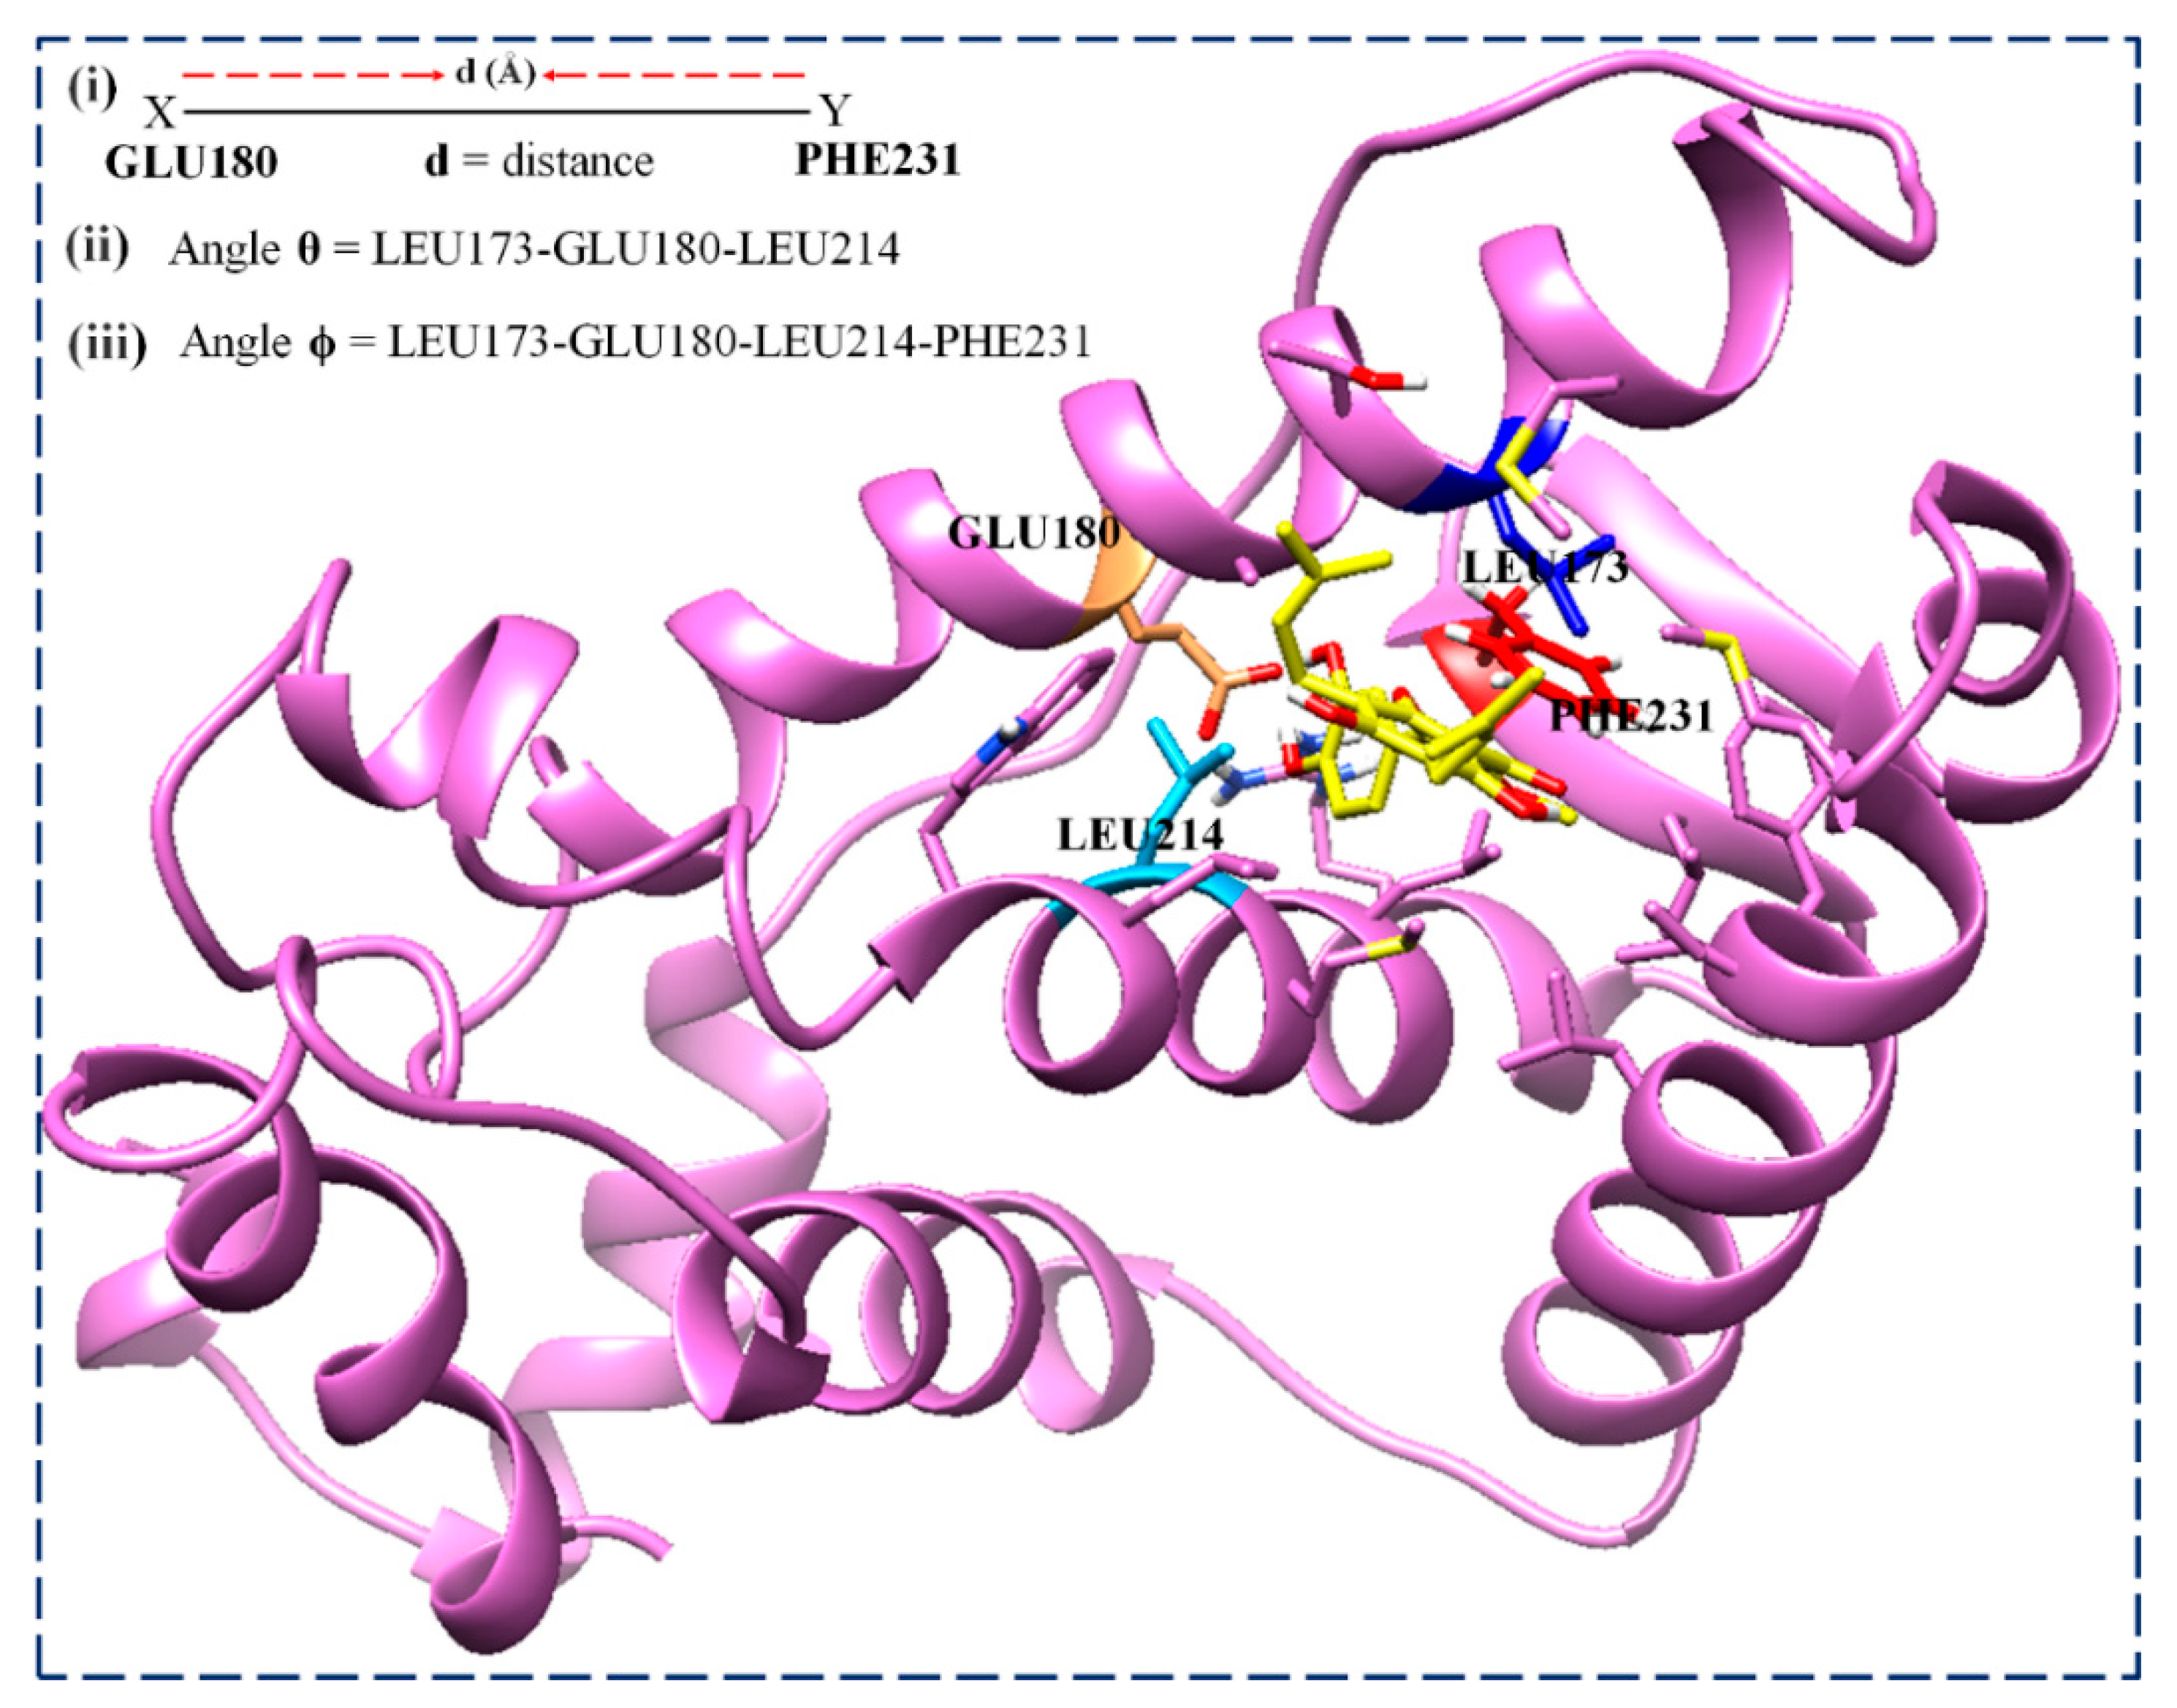
3.3.5. Analysis of DSSP, Distance, and Torsion Angles of the ER-α36 Variant
4. Conclusions
Author Contributions
Funding
Institutional Review Board Statement
Informed Consent Statement
Data Availability Statement
Acknowledgments
Conflicts of Interest
References
- Liu, W.J.; Zeng, X.B.; Li, J.; Zhu, K.; Lu, H.M. Comparison of the roles of estrogens and androgens in breast cancer and prostate cancer. J. Cell. Biochem. 2019, 121, 2756–2769. [Google Scholar] [CrossRef] [PubMed]
- Zhong, L.; Li, Y.; Xiong, L.; Wang, W.; Wu, M.; Yuan, T.; Yang, W.; Tian, C.; Miao, Z.; Wang, T.; et al. Small molecules in targeted cancer therapy: Advances, challenges, and future perspectives. Signal Transduct. Target. Ther. 2021, 6, 201. [Google Scholar] [CrossRef] [PubMed]
- Hartkopf, A.D.; Grischke, E.-M.; Brucker, S.Y. Endocrine-Resistant Breast Cancer: Mechanisms and Treatment. Breast Care 2020, 15, 347–354. [Google Scholar] [CrossRef] [PubMed]
- Wang, X.; Zhang, H.; Chen, X. Drug resistance and combating drug resistance in cancer. Cancer Drug Resist 2019, 2, 141–160. [Google Scholar] [CrossRef] [PubMed]
- Dimitrakakis, C.; Bondy, C. Androgens and the breast. Breast Cancer Res. 2009, 11, 212. [Google Scholar] [CrossRef]
- Wang, Z.Y.; Zhang, X.T.; Shen, P.; Loggie, B.W.; Chang, Y.C.; Deuel, T.F. A variant of estrogen receptor-α, hER-α36: Transduction of estrogen- and antiestrogen-dependent membrane-initiated mitogenic signaling. Proc. Natl. Acad. Sci. USA 2006, 103, 9063–9068. [Google Scholar] [CrossRef]
- Li, G.; Zhang, J.; Xu, Z.; Li, Z. ER α 36 as a Potential Therapeutic Target for Tamoxifen-Resistant Breast Cancer Cell Line through EGFR/ERK Signaling Pathway. Cancer Manag. Res. 2020, 12, 265–275. [Google Scholar] [CrossRef]
- Pagano, M.T.; Ortona, E.; Dupuis, M.L. A Role for Estrogen Receptor alpha36 in Cancer Progression. Front. Endocrinol. 2020, 11, 506. [Google Scholar] [CrossRef]
- Teng, L.; Su, X.; Xu, X.; Li, G.; Lin, B.; Cao, J. ER-α36: A novel biomarker and potential therapeutic target in breast cancer. Onco. Targets. Ther. 2014, 7, 1525–1533. [Google Scholar] [CrossRef]
- Rasha, F.; Sharma, M.; Pruitt, K. Mechanisms of endocrine therapy resistance in breast cancer. Mol. Cell. Endocrinol. 2021, 532, 111322. [Google Scholar] [CrossRef]
- Nelson, A.W.; Tilley, W.D.; Neal, D.E.; Carroll, J.S. Estrogen receptor beta in prostate cancer: Friend or foe? Endocr. Relat. Cancer 2014, 21, T219–T234. [Google Scholar] [CrossRef] [PubMed]
- Gu, Y.; Chen, T.; López, E.; Wu, W.; Wang, X.; Cao, J.; Teng, L. The therapeutic target of estrogen receptor-alpha36 in estrogen-dependent tumors. J. Transl. Med. 2014, 12, 16. [Google Scholar] [CrossRef] [PubMed]
- Andrahennadi, S.; Sami, A.; Haider, K.; Chalchal, H.I.; Le, D.; Ahmed, O.; Manna, M.; El-Gayed, A.; Wright, P.; Ahmed, S. Efficacy of fulvestrant in women with hormone-resistant metastatic breast cancer (mBC): A Canadian province experience. Cancers 2021, 13, 4163. [Google Scholar] [CrossRef] [PubMed]
- Kaminska, K.; Akrap, N.; Staaf, J.; Alves, C.L.; Ehinger, A.; Ebbesson, A.; Hedenfalk, I.; Beumers, L.; Veerla, S.; Harbst, K.; et al. Distinct mechanisms of resistance to fulvestrant treatment dictate level of ER independence and selective response to CDK inhibitors in metastatic breast cancer. Breast Cancer Res. 2021, 23, 26. [Google Scholar] [CrossRef] [PubMed]
- Bailey, S.T.; Shin, H.; Westerling, T.; Liu, X.S.; Brown, M. Estrogen receptor prevents p53-dependent apoptosis in breast cancer. Proc. Natl. Acad. Sci. USA 2012, 109, 18060–18065. [Google Scholar] [CrossRef] [PubMed]
- Ribas, R.; Pancholi, S.; Rani, A.; Schuster, E.; Guest, S.K.; Nikitorowicz-Buniak, J.; Simigdala, N.; Thornhill, A.; Avogadri-Connors, F.; Cutler, R.E.; et al. Targeting tumour re-wiring by triple blockade of mTORC1, epidermal growth factor, and oestrogen receptor signalling pathways in endocrine-resistant breast cancer. Breast Cancer Res. 2018, 20, 44. [Google Scholar] [CrossRef] [PubMed]
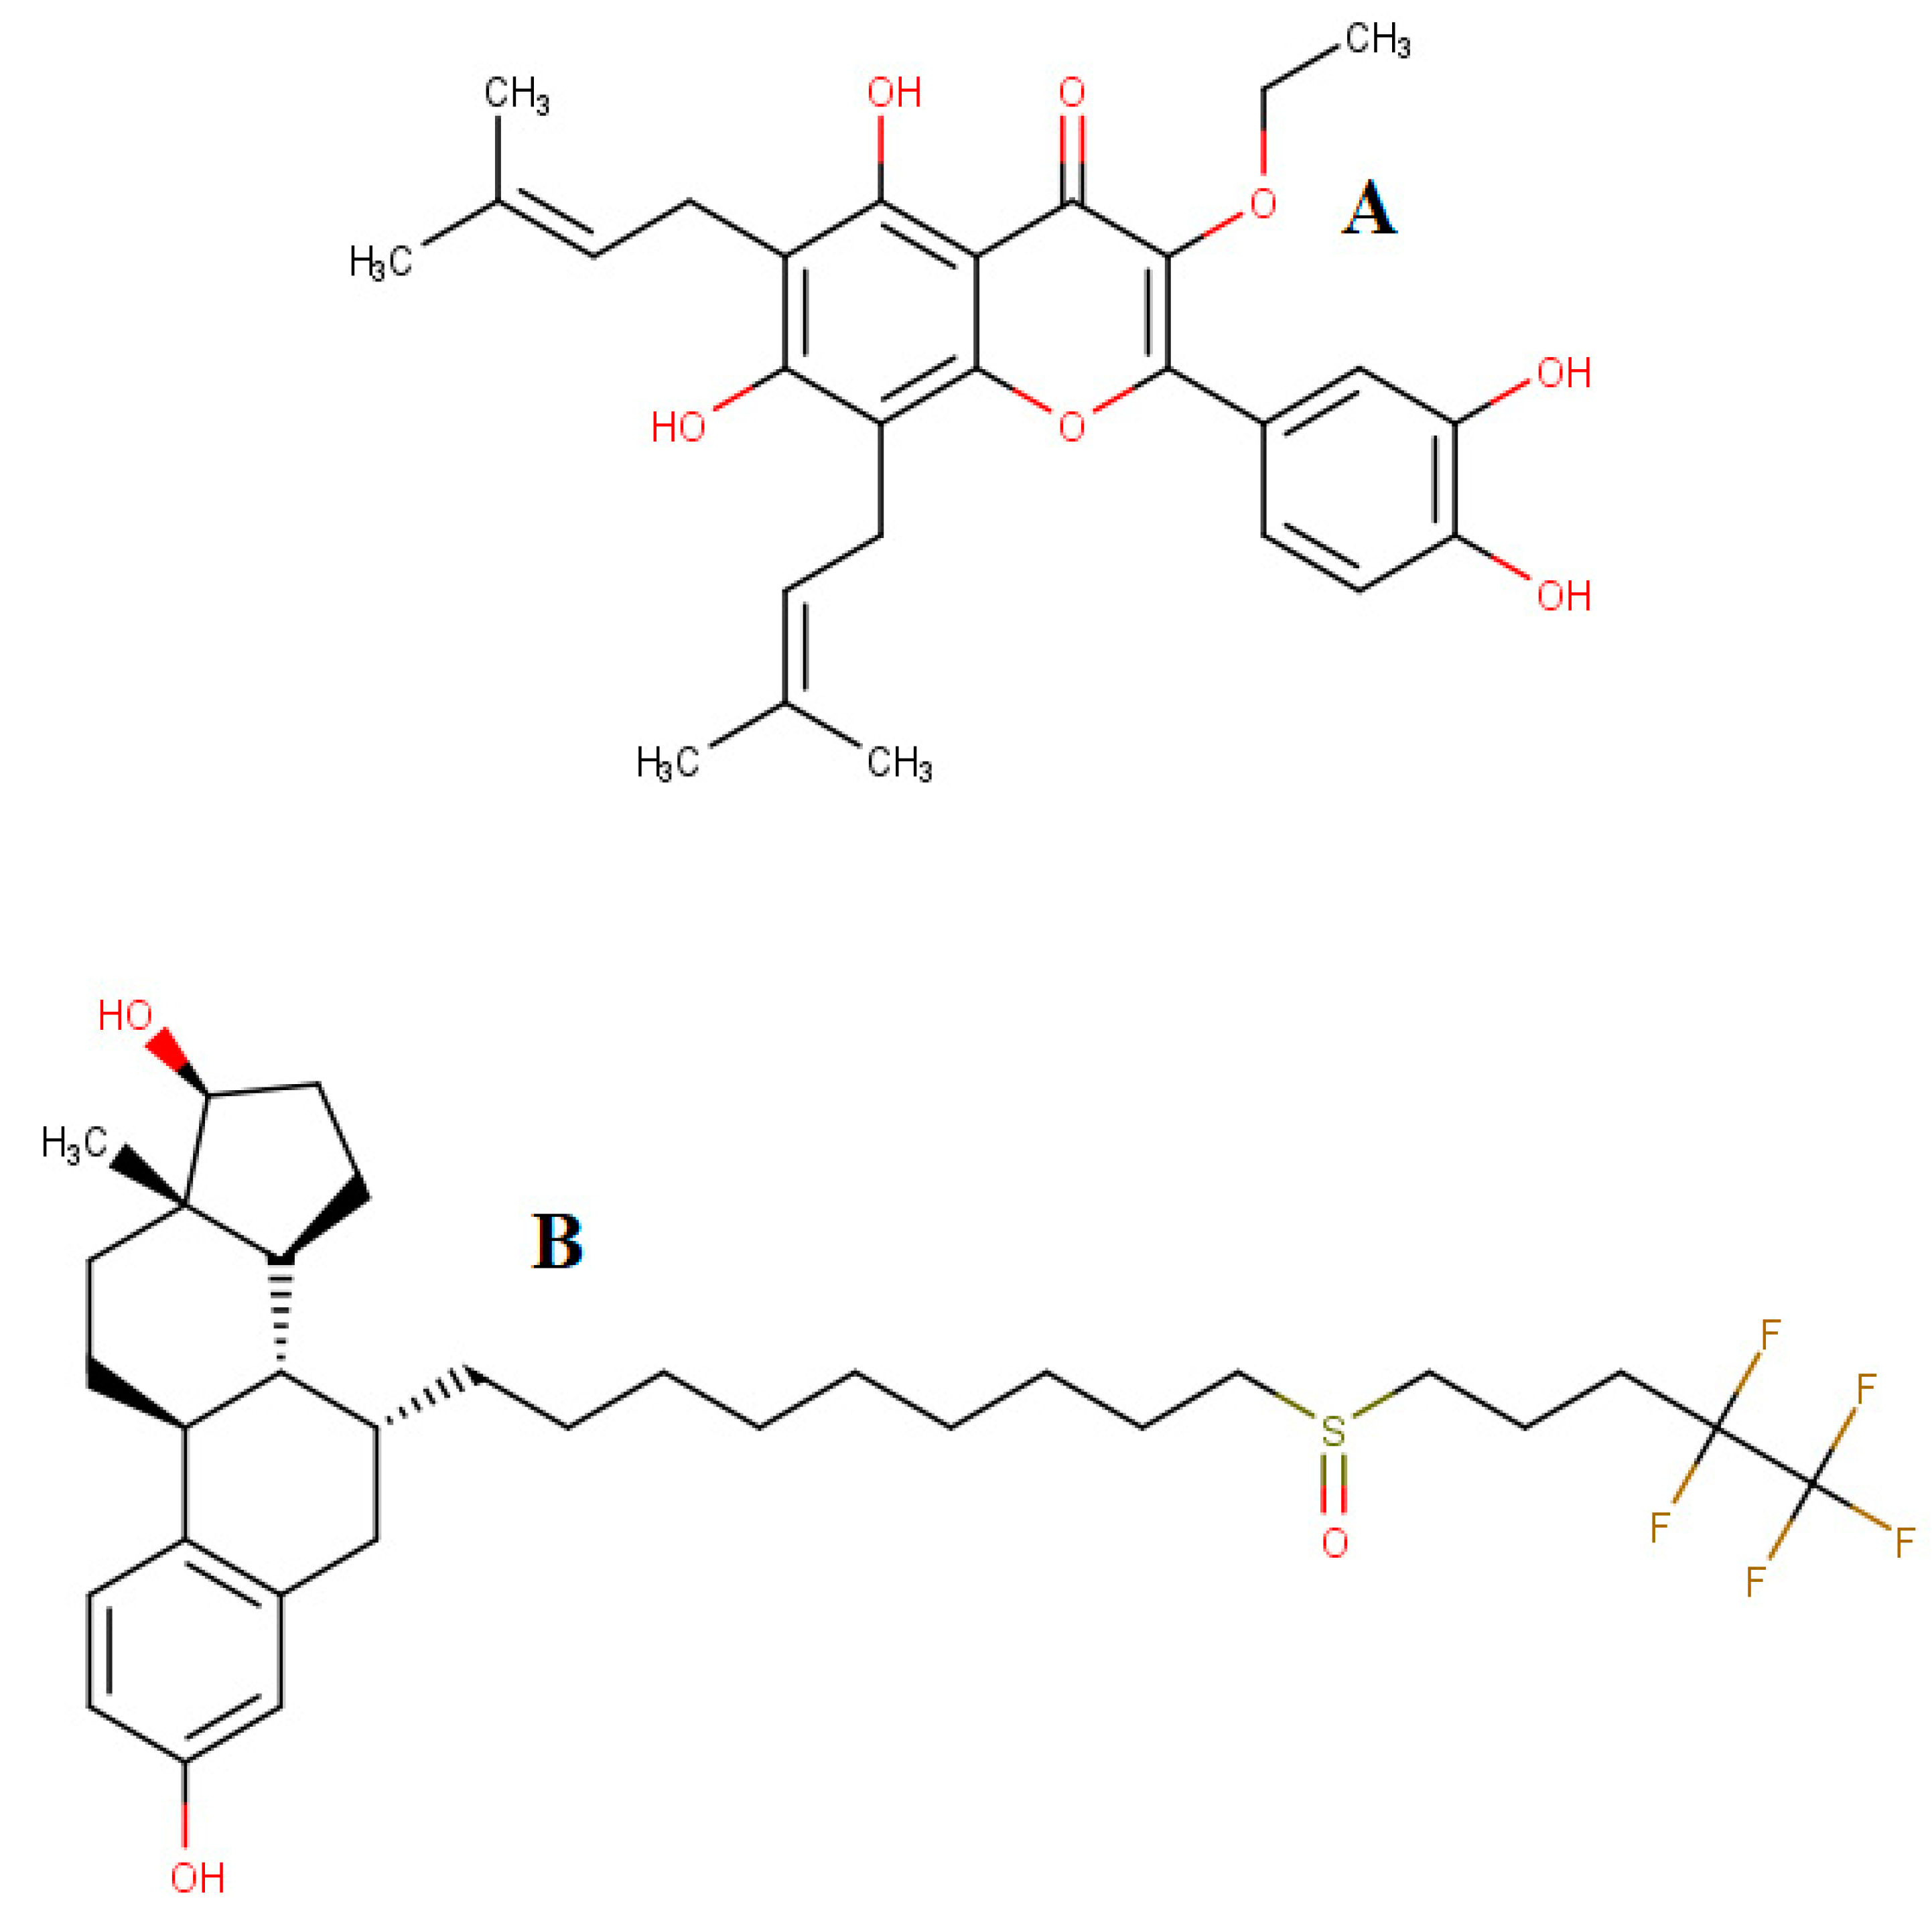
- Guo, M.; Wang, M.; Deng, H.; Zhang, X.; Wang, Z.Y. A novel anticancer agent Broussoflavonol B downregulates estrogen receptor (ER)-α36 expression and inhibits growth of ER-negative breast cancer MDA-MB-231 cells. Eur. J. Pharmacol. 2013, 714, 56–64. [Google Scholar] [CrossRef]
- Jeong, J.H.; Jae-Ha, R. Broussoflavonol B from Broussonetia kazinoki Siebold Exerts Anti-Pancreatic Cancer Activity through Downregulating FoxM1. Molecules 2020, 25, 2328. [Google Scholar] [CrossRef]
- Chetty, S.; Soliman, M.E.S. Possible allosteric binding site on Gyrase B, a key target for novel anti-TB drugs: Homology modelling and binding site identification using molecular dynamics simulation and binding free energy calculations. Med. Chem. Res. 2015, 24, 2055–2074. [Google Scholar] [CrossRef]
- Morgat, A.; Lombardot, T.; Coudert, E.; Axelsen, K.; Neto, T.B.; Gehant, S.; Bansal, P.; Bolleman, J.; Gasteiger, E.; de Castro, E.; et al. Enzyme annotation in UniProtKB using Rhea. Bioinformatics 2020, 36, 1896–1901. [Google Scholar] [CrossRef]
- Roche, D.B.; Tetchner, S.J.; McGuffin, L.J. FunFOLD: An improved automated method for the prediction of ligand binding residues using 3D models of proteins. BMC Bioinform. 2011, 12, 160. [Google Scholar] [CrossRef]
- Wu, Y.L.; Yang, X.; Ren, Z.; McDonnell, D.P.; Norris, J.D.; Willson, T.M.; Greene, G.L. Structural basis for an unexpected mode of SERM-Mediated ER antagonism. Mol. Cell 2005, 18, 413–424. [Google Scholar] [CrossRef] [PubMed]
- Nettles, K.W.; Bruning, J.B.; Gil, G.; O’Neill, E.E.; Nowak, J.; Hughs, A.; Kim, Y.; DeSombre, E.R.; Dilis, R.; Hanson, R.N.; et al. Structural plasticity in the oestrogen receptor ligand-binding domain. Sci. Rep. 2007, 8, 563–568. [Google Scholar] [CrossRef]
- Zhang, B.; Kiefer, J.R.; Blake, R.A.; Chang, J.H.; Hartman, S.; Ingalla, E.R.; Kleinheinz, T.; Mody, V.; Nannini, M.; Ortwine, D.F.; et al. Unexpected equivalent potency of a constrained chromene enantiomeric pair rationalized by co-crystal structures in complex with estrogen receptor alpha. Bioorg. Med. Chem. Lett. 2019, 29, 905–911. [Google Scholar] [CrossRef] [PubMed]
- Goujon, M.; McWilliam, H.; Li, W.; Valentin, F.; Squizzato, S.; Paern, J.; Lopez, R. A new bioinformatics analysis tools framework at EMBL-EBI. Nucleic Acids Res. 2010, 38, 695–699. [Google Scholar] [CrossRef] [PubMed]
- Yang, Z.; Lasker, K.; Schneidman-Duhovny, D.; Webb, B.; Huang, C.C.; Pettersen, E.F.; Goddard, T.D.; Meng, E.C.; Sali, A.; Ferrin, T.E. UCSF Chimera, MODELLER, and IMP: An integrated modeling system. J. Struct. Biol. 2012, 179, 269–278. [Google Scholar] [CrossRef]
- Tian, W.; Chen, C.; Lei, X.; Zhao, J.; Liang, J. CASTp 3.0: Computed atlas of surface topography of proteins. Nucleic Acids Res. 2018, 46, W363–W367. [Google Scholar] [CrossRef]
- Edelsbrunner, H.; Mücke, E.P. Three-Dimensional Alpha Shapes. ACM Trans. Graph. 1994, 13, 43–72. [Google Scholar] [CrossRef]
- Lange, A.W.; Herbert, J.M.; Albrecht, B.J.; You, Z.Q. Intrinsically smooth discretisation of Connolly’s solvent-excluded molecular surface. Mol. Phys. 2020, 118, e1644384. [Google Scholar] [CrossRef]
- Benkert, P.; Biasini, M.; Schwede, T. Toward the estimation of the absolute quality of individual protein structure models. Bioinformatics 2011, 27, 343–350. [Google Scholar] [CrossRef]
- Wang, J.; Wolf, R.M.; Caldwell, J.W.; Kollman, P.A.; Case, D.A. Development and testing of a general amber force field. J. Comput. Chem. 2004, 25, 1157–1174. [Google Scholar] [CrossRef] [PubMed]
- Morris, G.M.; Huey, R.; Lindstrom, W.; Sanner, M.F.; Belew, R.K.; Goodsell, D.S.; Olson, A.J. AutoDock4 and AutoDockTools4: Automated Docking with Selective Receptor Flexibility. J. Comput. Chem. 2009, 30, 2785–2791. [Google Scholar] [CrossRef]
- Ciccone, L.; Petrarolo, G.; Barsuglia, F.; Fruchart-Gaillard, C.; Lajeunesse, E.C.; Adewumi, A.T.; Soliman, M.E.S.; La Motta, C.; Orlandini, E.; Nencetti, S. Nature-Inspired O-Benzyl Oxime-Based Derivatives as New Dual-Acting Agents Targeting Aldose Reductase and Oxidative Stress. Biomolecules 2022, 12, 448. [Google Scholar] [CrossRef] [PubMed]
- Lee, T.S.; Cerutti, D.S.; Mermelstein, D.; Lin, C.; Legrand, S.; Giese, T.J.; Roitberg, A.; Case, D.A.; Walker, R.C.; York, D.M. GPU-Accelerated Molecular Dynamics and Free Energy Methods in Amber18: Performance Enhancements and New Features. J. Chem. Inf. Model. 2018, 58, 2043–2050. [Google Scholar] [CrossRef] [PubMed]
- Jorgensen, W.L.; Chandrasekhar, J.; Madura, J.D.; Impey, R.W.; Klein, M.L. Comparison of simple potential functions for simulating liquid water. J. Chem. Phys. 1983, 79, 926–935. [Google Scholar] [CrossRef]
- Ryckaert, J.P.; Ciccotti, G.; Berendsen, H.J.C. Numerical integration of the cartesian equations of motion of a system with constraints: Molecular dynamics of n-alkanes. J. Comput. Phys. 1977, 23, 327–341. [Google Scholar] [CrossRef]
- Adewumi, A.T.; Soremekun, O.S.; Ajadi, M.B.; Soliman, M.E.S. Thompson loop: Opportunities for antitubercular demethylmenaquinone methyltransferase protein. RSC Adv. 2020, 10, 23466–23483. [Google Scholar] [CrossRef]
- Adewumi, A.T.; Elrashedy, A.; Soremekun, O.S.; Ajadi, M.B.; Soliman, M.E.S. Weak spots inhibition in the Mycobacterium tuberculosis antigen 85C target for antitubercular drug design through selective irreversible covalent inhibitor-SER124. J. Biomol. Struct. Dyn. 2020, 40, 2934–2954. [Google Scholar] [CrossRef]
- Post, M.; Wolf, S.; Stock, G. Principal component analysis of nonequilibrium molecular dynamics simulations. J. Chem. Phys. 2019, 150, 204110. [Google Scholar] [CrossRef]
- Seifert, E. OriginPro 9.1: Scientific data analysis and graphing software—Software review. J. Chem. Inf. Model. 2014, 54, 1552. [Google Scholar] [CrossRef]
- Pal, S.; Kumar, V.; Kundu, B.; Bhattacharya, D.; Preethy, N.; Reddy, M.P.; Talukdar, A. Ligand-based Pharmacophore Modeling, Virtual Screening and Molecular Docking Studies for Discovery of Potential Topoisomerase I Inhibitors. Comput. Struct. Biotechnol. J. 2019, 17, 291–310. [Google Scholar] [CrossRef] [PubMed]
- Genheden, S.; Ryde, U. The MM/PBSA and MM/GBSA methods to estimate ligand-binding affinities. Expert Opin. Drug Discov. 2015, 10, 449–461. [Google Scholar] [CrossRef]
- Gapsys, V.; Michielssens, S.; Peters, J.H.; de Groot, B.L.; Leonov, H. Calculation of Binding Free Energies. Methods Mol. Biol. 2015, 1215, 173–209. [Google Scholar]
- Kang, L.; Zhang, X.; Xie, Y.; Tu, Y.; Wang, D.; Liu, Z.; Wang, Z.Y. Involvement of estrogen receptor variant ER-α36, not GPR30, in nongenomic estrogen signaling. Mol. Endocrinol. 2010, 24, 709–721. [Google Scholar] [CrossRef] [PubMed]
- Omarjee, S.; Jacquemetton, J.; Poulard, C.; Rochel, N.; Dejaegere, A.; Chebaro, Y.; Treilleux, I.; Marangoni, E. The molecular mechanisms underlying the ER α-36-mediated signaling in breast cancer. Oncogene 2016, 36, 2503–2514. [Google Scholar] [CrossRef] [PubMed]


| Species | Database ID | Method | Sequence Identity | Sequence Similarity | GMQE | QSQE | Query Cover |
|---|---|---|---|---|---|---|---|
| (%) | (%) | (%) | |||||
| Rattus norvegicus | P06211.1 | AlphaFOLD | 91.90 | 0.59 | 0.80 | - | 97.0 |
| H. sapiens | PDB7prw | X-ray (2.5 Å) | 31.18 | 0.37 | 0.59 | 0.24 | 89.0 |
| E-value | Max Score | Total Score | |||||
| H. sapiens | 1R5K | X-ray (2.7 Å) | 89.78 | 5 × 10−115 | 333 | 333 | 57.0 |
| H. sapiens | 2P15 | X-ray (1.94 Å) | 89.73 | 1 × 10−114 | 332 | 332 | 57.0 |
| H. sapiens | 6DF6 | X-ray (2.50 Å) | 83.66 | 6 × 10−115 | 334 | 334 | 62.0 |
| H. sapiens | POS | ConSurf |
| Ligand | Target | Docking Scores (kcal/mol) |
|---|---|---|
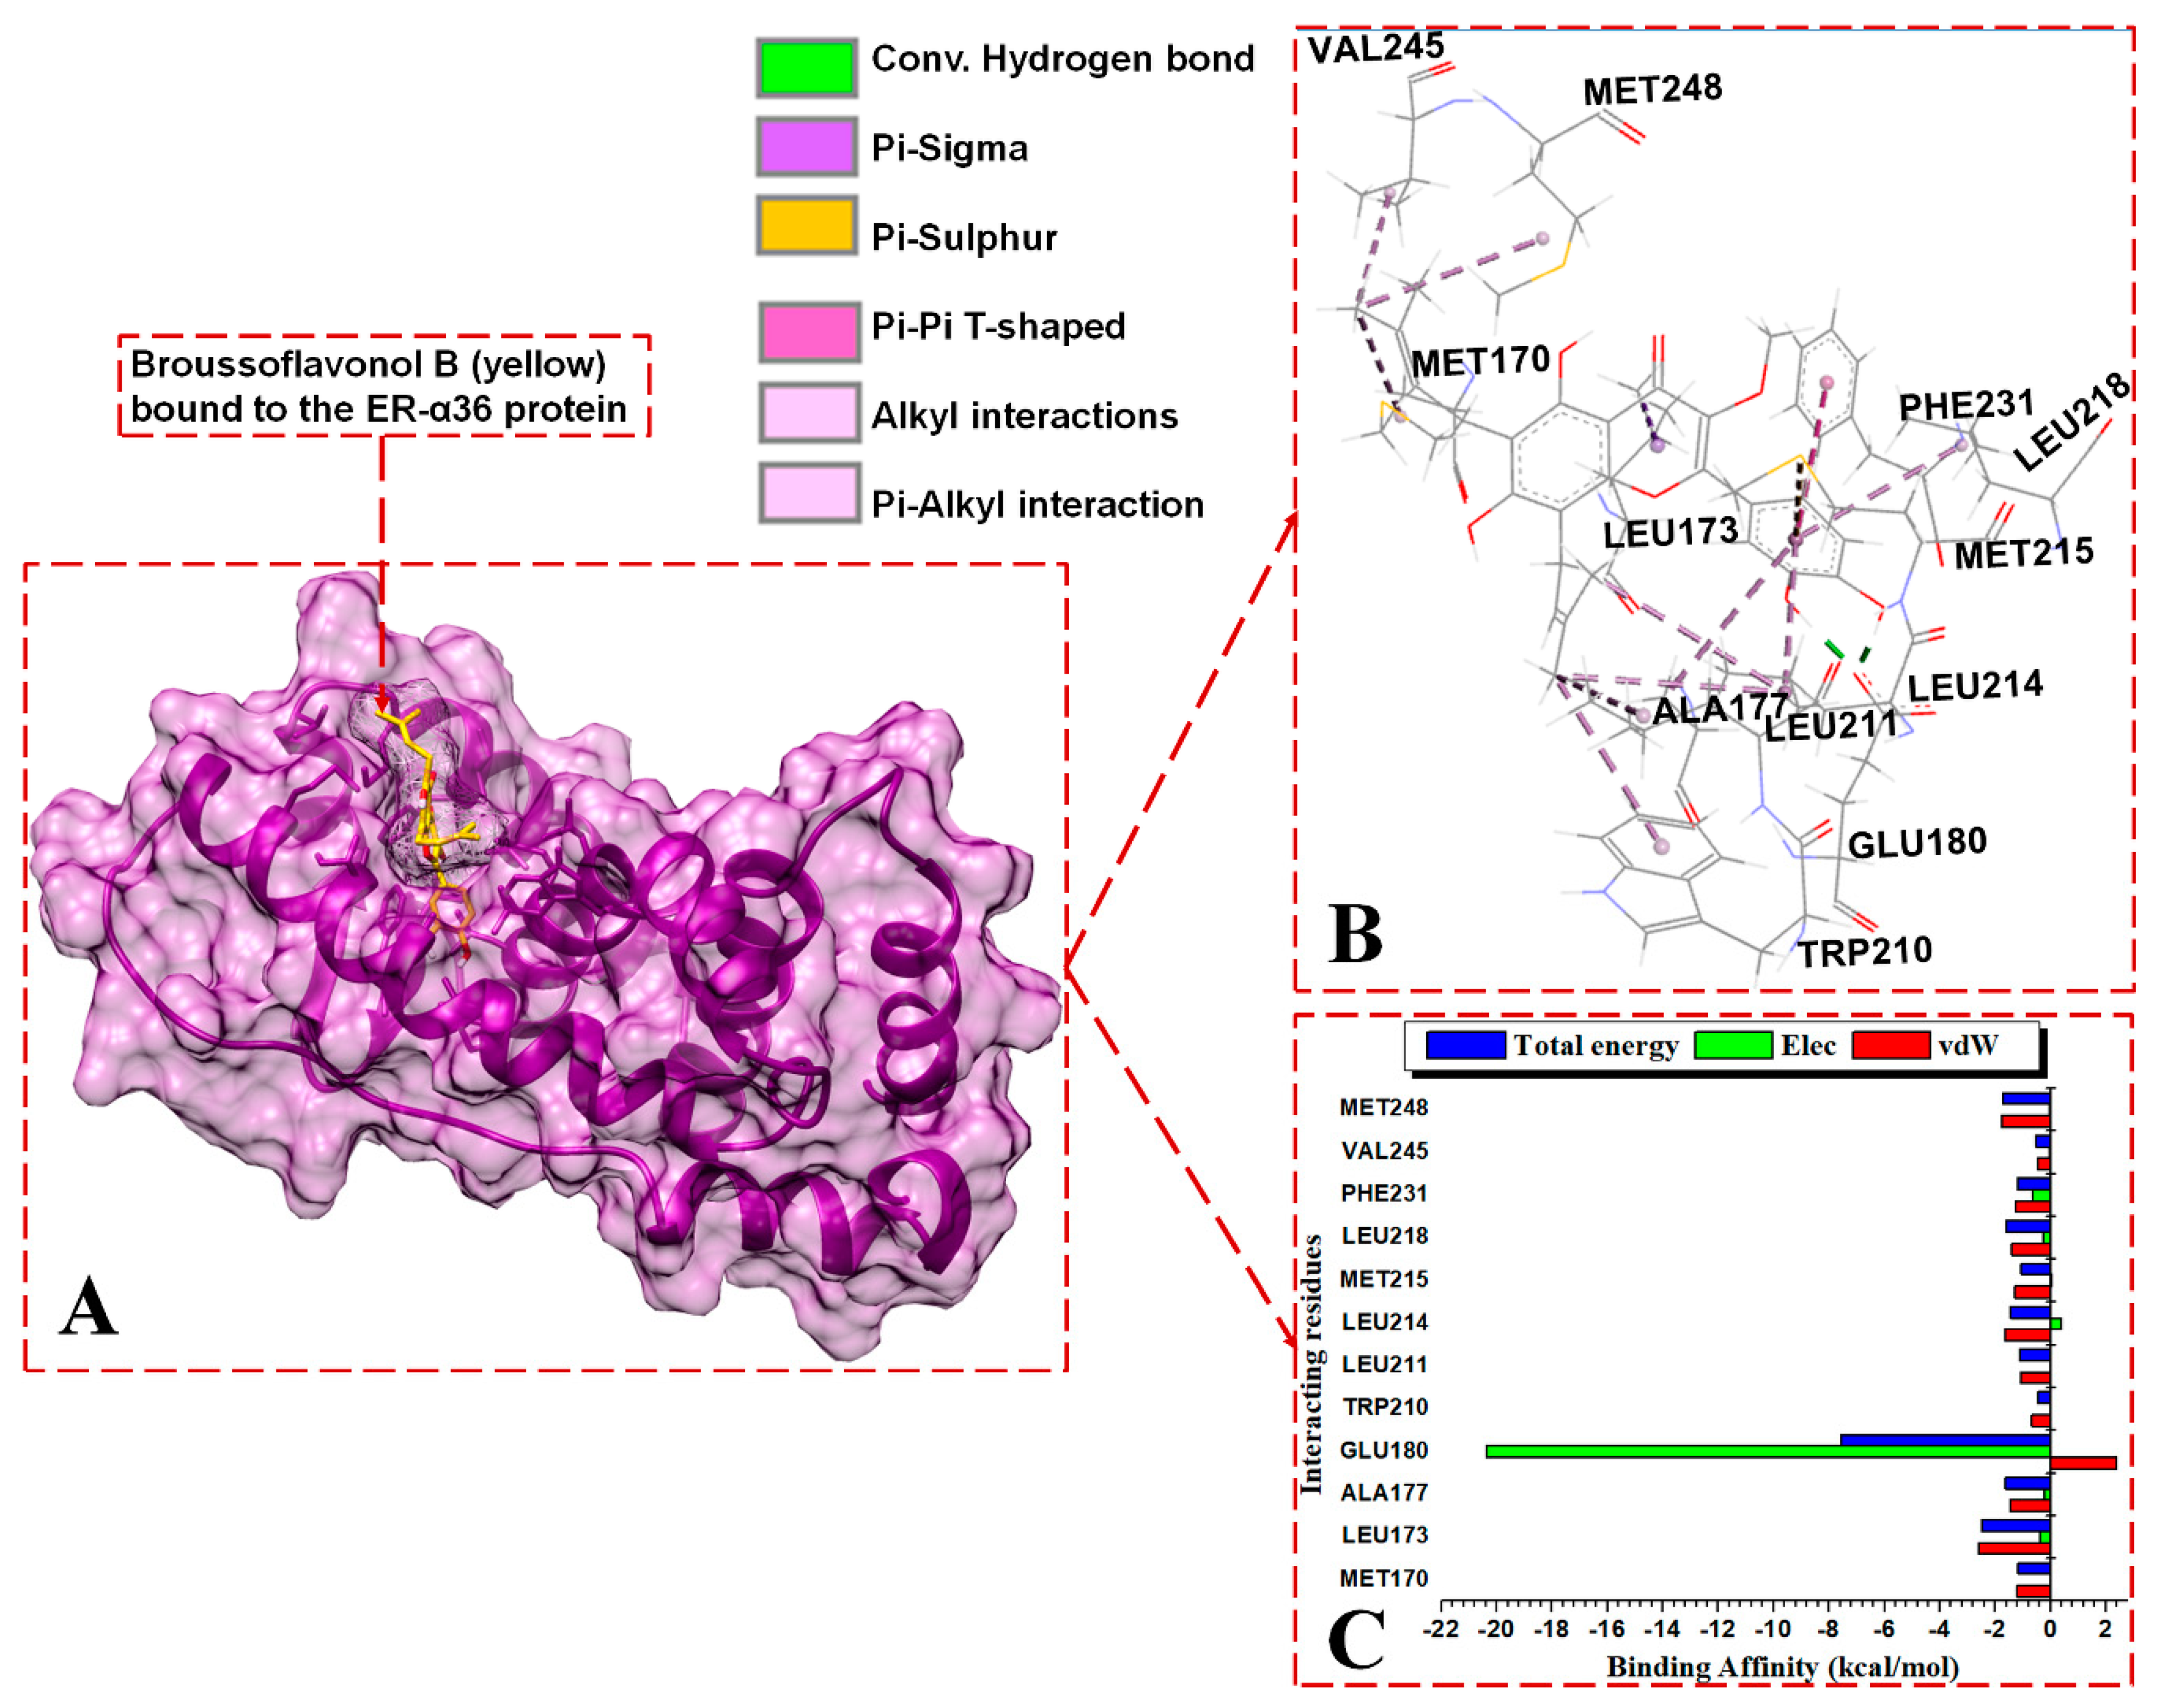
| Brussoflavonol B | ER-α66 | −6.5 |
| Brussoflavonol | ER-α36 | −7.7 |
| Fulvestrant | ER-α36 | −7.3 |
| Energy Components (kcal mol−1) | |||||||
|---|---|---|---|---|---|---|---|
| Complex | ΔEvdW | ΔEelec | ΔGgas | EGB | ESA | ΔGsolv | ΔGbind |
| ER-α36—BFB | −41.91 | 38.23 | −80.15 | 34.04 | −6.46 | 27.57 | −52.57 |
| (±4.31) | (±2.02) | (±5.39) | (±3.01) | (±0.43) | (±2.92) | (±4.09) | |
| ER-α36—FULV | −42.64 | −12.98 | −55.62 | 24.70 | −6.51 | 18.20 | 37.43 |
| (±5.58) | (±7.48) | (±8.59) | (±5.82) | (±0.79) | (±5.64) | (±5.08) | |
| ER-α66—BFB | −48.11 | 12.65 | −60.98 | 25.28 | 6.70 | 18.57 | −42.41 |
| (±5.14) | (±5.25) | (±0.57) | (±5.24) | (±0.57) | (±5.26) | (±4.02) | |
| Simulation | Distance (Angstrom) | |||
|---|---|---|---|---|
| Time (ns) | ER-α36 | ER-α36–BFB | ER-α66 | ER-α66–BFB |
| 0 | 7.743 | 7.743 | 8.817 | 7.406 |
| 1 | 7.158 | 7.728 | 8.784 | 7.959 |
| 10 | 5.882 | 8.352 | 11.170 | 10.316 |
| 50 | 8.385 | 8.187 | 12.493 | 12.375 |
| 100 | 5.882 | 8.352 | 11.170 | 10.316 |
| 150 | 5.722 | 8.520 | 9.782 | 11.532 |
| 200 | 8.963 | 7.701 | 12.041 | 11.866 |
| Simulation | Bond Angle (θ°) | Torsion Angle (φ°) | ||||||
|---|---|---|---|---|---|---|---|---|
| Time (ns) | ER-α36 | ER-α36–BFB | ER-α66 | ER-α66–BFB | ER-α36 | ER-α36–BFB | ER-α66 | ER-α66–BFB |
| 0 | 91.07 | 65.54 | 58.65 | 69.67 | −17.33 | −22.56 | −13.83 | −15.57 |
| 1 | 112.46 | 87.56 | 82.39 | 39.63 | −25.96 | −14.55 | −22.86 | −32.88 |
| 10 | 53.87 | 56.86 | 70.41 | 89.27 | −16.88 | −26.99 | −30.06 | −27.32 |
| 50 | 65.66 | 54.72 | 25.98 | 100.18 | −22.55 | −30.81 | −40.11 | −28.56 |
| 100 | 53.87 | 56.86 | 70.41 | 89.27 | −16.88 | −26.99 | −30.06 | −27.32 |
| 150 | 75.80 | 62.57 | 131.03 | 103.78 | −07.32 | −18.45 | −40.58 | −25.01 |
| 200 | 59.24 | 60.28 | 70.93 | 55.98 | −28.21 | −16.90 | −28.39 | −24.22 |
Disclaimer/Publisher’s Note: The statements, opinions and data contained in all publications are solely those of the individual author(s) and contributor(s) and not of MDPI and/or the editor(s). MDPI and/or the editor(s) disclaim responsibility for any injury to people or property resulting from any ideas, methods, instructions or products referred to in the content. |
© 2023 by the authors. Licensee MDPI, Basel, Switzerland. This article is an open access article distributed under the terms and conditions of the Creative Commons Attribution (CC BY) license (https://creativecommons.org/licenses/by/4.0/).
Share and Cite
Adewumi, A.T.; Mosebi, S. Characteristic Binding Landscape of Estrogen Receptor-α36 Protein Enhances Promising Cancer Drug Design. Biomolecules 2023, 13, 1798. https://doi.org/10.3390/biom13121798
Adewumi AT, Mosebi S. Characteristic Binding Landscape of Estrogen Receptor-α36 Protein Enhances Promising Cancer Drug Design. Biomolecules. 2023; 13(12):1798. https://doi.org/10.3390/biom13121798
Chicago/Turabian StyleAdewumi, Adeniyi T., and Salerwe Mosebi. 2023. "Characteristic Binding Landscape of Estrogen Receptor-α36 Protein Enhances Promising Cancer Drug Design" Biomolecules 13, no. 12: 1798. https://doi.org/10.3390/biom13121798
APA StyleAdewumi, A. T., & Mosebi, S. (2023). Characteristic Binding Landscape of Estrogen Receptor-α36 Protein Enhances Promising Cancer Drug Design. Biomolecules, 13(12), 1798. https://doi.org/10.3390/biom13121798