Abstract
Osteoarthritis (OA) is the one of most common joint diseases worldwide. Cuproptosis, which had been discovered lately, is a novel form of cell death induced by copper. Our purpose is to study the relationship between cuproptosis-related genes (CRGs) and inflammatory microenvironments in patients with OA and identify characteristic cuproptosis-related biomarkers. First, the combinatory analysis of OA transcriptome data from five datasets identified differentially expressed CRGs associated with OA. Then, we applied single-sample gene set enrichment analysis (ssGSEA) to evaluate immune-cell infiltration and immune-function levels in OA patients and normal controls, respectively. Hub CRGs for OA were mined based on the random forest (RF) model, and a nomogram prediction model was constructed based on them. In total, four differentially expressed CRGs were identified through bioinformatics analysis and confirmed by RT-qPCR. FDX1 and LIPT1 were expressed at a high level in OA, while DBT and DLST were expressed higher in the normal group. In total, 10 CRGs were found to be significantly correlated with immune landscape. Four hub CRGs were subsequently obtained by the RF analysis as potential biomarkers for OA. We constructed an OA predictive model based on these four CRGs (DBT, DLST, FDX1, and LIPT1).
1. Introduction
Osteoarthritis (OA) is a common joint disorder that exerts an extensive health burden on the affected individuals, health-care systems, and wider socioeconomic costs [1,2,3]. The occurrence of OA is related to multiple elements such as inflammation, senescence, fatness, joint injuries, metabolic disorders, and so on [2]. Pathological changes in OA involve almost all of the joint tissues, including cartilage, subchondral bone, the synovial membrane, etc. [4]. Clinical diagnosis based on symptoms (pain, brief morning stiffness, and functional limitations) and a brief physical examination are the golden criteria for confirming OA [2]. The typical management of OA is palliative and reactive, and joint-replacement surgery can be performed when appropriate [2]. As the exact pathogenesis of OA is still unclear currently, there are no effective drugs to slow down the progression of the disease [5].
As the boundary between the internal structure of the joint and adjacent soft tissues, the synovial membrane is very important to maintain the stability of the joint microenvironment. Although in osteoarthritic joints the primary histopathological change is cartilage destruction, synovitis is also a common feature of OA [4]. It has been reported that the release of inflammatory factors and degrading enzymes in the synovial tissues is closely related to the severity of OA [4]. Therefore, synovitis is a participant in OA progression rather than a bystander, suggesting that synovitis may be a key potential target for OA therapy.
Research has shown that the advancement of OA is regulated by multiple different mechanisms of cell death, including pyroptosis, ferroptosis, apoptosis, and necroptosis [6]. In a recent study published in Science, Tsvetkov et al. discovered a new form of copper-dependent cell death termed cuproptosis [7]. This is nonapoptotic cell death that involves intracellular copper accumulation, mitochondrial lipoylated proteins aggregation, and Fe–S cluster proteins destabilization [7,8,9,10,11]. In OA joints, mitochondrial function in chondrocytes and synoviocytes is severely disturbed, characterized by enhanced inflammation, increased apoptosis, augmented catabolic activity, and decreased mitochondrial biogenesis [12,13]. The hypoxia state of synovial tissue alters the response of synovial cells to apoptotic stimuli [12]. Additionally, Yazar et al. found that in synovial fluid, Cu and Fe is concentrated more densely in patients with OA than in healthy subjects (p < 0.05) [14]. Therefore, it would be reasonable to speculate that in OA progression cuproptosis may play an important role. However, the potential regulatory mechanisms of cuproptosis in OA have yet to be elucidated and require further exploration.
In our study, for the first time, we systematically investigated the differentially expressed cuproptosis-related genes (CRGs) and immune characteristics between normal and OA individuals. We applied the support vector machine (SVM) learning and random forest (RF) methods to identify the cuproptosis-related key biomarkers and used the drug database to obtain the cuproptosis-related ideal drug targets for OA.
2. Materials and Methods
2.1. Data Source and Differentially Expressed Genes Acquirement
The transcriptome profiles and clinical information of 38 OA patients and 36 healthy controls were downloaded from five datasets (GSE1919, GSE41038, GSE55235, GSE82107, and GSE55457) on the gene-expression omnibus (GEO) (http://www.ncbi.nlm.nih.gov/geo/, assessed on 14 August 2022) database. We then employed the SVA method to merge the GSE1919, GSE41038, GSE55235, GSE82107, and GSE55457 datasets [15].
CRGs were extracted from previous literature by Tsvetkov et al. [7]. Finally, 11 CRGs were included in our research, containing FDX1, LIPT1, LIAS, DLD, DBT, DLST, DLAT, PDHA1, PDHB, ATP7A, and ATP7B.
Differentially expressed CRGs between OA patients and normal controls were screened out by applying the “limma” package, with the criteria setting as p < 0.05 and a |log fold change (FC)| >1 [16]. The visualization of the chromosomal localization of CRGs was accomplished using the R circos package [17].
2.2. Immune Infiltration Analysis
Given that immune-cell infiltration such as T cells, B cells, and macrophages was detected in synovial tissues of OA patients [18], we further comprehensively investigated the total immune landscape, which included both immune-cell infiltration and immune function using the single sample gene set enrichment analysis (ssGSEA) algorithm. The ssGSEA method was applied to evaluate the abundance of 17 immune-cell infiltration and 13 immune-function levels in the OA patients and normal controls [19]. Spearman’s correlation analysis was performed between CRGs and the immune infiltration using the R ggcorrplot package [20].
2.3. The Hub Genes Were Screened Based on the RF Analysis
To predict the occurrence of OA, we constructed a training model adopting both the SVM and RF methods. Boxplots of residuals, the reverse cumulative distribution of residuals, and the receiver operating characteristic (ROC) curve were used to compare the accuracy of the two models. The RF method was then selected to screen differentially expressed CRGs using the R library ‘randomForest’ with ‘mtry’ and ‘ntree’ setting to 3 and 500, respectively [21]. The optimal ‘ntree’ was chosen according to minimum cross-validation error in 10-fold cross-validation, and the significance of differentially expressed CRGs with the optimal ntree was assessed. We then constructed a nomogram using the ‘rms’ package [22,23]. Calibration curves were used to evaluate the consistency between the observed and predicted values. Finally, we performed clinical-impact-curve and decision-curve analyses to evaluate the clinical benefits of our model.
2.4. Functional Enrichment Analysis of 4 Cuproptosis Hub Genes
The biological process (BP), cellular component (CC), and molecular function (MF) of gene ontology (GO), and the Kyoto Encyclopedia of Genes and Genomes (KEGG) enrichment analysis of 4 CRGs, were performed on Enrichr (https://maayanlab.cloud/Enrichr/, assessed on 14 August 2022) [24], an interactive and collaborative gene-list-enrichment-analysis tool. The p value < 0.05 was considered significantly enriched.
2.5. Protein–Protein Interaction (PPI) Network Analysis
In order to portray functional and physical interactions among cuproptosis in OA utilizing the STRING (https://string-db.org/, assessed on 14 August 2022) (version 11.0) repository, we respectively constructed the PPI network of proteins derived from all CRGs included in our study and four hub CRGs [25]. In this experiment, the low confidence value was set as 0.15 to generate the PPI network of CRGs.
2.6. Recognition of Transcription Factors and miRNAs Engage with 4 Hub Genes
NetworkAnalyst is a broad online platform for the meta-analysis of gene expression data [26]; JASPAR is a publicly available resource for TFs profiles for multiple species [27]; and MirTarbase is the one of biggest experimental validity databases for miRNAs–target gene interactions [28]. We have utilized the JASPAR database on the NetworkAnalyst platform to figure out topologically credible TFs that tend to bind to our hub genes. MiRNAs that interact with hub genes focused on topological analysis were extracted from the interaction of miRNA–gene on mirTarbase database via networkAnalyst.
2.7. Identification of Potential Small Molecules for OA
The drug signatures database (DSigDB) on the Enricher platform was used to generate the small molecules that could downregulate the expression of hub genes [24,29].
2.8. Sample Collection
Synovial tissue from 3 patients of meniscus injury and 3 of OA were collected from Huashan hospital. All patients critically read and signed the informed consent form (KY2020-060), which was approved by the ethics committee of Huashan Hospital. The research followed the guidelines of the 1975 Declaration of Helsinki.
2.9. Reverse-Transcription Quantitative Polymerase Chain Reaction (RT-qPCR)
The total synovial tissue RNA was extracted using Trizol (Servicebio), and then total RNA was reverse-transcribed to complementary DNA (cDNA) using Servicebio®RT Enzyme Mix. The qRT-PCR was performed using the 2×SYBR Green qPCR Master Mix (None ROX) (Servicebio). The primer sequence of genes used in our study is listed in Table S1. Genes were normalized to GAPDH. Relative levels of mRNA were expressed as fold-changes as calculated by the 2−ΔΔCT method. Each biological sample was technically performed in triplicate.
2.10. Statistical Analysis
All statistical analyses in our study were performed with R software, version 4.1.1. For all figures: * represents p < 0.05, ** represents p < 0.01, and *** represents p < 0.001.
3. Results
3.1. Differentially Expressed CRGs in OA
We extracted the gene expression matrix of 11 CRGs from patients with OA (n = 38) and normal subjects (n = 36). The distribution of differentially expressed CRGs between normal controls and OA patients was visualized by a boxplot and a heatmap in Figure 1A,B. It showed that FDX1 (p < 0.001) and LIPT1 (p < 0.01) were expressed more highly in OA, while DBT (p < 0.001) and DLST (p < 0.01) were expressed more lowly in OA. The relevant heat map of CRGs was shown in Figure 1C. To illustrate, DLD expression was significantly positively correlated with DLAT expression, and DLAT expression was significantly positively correlated with ATP7A expression (Figure 1C). The chromosome location demonstrated that DBT was localized on chromosome 1, LIPT1 on chromosome 2, PDHB on chromosome 3, LIAS on chromosome 4, DLD on chromosome 7, SLC31A1 on chromosome 9, DLAT and FDX1 on chromosome 11, ATP7B on chromosome 13, DLST on chromosome 14, GCSH on chromosome 16, and PDHA1 and ATP7A on chromosome X (Figure 1D).
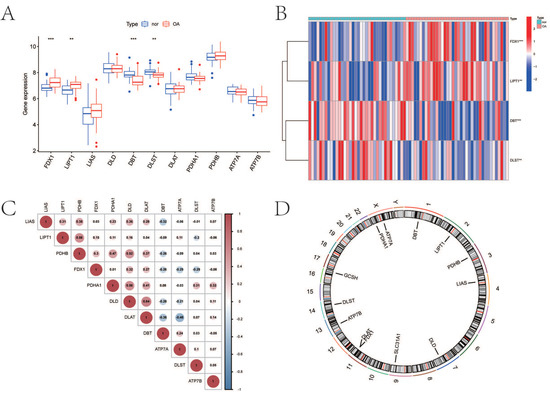
Figure 1.
Expression characteristics and gene localization of CRGs. (A) Boxplot showing differences in the expression of CRGs in OA and normal tissues, with significant differences in the expression of 4 genes. (B) Heat map showing the expression characteristics of CRGs in OA tissues and normal tissues. Red showing high expression levels while blue showing low expression levels. (C) Spearman correlation analysis of CRGs; positive correlation is represented by red, while negative correlation is represented by blue. (D) The position of CRGs on the chromosome (for all figures: ** represents p < 0.01, and *** represents p < 0.001). CRGs, cuproptosis-related genes; OA, osteoarthritis.
3.2. Immune Infiltration Analysis
Figure 2A demonstrated immune-cell infiltration and immune function enrichment in each sample. The relevant heat map of immune cells and immune functions are displayed, respectively (Figure 2B,C). Figure 2D showed that B cells (p < 0.01), macrophages (p < 0.001), mast cells (p < 0.001), neutrophils (p < 0.001), natural killer (NK) cells (p < 0.001), T helper cells (p < 0.001), and tumor-infiltrating lymphocytes (TIL) (p < 0.001) expressed higher in OA. Figure 2E indicated that immune function, including antigen-presenting cell (APC) co-inhibition (p < 0.05), APC co-stimulation (p < 0.05), check-point (p < 0.001), cytolytic activity (p < 0.01), human leukocyte antigen (HLA) (p < 0.001), inflammation-promoting (p < 0.001), para-inflammation (p < 0.001), T cell co-inhibition (p < 0.001), T cell co-stimulation (p < 0.001), type I interferon (IFN) response (p < 0.001), and type II IFN response (p < 0.001) were enriched in OA. The CRGs expression and immune infiltration were correlated (Figure 2F), and 10 genes (FDX1, LIPT1, LIAS, DLD, DBT, DLST, DLAT, PDHA1, PDHB, and ATP7B) were mostly related. To illustrate, PDHA1 expression was significantly negatively correlated with cytokine–cytokine receptor interaction (CCR), while FDX1 expression was significantly positively correlated with neutrophils (Figure 2F).
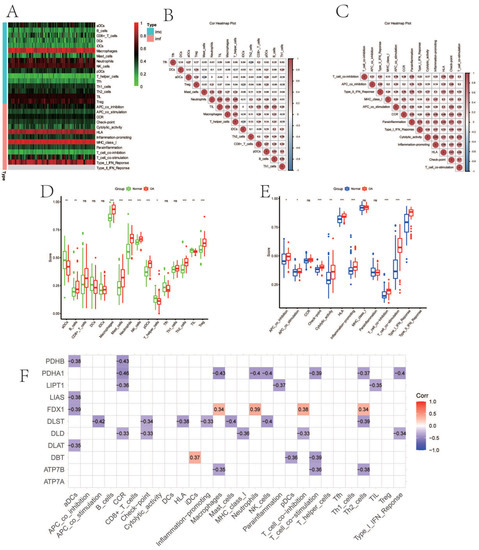
Figure 2.
The immune landscape and correlation analysis between CRGs and immune infiltration in OA. (A) Heatmap showing the expression characteristics of immune cells and immune function in OA and normal tissues. Red represents high expression levels, while green represents low expression levels. (B,C) The correlation analysis of immune cells (B) and immune function (C); positive correlation is represented by red, while negative correlation is represented by blue. (D,E) Boxplot showing differences in the expression of immune cells (D) and immune function (E) in OA and normal tissues. (F) Correlation between immune infiltration and CRGs; positive correlation is represented by red, while negative correlation is represented by blue. (For all figures: * represents p < 0.05, ** represents p < 0.01, and *** represents p < 0.001). CRGs, cuproptosis-related genes; OA, osteoarthritis.
3.3. The SVM and RF Methods Were Used to Construct an OA Predictive Model Based on Four CRGs
Boxplots of residuals (Figure 3A), reverse cumulative distribution of residuals (Figure 3B), and ROC curve analysis (Figure 3C) demonstrated that RF displayed notably high predictive capability. According to the minimum cross-validation error in 10-fold cross-validation, the best ‘ntree’ was selected (Figure 3D). In total, we identified four CRGs (DBT, DLST, FDX1, and LIPT1) and ranked them according to their importance (Figure 3E). To predict the probability of OA, we constructed a nomogram evaluation mode based on four CRGs (Figure 3F). The calibration curves (Figure 3G), decision-curve analysis (DCA) (Figure 3H), and clinical impact plots (Figure 3I) proved the nomogram model to be an ideal predictive model for OA.
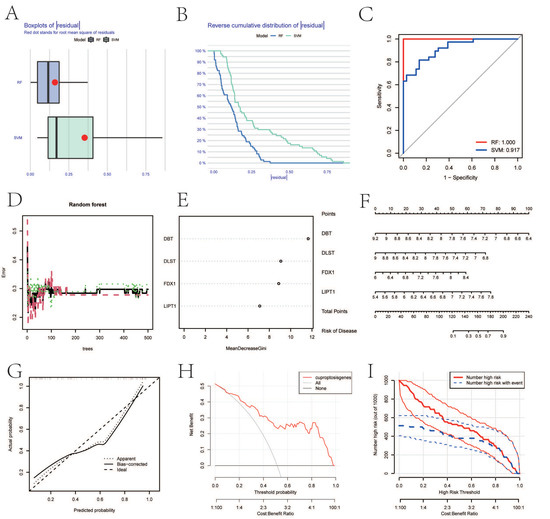
Figure 3.
SVM and RF methods were used to screen hub genes. (A–C) Boxplot of the residual distribution (A), reverse cumulative distribution of residuals (B), and ROC curves (C) as a function of the values of observed sensitivity between RF and SVM. (D) RF prediction error curves based on 10-fold cross-validation. (E) The importance of the four CRGs based on the RF model. (F) Nomogram of the predictive model based on four CRGs. (G) Calibration curves showing that the nomogram model may be an ideal predictive model for OA. (H,I) DCA (H) and clinical impact plots (I) were used to determine the clinical utility of the risk prediction nomograms. SVM, support vector machine; RF, random forest; ROC, receiver operating characteristic; CRGs, cuproptosis-related genes; OA, osteoarthritis; and DCA, decision-curve analysis.
3.4. Function Enrichment Analyses of 4 Hub Genes
We performed enrichment analysis to identify distinct biological roles for four CRGs. The BP analysis of GO terms demonstrated that the genes were significantly enriched in the cellular amino acid catabolic process, the succinyl-CoA metabolic process, protein lipoylation, the lysine catabolic process, the lysine metabolic process, the cellular protein metabolic process, the 2-oxoglutarate metabolic process, the C21-steroid hormone biosynthetic process, the aspartate family amino acid catabolic process, and the branched-chain amino acid catabolic process (Figure 4A). With regards to the CC, the genes were mostly related to the mitochondrial matrix, intracellular organelle lumen, the oxoglutarate dehydrogenase complex, and the mitochondrial alpha–ketoglutarate dehydrogenase complex (Figure 4B). For the MF of GO terms, hub genes were mostly related to acyltransferase activity, transferring groups other than amino-acyl groups, two irons, two sulfur-cluster bindings, and acetyltransferase activity and iron ion binding (Figure 4C). The KEGG results exhibited that the genes were mainly related to citrate cycle, propanoate metabolism, tryptophan metabolism, valine, leucine, and isoleucine degradation and lysine degradation (Figure 4D).
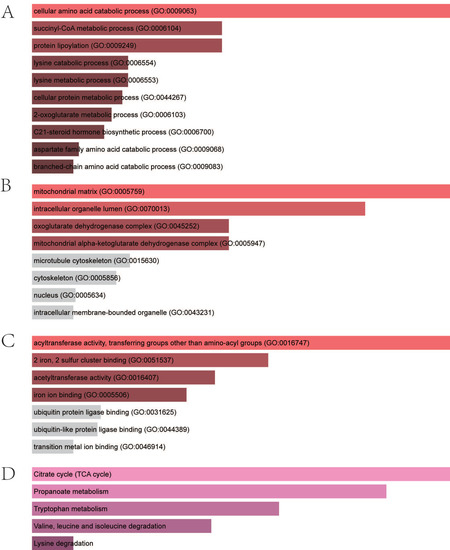
Figure 4.
Enrichment analysis of four hub genes. (A) Significantly enriched biological processes. (B) Significantly enriched cellular components. (C) Significantly enriched molecular functions. (D) Significantly enriched KEGG pathway. KEGG, Kyoto Encyclopedia of Genes and Genomes.
3.5. Clarification of Protein–Protein Network
As depicted in Figure 5A, the PPI network of 11 CRGs consisted of 11 nodes and 35 edges. The PPI network of hub–gene interactions is shown in Figure 5B.
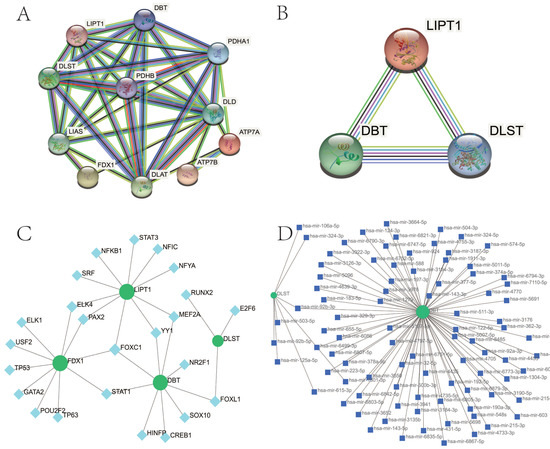
Figure 5.
PPI network of CRGs in OA. (A) The PPI network of 11 CRGs had 11 nodes and 35 edges. (B) The PPI network of four hub CRGs. CRGs, cuproptosis-related genes; PPI, protein–protein interaction; OA, osteoarthritis. (C) The cohesive regulatory interaction network of four hub gene–TF. Herein, the square nodes were TFs, and gene symbols interacted with TFs as circle nodes. TF, Transcription factors. (D) The interconnected regulatory interaction network of four hub gene–miRNA. Herein, the square node indicated miRNAs and gene symbols interacted with miRNAs as a circle shape. miRNAs, microRNAs.
3.6. Determination of Regulatory Signatures
TF regulators’ and miRNA regulators’ interaction with four hub CRGs were depicted in Figure 5C,D, respectively. We ascertained 28 TFs and 91 miRNAs regulatory signatures.
3.7. Prediction of Candidate Drugs
The top 10 drug candidates associated with CRGs were selected based on p-values and adjusted p-values. Table 1 showed the top 10 candidate drugs.

Table 1.
Suggested top 10 small molecules for OA. OA, osteoarthritis.
3.8. Validation of Hub Genes
We confirmed the four cuproptosis-related biomarkers using RT-qPCR in order to verify our results. In comparison with the control group, the expression of DBT and DLST were down-regulated in OA synovial tissue; however, the expression of FDX1 and LIPT1 were significantly up-regulated (Figure 6). These results were consistent with our predictions using bioinformatics tools.
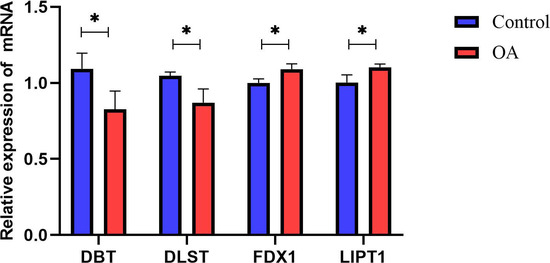
Figure 6.
Validation of hub CRGs using qRT-PCR. The relative mRNA expressions of DBT, DLST, FDX1, and LIPT1 were displayed (* represents p < 0.05).
4. Discussion
OA is the most common arthritis, and it is placing an increasing health burden on individuals and society [2]. Due to the heterogeneity of its clinical manifestations and a lack of effective treatment strategies, the underlined pathogenesis of OA needs to be clarified, and a model to exactly predict the risk of OA occurrence is demanded [2,30]. As a recently reported form of copper-dependent cell death, cuproptosis is closely associated with the progression of many diseases [7]. However, its regulatory roles have not been clearly demonstrated, especially in inflammatory diseases [7]. Therefore, we sought to elucidate the specific role of CRGs in the OA phenotype and its association with the immune microenvironment of OA. Our study comprehensively investigated the expression profiles of CRGs in synovial tissues between normal subjects and OA patients, with the upregulation of FDX1 and LIPT1 and the downregulation of DBT and DLST in OA. We then observed whether there was a correlation between CRGs expression levels. These results indicated that CRGs, especially FDX1, LIPT1, DBT, and DLST, may be involved in OA development through a regulatory network. We further demonstrated the immune-cell infiltration and immune-function levels in OA using the ssGSEA algorithm. The correlation between CRGs and immune cell infiltration was then calculated in order to clarify the CRG signature in the immune landscape of OA, and most of CRGs were negatively regulated. In order to construct a reliable predictive model, we made a comparison with the performance of the SVM and RF methods and finally obtained four cuproptosis-related biomarkers (FDX1, LIPT1, DBT, and DLST) by the RF analysis. RT-qPCR was performed to verify our findings, and it was consistent with results from bioinformatics tools, which reaffirmed the important role of CRGs in OA. We established a cuproptosis nomogram for predicting the risk of OA. Different scores were assigned to FDX1, LIPT1, DBT, and DLST. The factor scores were summed up to obtain the total score. If the gross score was no more than 120, the possibility of occurrence of OA was less than 0.1, and if the total score was more than 200, the chance of OA was greater than 0.9.
Four genes (FDX1, LIPT1, DBT, and DLST) were determined as hub CRGs in OA. Similar to many other microelements such as iron, copper is a fundamental element playing an important role as a cofactor for essential enzymes that are necessary for human activities [31]. Homeostatic mechanisms maintained the concentration of intracellular copper ions at very low levels, and once the threshold was exceeded, the copper became toxic, directly leading to cell death [32]. Recently, the specific mechanism by which copper triggers cell death, termed cuproptosis, has been elucidated: excess intracellular copper induced the aggregation of specific lipoylated enzymes, which was associated with the mitochondrial tricarboxylic acid (TCA) cycle, resulting in proteotoxic stress and cell death [7]. During this process, scientists identified several key genes: DBT (dihydrolipoamide branched chain transacylase E2) and DLST (dihydroli-poamide S-succinyltransferase) were among four of the enzymes that were lipoylated by Cu, and they encoded enzymes that regulated carbon entry into the TCA cycle; FDX1 (Ferredoxin 1, a direct target of copper ionophores) served as an upstream molecule to regulate protein lipoylation; and LIPT1 (lipolytransferase 1) encoded lipoic acid pathway-related enzymes [7,9]. In our research, the downregulation of DBT and DLST, together with the upregulation of FDX1 and LIPT1, may indicate the potential role of cuproptosis in OA synovitis.
However, our study still has some limitations that need to be emphasized [6,31,32,33,34]. Firstly, the data source was obtained from a public database, and input errors could not be assessed. Second, it would be better to include more detailed clinical features to confirm the performance of the predictive model. Furthermore, RT-qPCR was performed to verify the different expressions between OA and healthy samples; however, more experiments such as flow cytometry and single-cell sequencing still need to be supplemented to specifically clarify the mechanism.
Overall, we unveiled the correlation between CRGs and immune infiltration in OA patients. A four-CRGs-based RF machine learning model was constructed, which can accurately predict the occurrence risk of OA patients. Our study, for the first time, explored the role of cuproptosis in OA, which may be helpful for elucidating the underlying molecular mechanisms leading to OA progression in the future.
Supplementary Materials
The following supporting information can be downloaded at: https://www.mdpi.com/article/10.3390/biom13010127/s1, Table S1: Primers employed in this study.
Author Contributions
Z.C., W.W. and Y.H. proposed the concept of this research. The first draft of the paper was completed by Z.C. All of the authors contributed equally to the development of the review protocol; the data analysis; the refinement of the manuscript; and the approval of the final manuscript. Z.C. and W.W. reviewed and revised the manuscript before submission for publication. All authors have read and agreed to the published version of the manuscript.
Funding
This research was funded by the National Key R&D Program of China (grant numbers 2020YFA0803800) and the National Natural Science Foundation of China (grant numbers 82072510).
Institutional Review Board Statement
Not applicable.
Informed Consent Statement
All patients critically read and signed the informed consent form (KY2020-060), which was approved by the ethics committee of Huashan Hospital. The research followed the guidelines of the 1975 Declaration of Helsinki.
Data Availability Statement
The datasets presented in this study can be found in online repositories (GEO, https://www.ncbi.nlm.nih.gov/geo/, assessed on 14 August 2022).
Conflicts of Interest
The authors declare no conflict of interest.
Abbreviations
| OA | Osteoarthritis |
| CRGs | Cuproptosis-related genes |
| GEO | Gene-expression omnibus |
| ssGSEA | Single-sample gene-set enrichment analysis |
| RF | Random forest |
| PPI | Protein–protein interaction |
| RT-qPCR | Real-time quantitative PCR |
| ROC | Receiver operating characteristic; |
| BP | Biological process |
| CC | Cellular component |
| MF | Molecular function |
| KEGG | Kyoto Encyclopedia of Genes and Genomes |
| DSigDB | Drug signatures database |
| NK | Natural killer |
| TIL | Tumor-infiltrating lymphocytes |
| APC | Antigen-presenting cell |
| HLA | Human leukocyte antigen |
| IFN | Type I interferon |
| CCR | Cytokine–cytokine receptor interaction |
| TCA | Tricarboxylic acid |
| DBT | Dihydrolipoamide branched chain transacylase E2 |
| DLST | Dihydroli-poamide S-succinyltransferase |
| FDX1 | Ferredoxin 1, a direct target of copper ionophores |
| LIPT1 | Lipolytransferase 1 |
References
- Puig-Junoy, J.; Ruiz Zamora, A. Socio-Economic Costs of Osteoarthritis: A Systematic Review of Cost-of-Illness Studies. Semin. Arthritis Rheum. 2015, 44, 531–541. [Google Scholar] [CrossRef] [PubMed]
- Hunter, D.J.; Bierma-Zeinstra, S. Osteoarthritis. Lancet 2019, 393, 1745–1759. [Google Scholar] [CrossRef] [PubMed]
- Hunter, D.J.; March, L.; Chew, M. Osteoarthritis in 2020 and beyond: A Lancet Commission. Lancet 2020, 396, 1711–1712. [Google Scholar] [CrossRef] [PubMed]
- Sanchez-Lopez, E.; Coras, R.; Torres, A.; Lane, N.E.; Guma, M. Synovial Inflammation in Osteoarthritis Progression. Nat. Rev. Rheumatol. 2022, 18, 258–275. [Google Scholar] [CrossRef] [PubMed]
- Liu, G.; He, G.; Zhang, J.; Zhang, Z.; Wang, L. Identification of SCRG1 as a Potential Therapeutic Target for Human Synovial Inflammation. Front. Immunol. 2022, 13, 893301. [Google Scholar] [CrossRef]
- Yang, J.; Hu, S.; Bian, Y.; Yao, J.; Wang, D.; Liu, X.; Guo, Z.; Zhang, S.; Peng, L. Targeting Cell Death: Pyroptosis, Ferroptosis, Apoptosis and Necroptosis in Osteoarthritis. Front. Cell Dev. Biol. 2022, 9, 789948. [Google Scholar] [CrossRef]
- Tsvetkov, P.; Coy, S.; Petrova, B.; Dreishpoon, M.; Abdusamad, M.; Rossen, J.; Joesch-cohen, L.; Humeidi, R.; Spangler, R.D.; Eaton, J.K.; et al. Copper Induces Cell Death by Targeting Lipoylated TCA Cycle Proteins. Science 2022, 375, 1254–1261. [Google Scholar] [CrossRef]
- Wang, Y.; Zhang, L.; Zhou, F. Cuproptosis: A New Form of Programmed Cell Death. Cell Mol. Immunol. 2022, 19, 867–868. [Google Scholar] [CrossRef]
- Tang, D.; Chen, X.; Kroemer, G. Cuproptosis: A Copper-Triggered Modality of Mitochondrial Cell Death. Cell Res. 2022, 32, 417–418. [Google Scholar] [CrossRef]
- Li, S.-R.; Bu, L.-L.; Cai, L. Cuproptosis: Lipoylated TCA Cycle Proteins-Mediated Novel Cell Death Pathway. Signal Transduct. Target. Ther. 2022, 7, 21–23. [Google Scholar] [CrossRef]
- Cobine, P.A.; Brady, D.C. Cuproptosis: Cellular and Molecular Mechanisms Underlying Copper-Induced Cell Death. Mol. Cell 2022, 82, 1786–1787. [Google Scholar] [CrossRef] [PubMed]
- Li, M.; Luo, X.; Long, X.; Jiang, P.; Jiang, Q.; Guo, H.; Chen, Z. Potential Role of Mitochondria in Synoviocytes. Clin. Rheumatol. 2021, 40, 447–457. [Google Scholar] [CrossRef]
- Zheng, L.; Zhang, Z.; Sheng, P.; Mobasheri, A. The Role of Metabolism in Chondrocyte Dysfunction and the Progression of Osteoarthritis. Ageing Res. Rev. 2021, 66, 101249. [Google Scholar] [CrossRef]
- Yazar, M.; Sarban, S.; Kocyigit, A.; Isikan, U.E. Synovial Fluid and Plasma Selenium, Copper, Zinc, and Iron Concentrations in Patients with Rheumatoid Arthritis and Osteoarthritis. Biol. Trace Elem. Res. 2005, 106, 123–132. [Google Scholar] [CrossRef]
- Leek, J.T.; Johnson, W.E.; Parker, H.S.; Fertig, E.J.; Jaffe, A.E.; Storey, J.D. Sva: Surrogate Variable Analysis. R Package Version 2019, 3, 882–883. [Google Scholar]
- Ritchie, M.E.; Phipson, B.; Wu, D.; Hu, Y.; Law, C.W.; Shi, W.; Smyth, G.K. Limma Powers Differential Expression Analyses for RNA-Sequencing and Microarray Studies. Nucleic Acids Res. 2015, 43, e47. [Google Scholar] [CrossRef] [PubMed]
- An, J.; Lai, J.; Sajjanhar, A.; Batra, J.; Wang, C.; Nelson, C.C. J-Circos: An Interactive Circos Plotter. Bioinformatics 2015, 31, 1463–1465. [Google Scholar] [CrossRef] [PubMed]
- Donahoe Immunopathogenesis of Osteoarthritis. Mol. Cell Biochem. 2012, 23, 1–7. [CrossRef]
- Bindea, G.; Mlecnik, B.; Tosolini, M.; Kirilovsky, A.; Waldner, M.; Obenauf, A.C.; Angell, H.; Fredriksen, T.; Lafontaine, L.; Berger, A.; et al. Spatiotemporal Dynamics of Intratumoral Immune Cells Reveal the Immune Landscape in Human Cancer. Immunity 2013, 39, 782–795. [Google Scholar] [CrossRef]
- Yan, L.-R.; Ding, H.-X.; Shen, S.-X.; Lu, X.-D.; Yuan, Y.; Xu, Q. Pepsinogen C Expression–Related LncRNA/CircRNA/MRNA Profile and Its Co-Mediated CeRNA Network in Gastric Cancer. Funct. Integr. Genom. 2021, 21, 605–618. [Google Scholar] [CrossRef]
- Liaw, A.; Wiener, M. Classification and Regression by RandomForest. R News 2002, 2, 18–22. [Google Scholar]
- Harrell, F.E., Jr. Rms: Regression Modeling Strategies. R Package Version 5.0-0. CRAN. 2016. Available online: https://cran.r-project.org/web/packages/rms/index.html (accessed on 14 August 2022).
- Park, S.Y. Nomogram: An Analogue Tool to Deliver Digital Knowledge. J. Thorac. Cardiovasc. Surg. 2018, 155, 1793. [Google Scholar] [CrossRef] [PubMed]
- Kuleshov, M.V.; Jones, M.R.; Rouillard, A.D.; Fernandez, N.F.; Duan, Q.; Wang, Z.; Koplev, S.; Jenkins, S.L.; Jagodnik, K.M.; Lachmann, A.; et al. Enrichr: A Comprehensive Gene Set Enrichment Analysis Web Server 2016 Update. Nucleic Acids Res. 2016, 44, W90–W97. [Google Scholar] [CrossRef]
- Mahmud, S.M.H.; Al-Mustanjid, M.; Akter, F.; Rahman, M.S.; Ahmed, K.; Rahman, M.H.; Chen, W.; Moni, M.A. Bioinformatics and System Biology Approach to Identify the Influences of SARS-CoV-2 Infections to Idiopathic Pulmonary Fibrosis and Chronic Obstructive Pulmonary Disease Patients. Brief. Bioinform. 2021, 22, bbab115. [Google Scholar] [CrossRef] [PubMed]
- Xia, J.; Gill, E.E.; Hancock, R.E.W. NetworkAnalyst for Statistical, Visual and Network-Based Meta-Analysis of Gene Expression Data. Nat. Protoc. 2015, 10, 823–844. [Google Scholar] [CrossRef] [PubMed]
- Khan, A.; Fornes, O.; Stigliani, A.; Gheorghe, M.; Castro-Mondragon, J.A.; Van Der Lee, R.; Bessy, A.; Chèneby, J.; Kulkarni, S.R.; Tan, G.; et al. JASPAR 2018: Update of the Open-Access Database of Transcription Factor Binding Profiles and Its Web Framework. Nucleic Acids Res. 2018, 46, D260–D266. [Google Scholar] [CrossRef]
- Huang, H.Y.; Lin, Y.C.D.; Li, J.; Huang, K.Y.; Shrestha, S.; Hong, H.C.; Tang, Y.; Chen, Y.G.; Jin, C.N.; Yu, Y.; et al. MiRTarBase 2020: Updates to the Experimentally Validated MicroRNA-Target Interaction Database. Nucleic Acids Res. 2020, 48, D148–D154. [Google Scholar] [CrossRef]
- Yoo, M.; Shin, J.; Kim, J.; Ryall, K.A.; Lee, K.; Lee, S.; Jeon, M.; Kang, J.; Tan, A.C. DSigDB: Drug Signatures Database for Gene Set Analysis. Bioinformatics 2015, 31, 3069–3071. [Google Scholar] [CrossRef]
- Duan, Y.; Yu, C.; Yan, M.; Ouyang, Y.; Ni, S. M6A Regulator-Mediated RNA Methylation Modification Patterns Regulate the Immune Microenvironment in Osteoarthritis. Front. Genet. 2022, 13, 921256. [Google Scholar] [CrossRef]
- Lai, Y.; Lin, C.; Zhao, Y.; Lin, F. Identification and Immunological Characterization of Cuproptosis-Related Molecular Clusters in Alzheimer’ s Disease. Front. Aging Neurosci. 2022, 14, 932676. [Google Scholar] [CrossRef]
- Yang, M.; Zheng, H.; Xu, K.; Yuan, Q. A Novel Signature to Guide Osteosarcoma Prognosis and Immune Microenvironment: Cuproptosis-Related LncRNA. Front. Immunol. 2022, 13, 919231. [Google Scholar] [CrossRef] [PubMed]
- Lv, H.; Liu, X.; Zeng, X.; Liu, Y.; Zhang, C.; Zhang, Q.; Xu, J. Comprehensive Analysis of Cuproptosis-Related Genes in Immune Infiltration and Prognosis in Melanoma. Front. Pharmacol. 2022, 13, 930041. [Google Scholar] [CrossRef] [PubMed]
- Bian, Z.; Fan, R.; Xie, L. A Novel Cuproptosis-Related Prognostic Gene Signature and Validation of Differential Expression in Clear Cell Renal Cell Carcinoma. Genes 2022, 13, 851. [Google Scholar] [CrossRef] [PubMed]


Disclaimer/Publisher’s Note: The statements, opinions and data contained in all publications are solely those of the individual author(s) and contributor(s) and not of MDPI and/or the editor(s). MDPI and/or the editor(s) disclaim responsibility for any injury to people or property resulting from any ideas, methods, instructions or products referred to in the content. |
© 2023 by the authors. Licensee MDPI, Basel, Switzerland. This article is an open access article distributed under the terms and conditions of the Creative Commons Attribution (CC BY) license (https://creativecommons.org/licenses/by/4.0/).