
Lipid Readjustment in Yarrowia lipolytica Odd-Chain Fatty Acids Producing Strains

 , ,
, ,
Abstract
1. Introduction
2. Materials and Methods
2.1. Strains and Media Composition
2.2. Culture Conditions
2.3. Lipid Extraction and Analysis by GC-FID
2.4. Lipid Extraction and Analysis by LC-MS and LC-Corona-CAD®
3. Results
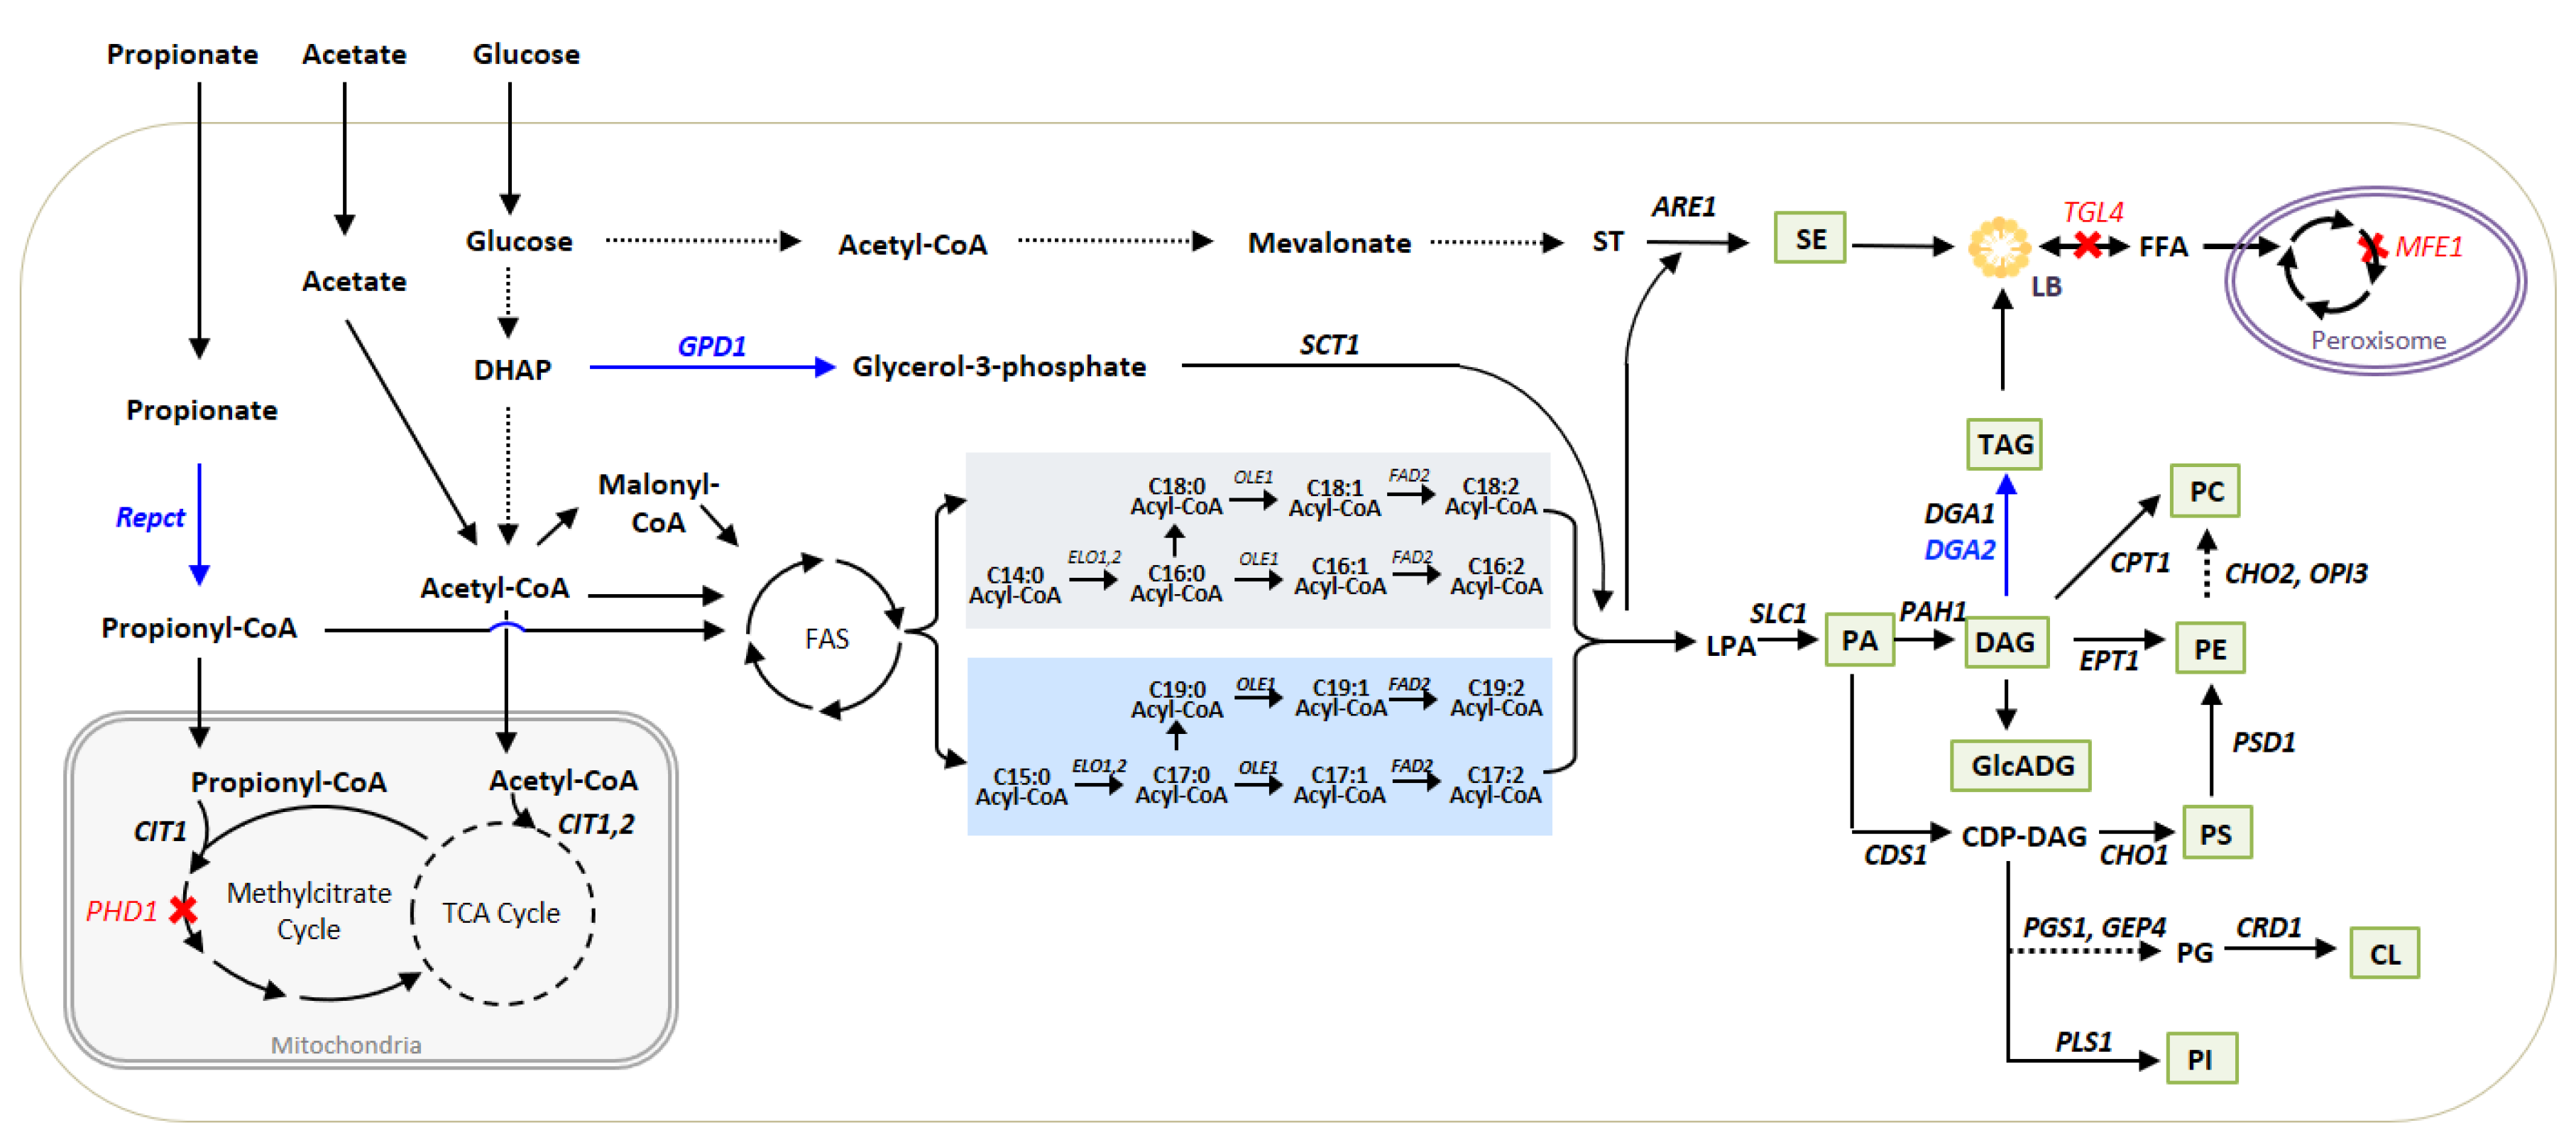
3.1. Metabolic Pathways for Lipid Synthesis and Lipid Readjustments
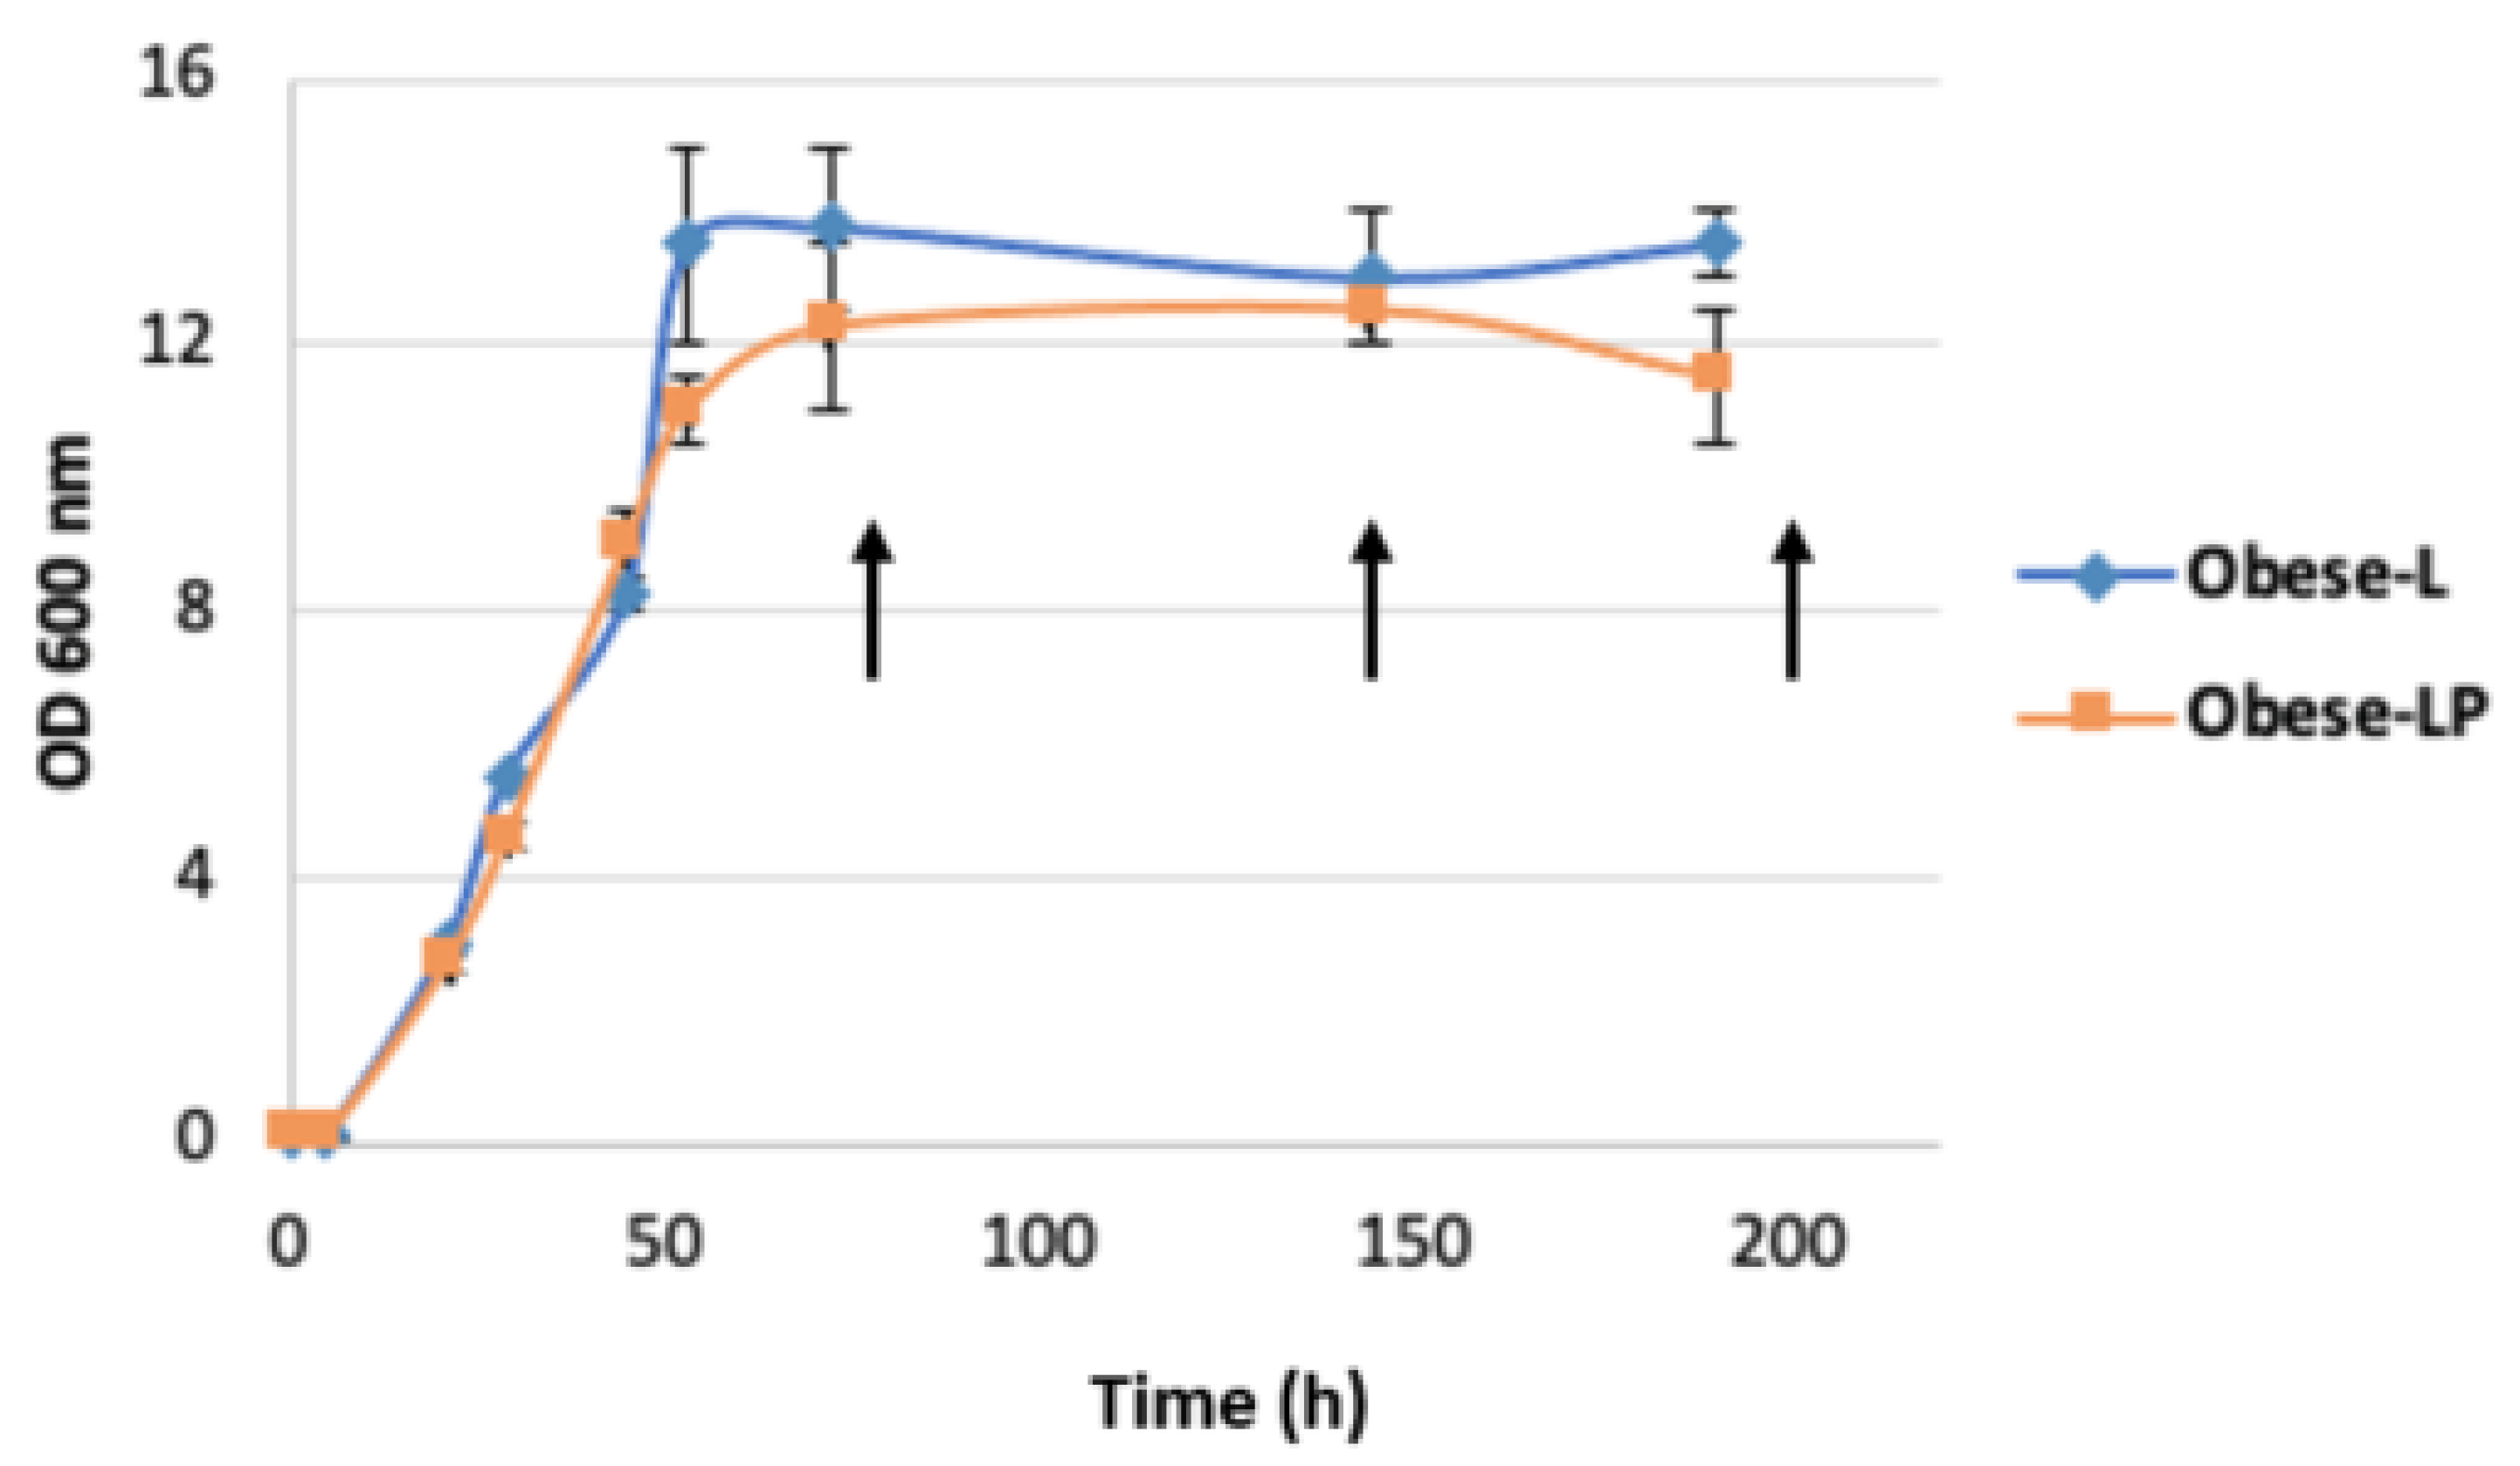
3.2. Odd-Chain Fatty Acid Production by Obese L and Obese LP Strains
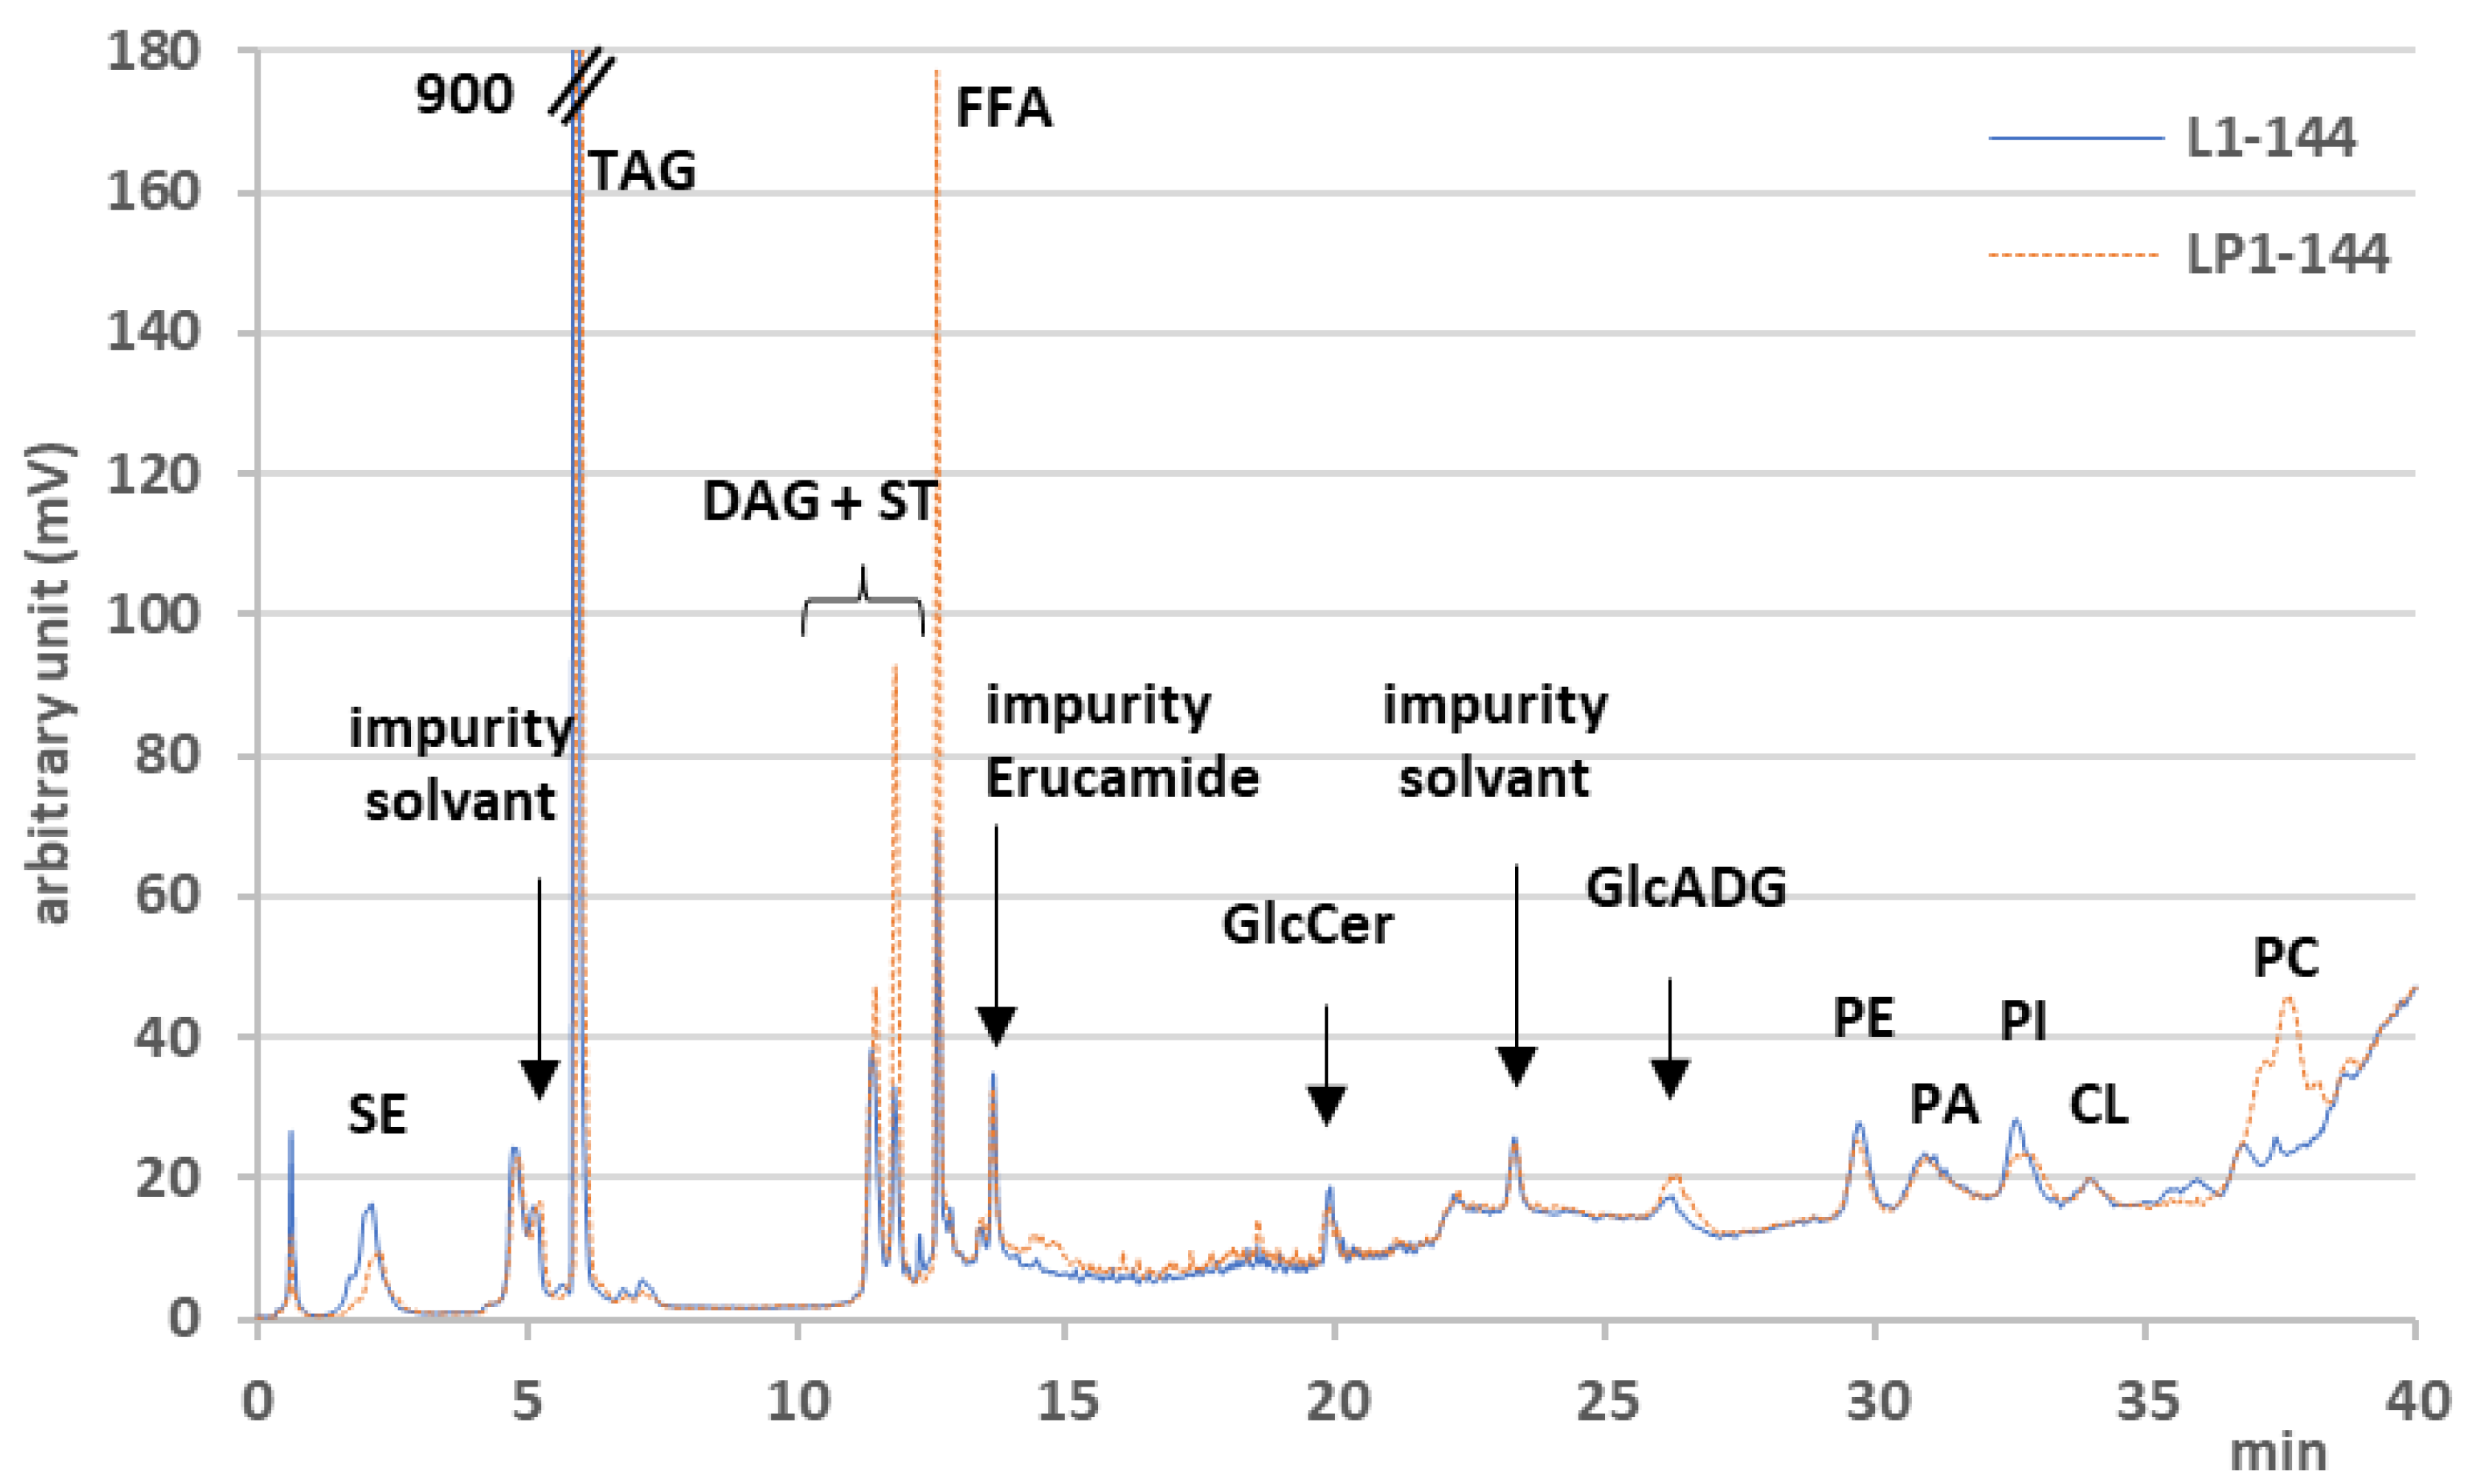
3.3. LC-Corona-CAD® and LC-MS Analyses
3.3.1. Storage Lipid Profiles during Odd-Chain Fatty Acid Production
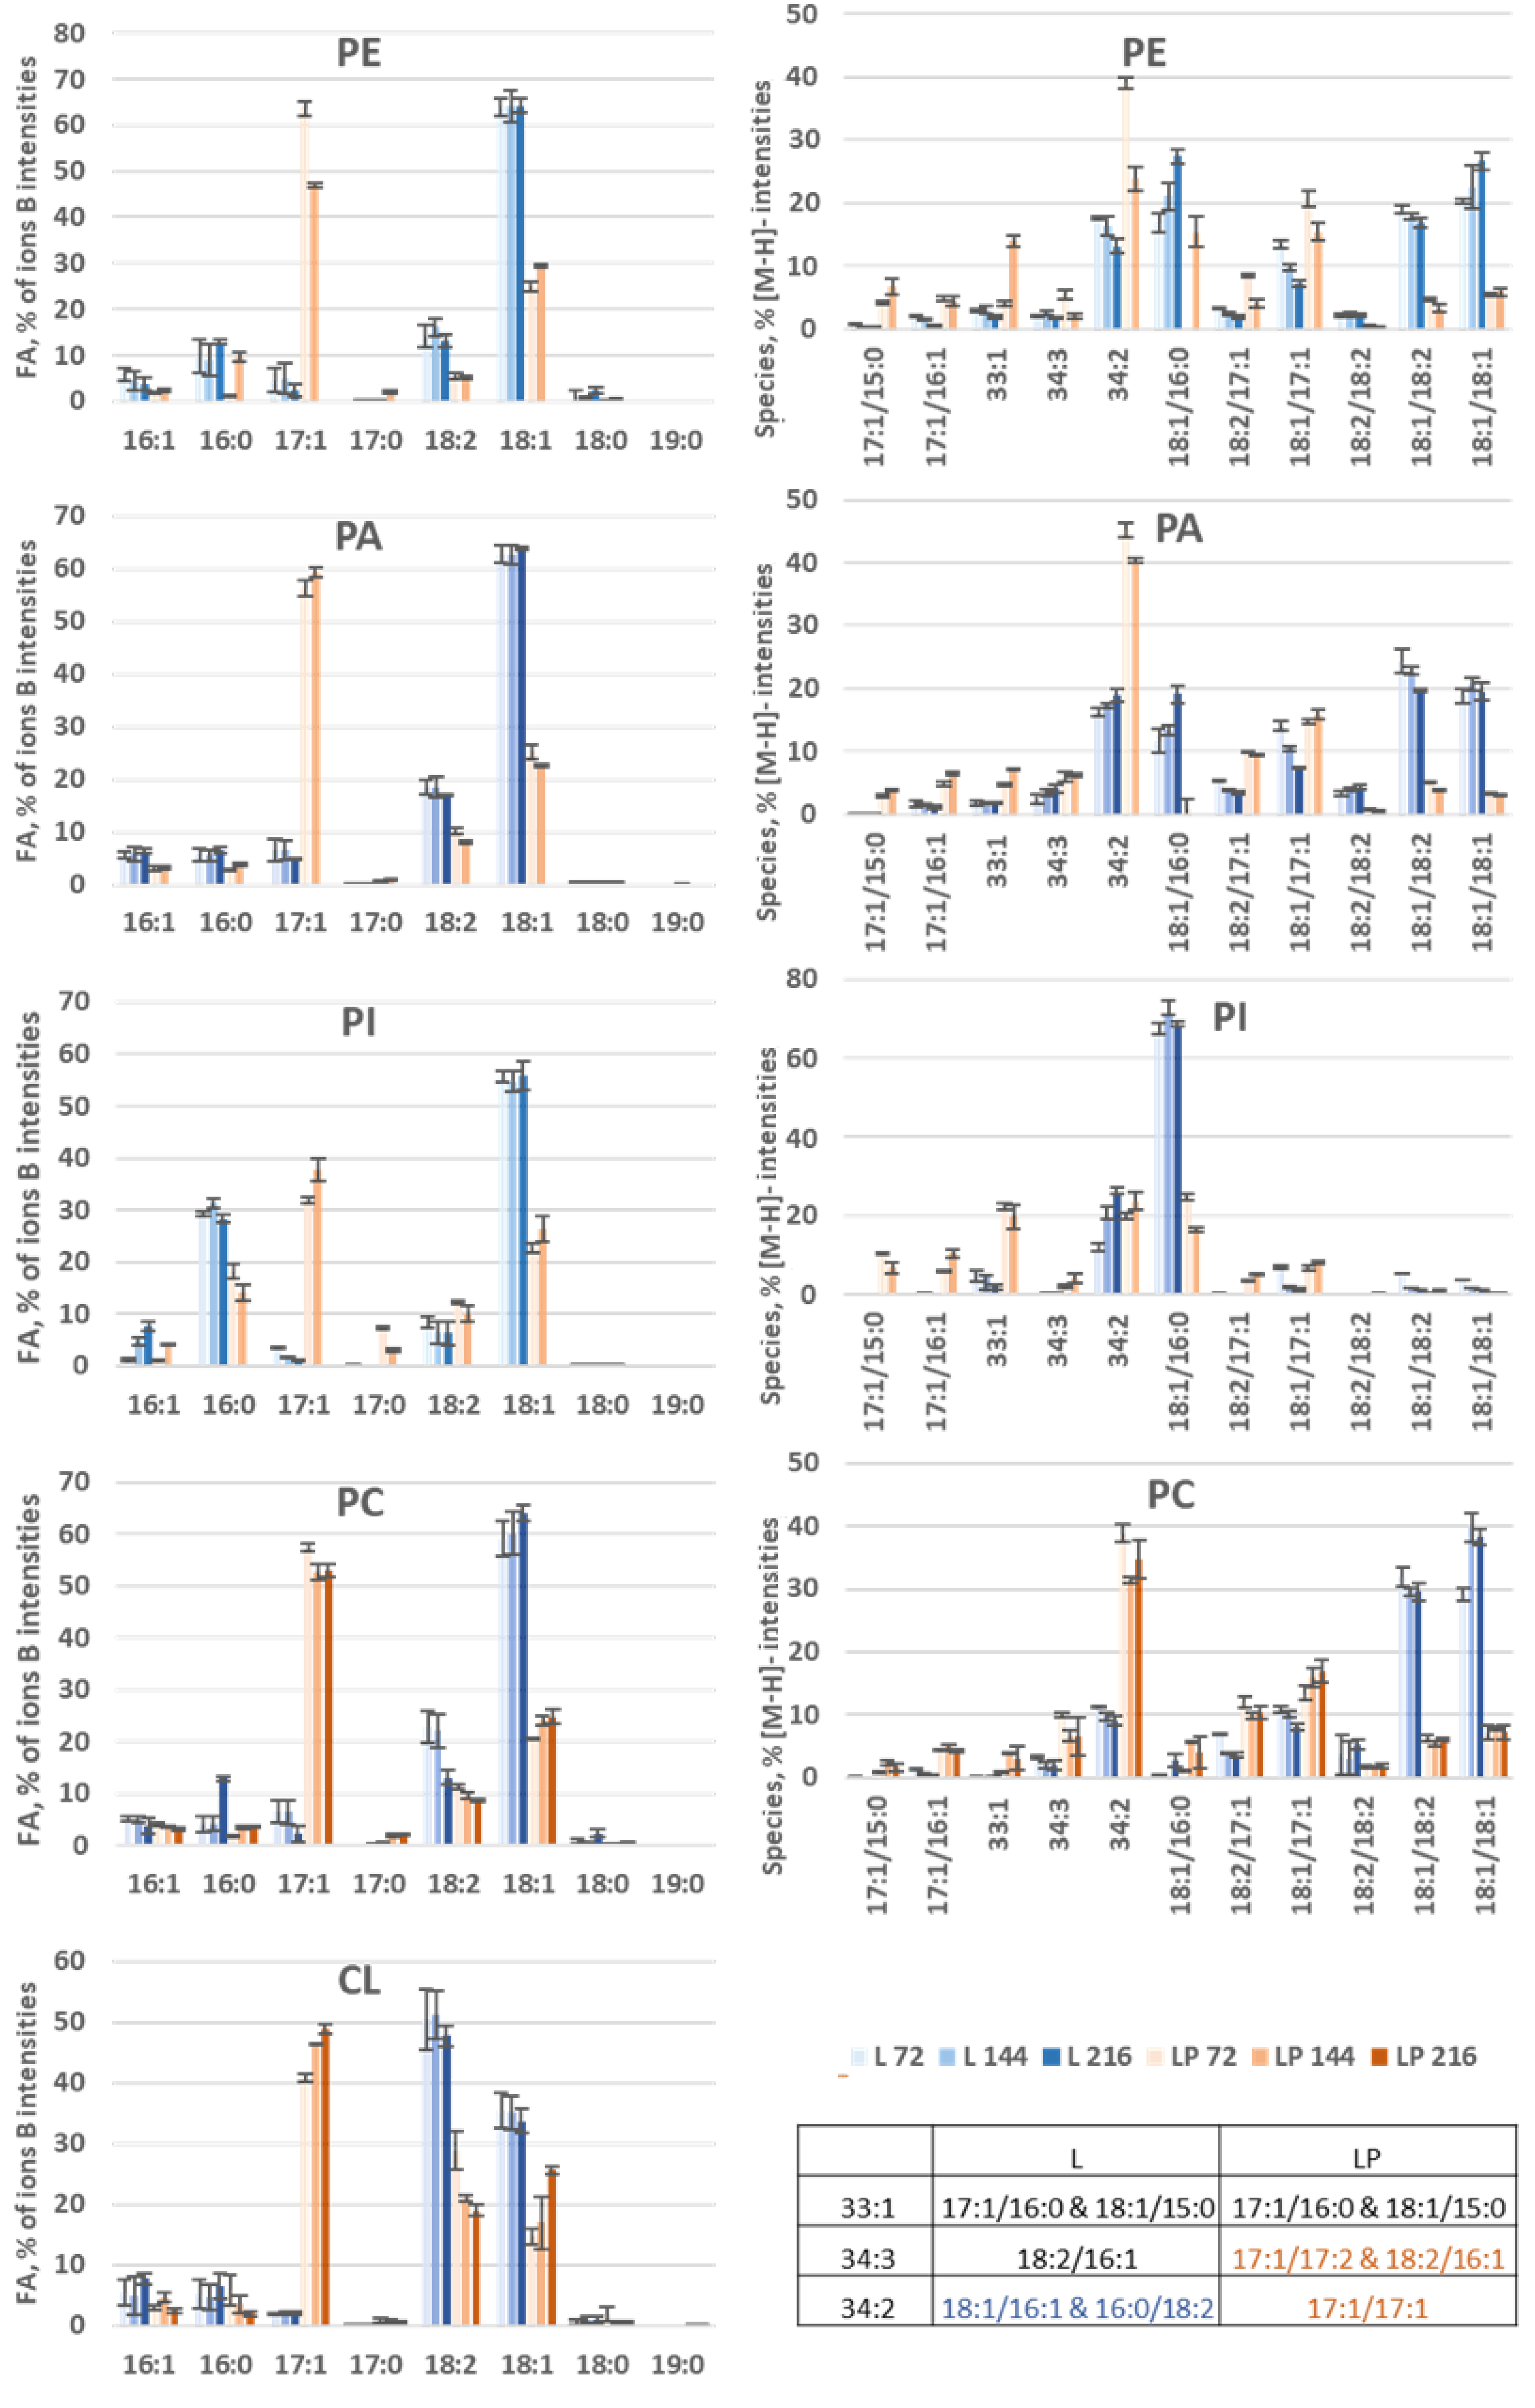
3.3.2. Membrane Lipid Profiles during Odd-Chain Fatty Acid Production
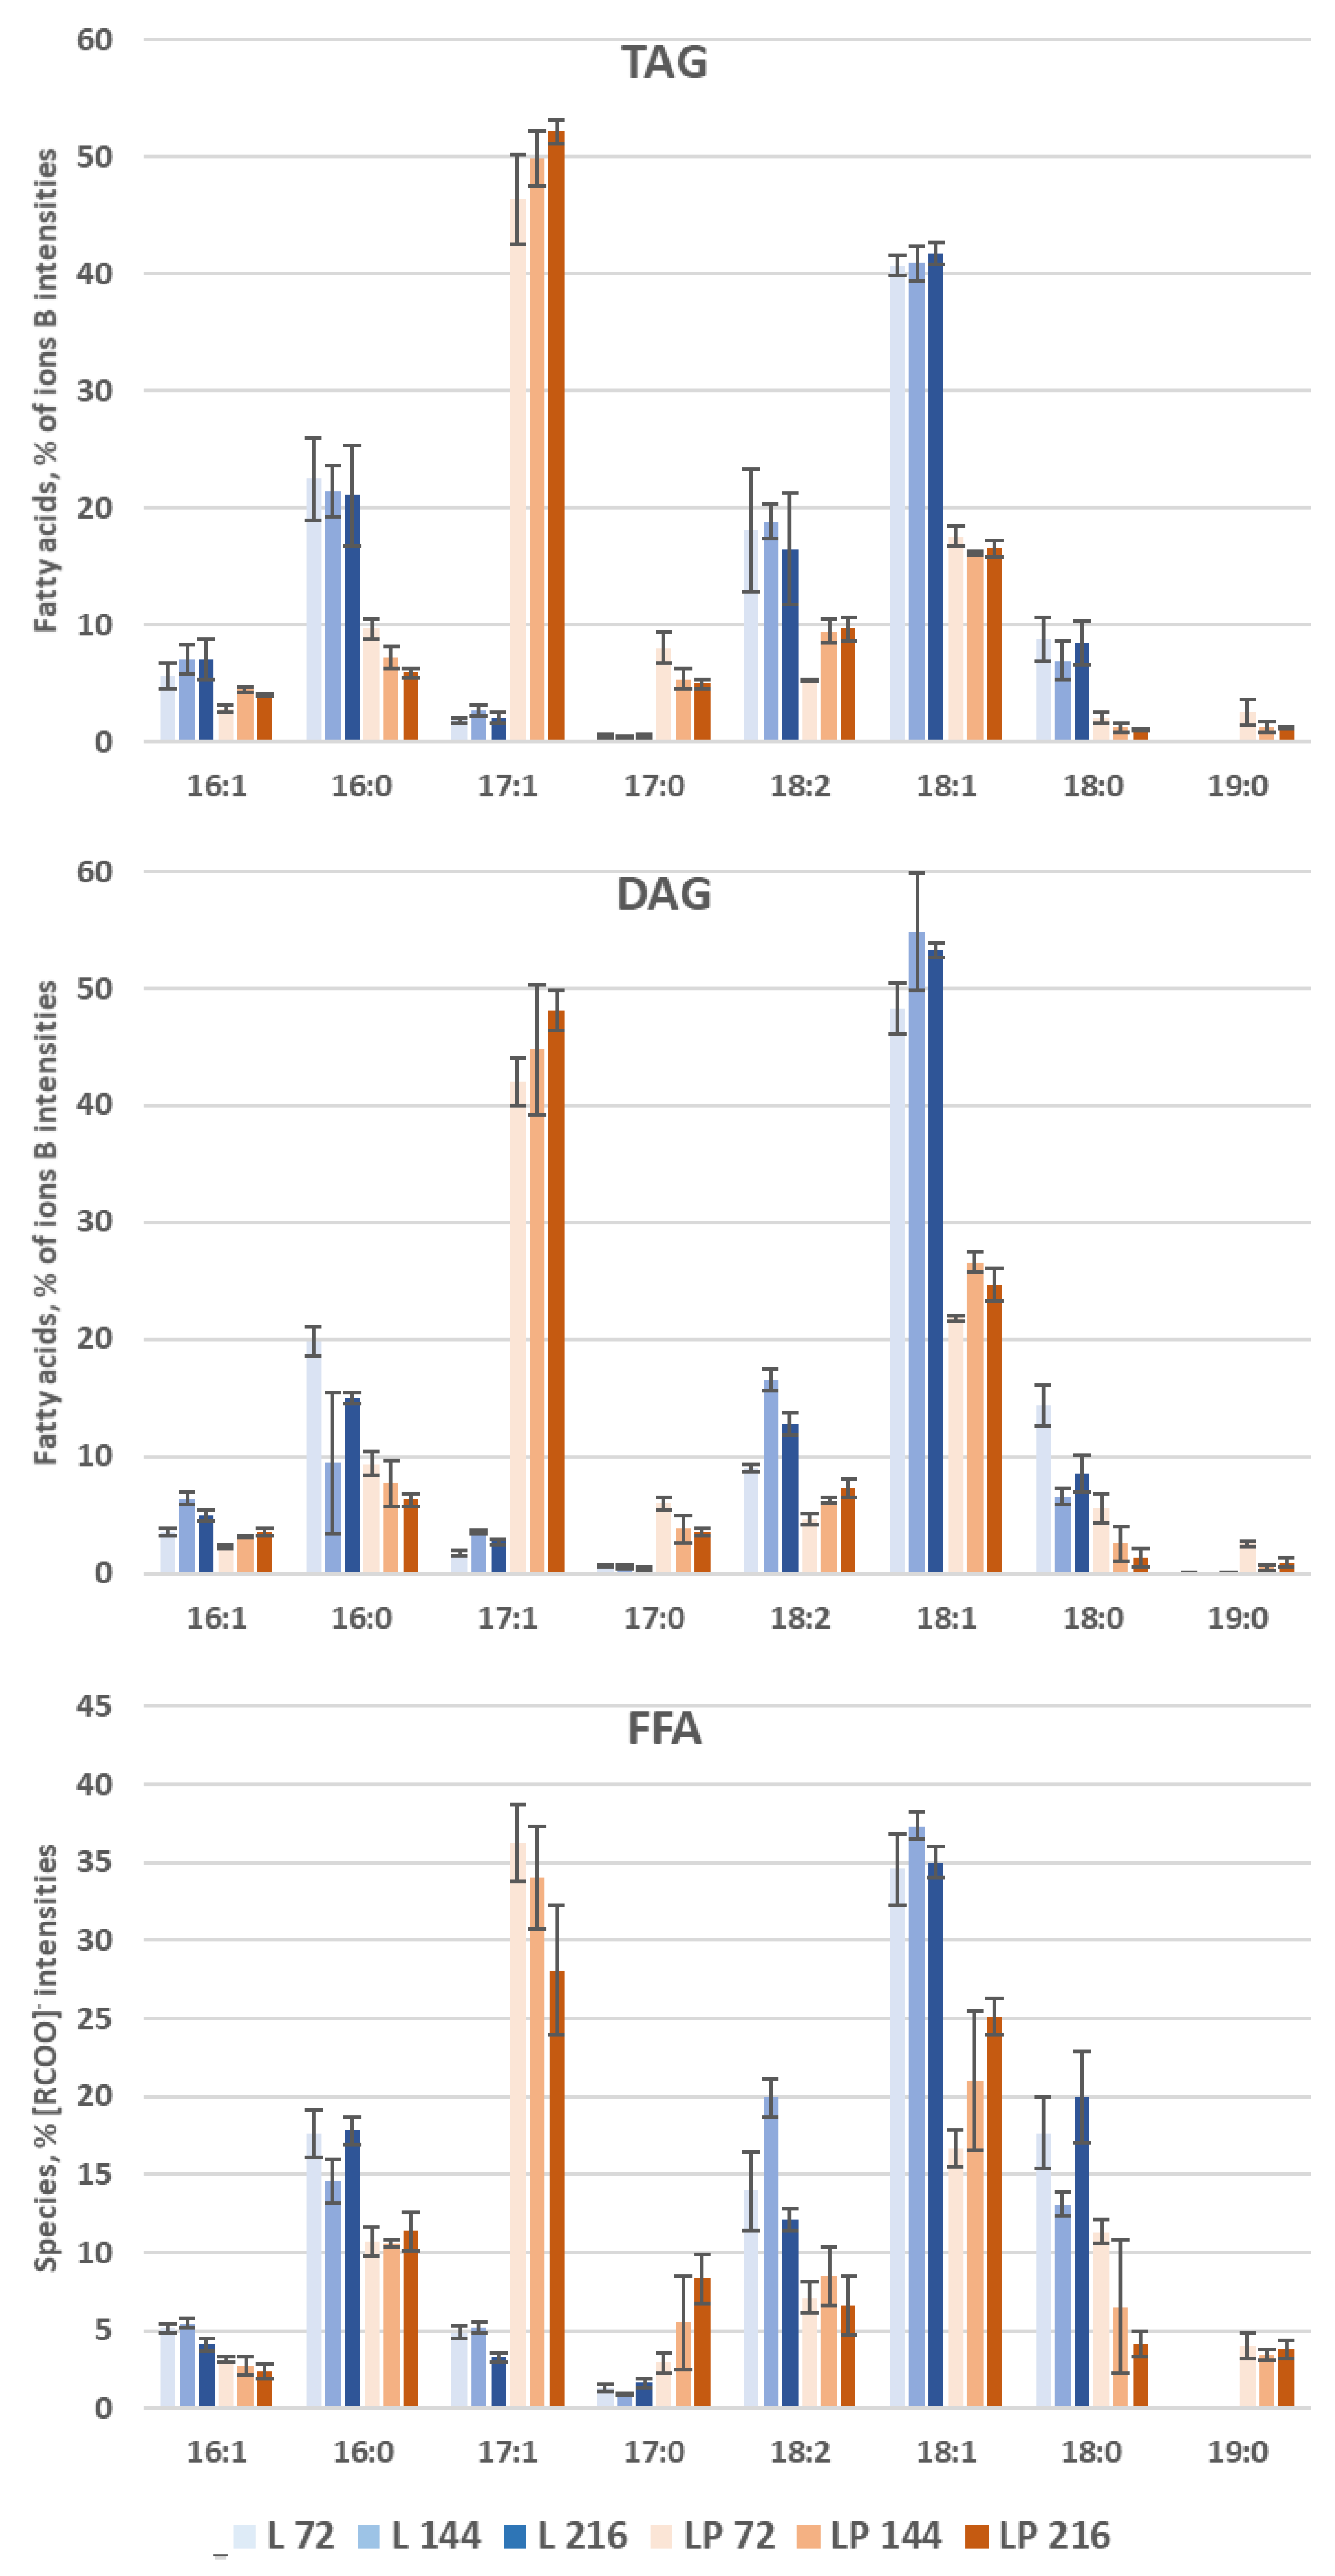
3.3.3. Species Distribution
- PLs
- CL
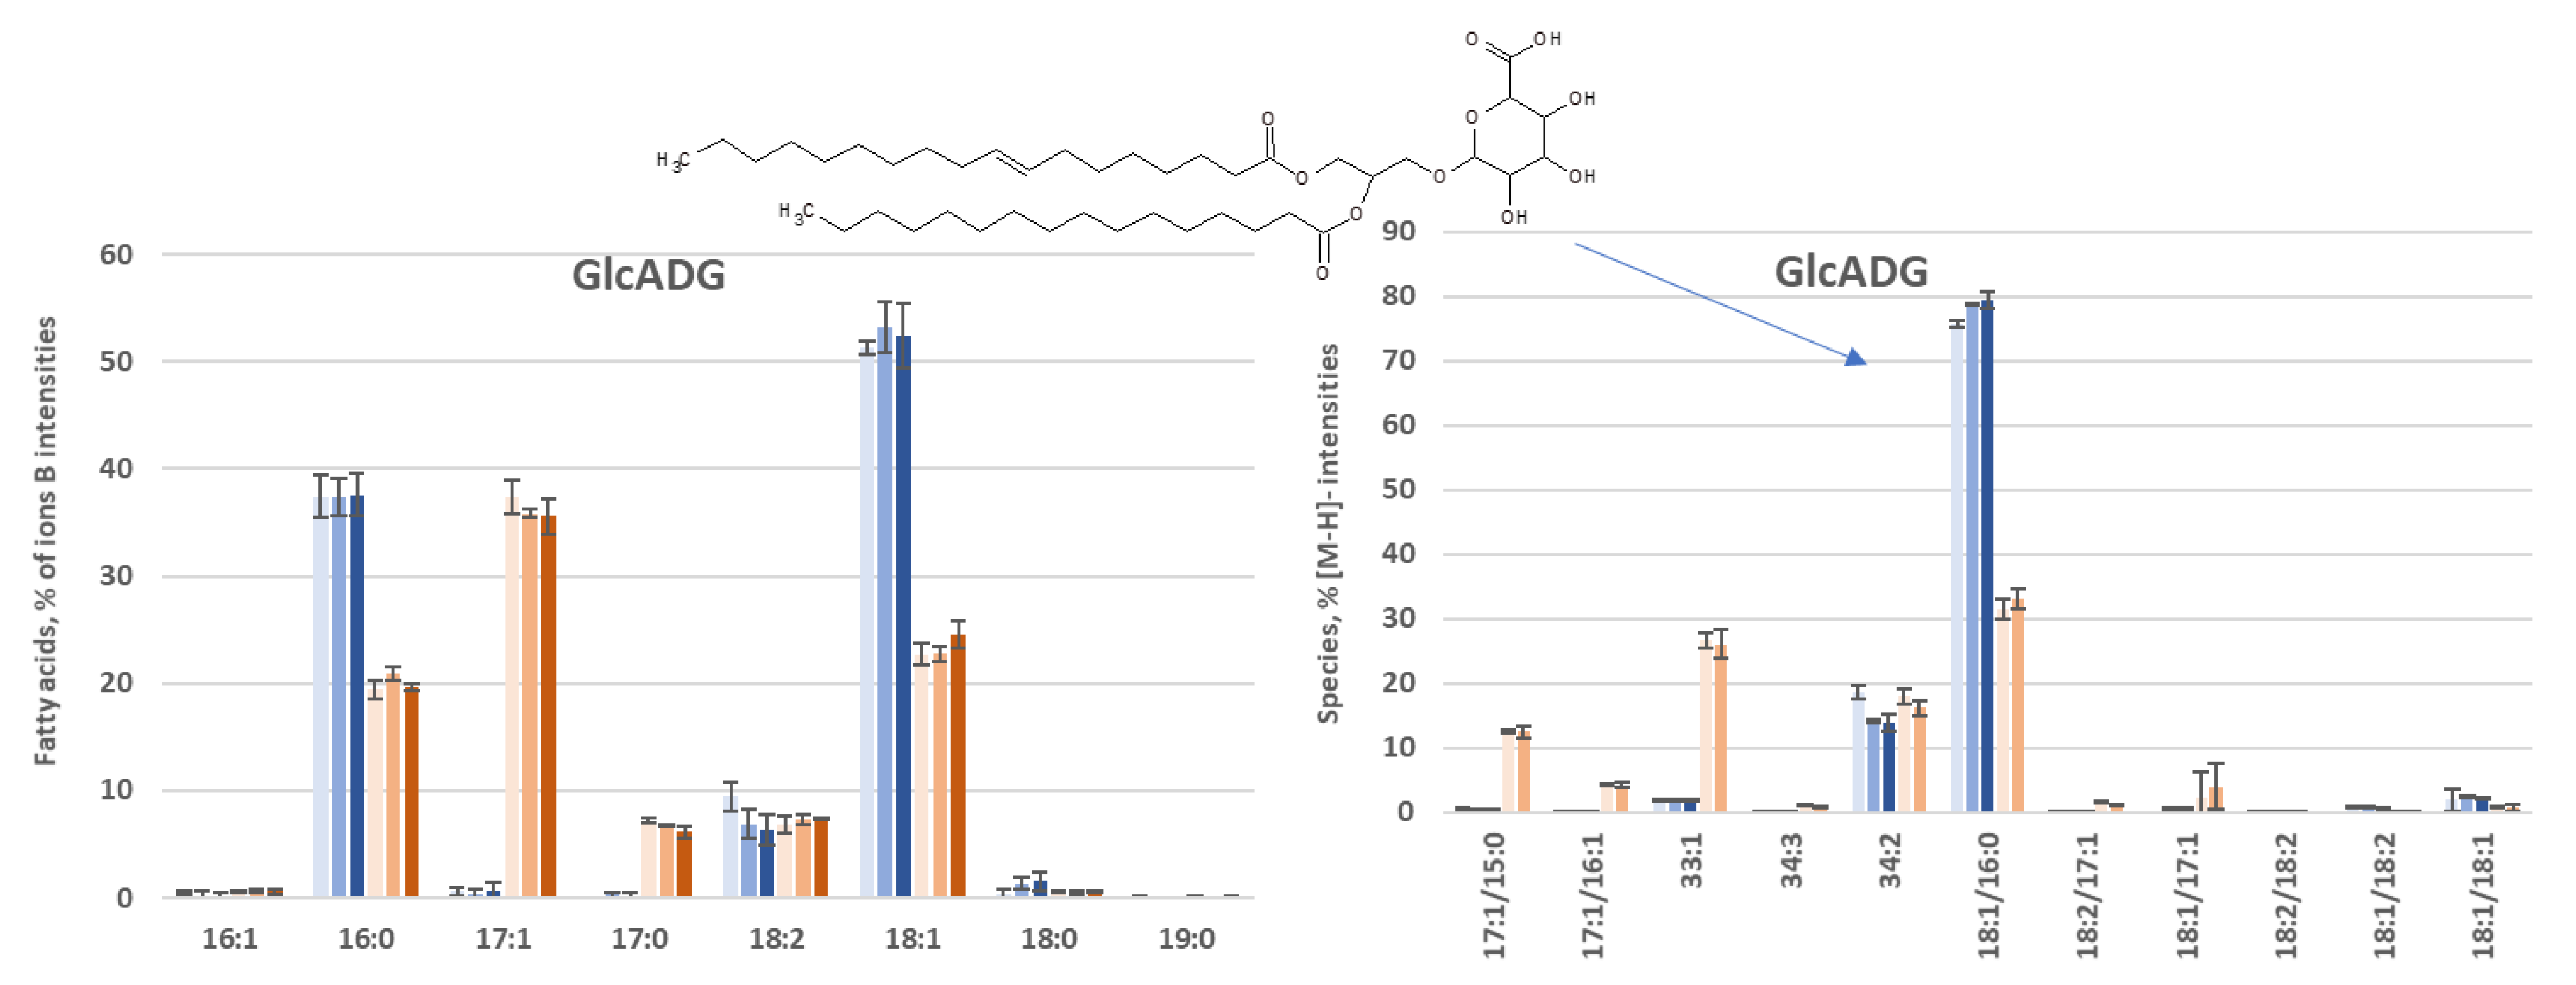
- GlcADG
- GlcCer
- ST
4. Discussion
Supplementary Materials
Author Contributions
Funding
Data Availability Statement
Acknowledgments
Conflicts of Interest
Abbreviations
| ACPT | acyl-ACP thioesterase |
| AcTAGs | acetylated TAGs |
| C/N ratio | carbon to nitrogen ratio |
| CFA | cyclopropanated fatty acid |
| CL | cardiolipin |
| CLA | conjugated linoleic acid |
| DacT | diacylglycerol acetyltransferase |
| DAG | diacylglycerol |
| DCW | dry cell weight |
| DHA | docosahexaenoic acid |
| DPA | docosapentaenoic acid |
| ECFA | even-chain fatty acid |
| EPA | eicosapentaenoic acid |
| ER | endoplasmic reticulum |
| FA | fatty acyl |
| FAEE | fatty acid ethyl ester |
| FAME | fatty acid methyl ester |
| FAS | fatty acid synthase |
| FFA | free fatty acid |
| GPL | glycerophospholipids |
| KAS | beta-ketoacyl-ACP synthase |
| KS | ketoacyl synthase |
| LA | linoleic acid |
| LB | lipid body |
| LCFA | long-chain fatty acid |
| LPA | lysophosphatidic acid |
| MAG | monoacylglycerol |
| MCFA | medium-chain fatty acid |
| MFE | multi-functional enzyme |
| MPT | malonyl/palmitoyl transacylase |
| OCFA | odd chain fatty acids |
| PA | phosphatidic acid |
| PC | phosphatidylcholne |
| PCT | propionyl-CoA transferase |
| PE | phosphatidylethanolamine |
| PG | phosphatidylglycerol |
| PI | phosphatidylinositol |
| PKT | polyketide synthase |
| PPP | pentose phosphate pathway |
| PS | phosphtidylserine |
| PUFA | polyunsaturated fatty acid |
| RA | ricinoleic acid |
| SCFA SE ST | short-chain fatty acid sterol ester sterol |
| TAG | triacylglycerol |
| TALEN | transcription activator-like effector nuclease |
| VLCFA | very long-chain fatty acid |
| WT | wild-type |
References
- Park, Y.-K.; Bordes, F.; Letisse, F.; Nicaud, J.-M. Engineering precursor pools for increasing production of odd-chain fatty acids in Yarrowia lipolytica. Metab. Eng. Commun. 2021, 12, e00158. [Google Scholar] [CrossRef] [PubMed]
- Czerwiec, Q.; Idrissitaghki, A.; Imatoukene, N.; Nonus, M.; Thomasset, B.; Nicaud, J.-M.; Rossignol, T. Optimization of cyclopropane fatty acids production in Yarrowia lipolytica. Yeast 2019, 36, 143–151. [Google Scholar] [CrossRef] [PubMed]
- Ledesma-Amaro, R.; Nicaud, J.-M. Yarrowia lipolytica as a biotechnological chassis to produce usual and unusual fatty acids. Prog. Lipid Res. 2016, 61, 40–50. [Google Scholar] [CrossRef] [PubMed]
- Park, Y.-K.; Nicaud, J.-M. Metabolic Engineering for Unusual Lipid Production in Yarrowia lipolytica. Microorganisms 2020, 8, 1937. [Google Scholar] [CrossRef] [PubMed]
- Park, Y.-K.; Dulermo, T.; Ledesma-Amaro, R.; Nicaud, J.-M. Optimization of odd chain fatty acid production by Yarrowia lipolytica. Biotechnol. Biofuels 2018, 11, 158. [Google Scholar] [CrossRef] [PubMed]
- Diedrich, M.; Henschel, K.-P. The natural occurrence of unusual fatty acids. Part 1. Odd numbered fatty acids. Food /Nahrung. 1990, 34, 935–943. [Google Scholar] [CrossRef]
- Forouhi, N.G.; Koulman, A.; Sharp, S.J.; Imamura, F.; Kröger, J.; Schulze, M.B.; Crowe, F.L.; Huerta, J.M.; Guevara, M.; Beulens, J.W.; et al. Differences in the prospective association between individual plasma phospholipid saturated fatty acids and incident type 2 diabetes: The EPIC-InterAct case-cohort study. Lancet Diabetes Endocrinol. 2014, 2, 810–818. [Google Scholar] [CrossRef]
- Pfeuffer, M.; Jaudszus, A. Pentadecanoic and Heptadecanoic Acids: Multifaceted Odd-Chain Fatty Acids. Adv. Nutr. Int. Rev. J. 2016, 7, 730–734. [Google Scholar] [CrossRef]
- Khaw, K.-T.; Friesen, M.D.; Riboli, E.; Luben, R.; Wareham, N. Plasma Phospholipid Fatty Acid Concentration and Incident Coronary Heart Disease in Men and Women: The EPIC-Norfolk Prospective Study. PLoS Med. 2012, 9, e1001255. [Google Scholar] [CrossRef]
- Jenkins, B.; West, J.A.; Koulman, A. A Review of Odd-Chain Fatty Acid Metabolism and the Role of Pentadecanoic Acid (C15:0) and Heptadecanoic Acid (C17:0) in Health and Disease. Molecules 2015, 20, 2425–2444. [Google Scholar] [CrossRef]
- Degwert, J.; Jacob, J.; Steckel, F. Use of cis-9-heptadecenoic Acid for Treating Psoriasis and Allergies. U.S. Patent 5,708,028A, 24 March 1994. [Google Scholar]
- Avis, T.; Boulanger, R.R.; Bélanger, R.R. Synthesis and Biological Characterization of (Z)-9-Heptadecenoic and (Z)-6-Methyl-9-Heptadecenoic Acids: Fatty Acids with Antibiotic Activity Produced by Pseudozyma flocculosa. J. Chem. Ecol. 2000, 26, 987–1000. [Google Scholar] [CrossRef]
- Clausen, C.A.; Coleman, R.D.; Yang, V.W. Fatty Acid–Based Formulations for Wood Protection against Mold and Sapstain. For. Prod. J. 2010, 60, 301–304. [Google Scholar] [CrossRef]
- Köckritz, A.; Blumenstein, M.; Martin, A. Catalytic cleavage of methyl oleate or oleic acid. Eur. J. Lipid Sci. Technol. 2010, 112, 58–63. [Google Scholar] [CrossRef]
- Fitton, A.; Goa, K.L. Azelaic Acid: A Review of its Pharmacological Properties and Therapeutic Efficacy in Acne and Hyperpigmentary Skin Disorders. Drugs 1991, 41, 780–798. [Google Scholar] [CrossRef]
- Řezanka, T.; Sigler, K. Odd-numbered very-long-chain fatty acids from the microbial, animal and plant kingdoms. Prog. Lipid Res. 2009, 48, 206–238. [Google Scholar] [CrossRef]
- Zhang, L.-S.; Liang, S.; Zong, M.-H.; Yang, J.-G.; Lou, W.-Y. Microbial synthesis of functional odd-chain fatty acids: A review. World J. Microbiol. Biotechnol. 2020, 36, 35. [Google Scholar] [CrossRef]
- Browse, J.; McCourt, P.J.; Somerville, C.R. Fatty acid composition of leaf lipids determined after combined digestion and fatty acid methyl ester formation from fresh tissue. Anal. Biochem. 1986, 152, 141–145. [Google Scholar] [CrossRef]
- Ejsing, C.S.; Sampaio, J.L.; Surendranath, V.; Duchoslav, E.; Ekroos, K.; Klemm, R.W.; Simons, K.; Shevchenko, A. Global analysis of the yeast lipidome by quantitative shotgun mass spectrometry. Proc. Natl. Acad. Sci. USA 2009, 106, 2136–2141. [Google Scholar] [CrossRef]
- Klose, C.; Surma, M.A.; Gerl, M.J.; Meyenhofer, F.; Shevchenko, A.; Simons, K. Flexibility of a Eukaryotic Lipidome—Insights from Yeast Lipidomics. PLoS ONE 2012, 7, e35063. [Google Scholar] [CrossRef]
- Hein, E.-M.; Hayen, H. Comparative Lipidomic Profiling of S. cerevisiae and Four Other Hemiascomycetous Yeasts. Metabolites 2012, 2, 254–267. [Google Scholar] [CrossRef]
- Sekova, V.Y.; Dergacheva, D.I.; Isakova, E.P.; Gessler, N.N.; Tereshina, V.M.; Deryabina, Y.I. Soluble Sugar and Lipid Readjustments in the Yarrowia lipolytica Yeast at Various Temperatures and pH. Metabolites 2019, 9, 307. [Google Scholar] [CrossRef] [PubMed]
- Navas-Iglesias, N.; Carrasco-Pancorbo, A.; Cuadros-Rodríguez, L. From lipids analysis towards lipidomics, a new challenge for the analytical chemistry of the 21st century. Part II: Analytical lipidomics. TrAC Trends Anal. Chem. 2009, 28, 393–403. [Google Scholar] [CrossRef]
- Lejeune, C.; Abreu, S.; Chaminade, P.; Dulermo, T.; David, M.; Werten, S.; Virolle, M.-J. Impact of Phosphate Availability on Membrane Lipid Content of the Model Strains, Streptomyces lividans and Streptomyces coelicolor. Front. Microbiol. 2021, 12, 623919. [Google Scholar] [CrossRef] [PubMed]
- Zhang, J.; Liang, Q.; Xu, Z.; Cui, M.; Zhang, Q.; Abreu, S.; David, M.; Lejeune, C.; Chaminade, P.; Virolle, M.-J.; et al. The Inhibition of Antibiotic Production in Streptomyces coelicolor Over-Expressing the TetR Regulator SCO3201 Is Correlated with Changes in the Lipidome of the Strain. Front. Microbiol. 2020, 11, 1399. [Google Scholar] [CrossRef] [PubMed]
- David, M.; Lejeune, C.; Abreu, S.; Thibessard, A.; Leblond, P.; Chaminade, P.; Virolle, M.-J. Negative Correlation between Lipid Content and Antibiotic Activity in Streptomyces: General Rule and Exceptions. Antibiotics 2020, 9, 280. [Google Scholar] [CrossRef]
- Abreu, S.; Heron, S.; Solgadi, A.; Joffre, F.; Tchapla, A.; Chaminade, P. Rapid assessment of triacylglycerol fatty acyls composition by LC-APPI+ -HRMS using monoacylglycerol like fragments intensities. Anal. Chim. Acta 2021, 1178, 338809. [Google Scholar] [CrossRef] [PubMed]
- Abreu, S.; Héron, S.; Solgadi, A.; Prost, B.; Dalloux-Chioccioli, J.; Kermarrec, A.; Meynier, A.; Bertrand-Michel, J.; Tchapla, A.; Chaminade, P. Rapid assessment of fatty acyls chains of phospholipids and plasmalogens by atmospheric pressure chemical ionization in positive mode and high-resolution mass spectrometry using in-source generated monoacylglycerol like fragments intensities. J. Chromatogr. A 2022, 1673, 463093. [Google Scholar] [CrossRef] [PubMed]
- Folch, J.; Lees, M.; Stanley, G.H.S. A Simple Method for the Isolation and Purification of Total Lipides from Animal Tissues. J. Biol. Chem. 1957, 226, 497–509. [Google Scholar] [CrossRef]
- Abreu, S.; Solgadi, A.; Chaminade, P. Optimization of normal phase chromatographic conditions for lipid analysis and comparison of associated detection techniques. J. Chromatogr. A 2017, 1514, 54–71. [Google Scholar] [CrossRef] [PubMed]
- Dixon, R.W.; Peterson, D.S. Development and testing of a detection method for liquid chromatography based on aerosol charging. Anal. Chem. 2002, 74, 2930–2937. [Google Scholar] [CrossRef]
- Beopoulos, A.; Cescut, J.; Haddouche, R.; Uribelarrea, J.-L.; Molina-Jouve, C.; Nicaud, J.-M. Yarrowia lipolytica as a model for bio-oil production. Prog. Lipid Res. 2009, 48, 375–387. [Google Scholar] [CrossRef] [PubMed]
- Koch, B.; Schmidt, C.; Daum, G. Storage lipids of yeasts: A survey of nonpolar lipid metabolism in Saccharomyces cerevisiae, Pichia pastoris, and Yarrowia lipolytica. FEMS Microbiol. Rev. 2014, 38, 892–915. [Google Scholar] [CrossRef] [PubMed]
- Leiker, T.J.; Barkley, R.M.; Murphy, R.C. Analysis of diacylglycerol molecular species in cellular lipid extracts by normal-phase LC-electrospray mass spectrometry. Int. J. Mass Spectrom. 2011, 305, 103–108. [Google Scholar] [CrossRef]
- Jug, U.; Naumoska, K.; Metličar, V.; Schink, A.; Makuc, D.; Vovk, I.; Plavec, J.; Lucas, K. Interference of oleamide with analytical and bioassay results. Sci. Rep. 2020, 10, 2163. [Google Scholar] [CrossRef]
- Rozenberg, R.; Ruibal-Mendieta, N.L.; Petitjean, G.; Cani, P.; Delacroix, D.L.; Delzenne, N.M.; Meurens, M.; Quetin-Leclercq, J.; Habib-Jiwan, J.-L. Phytosterol analysis and characterization in spelt (Triticum aestivum ssp. spelta L.) and wheat (T. aestivum L.) lipids by LC/APCI-MS. J. Cereal Sci. 2003, 38, 189–197. [Google Scholar] [CrossRef]
- Langseter, A.M.; Dzurendova, S.; Shapaval, V.; Kohler, A.; Ekeberg, D.; Zimmermann, B. Evaluation and optimisation of direct transesterification methods for the assessment of lipid accumulation in oleaginous filamentous fungi. Microb. Cell Factories 2021, 20, 59. [Google Scholar] [CrossRef] [PubMed]
- Walker, C.; Ryu, S.; Trinh, C.T. Exceptional Solvent Tolerance in Yarrowia lipolytica Is Enhanced by Sterols. Metab. Eng. 2019, 54, 83–95. [Google Scholar] [CrossRef]
- Ta, T.M.N. Mécanismes Physiologiques et Biologiques Induits Chez Yarrowia Lipolytyica en Réponse à des Modifications de L’environnement Physico-Chimique des Cellules. Ph.D. Thesis, Alimentation et Nutrition, Université de Bourgogne, Bourgogne, France, 2010. Available online: https://tel.archives-ouvertes.fr/tel-00575589 (accessed on 20 July 2022).
- Han, X.; Yang, K.; Yang, J.; Cheng, H.; Gross, R.W. Shotgun lipidomics of cardiolipin molecular species in lipid extracts of biological samples. J. Lipid Res. 2006, 47, 864–879. [Google Scholar] [CrossRef]
- Khoury, S.; El Banna, N.; Tfaili, S.; Chaminade, P. A study of inter-species ion suppression in electrospray ionization-mass spectrometry of some phospholipid classes. Anal. Bioanal. Chem. 2016, 408, 1453–1465. [Google Scholar] [CrossRef]
- Bal, J.; Lee, H.-J.; Cheon, S.A.; Lee, K.J.; Oh, D.-B.; Kim, J.-Y. Ylpex5 mutation partially suppresses the defective hyphal growth of a Yarrowia lipolytica ceramide synthase mutant, Yllac1, by recovering lipid raft polarization and vacuole morphogenesis. Fungal Genet. Biol. 2013, 50, 1–10. [Google Scholar] [CrossRef]
- Madzak, C. Engineering Yarrowia lipolytica for Use in Biotechnological Applications: A Review of Major Achievements and Recent Innovations. Mol. Biotechnol. 2018, 60, 621–635. [Google Scholar] [CrossRef] [PubMed]
- Mamaev, D.; Zvyagilskaya, R. Yarrowia lipolytica: A multitalented yeast species of ecological significance. FEMS Yeast Res. 2021, 21, foab008. [Google Scholar] [CrossRef] [PubMed]
- Fickers, P.; Benetti, P.-H.; Waché, Y.; Marty, A.; Mauersberger, S.; Smit, M.S.; Nicaud, J.-M. Hydrophobic substrate utilisation by the yeast, and its potential applications. FEMS Yeast Res. 2005, 5, 527–543. [Google Scholar] [CrossRef] [PubMed]
- Thevenieau, F.; Le Dall, M.-T.; Nthangeni, B.; Mauersberger, S.; Marchal, R.; Nicaud, J.-M. Characterization of Yarrowia lipolytica mutants affected in hydrophobic substrate utilization. Fungal Genet. Biol. 2007, 44, 531–542. [Google Scholar] [CrossRef] [PubMed]
- Thevenieau, F.; Beopoulos, A.; Desfougeres, T.; Sabirova, J.; Albertin, K.; Zinjarde, S.; Nicaud, J.M. Uptake and assimilation of hydrophobic substrates by the oleaginous yeast Yarrowia lipolytica. In Handbook of Hydrocarbon and Lipid Microbiology; Timmis, K.N., Ed.; Springer: Berlin/Heidelberg, Germany, 2009. [Google Scholar]
- Blazeck, J.; Hill, A.; Liu, L.; Knight, R.; Miller, J.; Pan, A.; Otoupal, P.; Alper, H.S. Harnessing Yarrowia lipolytica lipogenesis to create a platform for lipid and biofuel production. Nat. Commun. 2014, 5, 3131. [Google Scholar] [CrossRef]
- Lazar, Z.; Liu, N.; Stephanopoulos, G. Holistic Approaches in Lipid Production by Yarrowia lipolytica. Trends Biotechnol. 2018, 36, 1157–1170. [Google Scholar] [CrossRef]
- Liu, H.; Song, Y.; Fan, X.; Wang, C.; Lu, X.; Tian, Y. Yarrowia lipolytica as an Oleaginous Platform for the Production of Value-Added Fatty Acid-Based Bioproducts. Front. Microbiol. 2021, 11, 608662. [Google Scholar] [CrossRef]
- Kamineni, A.; Consiglio, A.L.; MacEwen, K.; Chen, S.; Chifamba, G.; Shaw, A.J.; Tsakraklides, V. Increasing lipid yield in Yarrowia lipolytica through phosphoketolase and phosphotransacetylase expression in a phosphofructokinase deletion strain. Biotechnol. Biofuels 2021, 14, 113. [Google Scholar] [CrossRef]
- El Kantar, S.; Khelfa, A.; Vorobiev, E.; Koubaa, M. Strategies for increasing lipid accumulation and recovery from Y. lipolytica: A review. OCL 2021, 28, 51. [Google Scholar] [CrossRef]
- Tsakraklides, V.; Kamineni, A.; Consiglio, A.L.; MacEwen, K.; Friedlander, J.; Blitzblau, H.G.; Hamilton, M.A.; Crabtree, D.V.; Su, A.; Afshar, J.; et al. High-oleate yeast oil without polyunsaturated fatty acids. Biotechnol. Biofuels 2018, 11, 131. [Google Scholar] [CrossRef]
- Imatoukene, N.; Verbeke, J.; Beopoulos, A.; Taghki, A.I.; Thomasset, B.; Sarde, C.-O.; Nonus, M.; Nicaud, J.-M. A metabolic engineering strategy for producing conjugated linoleic acids using the oleaginous yeast Yarrowia lipolytica. Appl. Microbiol. Biotechnol. 2017, 101, 4605–4616. [Google Scholar] [CrossRef] [PubMed]
- Imatoukene, N.; Back, A.; Nonus, M.; Thomasset, B.; Rossignol, T.; Nicaud, J.-M. Fermentation process for producing CFAs using Yarrowia lipolytica. J. Ind. Microbiol. Biotechnol. 2020, 47, 403–412. [Google Scholar] [CrossRef] [PubMed]
- Blitzblau, H.G.; Consiglio, A.L.; Teixeira, P.; Crabtree, D.V.; Chen, S.; Konzock, O.; Chifamba, G.; Su, A.; Kamineni, A.; MacEwen, K.; et al. Production of 10-methyl branched fatty acids in yeast. Biotechnol. Biofuels 2021, 14, 12. [Google Scholar] [CrossRef] [PubMed]
- Pomraning, K.R.; Wei, S.; Karagiosis, S.A.; Kim, Y.-M.; Dohnalkova, A.C.; Arey, B.W.; Bredeweg, E.L.; Orr, G.; Metz, T.O.; Baker, S.E. Comprehensive Metabolomic, Lipidomic and Microscopic Profiling of Yarrowia lipolytica during Lipid Accumulation Identifies Targets for Increased Lipogenesis. PLoS ONE 2015, 10, e0123188. [Google Scholar] [CrossRef] [PubMed]
- Abe, M.; Hasegawa, Y.; Oku, M.; Sawada, Y.; Tanaka, E.; Sakai, Y.; Miyoshi, H. Mechanism for Remodeling of the Acyl Chain Composition of Cardiolipin Catalyzed by Saccharomyces cerevisiae Tafazzin. J. Biol. Chem. 2016, 291, 15491–15502. [Google Scholar] [CrossRef]
- Falabella, M.; Vernon, H.J.; Hanna, M.G.; Claypool, S.M.; Pitceathly, R.D. Cardiolipin, Mitochondria, and Neurological Disease. Trends Endocrinol. Metab. 2021, 32, 224–237. [Google Scholar] [CrossRef]
- Barth, P.G.; Wanders, R.J.A.; Vreken, P.; Janssen, E.A.M.; Lam, J.; Baas, F. X-linked cardioskeletal myopathy and neutropenia (Barth syndrome) (MIM 302060). J. Inherit. Metab. Dis. 1999, 22, 555–567. [Google Scholar] [CrossRef]
- Valianpour, F.; Mitsakos, V.; Schlemmer, D.; Towbin, J.A.; Taylor, J.M.; Ekert, P.G.; Thorburn, D.R.; Munnich, A.; Wanders, R.J.A.; Barth, P.G.; et al. Monolysocardiolipins accumulate in Barth syndrome but do not lead to enhanced apoptosis. J. Lipid Res. 2005, 46, 1182–1195. [Google Scholar] [CrossRef]


| Samples | DCW (g/L) | Lipid Content % (g/g DCW) | Lipids (g/L) | OCFA /Total Lipids (%) | C17:1 /Total lipids (%) | C17:1 /C18:1 (%) |
|---|---|---|---|---|---|---|
| Obese L | 8.48 | 21.46 | 1.82 | 5.07 | 2.30 | 5.47 |
| Obese LP | 6.07 | 23.92 | 1.45 | 50.86 | 35.29 | 197.98 |
Publisher’s Note: MDPI stays neutral with regard to jurisdictional claims in published maps and institutional affiliations. |
© 2022 by the authors. Licensee MDPI, Basel, Switzerland. This article is an open access article distributed under the terms and conditions of the Creative Commons Attribution (CC BY) license (https://creativecommons.org/licenses/by/4.0/).
Share and Cite
Abreu, S.; Park, Y.-K.; Pires de Souza, C.; Vidal, L.; Chaminade, P.; Nicaud, J.-M. Lipid Readjustment in Yarrowia lipolytica Odd-Chain Fatty Acids Producing Strains. Biomolecules 2022, 12, 1026. https://doi.org/10.3390/biom12081026
Abreu S, Park Y-K, Pires de Souza C, Vidal L, Chaminade P, Nicaud J-M. Lipid Readjustment in Yarrowia lipolytica Odd-Chain Fatty Acids Producing Strains. Biomolecules. 2022; 12(8):1026. https://doi.org/10.3390/biom12081026
Chicago/Turabian StyleAbreu, Sonia, Young-Kyoung Park, Camilla Pires de Souza, Lea Vidal, Pierre Chaminade, and Jean-Marc Nicaud. 2022. "Lipid Readjustment in Yarrowia lipolytica Odd-Chain Fatty Acids Producing Strains" Biomolecules 12, no. 8: 1026. https://doi.org/10.3390/biom12081026
APA StyleAbreu, S., Park, Y.-K., Pires de Souza, C., Vidal, L., Chaminade, P., & Nicaud, J.-M. (2022). Lipid Readjustment in Yarrowia lipolytica Odd-Chain Fatty Acids Producing Strains. Biomolecules, 12(8), 1026. https://doi.org/10.3390/biom12081026