
p-S6 as a Prognostic Biomarker in Canine Oral Squamous Cell Carcinoma

 ,
, 
 ,
,  and
and 
Abstract
1. Introduction
2. Materials and Methods
2.1. Patients and Tissue Specimens
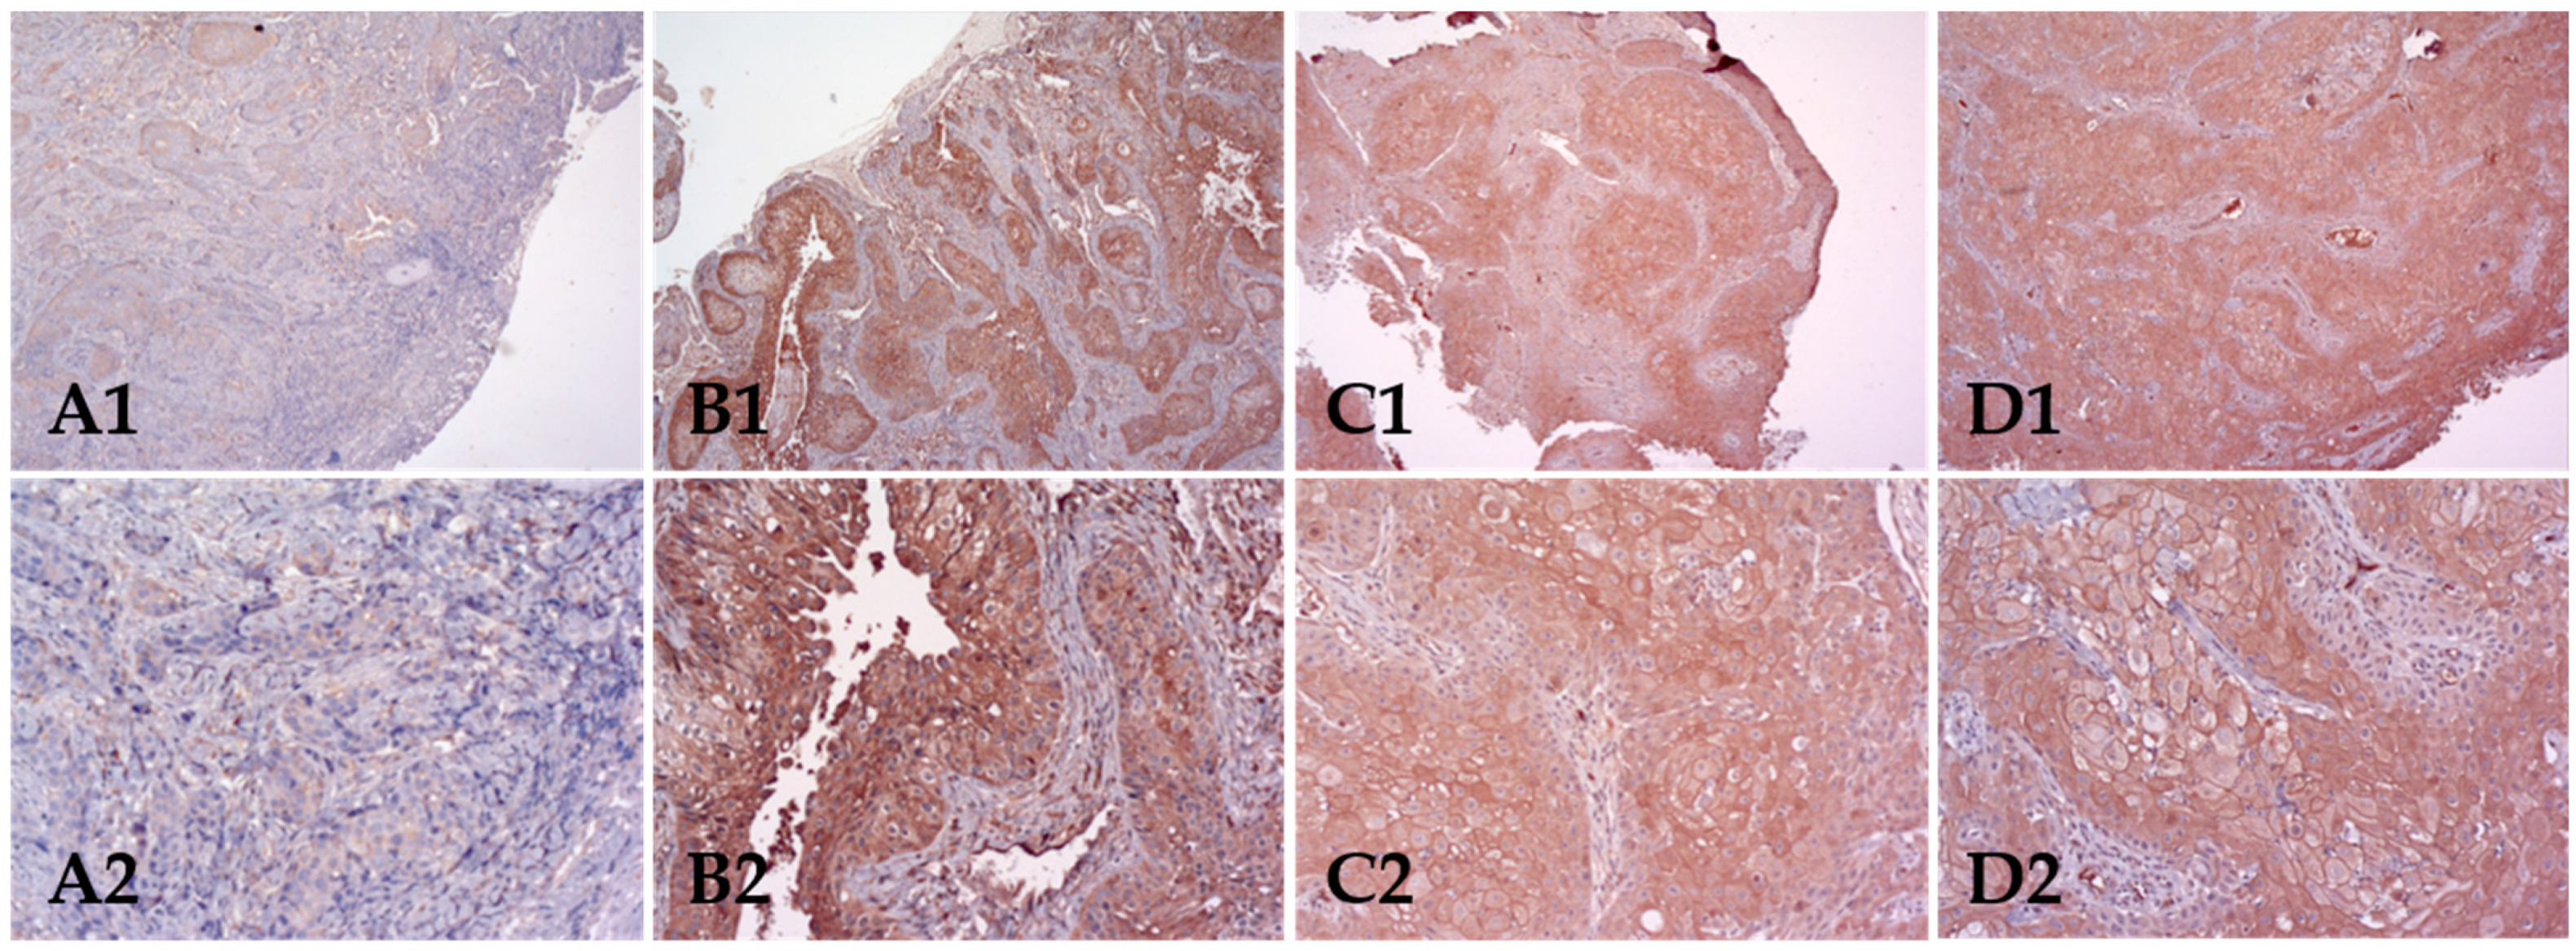
2.2. Immunohistochemistry Methodology and Evaluation
2.3. Statistical Analysis
3. Results
3.1. p-mTOR Expression Analysis
3.2. p-S6 Expression Analysis
3.3. Correlation between Biomarkers
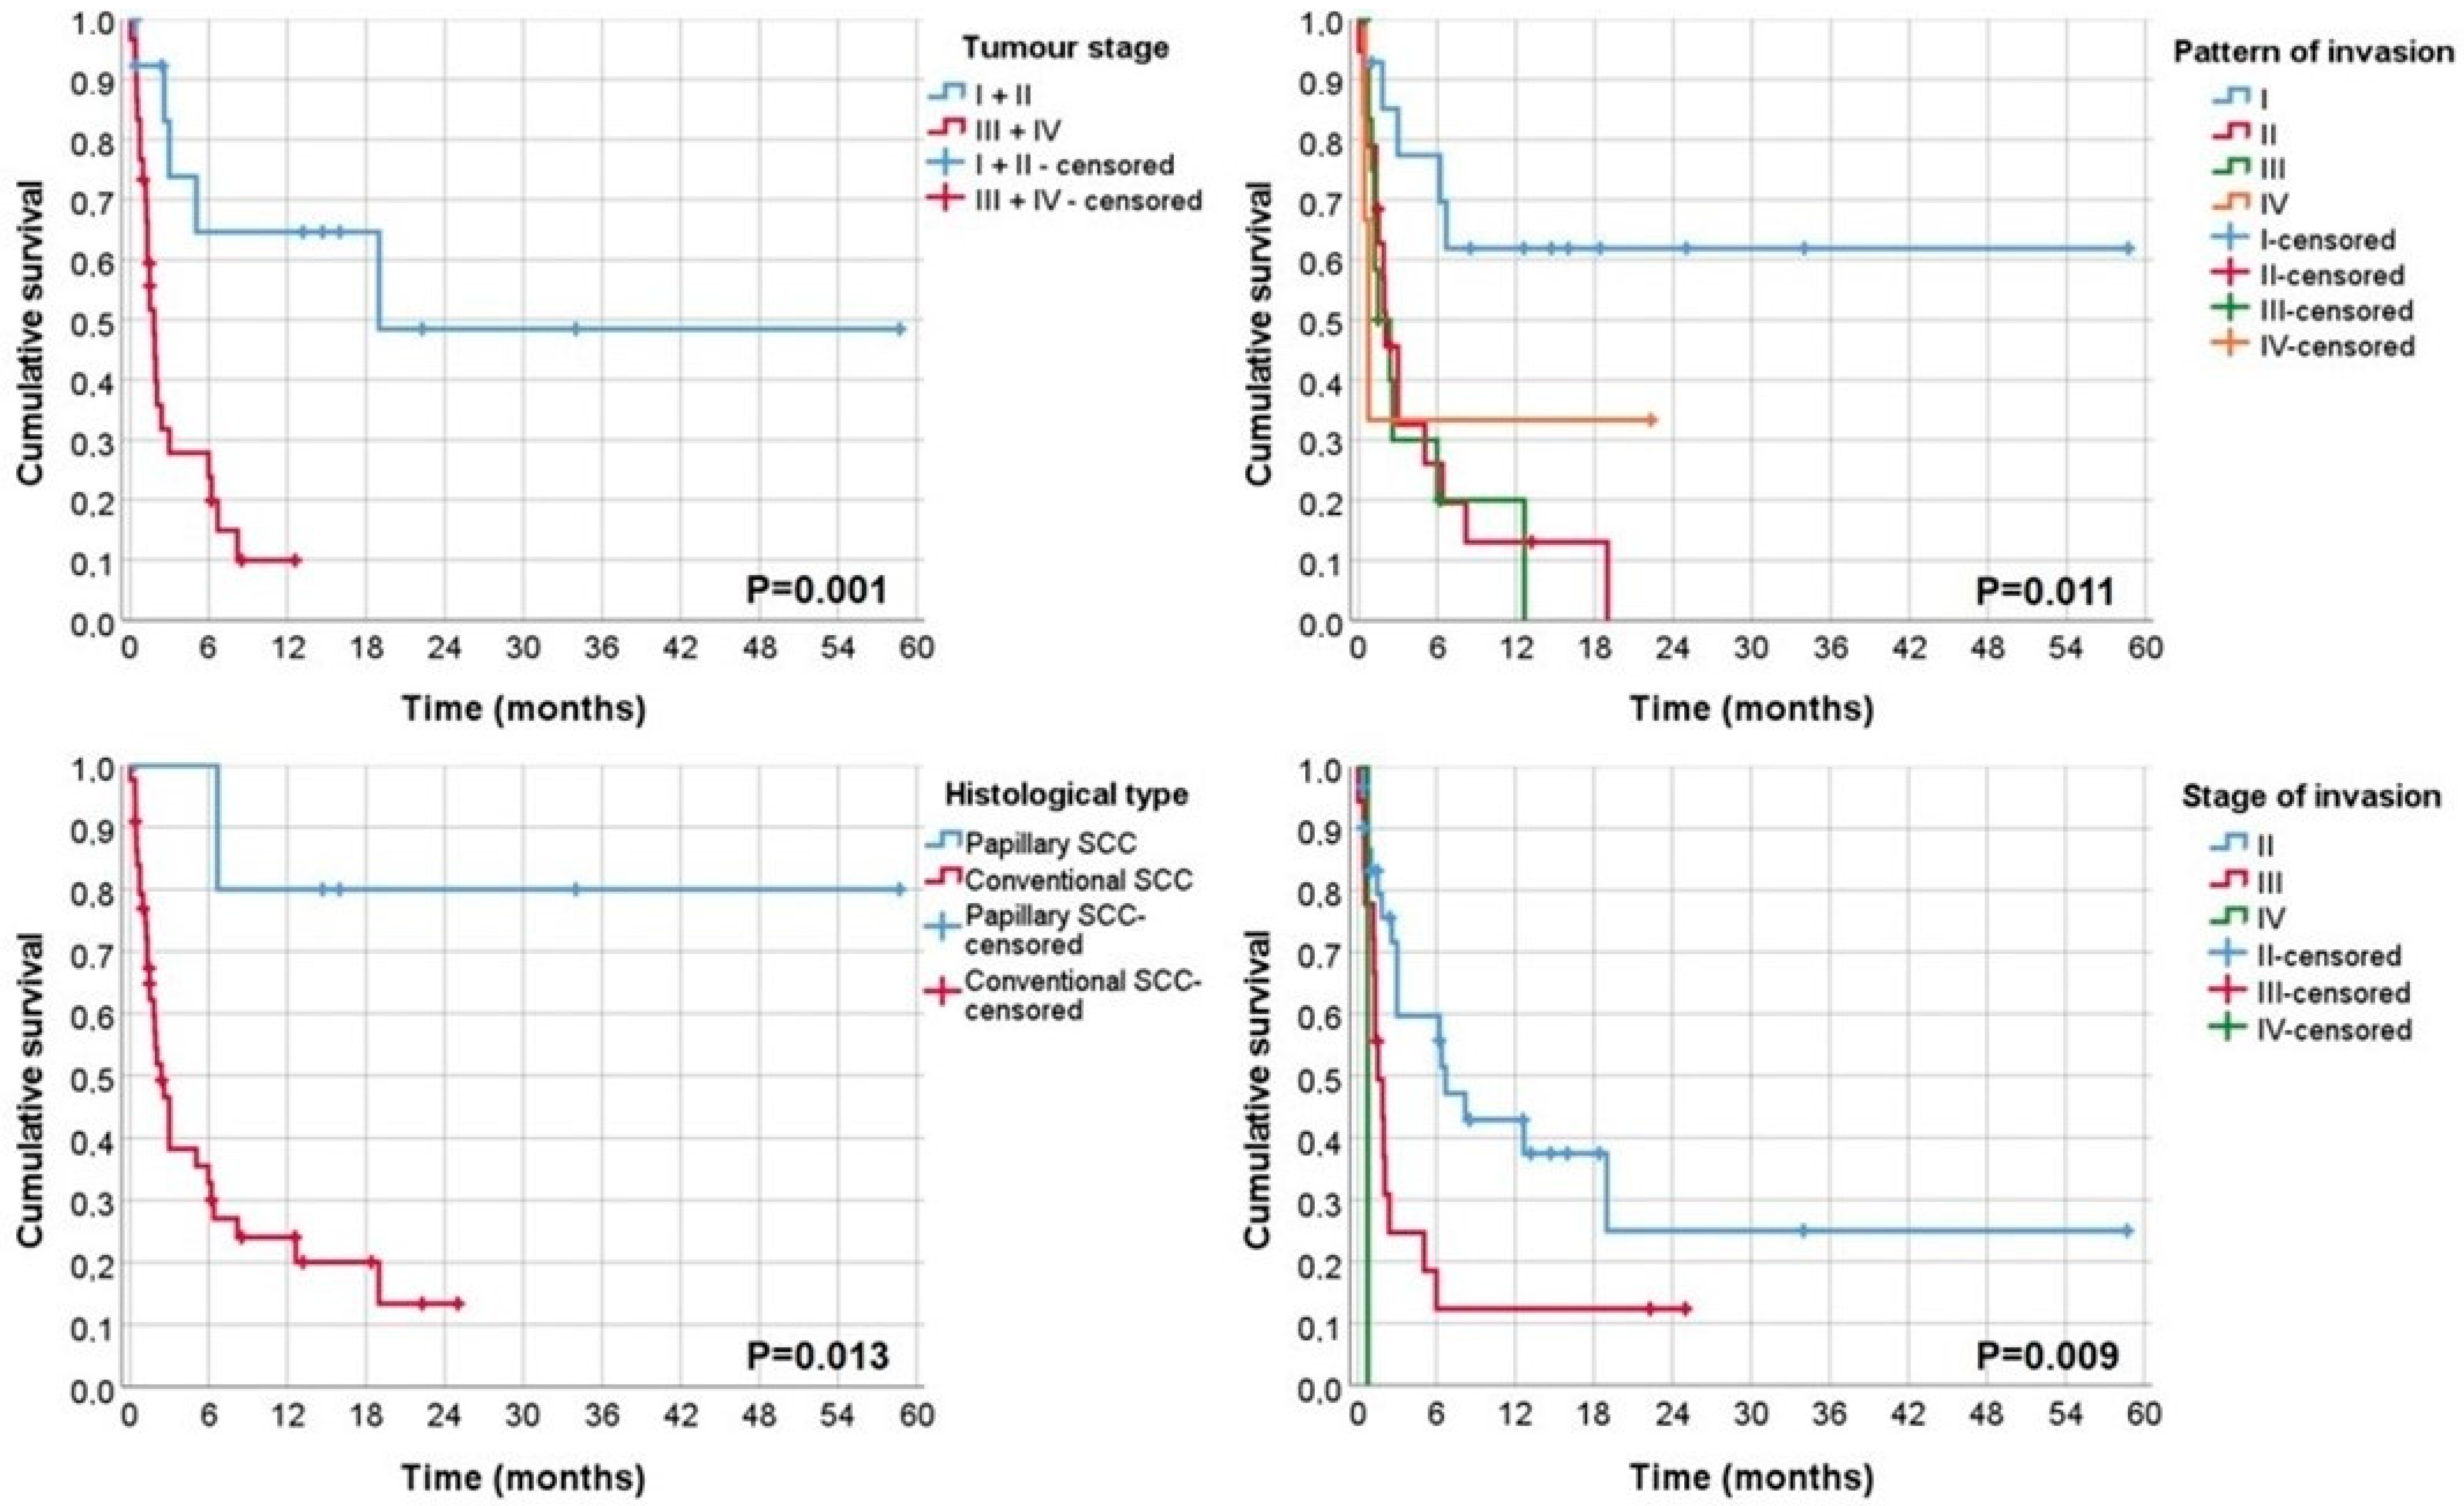
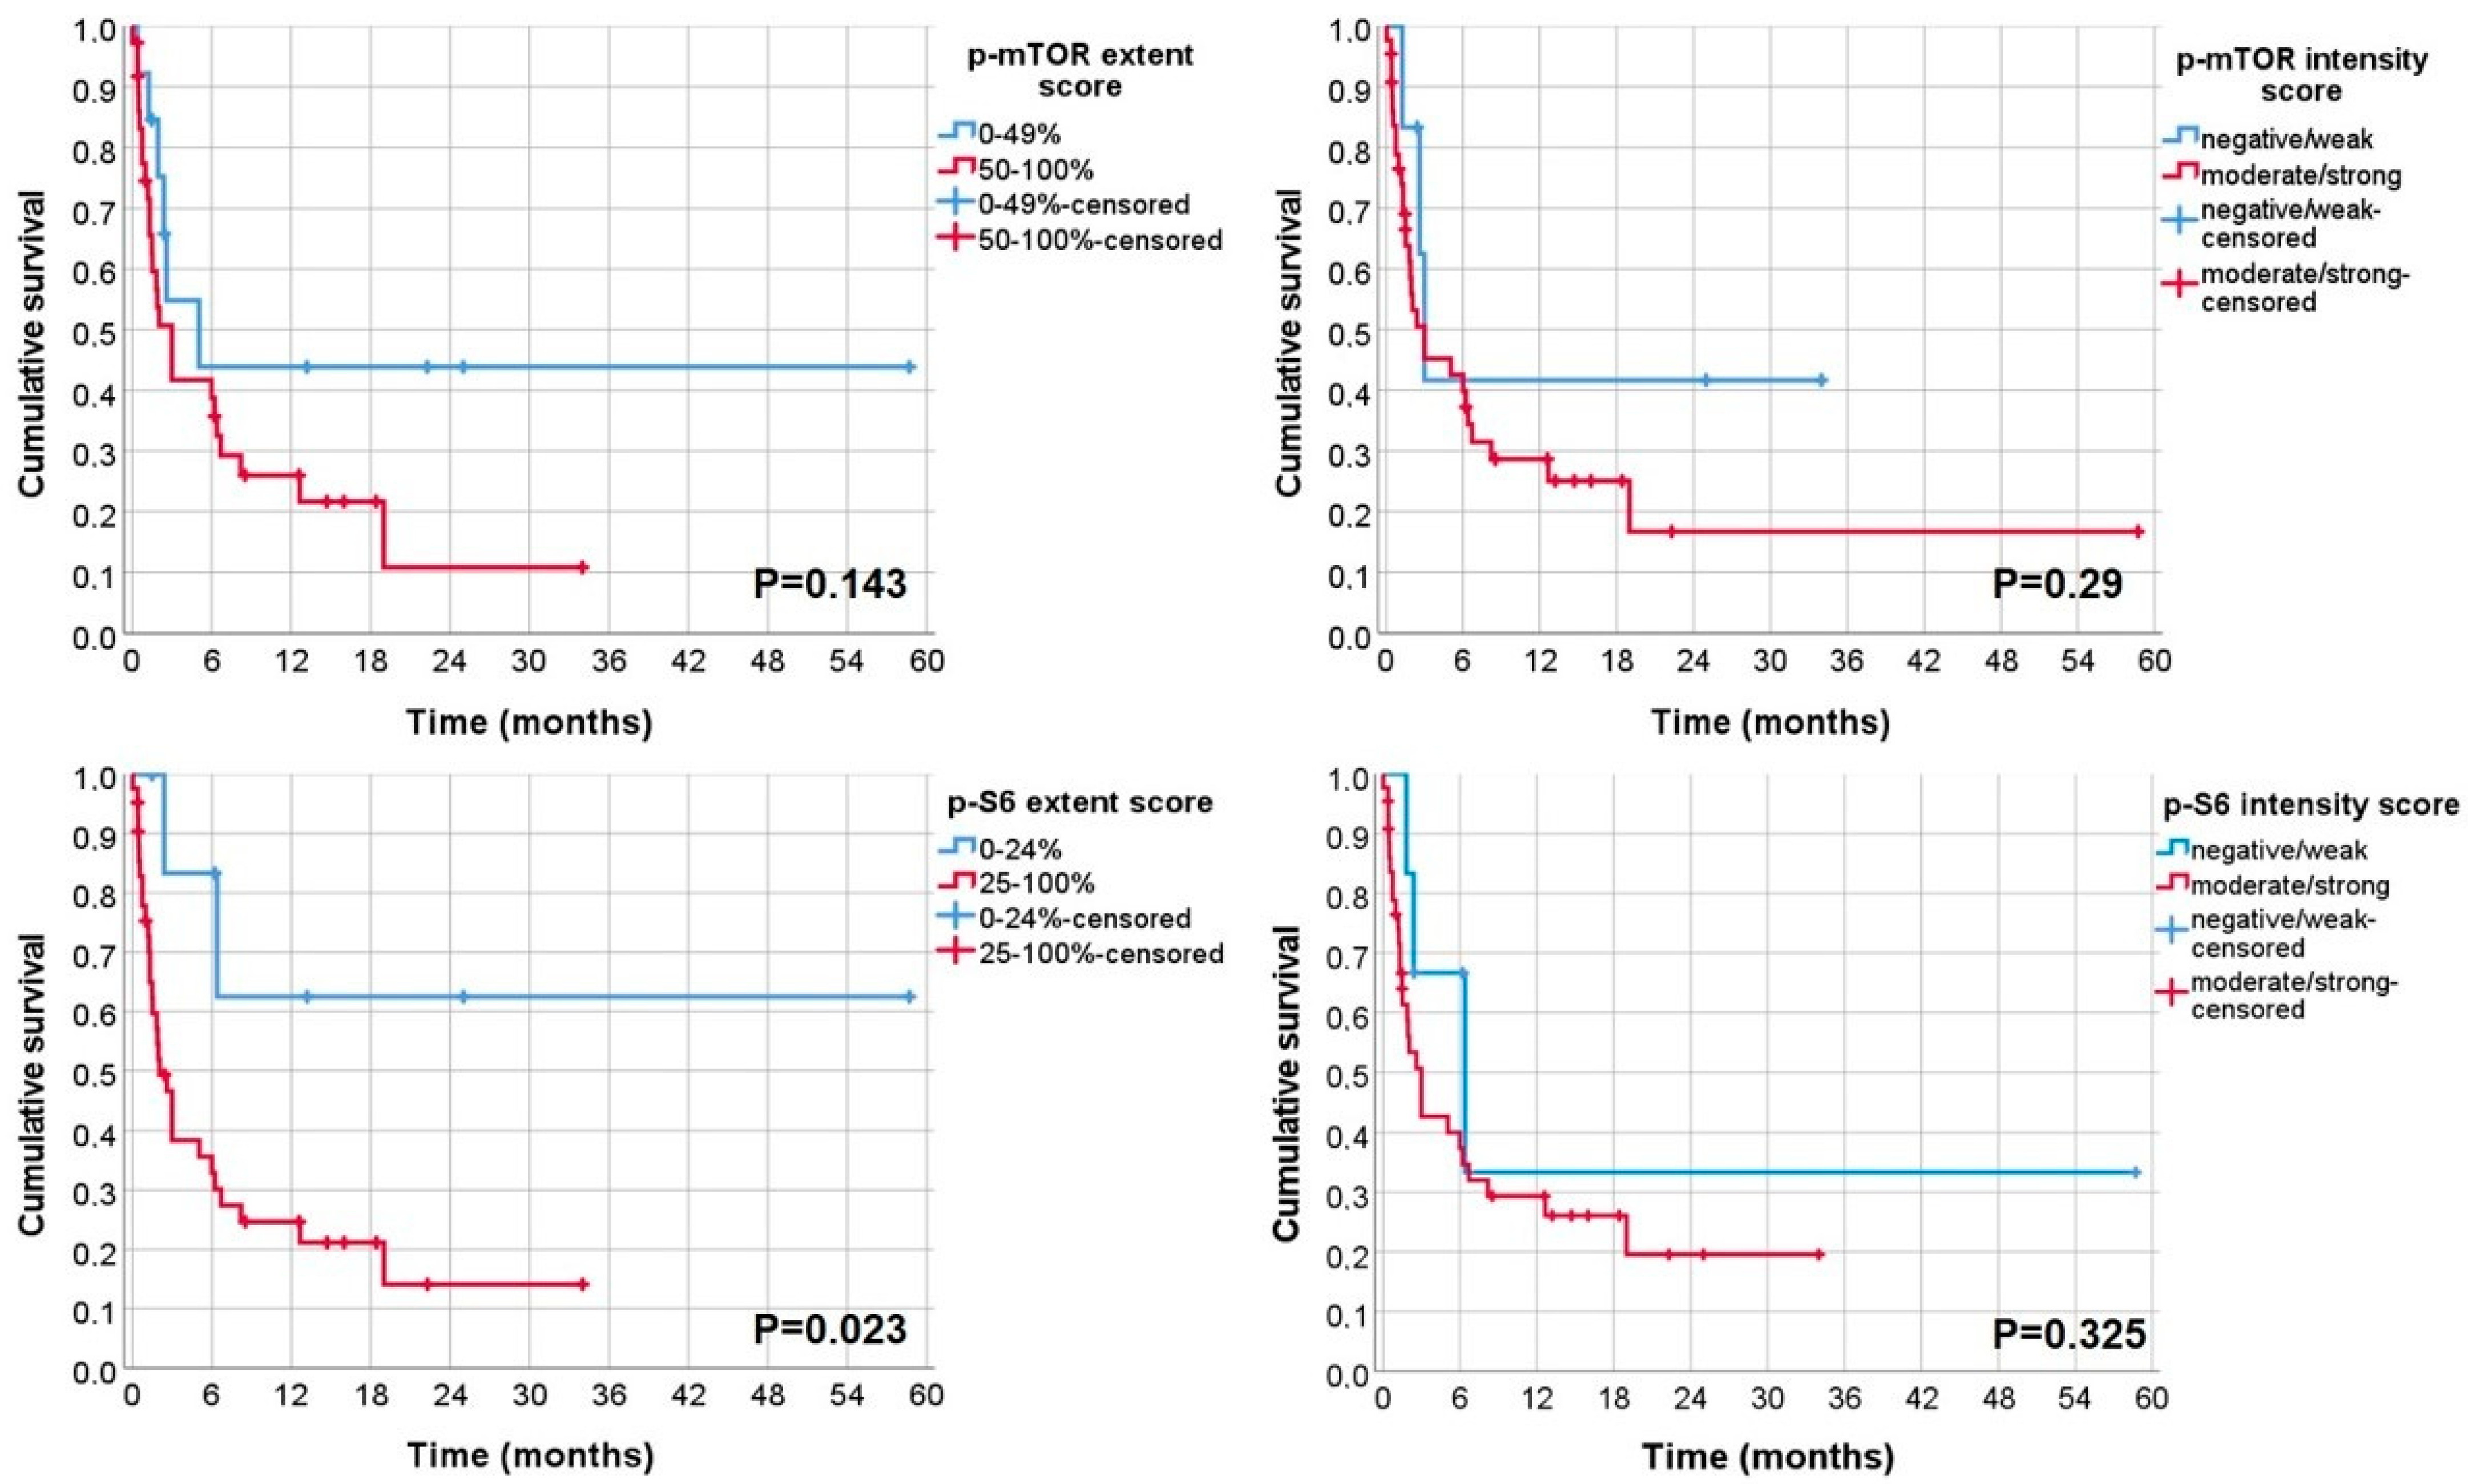
3.4. Analysis of Cancer-Specific Survival
4. Discussion
5. Conclusions
Author Contributions
Funding
Institutional Review Board Statement
Informed Consent Statement
Data Availability Statement
Acknowledgments
Conflicts of Interest
References
- Vail, D.M.; Thamm, D.H.; Liptak, J.M. 23—Cancer of the Gastrointestinal Tract. In Withrow and MacEwen’s Small Animal Clinical Oncology, 6th ed.; Vail, D.M., Thamm, D.H., Liptak, J.M., Eds.; W.B. Saunders: St. Louis, MO, USA, 2020; pp. 432–491. [Google Scholar]
- Delgado, L.; Simões, P.; Prada, J.; Monteiro, L. Oral pathology in a portuguese dogs population: An eight-year biopsy-based retrospective cross-sectional study. J. Vet. Dent. 2022; in press. [Google Scholar]
- Thaiwong, T.; Sledge, D.G.; Collins-Webb, A.; Kiupel, M. Immunohistochemical Characterization of Canine Oral Papillary Squamous Cell Carcinoma. Vet. Pathol. 2018, 55, 224–232. [Google Scholar] [CrossRef] [PubMed]
- Soukup, J.W.; Snyder, C.J.; Simmons, B.T.; Pinkerton, M.E.; Chun, R. Clinical, Histologic, and Computed Tomographic Features of Oral Papillary Squamous Cell Carcinoma in Dogs: 9 Cases (2008–2011). J. Vet. Dent. 2013, 30, 18–24. [Google Scholar] [CrossRef]
- Van der Steen, F.; Zandvliet, M. Treatment of canine oral papillary squamous cell carcinoma using definitive-intent radiation as a monotherapy—A case series. Vet. Comp. Oncol. 2021, 19, 152–159. [Google Scholar] [CrossRef]
- Nemec, A.; Murphy, B.; Kass, P.H.; Verstraete, F.J. Histological subtypes of oral non-tonsillar squamous cell carcinoma in dogs. J. Comp. Pathol. 2012, 147, 111–120. [Google Scholar] [CrossRef] [PubMed]
- Miranda-Filho, A.; Bray, F. Global patterns and trends in cancers of the lip, tongue and mouth. Oral Oncol. 2020, 102, 104551. [Google Scholar] [CrossRef]
- Warnakulasuriya, S.; Kerr, A.R. Oral Cancer Screening: Past, Present, and Future. J. Dent. Res. 2021, 100, 1313–1320. [Google Scholar] [CrossRef]
- Johnson, N.W.; Warnakulasuriya, S.; Gupta, P.C.; Dimba, E.; Chindia, M.; Otoh, E.C.; Sankaranarayanan, R.; Califano, J.; Kowalski, L. Global oral health inequalities in incidence and outcomes for oral cancer: Causes and solutions. Adv. Dent. Res. 2011, 23, 237–246. [Google Scholar] [CrossRef]
- Warnakulasuriya, S. Causes of oral cancer--an appraisal of controversies. Br. Dent. J. 2009, 207, 471–475. [Google Scholar] [CrossRef]
- Secretan, B.; Straif, K.; Baan, R.; Grosse, Y.; El Ghissassi, F.; Bouvard, V.; Benbrahim-Tallaa, L.; Guha, N.; Freeman, C.; Galichet, L.; et al. A review of human carcinogens—Part E: Tobacco, areca nut, alcohol, coal smoke, and salted fish. Lancet Oncol. 2009, 10, 1033–1034. [Google Scholar] [CrossRef]
- Mariano, L.C.; Warnakulasuriya, S.; Straif, K.; Monteiro, L. Secondhand smoke exposure and oral cancer risk: A systematic review and meta-analysis. Tob. Control 2021. [Google Scholar] [CrossRef] [PubMed]
- Gupta, R.; Mariano, L.C.; Nethan, S.T.; Kedar, A.; Sinha, D.N.; Warnakulasuriya, S.; Monteiro, L.; Sharma, S.; Gupta, S.; Singh, S.; et al. Risk Reversal of Oral, Pharyngeal and Oesophageal Cancers after Cessation of Betel Quid Users: A Systematic Review and Meta-Analysis. Ann. Glob. Health 2022, 88, 5. [Google Scholar] [CrossRef] [PubMed]
- Maekawa, N.; Konnai, S.; Okagawa, T.; Nishimori, A.; Ikebuchi, R.; Izumi, Y.; Takagi, S.; Kagawa, Y.; Nakajima, C.; Suzuki, Y.; et al. Immunohistochemical Analysis of PD-L1 Expression in Canine Malignant Cancers and PD-1 Expression on Lymphocytes in Canine Oral Melanoma. PLoS ONE 2016, 11, e0157176. [Google Scholar] [CrossRef]
- Tavares, C.; Eloy, C.; Melo, M.; Gaspar da Rocha, A.; Pestana, A.; Batista, R.; Bueno Ferreira, L.; Rios, E.; Sobrinho Simões, M.; Soares, P. mTOR Pathway in Papillary Thyroid Carcinoma: Different Contributions of mTORC1 and mTORC2 Complexes for Tumor Behavior and SLC5A5 mRNA Expression. Int. J. Mol. Sci. 2018, 19, 1448. [Google Scholar] [CrossRef]
- Fattahi, S.; Amjadi-Moheb, F.; Tabaripour, R.; Ashrafi, G.H.; Akhavan-Niaki, H. PI3K/AKT/mTOR signaling in gastric cancer: Epigenetics and beyond. Life Sci. 2020, 262, 118513. [Google Scholar] [CrossRef] [PubMed]
- Monteiro, L.S.; Delgado, M.L.; Ricardo, S.; Garcez, F.; do Amaral, B.; Warnakulasuriya, S.; Lopes, C. Phosphorylated mammalian target of rapamycin is associated with an adverse outcome in oral squamous cell carcinoma. Oral Surg. Oral Med. Oral Pathol. Oral Radiol. 2013, 115, 638–645. [Google Scholar] [CrossRef] [PubMed]
- Vivanco, I.; Sawyers, C.L. The phosphatidylinositol 3-Kinase AKT pathway in human cancer. Nat. Rev. Cancer 2002, 2, 489–501. [Google Scholar] [CrossRef]
- Aggarwal, S.; John, S.; Sapra, L.; Sharma, S.C.; Das, S.N. Targeted disruption of PI3K/Akt/mTOR signaling pathway, via PI3K inhibitors, promotes growth inhibitory effects in oral cancer cells. Cancer Chemother. Pharmacol. 2019, 83, 451–461. [Google Scholar] [CrossRef]
- Dey, S.; Singh, A.K.; Singh, A.K.; Rawat, K.; Banerjee, J.; Agnihotri, V.; Upadhaya, D. Critical pathways of oral squamous cell carcinoma: Molecular biomarker and therapeutic intervention. Med. Oncol. 2022, 39, 30. [Google Scholar] [CrossRef]
- Pópulo, H.; Lopes, J.M.; Soares, P. The mTOR signalling pathway in human cancer. Int. J. Mol. Sci. 2012, 13, 1886–1918. [Google Scholar] [CrossRef]
- Moura, A.C.; Assad, D.X.; Amorim Dos Santos, J.; Porto de Toledo, I.; Barra, G.B.; Castilho, R.M.; Squarize, C.H.; Guerra, E.N.S. Worldwide prevalence of PI3K-AKT-mTOR pathway mutations in head and neck cancer: A systematic review and meta-analysis. Crit. Rev. Oncol. Hematol. 2021, 160, 103284. [Google Scholar] [CrossRef] [PubMed]
- Marques, A.E.; Elias, S.T.; Porporatti, A.L.; Castilho, R.M.; Squarize, C.H.; De Luca Canto, G.; Guerra, E.N. mTOR pathway protein immunoexpression as a prognostic factor for survival in head and neck cancer patients: A systematic review and meta-analysis. J. Oral Pathol. Med. 2016, 45, 319–328. [Google Scholar] [CrossRef] [PubMed]
- Gutkind, J.S.; Molinolo, A.A.; Wu, X.; Wang, Z.; Nachmanson, D.; Harismendy, O.; Alexandrov, L.B.; Wuertz, B.R.; Ondrey, F.G.; Laronde, D.; et al. Inhibition of mTOR signaling and clinical activity of metformin in oral premalignant lesions. JCI Insight 2021, 6, e147096. [Google Scholar] [CrossRef]
- Delgado, L.; Gärtner, F.; Dias Pereira, P. Activation of Mammalian target of rapamycin in canine mammary carcinomas: An immunohistochemical study. J. Comp. Pathol. 2015, 152, 138–144. [Google Scholar] [CrossRef]
- Rivera-Calderón, L.G.; Fonseca-Alves, C.E.; Kobayashi, P.E.; Carvalho, M.; Vasconcelos, R.O.; Laufer-Amorim, R. p-mTOR, p-4EBP-1 and eIF4E expression in canine prostatic carcinoma. Res. Vet. Sci. 2019, 122, 86–92. [Google Scholar] [CrossRef] [PubMed]
- Murai, A.; Abou Asa, S.; Kodama, A.; Sakai, H.; Hirata, A.; Yanai, T. Immunohistochemical analysis of the Akt/mTOR/4E-BP1 signalling pathway in canine haemangiomas and haemangiosarcomas. J. Comp. Pathol. 2012, 147, 430–440. [Google Scholar] [CrossRef]
- Chen, Y.T.; Tan, K.A.; Pang, L.Y.; Argyle, D.J. The class I PI3K/Akt pathway is critical for cancer cell survival in dogs and offers an opportunity for therapeutic intervention. BMC Vet. Res. 2012, 8, 73. [Google Scholar] [CrossRef] [PubMed]
- Wang, Z.; Valera, J.C.; Zhao, X.; Chen, Q.; Gutkind, J.S. mTOR co-targeting strategies for head and neck cancer therapy. Cancer Metastasis. Rev. 2017, 36, 491–502. [Google Scholar] [CrossRef]
- Day, T.A.; Shirai, K.; O’Brien, P.E.; Matheus, M.G.; Godwin, K.; Sood, A.J.; Kompelli, A.; Vick, J.A.; Martin, D.; Vitale-Cross, L.; et al. Inhibition of mTOR Signaling and Clinical Activity of Rapamycin in Head and Neck Cancer in a Window of Opportunity Trial. Clin. Cancer Res. 2019, 25, 1156–1164. [Google Scholar] [CrossRef]
- Amornphimoltham, P.; Patel, V.; Sodhi, A.; Nikitakis, N.G.; Sauk, J.J.; Sausville, E.A.; Molinolo, A.A.; Gutkind, J.S. Mammalian target of rapamycin, a molecular target in squamous cell carcinomas of the head and neck. Cancer Res. 2005, 65, 9953–9961. [Google Scholar] [CrossRef]
- Epstein, M.; Kuehn, N.F.; Landsberg, G.; Lascelles, B.D.; Marks, S.L.; Schaedler, J.M.; Tuzio, H. AAHA senior care guidelines for dogs and cats. J. Am. Anim. Hosp. Assoc. 2005, 41, 81–91. [Google Scholar] [CrossRef] [PubMed]
- Head, K.W. Histological Classification of Tumors of the Alimentary System of Domestic Animals; Armed Forces Institute of Pathology: USA, 2003. [Google Scholar]
- Anneroth, G.; Batsakis, J.; Luna, M. Review of the literature and a recommended system of malignancy grading in oral squamous cell carcinomas. Scand. J. Dent. Res. 1987, 95, 229–249. [Google Scholar] [CrossRef] [PubMed]
- Bryne, M.; Koppang, H.S.; Lilleng, R.; Stene, T.; Bang, G.; Dabelsteen, E. New malignancy grading is a better prognostic indicator than Broders’ grading in oral squamous cell carcinomas. J. Oral Pathol. Med. 1989, 18, 432–437. [Google Scholar] [CrossRef]
- Edge, S.B. AJCC Cancer Staging Manual, 8th ed.; Springer: New York, NY, USA, 2017. [Google Scholar]
- Munday, J.S.; Löhr, C.V.; Kiupel, M. Tumors of the Alimentary Tract. In Tumors in Domestic Animals; Wiley-Blackwell: USA, 2016; pp. 499–601. [Google Scholar]
- Clemente-Vicario, F.; Alvarez, C.E.; Rowell, J.L.; Roy, S.; London, C.A.; Kisseberth, W.C.; Lorch, G. Human Genetic Relevance and Potent Antitumor Activity of Heat Shock Protein 90 Inhibition in Canine Lung Adenocarcinoma Cell Lines. PLoS ONE 2015, 10, e0142007. [Google Scholar] [CrossRef] [PubMed]
- Riggs, J.; Adams, V.J.; Hermer, J.V.; Dobson, J.M.; Murphy, S.; Ladlow, J.F. Outcomes following surgical excision or surgical excision combined with adjunctive, hypofractionated radiotherapy in dogs with oral squamous cell carcinoma or fibrosarcoma. J. Am. Vet. Med. Assoc. 2018, 253, 73–83. [Google Scholar] [CrossRef] [PubMed]
- Fulton, A.J.; Nemec, A.; Murphy, B.G.; Kass, P.H.; Verstraete, F.J. Risk factors associated with survival in dogs with nontonsillar oral squamous cell carcinoma 31 cases (1990–2010). J. Am. Vet. Med. Assoc. 2013, 243, 696–702. [Google Scholar] [CrossRef]
- Simpson, D.R.; Mell, L.K.; Cohen, E.E. Targeting the PI3K/AKT/mTOR pathway in squamous cell carcinoma of the head and neck. Oral Oncol. 2015, 51, 291–298. [Google Scholar] [CrossRef]
- Gordon, I.K.; Ye, F.; Kent, M.S. Evaluation of the mammalian target of rapamycin pathway and the effect of rapamycin on target expression and cellular proliferation in osteosarcoma cells from dogs. Am. J. Vet. Res. 2008, 69, 1079–1084. [Google Scholar] [CrossRef]
- Kent, M.S.; Collins, C.J.; Ye, F. Activation of the AKT and mammalian target of rapamycin pathways and the inhibitory effects of rapamycin on those pathways in canine malignant melanoma cell lines. Am. J. Vet. Res. 2009, 70, 263–269. [Google Scholar] [CrossRef]
- Yin, X.; Hu, L.; Feng, X.; Wang, H.; Zhang, C.; Wang, H.; Wang, S. Simultaneous activation of impaired autophagy and the mammalian target of rapamycin pathway in oral squamous cell carcinoma. J. Oral Pathol. Med. 2019, 48, 705–711. [Google Scholar] [CrossRef]
- Paoloni, M.C.; Mazcko, C.; Fox, E.; Fan, T.; Lana, S.; Kisseberth, W.; Vail, D.M.; Nuckolls, K.; Osborne, T.; Yalkowsy, S.; et al. Rapamycin pharmacokinetic and pharmacodynamic relationships in osteosarcoma: A comparative oncology study in dogs. PLoS ONE 2010, 5, e11013. [Google Scholar] [CrossRef] [PubMed]
- Harsha, C.; Banik, K.; Ang, H.L.; Girisa, S.; Vikkurthi, R.; Parama, D.; Rana, V.; Shabnam, B.; Khatoon, E.; Kumar, A.P.; et al. Targeting AKT/mTOR in Oral Cancer: Mechanisms and Advances in Clinical Trials. Int. J. Mol. Sci. 2020, 21, 3285. [Google Scholar] [CrossRef] [PubMed]
- Borges, G.A.; Elias, S.T.; Amorim, B.; de Lima, C.L.; Coletta, R.D.; Castilho, R.M.; Squarize, C.H.; Guerra, E.N.S. Curcumin downregulates the PI3K-AKT-mTOR pathway and inhibits growth and progression in head and neck cancer cells. Phytother. Res. 2020, 34, 3311–3324. [Google Scholar] [CrossRef] [PubMed]
- Patel, J.; Nguyen, S.A.; Ogretmen, B.; Gutkind, J.S.; Nathan, C.A.; Day, T. mTOR inhibitor use in head and neck squamous cell carcinoma: A meta-analysis on survival, tumor response, and toxicity. Laryngoscope Investig. Otolaryngol. 2020, 5, 243–255. [Google Scholar] [CrossRef]
- Marquard, F.E.; Jücker, M. PI3K/AKT/mTOR signaling as a molecular target in head and neck cancer. Biochem. Pharmacol. 2020, 172, 113729. [Google Scholar] [CrossRef] [PubMed]
- Nakano, T.; Warner, K.A.; Oklejas, A.E.; Zhang, Z.; Rodriguez-Ramirez, C.; Shuman, A.G.; Nör, J.E. mTOR Inhibition Ablates Cisplatin-Resistant Salivary Gland Cancer Stem Cells. J. Dent. Res. 2021, 100, 377–386. [Google Scholar] [CrossRef]
- Wanigasooriya, K.; Tyler, R.; Barros-Silva, J.D.; Sinha, Y.; Ismail, T.; Beggs, A.D. Radiosensitising Cancer Using Phosphatidylinositol-3-Kinase (PI3K), Protein Kinase B (AKT) or Mammalian Target of Rapamycin (mTOR) Inhibitors. Cancers 2020, 12, 1278. [Google Scholar] [CrossRef]
- Sanz Ressel, B.L.; Massone, A.R.; Barbeito, C.G. Immunohistochemical expression of selected phosphoproteins of the mTOR signalling pathway in canine cutaneous squamous cell carcinoma. Vet. J. 2019, 245, 41–48. [Google Scholar] [CrossRef]
- De Vicente, J.C.; Peña, I.; Rodrigo, J.P.; Rodríguez-Santamarta, T.; Lequerica-Fernández, P.; Suárez-Fernández, L.; Allonca, E.; García-Pedrero, J.M. Phosphorylated ribosomal protein S6 correlation with p21 expression and inverse association with tumor size in oral squamous cell carcinoma. Head Neck 2017, 39, 1876–1887. [Google Scholar] [CrossRef]
- Enjoji, S.; Yabe, R.; Fujiwara, N.; Tsuji, S.; Vitek, M.P.; Mizuno, T.; Nakagawa, T.; Usui, T.; Ohama, T.; Sato, K. The therapeutic effects of SET/I2PP2A inhibitors on canine melanoma. J. Vet. Med. Sci. 2015, 77, 1451–1456. [Google Scholar] [CrossRef][Green Version]
- Hsu, C.M.; Lin, P.M.; Lin, H.C.; Tsai, Y.T.; Tsai, M.S.; Li, S.H.; Wu, C.Y.; Yang, Y.H.; Lin, S.F.; Yang, M.Y. NVP-BEZ235 Attenuated Cell Proliferation and Migration in the Squamous Cell Carcinoma of Oral Cavities and p70S6K Inhibition Mimics its Effect. Int. J. Mol. Sci. 2018, 19, 3546. [Google Scholar] [CrossRef] [PubMed]


| Variables | N (%) |
|---|---|
| Gender | |
| Female | 28 (45.9%) |
| Male | 33 (54.1%) |
| Age | |
| <7 year-old | 6 (9.8%) |
| ≥7 year-old | 55 (90.2%) |
| Breed (* n = 53) | |
| Small | 10 (18.9%) |
| Medium | 5 (9.4%) |
| Large | 12 (22.6%) |
| Mixed | 26 (49.1%) |
| Tumour Location | |
| Mouth (NOS) | 14 (23%) |
| Gingiva | 20 (32.8%) |
| Tongue | 12 (19.7%) |
| Oropharynx (including Tonsils) | 8 (13.1%) |
| Palate | 7 (11.5%) |
| Histological type | |
| Papillary SCC | 10 (16.4%) |
| Conventional SCC | 51 (83.6%) |
| Anneroth´s histological grade | |
| Well differentiated | 20 (32.8%) |
| Moderate differentiated | 41 (67.2%) |
| Poor differentiated | 0 (0%) |
| Bryne´s histological grade | |
| Well differentiated | 26 (42.6%) |
| Moderate differentiated | 33 (54.1%) |
| Poor differentiated | 2 (3.3%) |
| Pattern of Invasion | |
| I—Pushing, well delineated infiltrating borders | 20 (32.8%) |
| II—Infiltrating, solid cords, bands and/or strands | 22 (36.1%) |
| III—Small groups or cords of infiltrating cells | 16 (26.2%) |
| IV—Marked and widespread cellular dissemination in small groups and/or in single cells | 3 (4.9%) |
| Stage of Invasion | |
| I—Carcinoma-in-situ and/or questionable invasion | 0 (0%) |
| II—Distinct invasion, but involving lamina propria only | 39 (63.9%) |
| III—Invasion below lamina propria adjacent to muscles, salivary gland tissues and periosteum | 21 (34.4%) |
| IV—Extensive and deep invasion replacing most of the stromal tissue and infiltrating the jawbone | 1 (1.6%) |
| Bone invasion | |
| Absent | 51 (83.6%) |
| Present | 10 (16.4%) |
| Vascular invasion | |
| Absent | 56 (91.8%) |
| Present | 5 (8.2%) |
| Tumour stage (* n = 51) | |
| I +II | 20 (39.2%) |
| III + IV | 31 (60.8%) |
| Treatment (* n = 50) | |
| Surgery | 11 (22%) |
| Chemotherapy | 4 (8%) |
| Palliative treatment/support | 35 (70%) |
| p-mTOR Extent Score | p-mTOR Intensity Score | ||||||
|---|---|---|---|---|---|---|---|
| Variables | Low | High | p-Value | Low | High | p-Value | |
| All cases | 17 | 44 | - | 9 | 52 | - | |
| Gender | Female | 7 | 21 | 0.645 | 3 | 25 | 0.412 |
| Male | 10 | 23 | 6 | 27 | |||
| Age (years) | <7 | 2 | 4 | 0.753 | 2 | 4 | 0.177 |
| ≥7 | 15 | 40 | 7 | 48 | |||
| Breed | Small | 3 | 7 | 0.680 | 0 | 10 | 0.524 |
| Medium | 2 | 3 | 1 | 4 | |||
| Large | 2 | 10 | 2 | 10 | |||
| Undetermined | 9 | 17 | 5 | 21 | |||
| Tumour Location | Mouth (NOS) | 4 | 10 | 0.806 | 2 | 12 | 0.123 |
| Gingiva | 4 | 16 | 1 | 19 | |||
| Tongue | 4 | 8 | 4 | 8 | |||
| Oropharynx | 2 | 6 | 0 | 8 | |||
| Palate | 3 | 4 | 2 | 5 | |||
| Histological type | Papillary SCC | 1 | 9 | 0.168 | 1 | 7 | 0.847 |
| Conventional SCC | 16 | 35 | 8 | 45 | |||
| Bone Invasion | Yes | 2 | 8 | 0.544 | 0 | 10 | 0.150 |
| No | 15 | 36 | 9 | 42 | |||
| Vascular Invasion | Yes | 3 | 2 | 0.094 | 2 | 3 | 0.097 |
| No | 14 | 42 | 7 | 49 | |||
| Histological grade (Anneroth) | Well differentiated | 5 | 15 | 0.727 | 2 | 18 | 0.465 |
| Moderate differentiated | 12 | 29 | 7 | 34 | |||
| Poor differentiated | 0 | 0 | 0 | 0 | |||
| Histological grade (Bryne) | Well differentiated | 7 | 19 | 0.644 | 4 | 22 | 0.836 |
| Moderate differentiated | 10 | 23 | 5 | 28 | |||
| Poor differentiated | 0 | 2 | 0 | 2 | |||
| Mitosis | 0–1/hpf | 4 | 13 | 0.350 | 0 | 17 | 0.005 |
| 2–3/hpf | 4 | 18 | 1 | 21 | |||
| 4–5/hpf | 7 | 9 | 6 | 10 | |||
| >5/hpf | 2 | 4 | 2 | 4 | |||
| Squamous differentiation | >50% keratinisation | 5 | 4 | 0.215 | 3 | 6 | 0.301 |
| 20–50% keratinisation | 3 | 10 | 1 | 12 | |||
| 5–20% keratinisation | 6 | 14 | 3 | 14 | |||
| 0–5% keratinisation | 6 | 16 | 2 | 20 | |||
| Nuclear Pleomorphism | Few | 1 | 7 | 0.508 | 1 | 7 | 0.980 |
| Moderately | 9 | 18 | 4 | 23 | |||
| Abundant | 7 | 19 | 4 | 22 | |||
| Lymphoplasmacytic infiltration | Weak | 2 | 16 | 0.108 | 1 | 1 | 0.381 |
| Moderate | 7 | 17 | 5 | 19 | |||
| Marked | 8 | 11 | 3 | 16 | |||
| Necrosis | Yes | 9 | 12 | 0.059 | 4 | 17 | 0.493 |
| No | 8 | 32 | 5 | 35 | |||
| Pattern of invasion * | I | 2 | 18 | 0.160 | 2 | 18 | 0.732 |
| II | 9 | 13 | 4 | 18 | |||
| III | 5 | 11 | 3 | 13 | |||
| IV | 1 | 2 | 0 | 3 | |||
| Stage of invasion * | I | 0 | 0 | 0.151 | 0 | 0 | 0.742 |
| II | 8 | 31 | 5 | 34 | |||
| III | 9 | 12 | 4 | 17 | |||
| IV | 0 | 1 | 0 | 1 | |||
| Treatment * | Surgery | 5 | 6 | 0.244 | 3 | 8 | 0.186 |
| Chemotherapy | 1 | 3 | 0 | 4 | |||
| Palliative treatment/support | 7 | 28 | 3 | 32 | |||
| Tumour stage | I + II | 8 | 11 | 0.125 | 4 | 15 | 0.241 |
| III + IV | 7 | 25 | 3 | 29 | |||
| p-S6 Extent Score | p-S6 Intensity Score | ||||||
|---|---|---|---|---|---|---|---|
| Variables | Low | High | p-Value | Low | High | p-Value | |
| All | 8 | 53 | - | 7 | 54 | - | |
| Gender | Female | 3 | 25 | 0.609 | 4 | 24 | 0.526 |
| Male | 5 | 28 | 3 | 30 | |||
| Age (years) | <7 | 1 | 5 | 0.785 | 1 | 5 | 0.674 |
| ≥7 | 7 | 48 | 6 | 49 | |||
| Breed | Small | 2 | 8 | 0.282 | 0 | 10 | 0.259 |
| Medium | 0 | 5 | 1 | 4 | |||
| Large | 0 | 12 | 0 | 12 | |||
| Undetermined | 5 | 21 | 4 | 22 | |||
| Tumour Location | Mouth (NOS) | 1 | 13 | 0.395 | 1 | 13 | 0.953 |
| Gingiva | 4 | 16 | 3 | 17 | |||
| Tongue | 0 | 12 | 1 | 11 | |||
| Oropharynx | 2 | 6 | 1 | 7 | |||
| Palate | 1 | 6 | 1 | 6 | |||
| Histological type | Papillary SCC | 1 | 9 | 0.750 | 1 | 9 | 0.873 |
| Conventional SCC | 7 | 44 | 6 | 45 | |||
| Bone Invasion | Yes | 2 | 8 | 0.481 | 2 | 8 | 0.355 |
| No | 6 | 45 | 5 | 46 | |||
| Vascular Invasion | Yes | 0 | 5 | 0.365 | 1 | 4 | 0.533 |
| No | 8 | 48 | 6 | 50 | |||
| Histological grade (Anneroth) | Well differentiated | 1 | 19 | 0.190 | 2 | 18 | 0.801 |
| Moderate differentiated | 7 | 34 | 5 | 36 | |||
| Poor differentiated | 0 | 0 | 0 | 0 | |||
| Histological grade (Bryne) | Well differentiated | 2 | 24 | 0.424 | 4 | 22 | 0.659 |
| Moderate differentiated | 6 | 27 | 3 | 30 | |||
| Poor differentiated | 0 | 2 | 0 | 2 | |||
| Mitosis | 0–1/hpf | 2 | 15 | 0.416 | 2 | 15 | 0.960 |
| 2–3/hpf | 3 | 19 | 2 | 20 | |||
| 4–5/hpf | 1 | 15 | 2 | 14 | |||
| >5/hpf | 2 | 4 | 1 | 5 | |||
| Squamous differentiation | >50% keratinisation | 0 | 9 | 0.263 | 1 | 8 | 0.097 |
| 20–50% keratinisation | 2 | 11 | 4 | 9 | |||
| 5–20% keratinisation | 1 | 16 | 1 | 16 | |||
| 0–5% keratinisation | 5 | 17 | 1 | 21 | |||
| Nuclear Pleomorphism | Few | 1 | 7 | 0.505 | 1 | 7 | 0.715 |
| Moderately | 5 | 22 | 4 | 23 | |||
| Abundant | 2 | 24 | 2 | 24 | |||
| Lymphoplasmacytic infiltration | Weak | 1 | 17 | 0.322 | 2 | 17 | 0.978 |
| Moderate | 5 | 19 | 3 | 21 | |||
| Marked | 2 | 17 | 2 | 16 | |||
| Necrosis | Yes | 5 | 16 | 0.073 | 5 | 16 | 0.042 |
| No | 3 | 37 | 2 | 38 | |||
| Pattern of invasion * | I | 2 | 18 | 0.783 | 2 | 18 | 0.908 |
| II | 3 | 19 | 3 | 19 | |||
| III | 3 | 13 | 2 | 14 | |||
| IV | 0 | 3 | 0 | 3 | |||
| Stage of invasion * | I | 0 | 0 | 0.914 | 0 | 0 | 0.870 |
| II | 5 | 34 | 5 | 34 | |||
| III | 3 | 18 | 2 | 19 | |||
| IV | 0 | 1 | 0 | 1 | |||
| Treatment * | Surgery | 2 | 9 | 0.837 | 0 | 11 | 0.315 |
| Chemotherapy | 1 | 3 | 1 | 3 | |||
| Palliative treatment/support | 5 | 30 | 5 | 30 | |||
| Tumour stage | I + II | 2 | 17 | 0.832 | 3 | 16 | 0.492 |
| III + IV | 4 | 28 | 3 | 29 | |||
| Factors | N | Dead | CSS 1-Year (%) | CSS 2-Years (%) | CSS Mean ± S.D. (CI 95%) | p-Value |
|---|---|---|---|---|---|---|
| Gender | 0.202 | |||||
| Female | 22 | 12 | 43.4 | 32.5 | 22.60 ± 6.49 (9.88–35.33) | |
| Male | 28 | 21 | 21.1 | 15.8 | 6.59 ± 1.73 (3.19–9.98) | |
| Age (years) | 0.498 | |||||
| <7 year-old | 5 | 2 | 60 | 60 | 20.49 ± 7.4 (5.99–34.99) | |
| ≥7 year-old | 45 | 31 | 28 | 18.4 | 14.31 ± 3.86 (6.74–21.88) | |
| Breed | 0.247 | |||||
| Small | 8 | 4 | 34.3 | 34.3 | 9.72 ± 3.78 (2.30–17.14) | |
| Medium | 3 | 1 | 66.7 | 66.7 | 11.32 ± 3.81 (3.83–18.81) | |
| Large | 10 | 8 | 20 | 20 | 7.70 ± 4.16 (0–15.86) | |
| UB | 22 | 14 | 28.7 | 28.7 | 14.73 ± 5.73 (3.50–25.95) | |
| Tumour Location | 0.643 | |||||
| Mouth (NOS) | 7 | 4 | 33.3 | 33.3 | 9.01 ± 3.17 (2.79–15.23) | |
| Gingiva | 18 | 9 | 40 | 40 | 24.98 ± 7.34 (10.58–39.38) | |
| Tongue | 10 | 8 | 25 | 0 | 6.26 ± 2.69 (0.98–11.52) | |
| Oropharynx (including Tonsils) | 8 | 7 | 0 | 0 | 4.02 ± 1.09 (1.89–6.16) | |
| Palate | 7 | 5 | 28.6 | 28.6 | 8.39 ± 3.98 (0.60–16.18) | |
| Histological type | 0.013 | |||||
| Papillary SCC | 6 | 1 | 80 | 80 | 48.3 ± 9.3 (30.07–66.53) | |
| Conventional SCC | 44 | 32 | 24.1 | 13.4 | 6.94 ± 1.43 (4.13–9.75) | |
| Bone Invasion | 0.856 | |||||
| Yes | 8 | 4 | 35 | 35 | 21.35 ± 11.33 (0–43.56) | |
| No | 42 | 29 | 30.4 | 20.2 | 10.45 ± 2.20 (6.14–14.77) | |
| Vascular Invasion | 0.689 | |||||
| Yes | 4 | 2 | 50 | 50 | 11.71 ± 5.29 (1.34–22.09) | |
| No | 46 | 31 | 29.6 | 19.8 | 15.08 ± 3.97 (7.30–22.87) | |
| Anneroth´s histological grade | 0.543 | |||||
| Well differentiated | 16 | 10 | 33.9 | 33.9 | 21.55 ± 6.89 (8.04–35.06) | |
| Moderate differentiated | 34 | 23 | 28.7 | 16.4 | 7.97 ± 1.75 (4.55–11.40) | |
| Poor differentiated | 0 | - | - | - | - | |
| Bryne’s histological grade | 0.112 | |||||
| Well differentiated | 22 | 16 | 55.8 | 16.7 | 12.20 ± 4.88 (2.63–21.77) | |
| Moderate differentiated | 26 | 15 | 44.7 | 26.1 | 10.95 ± 2.21 (6.62–15.28) | |
| Poor differentiated | 2 | 2 | 0 | 0 | 1.35 ± 0.15 (1.06–1.64) | |
| Mitosis number | 0.934 | |||||
| 0–1/hpf | 16 | 11 | 31.3 | 31.3 | 20.19 ± 6.51 (7.43–32.94) | |
| 2–3/hpf | 15 | 10 | 23.5 | 0 | 6.58 ± 2.28 (2.10–11.05) | |
| 4–5/hpf | 13 | 7 | 46 | 34.5 | 13.85 ± 4.75 (4.54–23.16) | |
| >5/hpf | 6 | 5 | 16.7 | 16.7 | 6.88 ± 3.41 (8.53–23.65) | |
| Nuclear Pleomorphism | 0.069 | |||||
| Few | 8 | 3 | 57.1 | 57.1 | 21.54 ± 5.47 (10.82–32.25) | |
| Moderately | 22 | 14 | 32.3 | 24.2 | 16.82 ± 5.88 (5.28–28.36) | |
| Abundant | 20 | 16 | 17.7 | 8.8 | 5.43 ± 1.75 (2–8.87) | |
| Lymphocytic infiltration | 0.448 | |||||
| Weak | 14 | 9 | 20 | 10 | 6.18 ± 1.87 (2.51–9.85) | |
| Moderate | 21 | 11 | 40.3 | 32.3 | 21.56 ± 6.66 (8.51–34.61) | |
| Strong | 15 | 13 | 31 | 31 | 6.33 ± 1.95 (2.51–10.15) | |
| Pattern of invasion | 0.011 | |||||
| I | 15 | 5 | 61.9 | 61.9 | 37.74 ± 7.40 (23.24–52.25) | |
| II | 19 | 16 | 13 | 0 | 4.79 ± 1.50 (1.84–7.74) | |
| III | 13 | 10 | 20 | 0 | 4.15 ± 1.44 (1.33–6.97) | |
| IV | 3 | 2 | 33.3 | 33.3 | 7.84 ± 5.90 (0–19.41) | |
| Stage of invasion | 0.009 | |||||
| I | 0 | - | - | - | - | |
| II | 31 | 17 | 42.9 | 25.0 | 19.58 ± 5.77 (8.27–30.88) | |
| III | 18 | 15 | 12.3 | 12.3 | 4.75 ± 1.90 (1.01–8.48) | |
| IV | 1 | 1 | 0 | 0.00 | 76 ± 0 (76–76) | |
| Treatment | 0.048 | |||||
| Surgery | 11 | 4 | 55.6 | 55.6 | 20.74 ± 4.95 (11.03–30.44) | |
| Chemotherapy | 4 | 14 | 0 | 0 | 3.46 ± 1.60 (0.33–6.58) | |
| Palliative treatment/support | 35 | 25 | 26.9 | 14.4 | 11.97 ± 4.12 (3.89–20.05) | |
| Tumour stage | 0.001 | |||||
| I + II | 14 | 5 | 64.6 | 48.5 | 32.53 ± 8.61 (15.66–49.40) | |
| III + IV | 30 | 24 | 9.9 | 9.9 | 3.45 ± 0.74 (2.00–4.89) |
| Factors | N | Dead | CSS 1-Year (%) | CSS 2-Years (%) | CSS Mean ± S.D. (CI 95%) | p-Value |
|---|---|---|---|---|---|---|
| p-mTOR extent (% of tumour cells) | 0.143 | |||||
| 0–49% | 13 | 6 | 43.9 | 43.9 | 27.13 ± 8.84 (9.81–44.45) | |
| 50–100% | 37 | 27 | 26 | 10.8 | 8.14 ± 2.12 (3.99–12.29) | |
| p-mTOR intensity | 0.290 | |||||
| Negative/weak | 6 | 3 | 41.7 | 41.7 | 15.54 ± 7 (1.82–29.27) | |
| Moderate/strong | 44 | 30 | 28.6 | 28.6 | 13.65 ± 4.01 (5.62–21.68) | |
| p-mTOR location | 0.699 | |||||
| Cytoplasm | 4 | 3 | 25 | 25 | 7.07 ± 5.18 (0–17.22) | |
| Membrane + cytoplasm | 43 | 27 | 30.7 | 23 | 16.87 ± 4.43 (8.19–25.56) | |
| Cytoplasm + nucleus | 3 | 3 | 33.3 | 0 | 5.353 ± 3.66 (0–12.52) | |
| p-mTOR distribution | 0.255 | |||||
| Central | 7 | 2 | 64.3 | 64.3 | 38.89 ± 11.59 (16.18–61.6) | |
| Homogeneous | 40 | 29 | 76.6 | 52 | 9.27 ± 2.15 (5.06–13.47) | |
| Periphery | 3 | 2 | 0 | 0 | 5.02 ± 3.19 (0–11.26) | |
| p-S6 extent (% of tumour cells) | 0.023 | |||||
| 0–24% | 8 | 2 | 62.5 | 62.5 | 38.42 ± 11.50 (15.88–60.96) | |
| 25–100% | 42 | 31 | 24.7 | 14.1 | 8.32 ± 2.01 (4.38–12.26) | |
| p-S6 intensity | 0.325 | |||||
| Negative/weak | 6 | 3 | 33.3 | 33.3 | 22.41 ± 13.645 (02.95–49.16) | |
| Moderate/Strong | 44 | 30 | 29.3 | 19.6 | 9.96 ± 2.17 (5.71–14.21) | |
| p-S6 location * | 0.565 | |||||
| Cytoplasm | 24 | 17 | 33.3 | 18.5 | 10.6 ± 2.77 (5.16–16.03) | |
| Membrane + cytoplasm | 25 | 16 | 25.2 | 25.2 | 16.43 ± 5.43 (5.79–27.07) | |
| p-S6 distribution * | 0.157 | |||||
| Central | 5 | 2 | 50 | 50 | 11.13 ± 3.67 (3.93–18.34) | |
| Homogeneous | 37 | 27 | 23 | 12.8 | 6.68 ± 1.54 (3.66–9.69) | |
| Periphery | 7 | 4 | 42.9 | 42.9 | 26.72 ± 10.49 (6.17–47.28) |
| Cancer-Specific Survival | ||
|---|---|---|
| Variables | p-Value | HR (95% CI) |
| Histological type | ||
| Papillary | 0.938 | 1 (reference category) |
| Conventional | 1.1 (0.11–10.86) | |
| Treatment | ||
| Surgery or chemotherapy | 0.009 | 1 (reference category) |
| Palliative or support | 1.95 (1.18–3.22) | |
| p-S6 extent | ||
| 0–24% | 0.027 | 1 (reference category) |
| 25–100% | 11.58 (1.316–101.83) | |
| Tumour stage | ||
| I + II | 0.013 | 1 (reference category) |
| III + IV | 5.01 (1.41–17.83) | |
| Pattern of invasion | ||
| I | 0.059 | 1 (reference category) |
| II | 0.016 | 6.72 (1.43–31.59) |
| III | 0.007 | 10.53 (1.92–57.87) |
| IV | 0.05 | 10.52 (1–111.24) |
| Stage of invasion | ||
| I | - | - |
| II | 0.661 | 1 (reference category) |
| III | 0.421 | 1.47 (0.58–3.73) |
| IV | 0.522 | 2.1 (0.22–20.29) |
Publisher’s Note: MDPI stays neutral with regard to jurisdictional claims in published maps and institutional affiliations. |
© 2022 by the authors. Licensee MDPI, Basel, Switzerland. This article is an open access article distributed under the terms and conditions of the Creative Commons Attribution (CC BY) license (https://creativecommons.org/licenses/by/4.0/).
Share and Cite
Delgado, L.; Brilhante-Simões, P.; Garcez, F.; Monteiro, L.; Pires, I.; Prada, J. p-S6 as a Prognostic Biomarker in Canine Oral Squamous Cell Carcinoma. Biomolecules 2022, 12, 935. https://doi.org/10.3390/biom12070935
Delgado L, Brilhante-Simões P, Garcez F, Monteiro L, Pires I, Prada J. p-S6 as a Prognostic Biomarker in Canine Oral Squamous Cell Carcinoma. Biomolecules. 2022; 12(7):935. https://doi.org/10.3390/biom12070935
Chicago/Turabian StyleDelgado, Leonor, Paula Brilhante-Simões, Fernanda Garcez, Luís Monteiro, Isabel Pires, and Justina Prada. 2022. "p-S6 as a Prognostic Biomarker in Canine Oral Squamous Cell Carcinoma" Biomolecules 12, no. 7: 935. https://doi.org/10.3390/biom12070935
APA StyleDelgado, L., Brilhante-Simões, P., Garcez, F., Monteiro, L., Pires, I., & Prada, J. (2022). p-S6 as a Prognostic Biomarker in Canine Oral Squamous Cell Carcinoma. Biomolecules, 12(7), 935. https://doi.org/10.3390/biom12070935