
Relationship of micro-RNA, mRNA and eIF Expression in Tamoxifen-Adapted MCF-7 Breast Cancer Cells: Impact of miR-1972 on Gene Expression, Proliferation and Migration

 ,
, 
Abstract
:
1. Introduction
2. Materials and Methods
2.1. Cell Cultures and Treatment
2.2. miRNA Extraction and Analysis
2.3. Gene Expression Analysis
2.4. Transfection with miRNA Mimics and Plasmids
2.5. Western Blots
2.6. Proliferation Assays
2.7. Scratch Assays
2.8. Target Prediction and Enrichment Analysis
2.9. Statistics
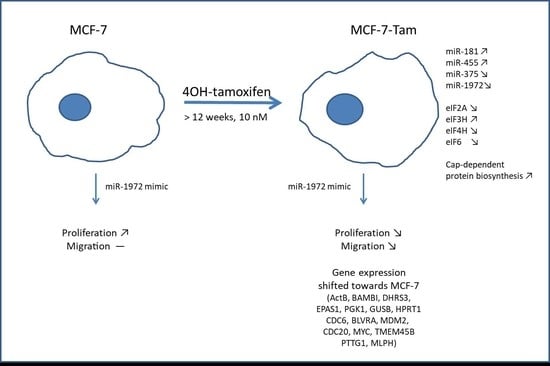
3. Results
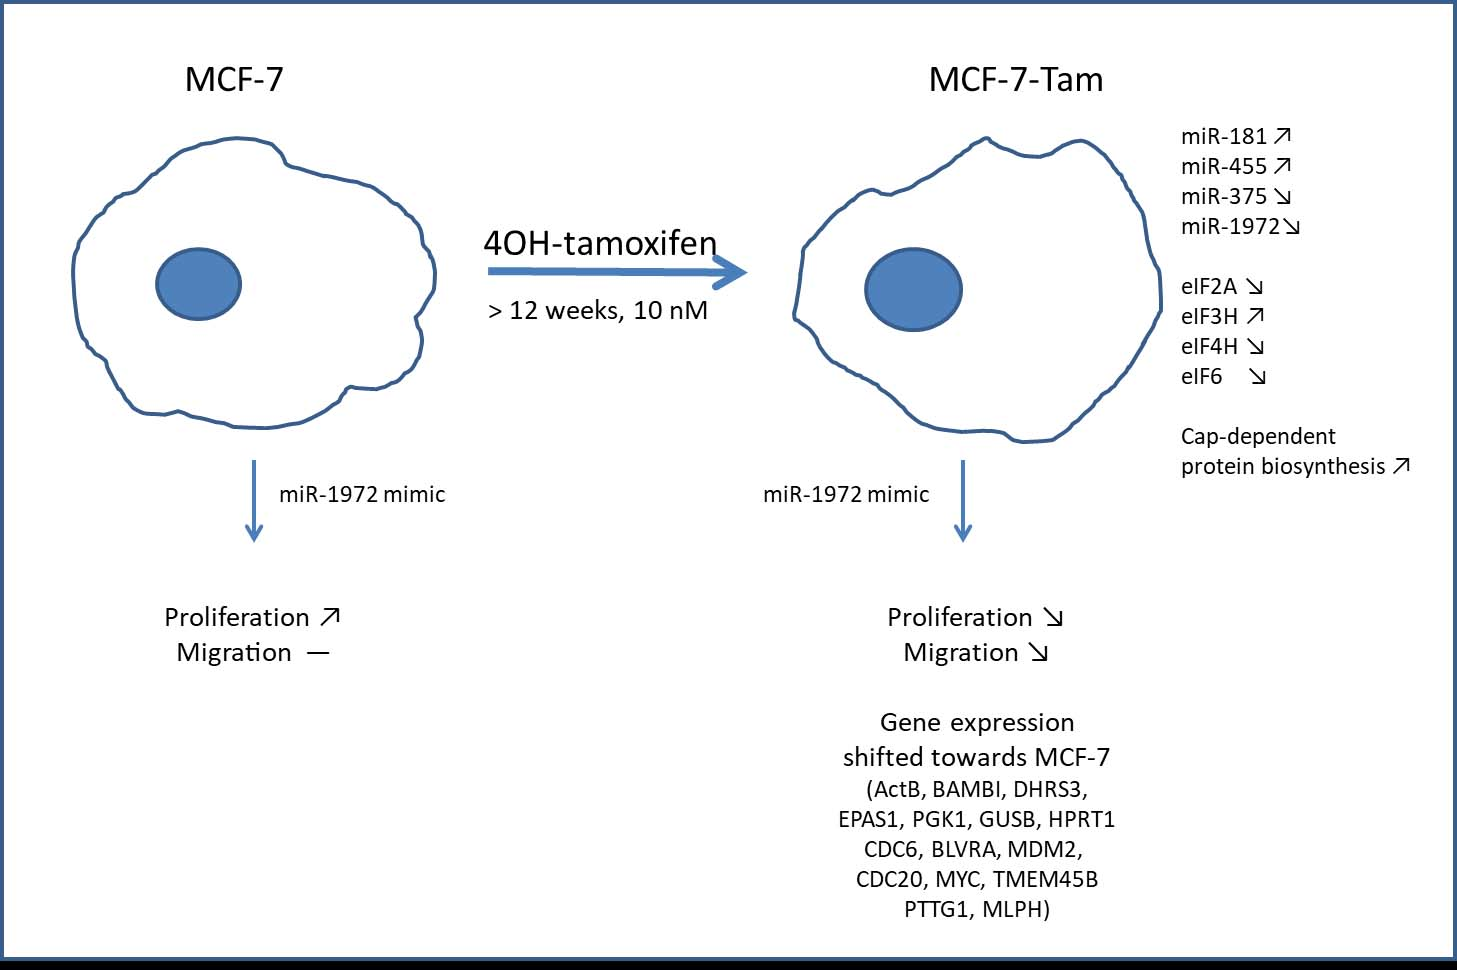
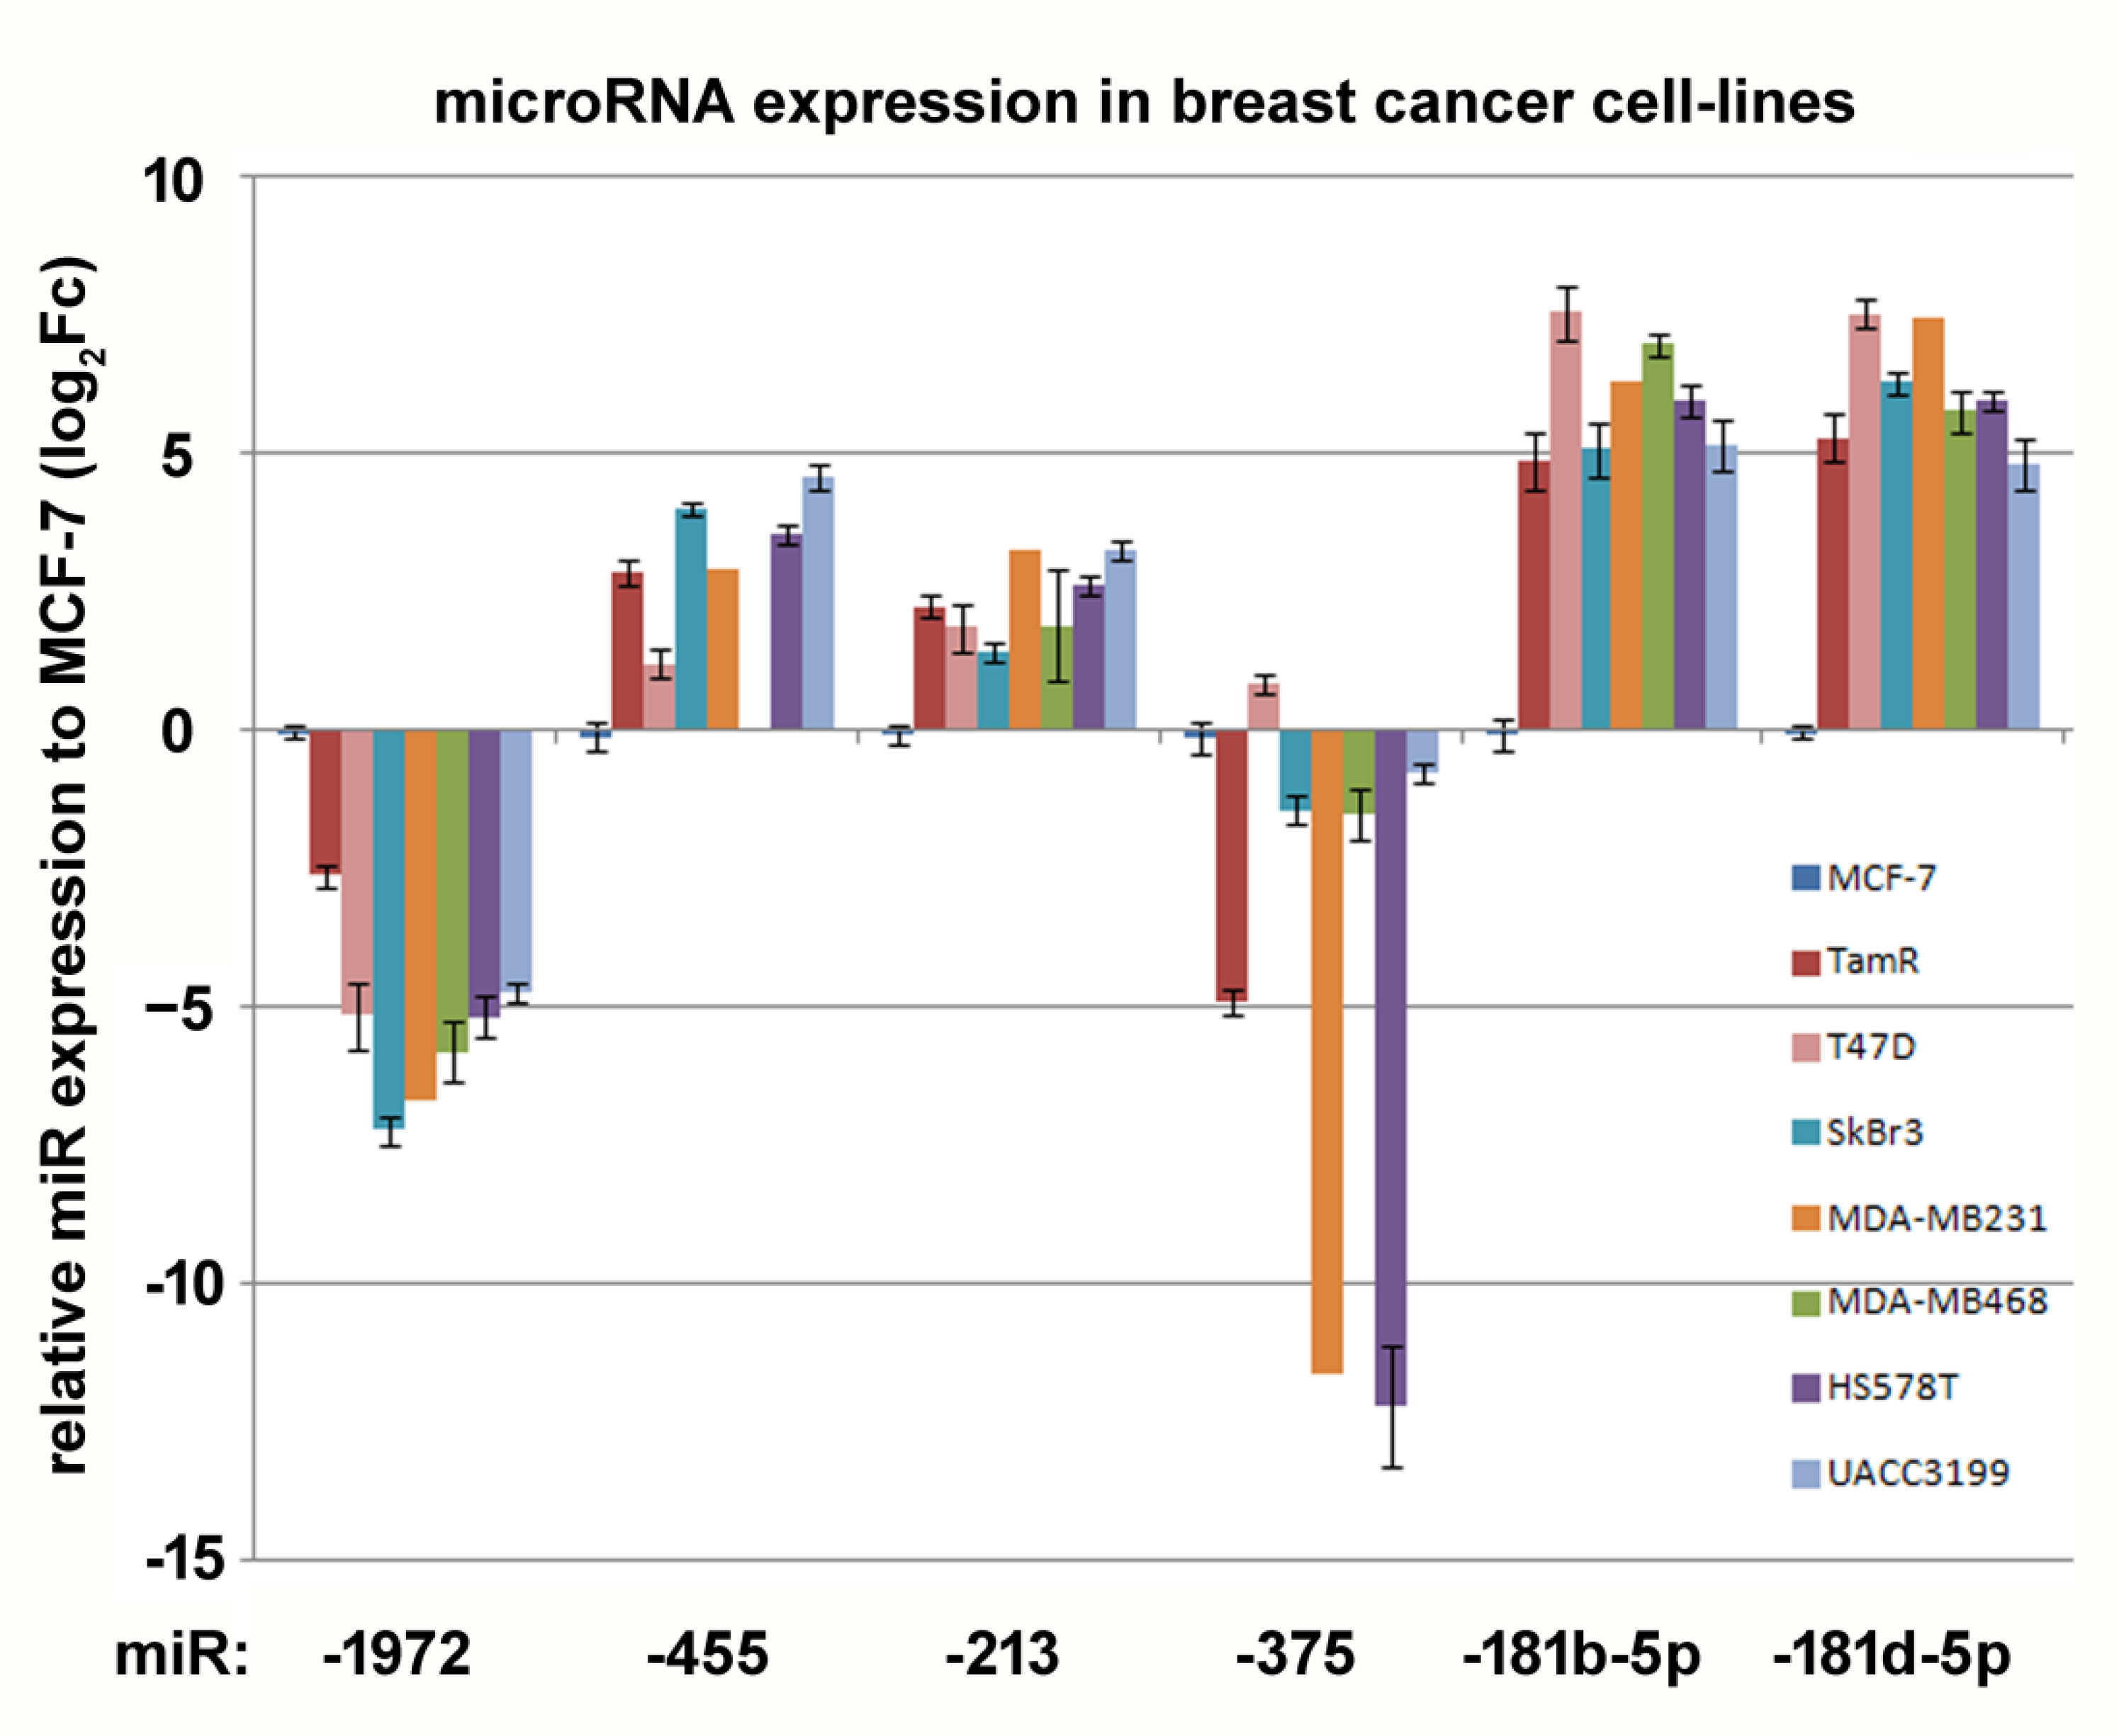
3.1. miRNAs Regulated by Tamoxifen Adaption
3.2. Prognostic Impact of Tamoxifen-Regulated micro RNAs
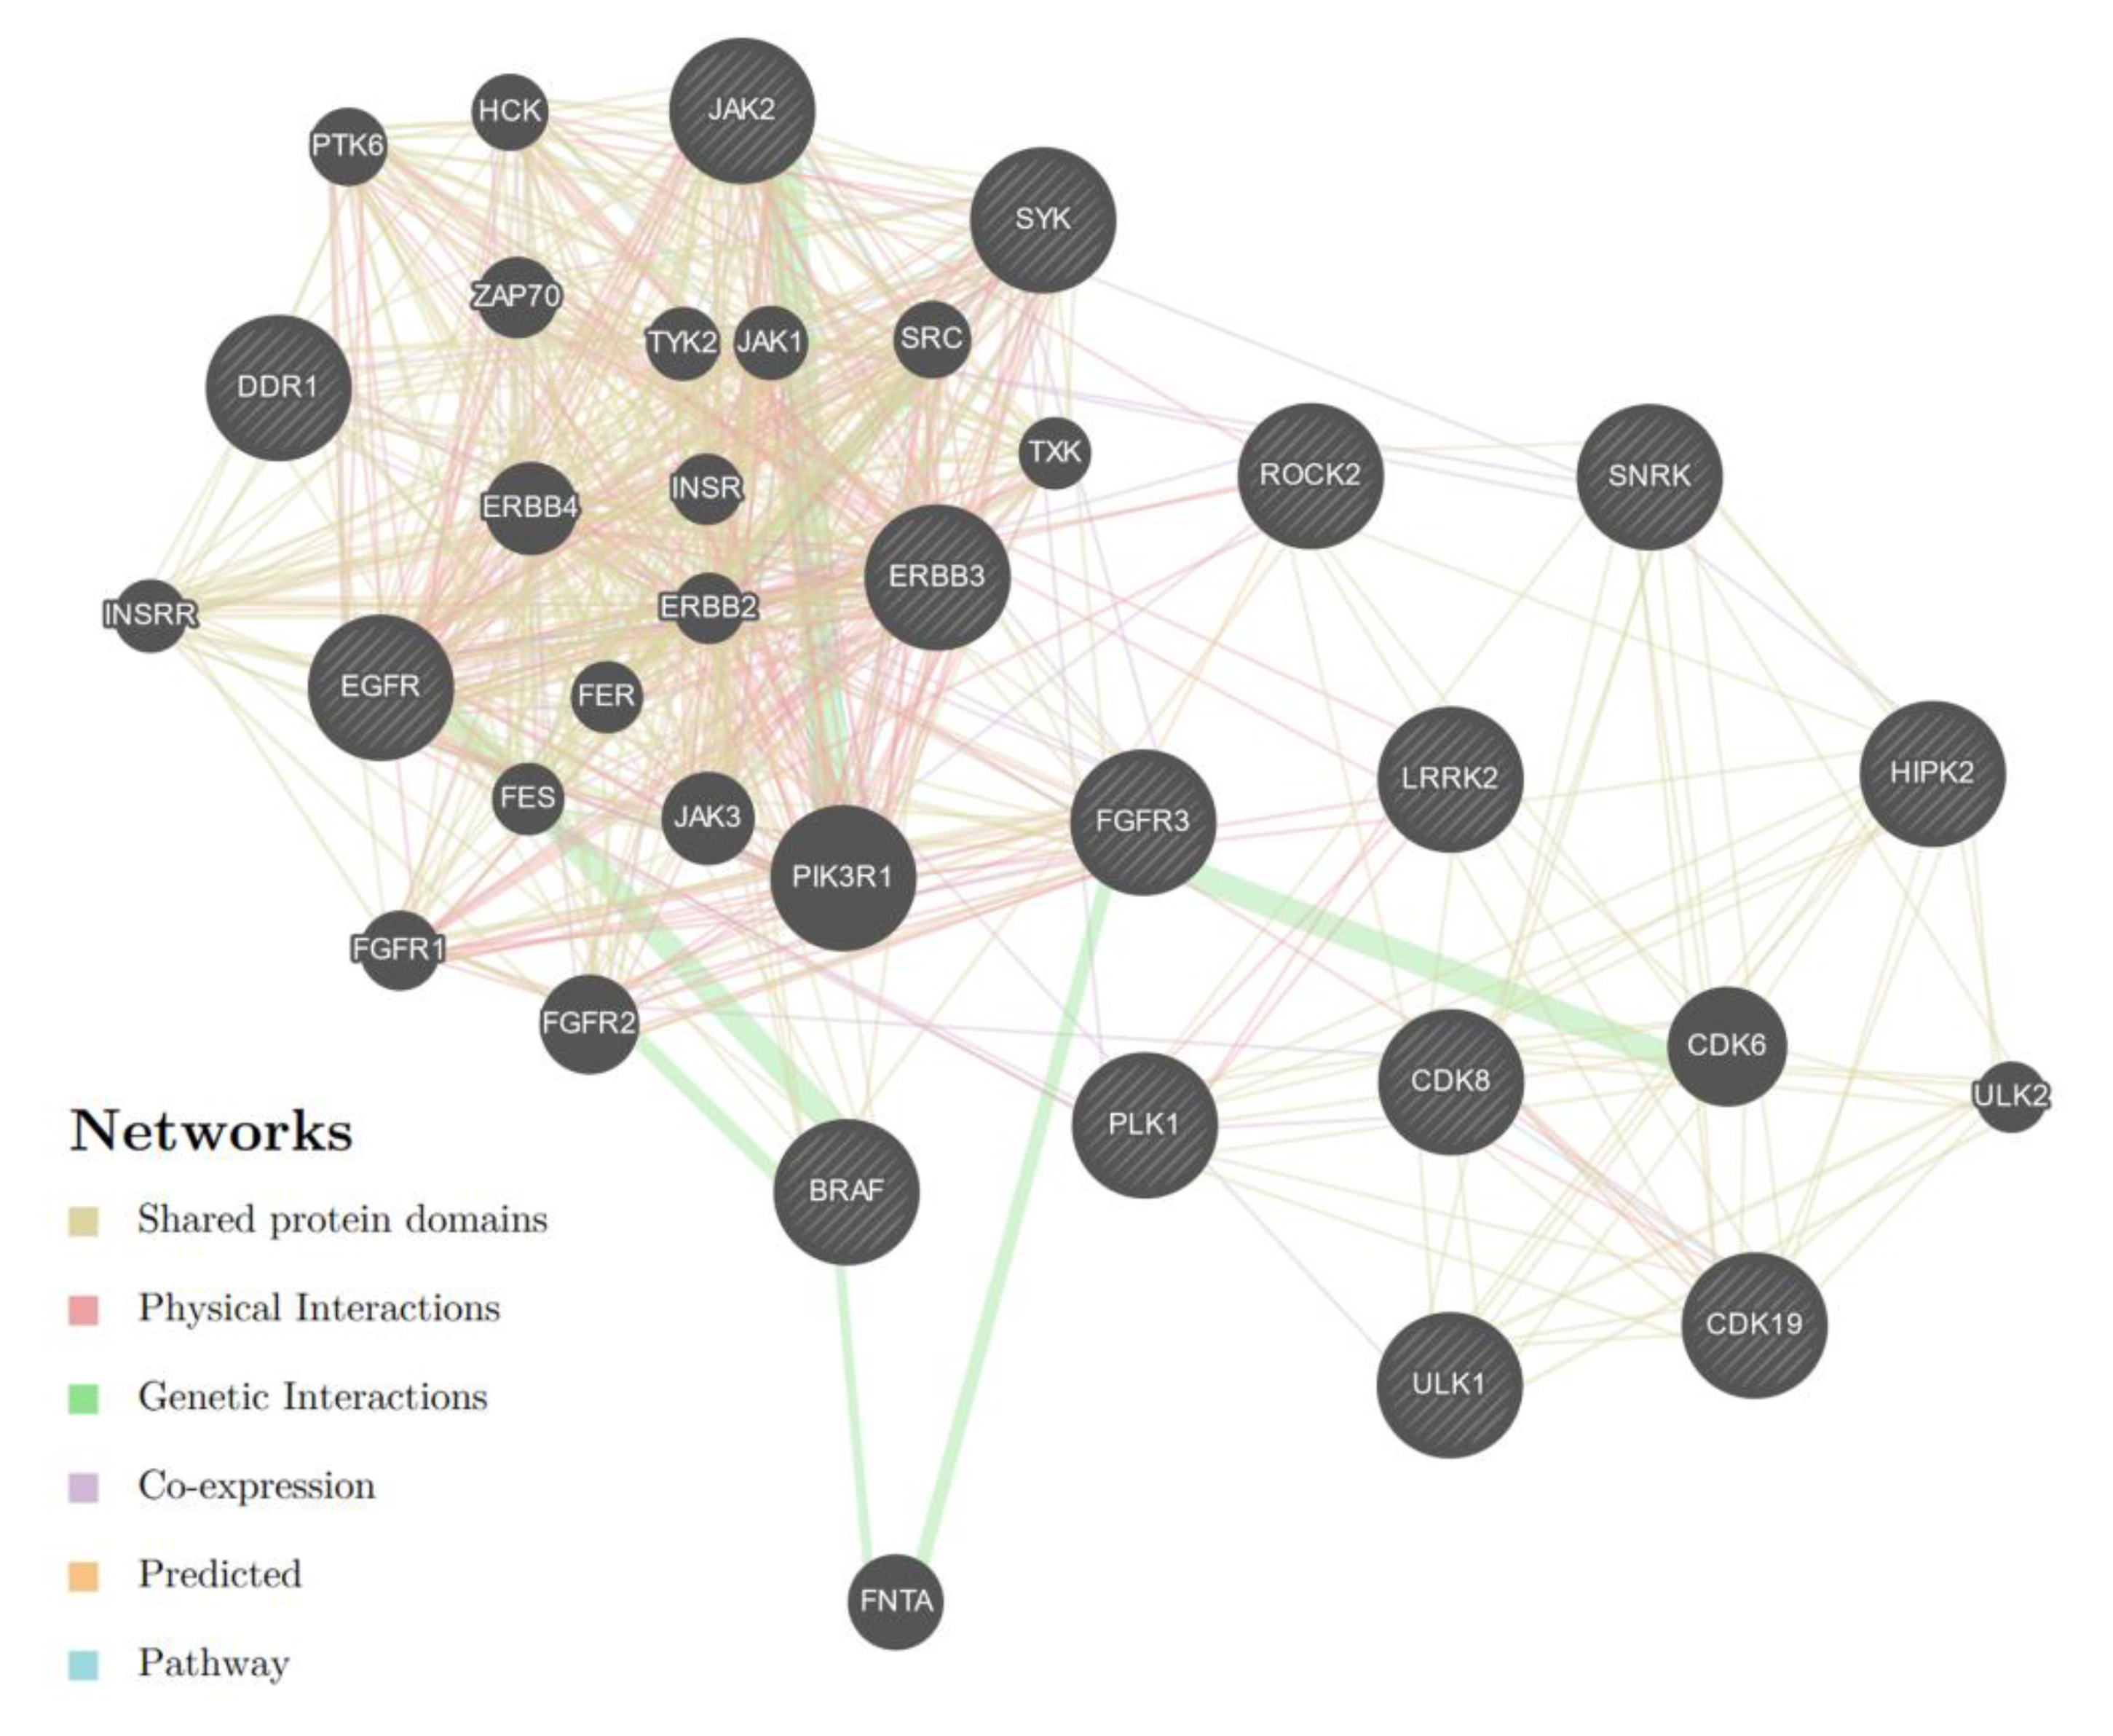
3.3. Evaluation of MicroRNA—mRNA Correlations and Enrichment Analysis
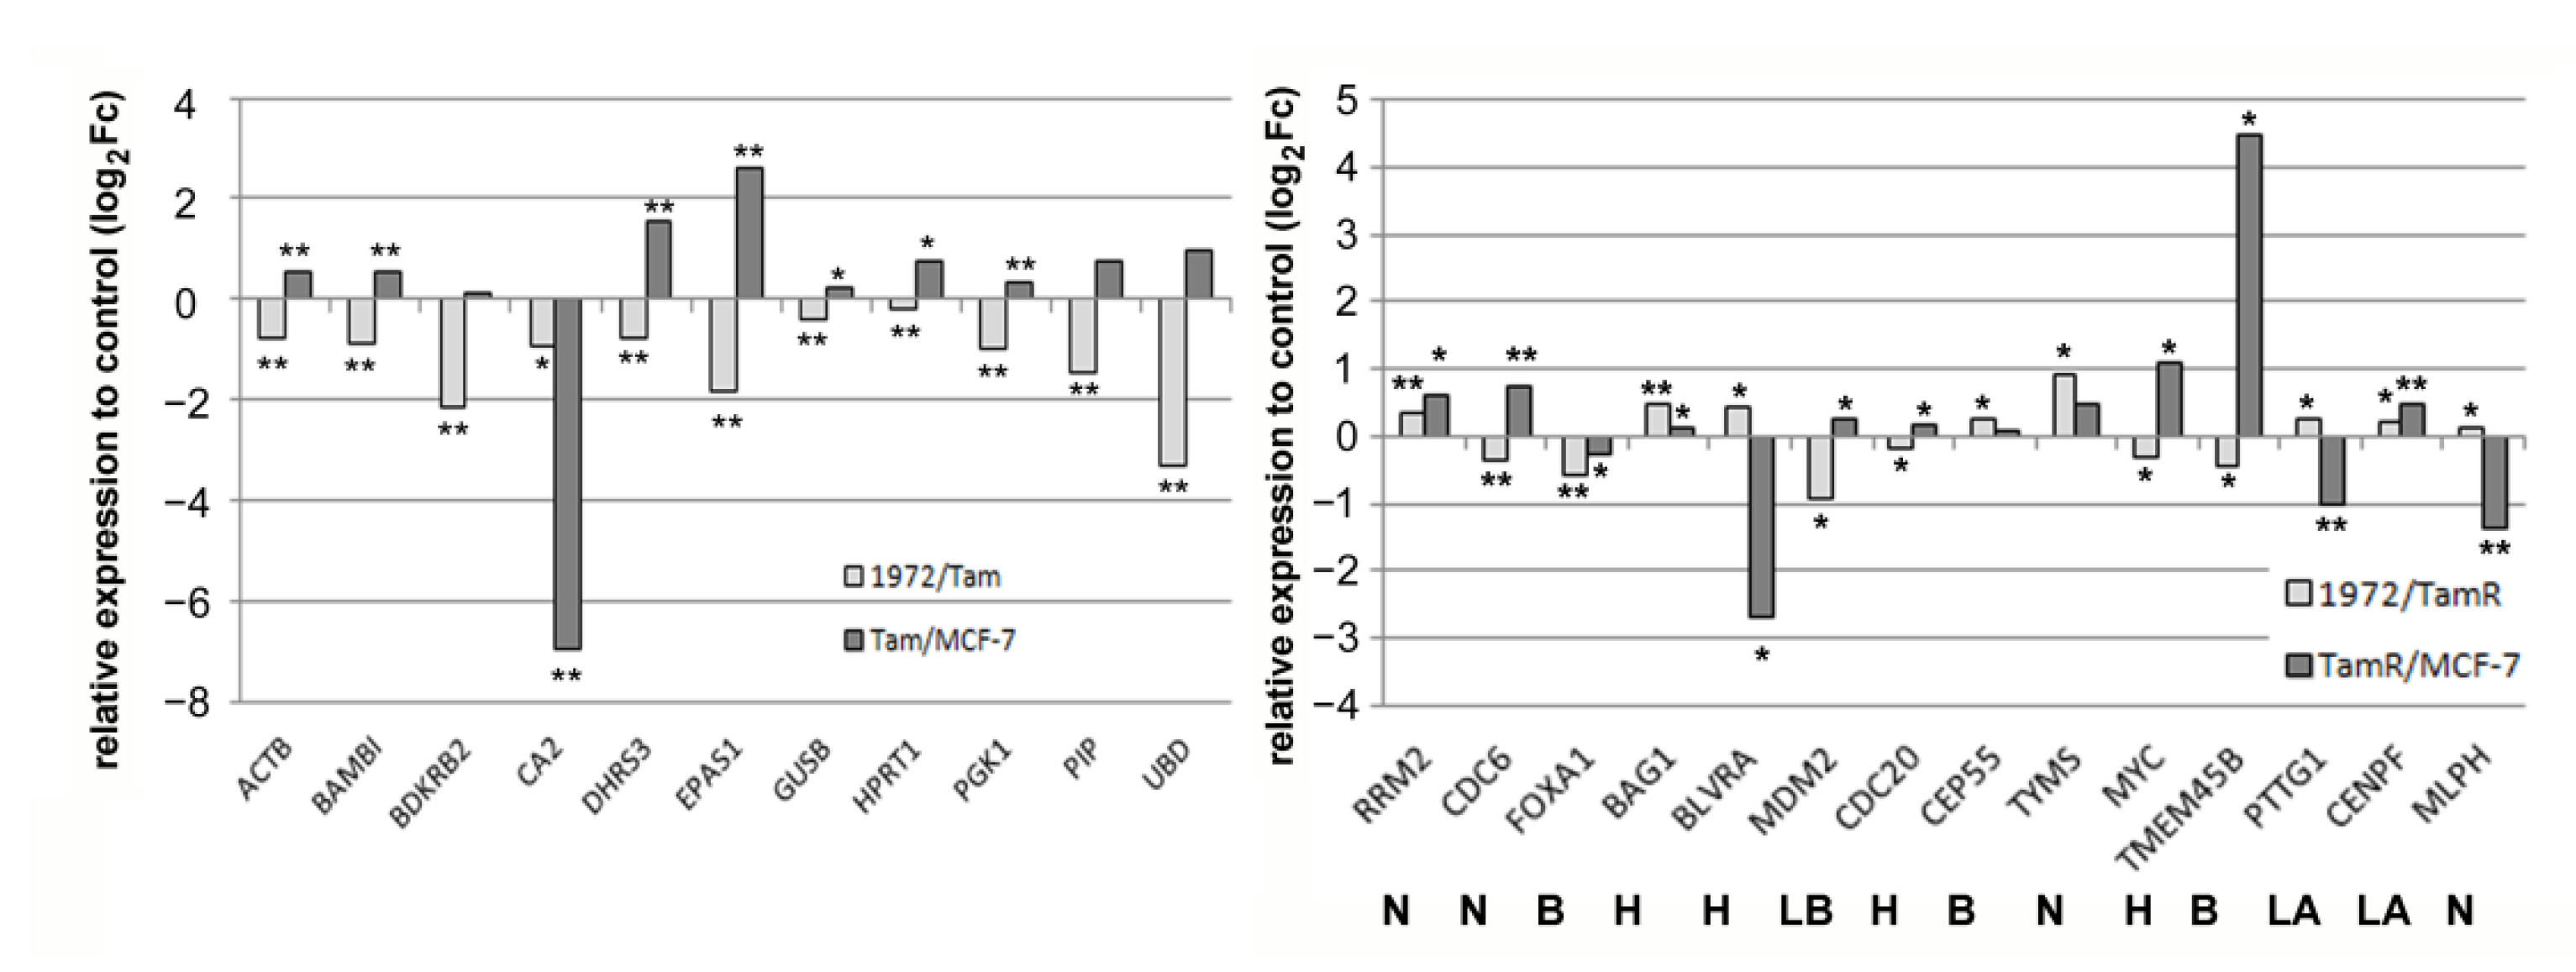
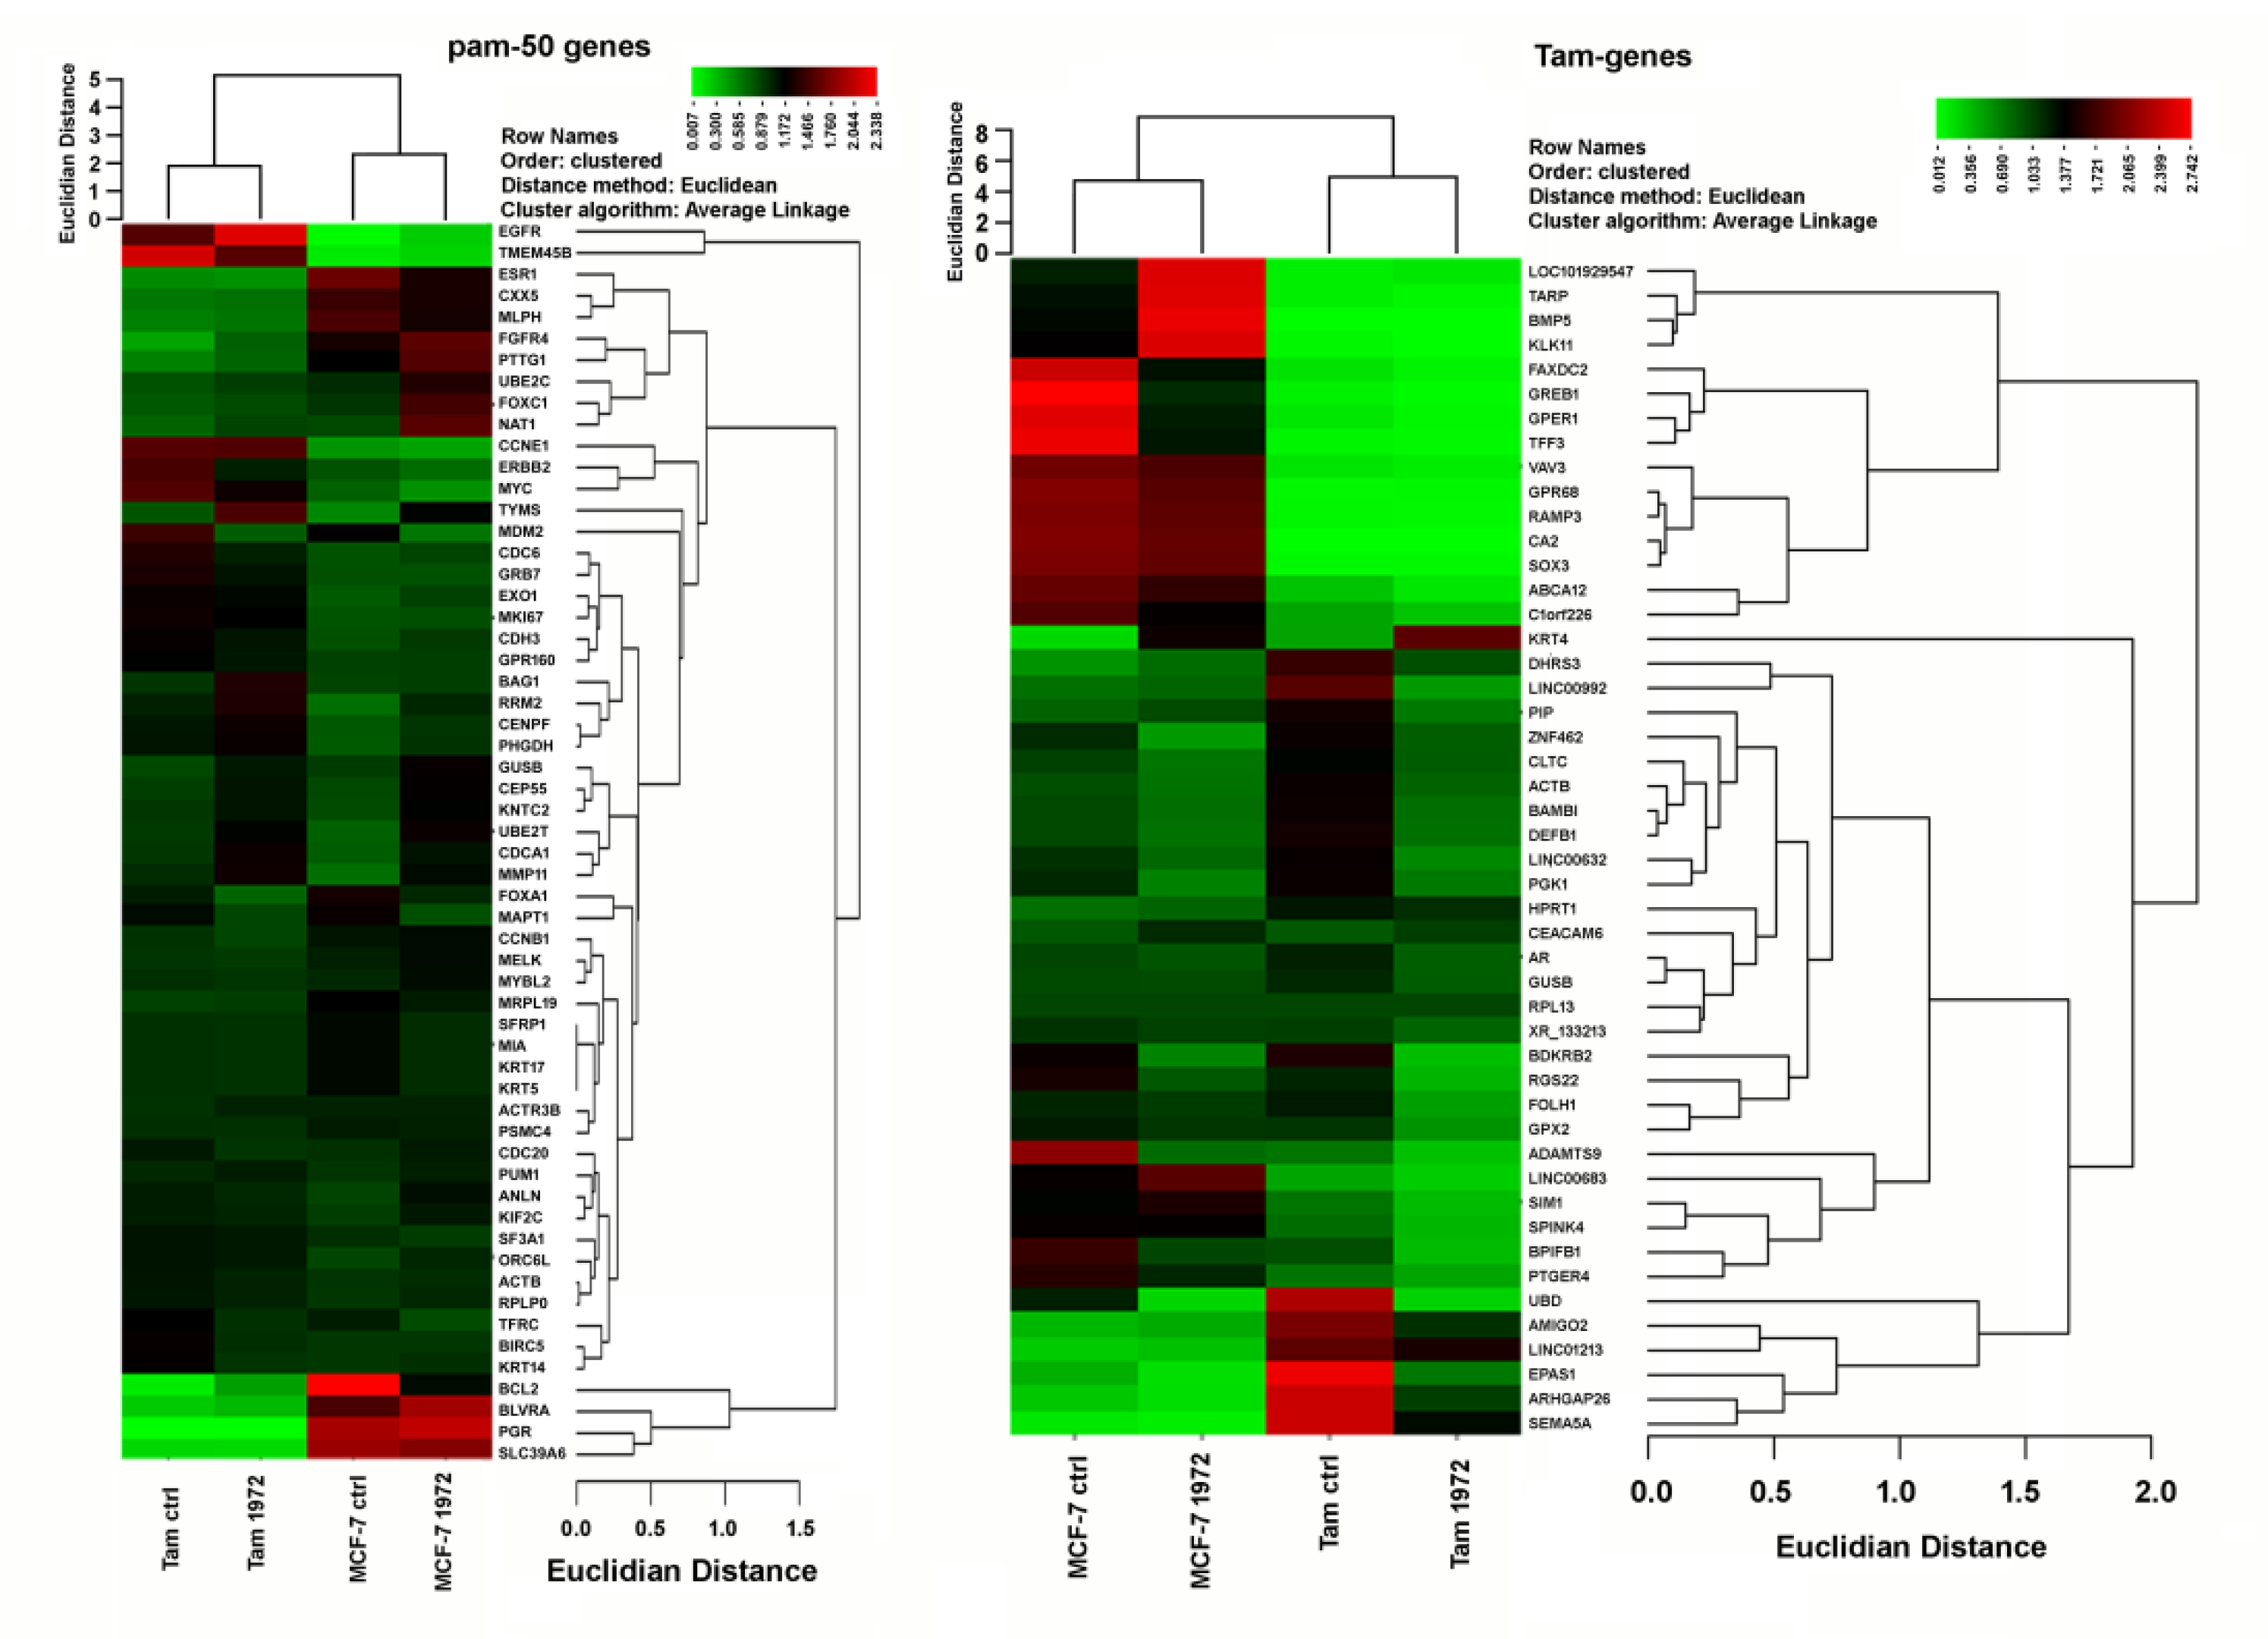
3.4. A miR-1972 Mimic Effects Gene Expression
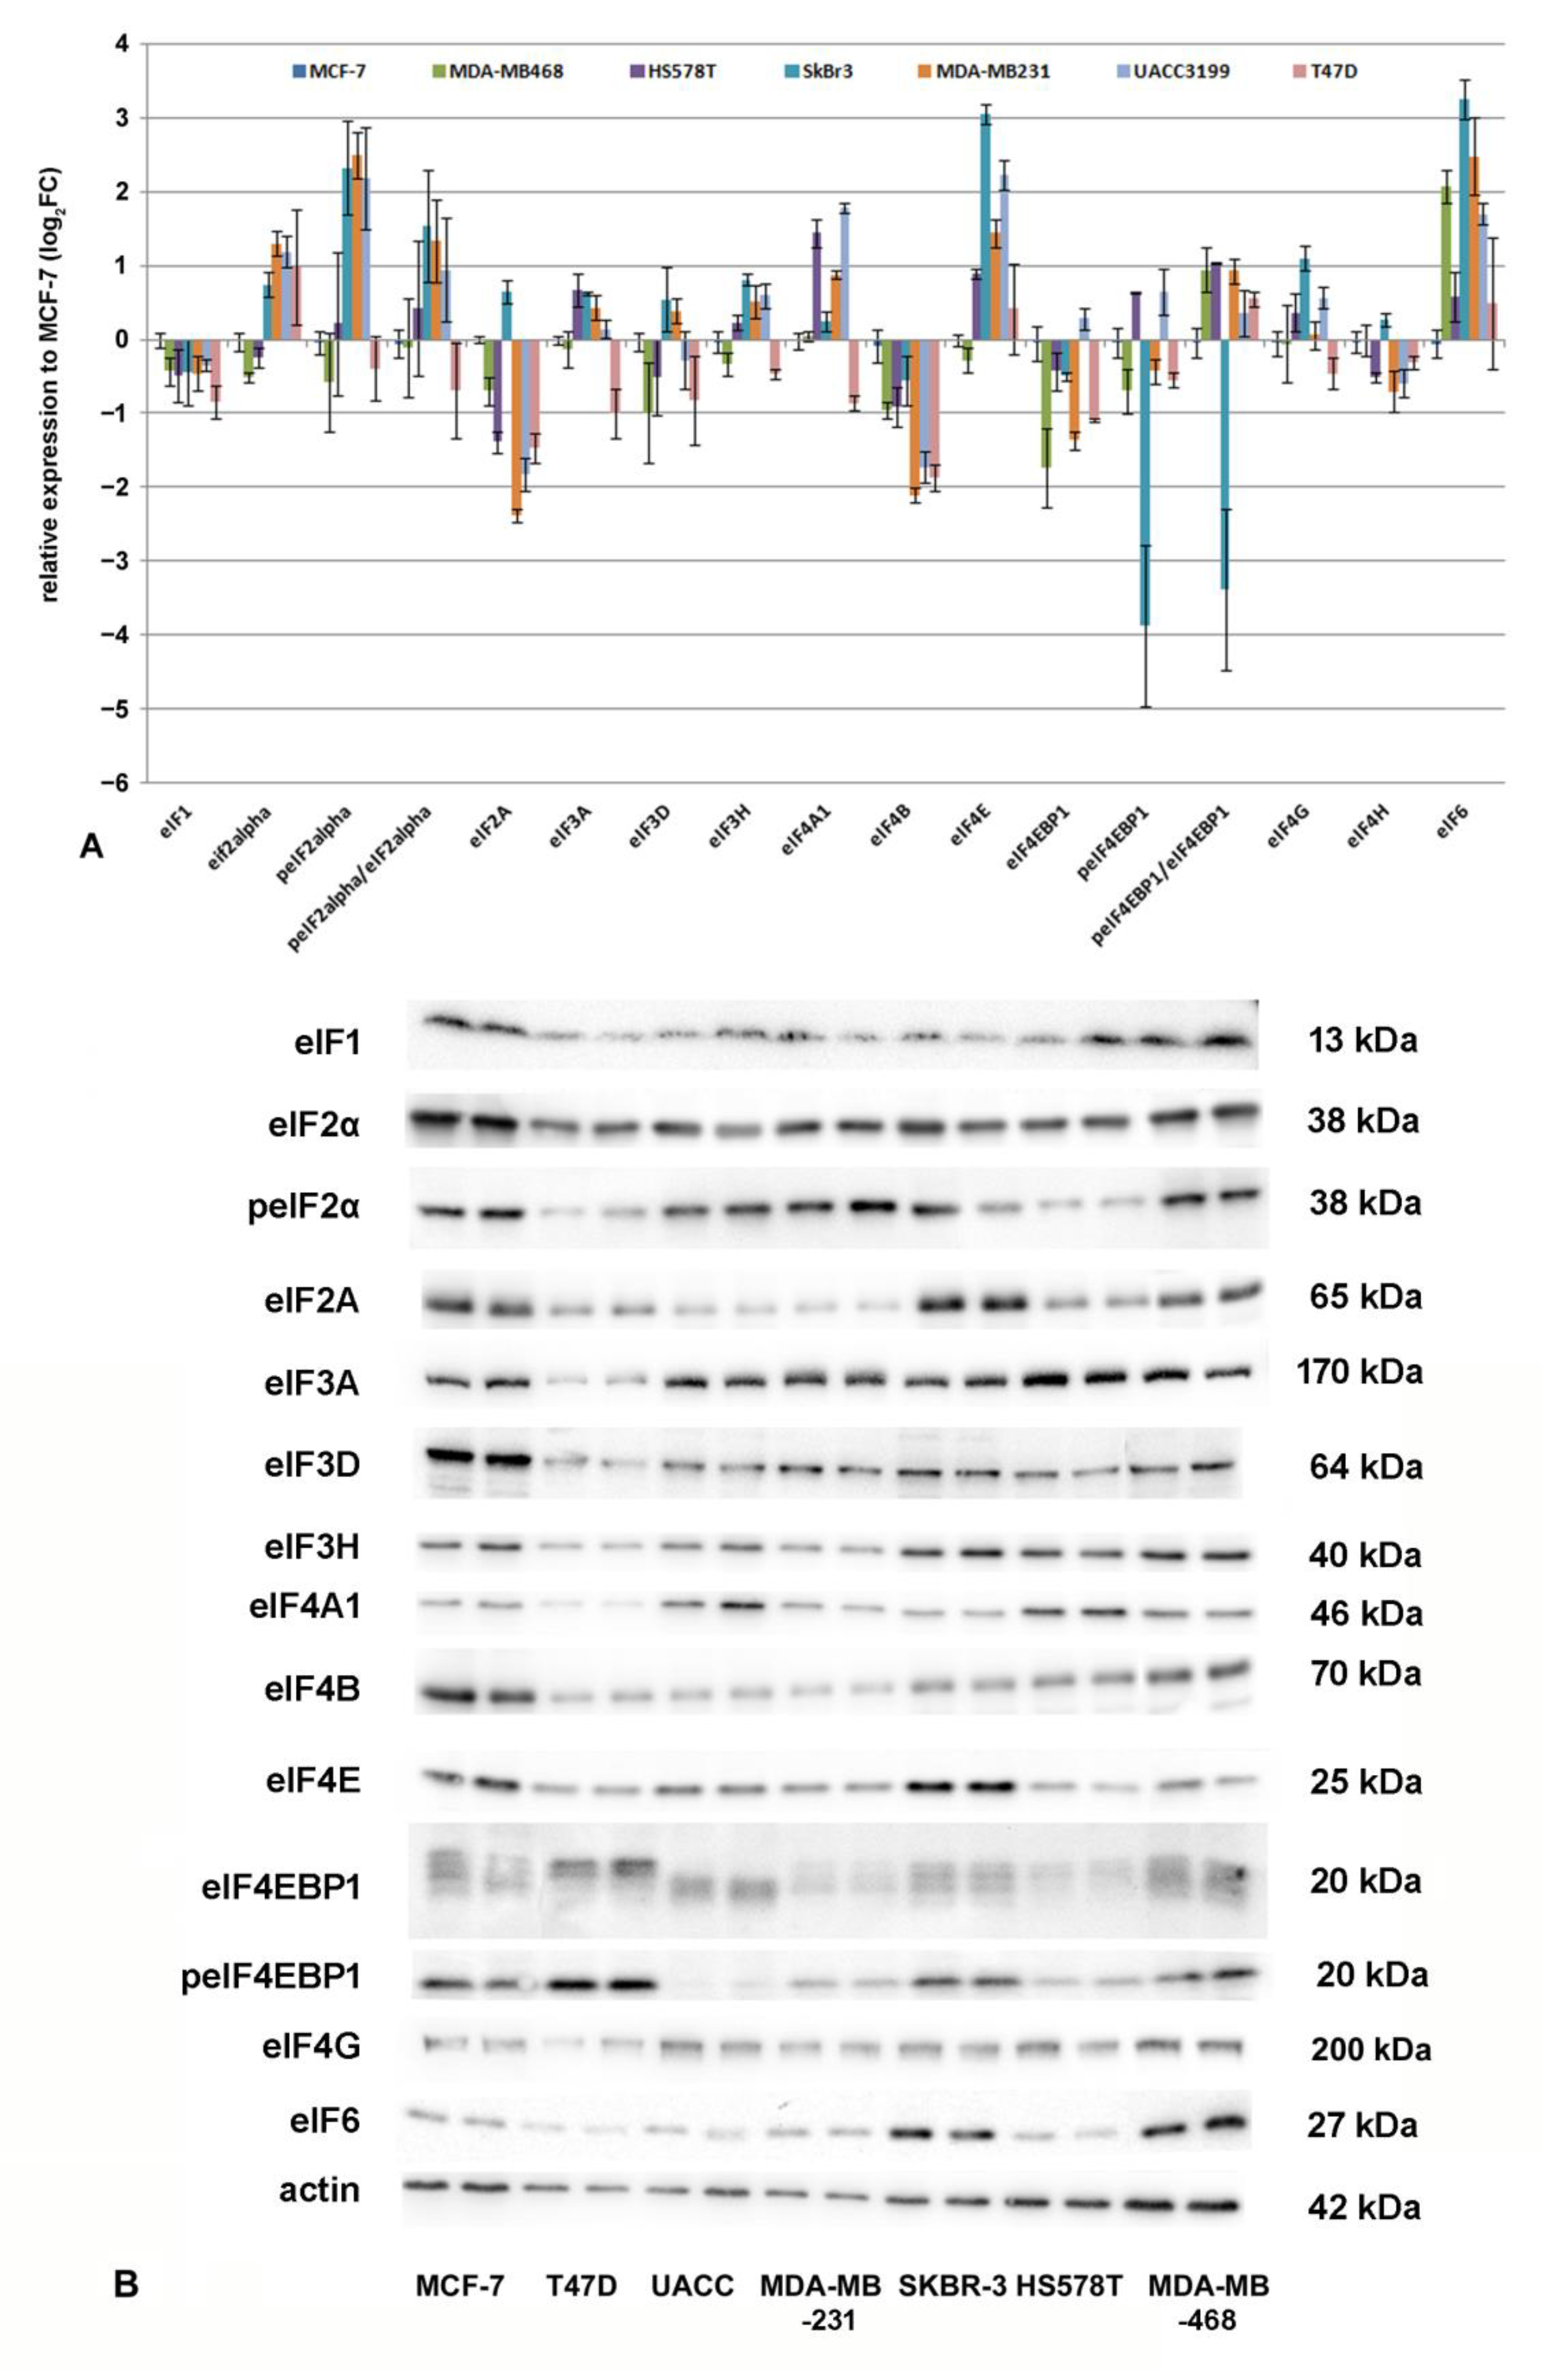
3.5. Protein Translation Initiation and eIF-Expression in Breast Cancer Cell Lines
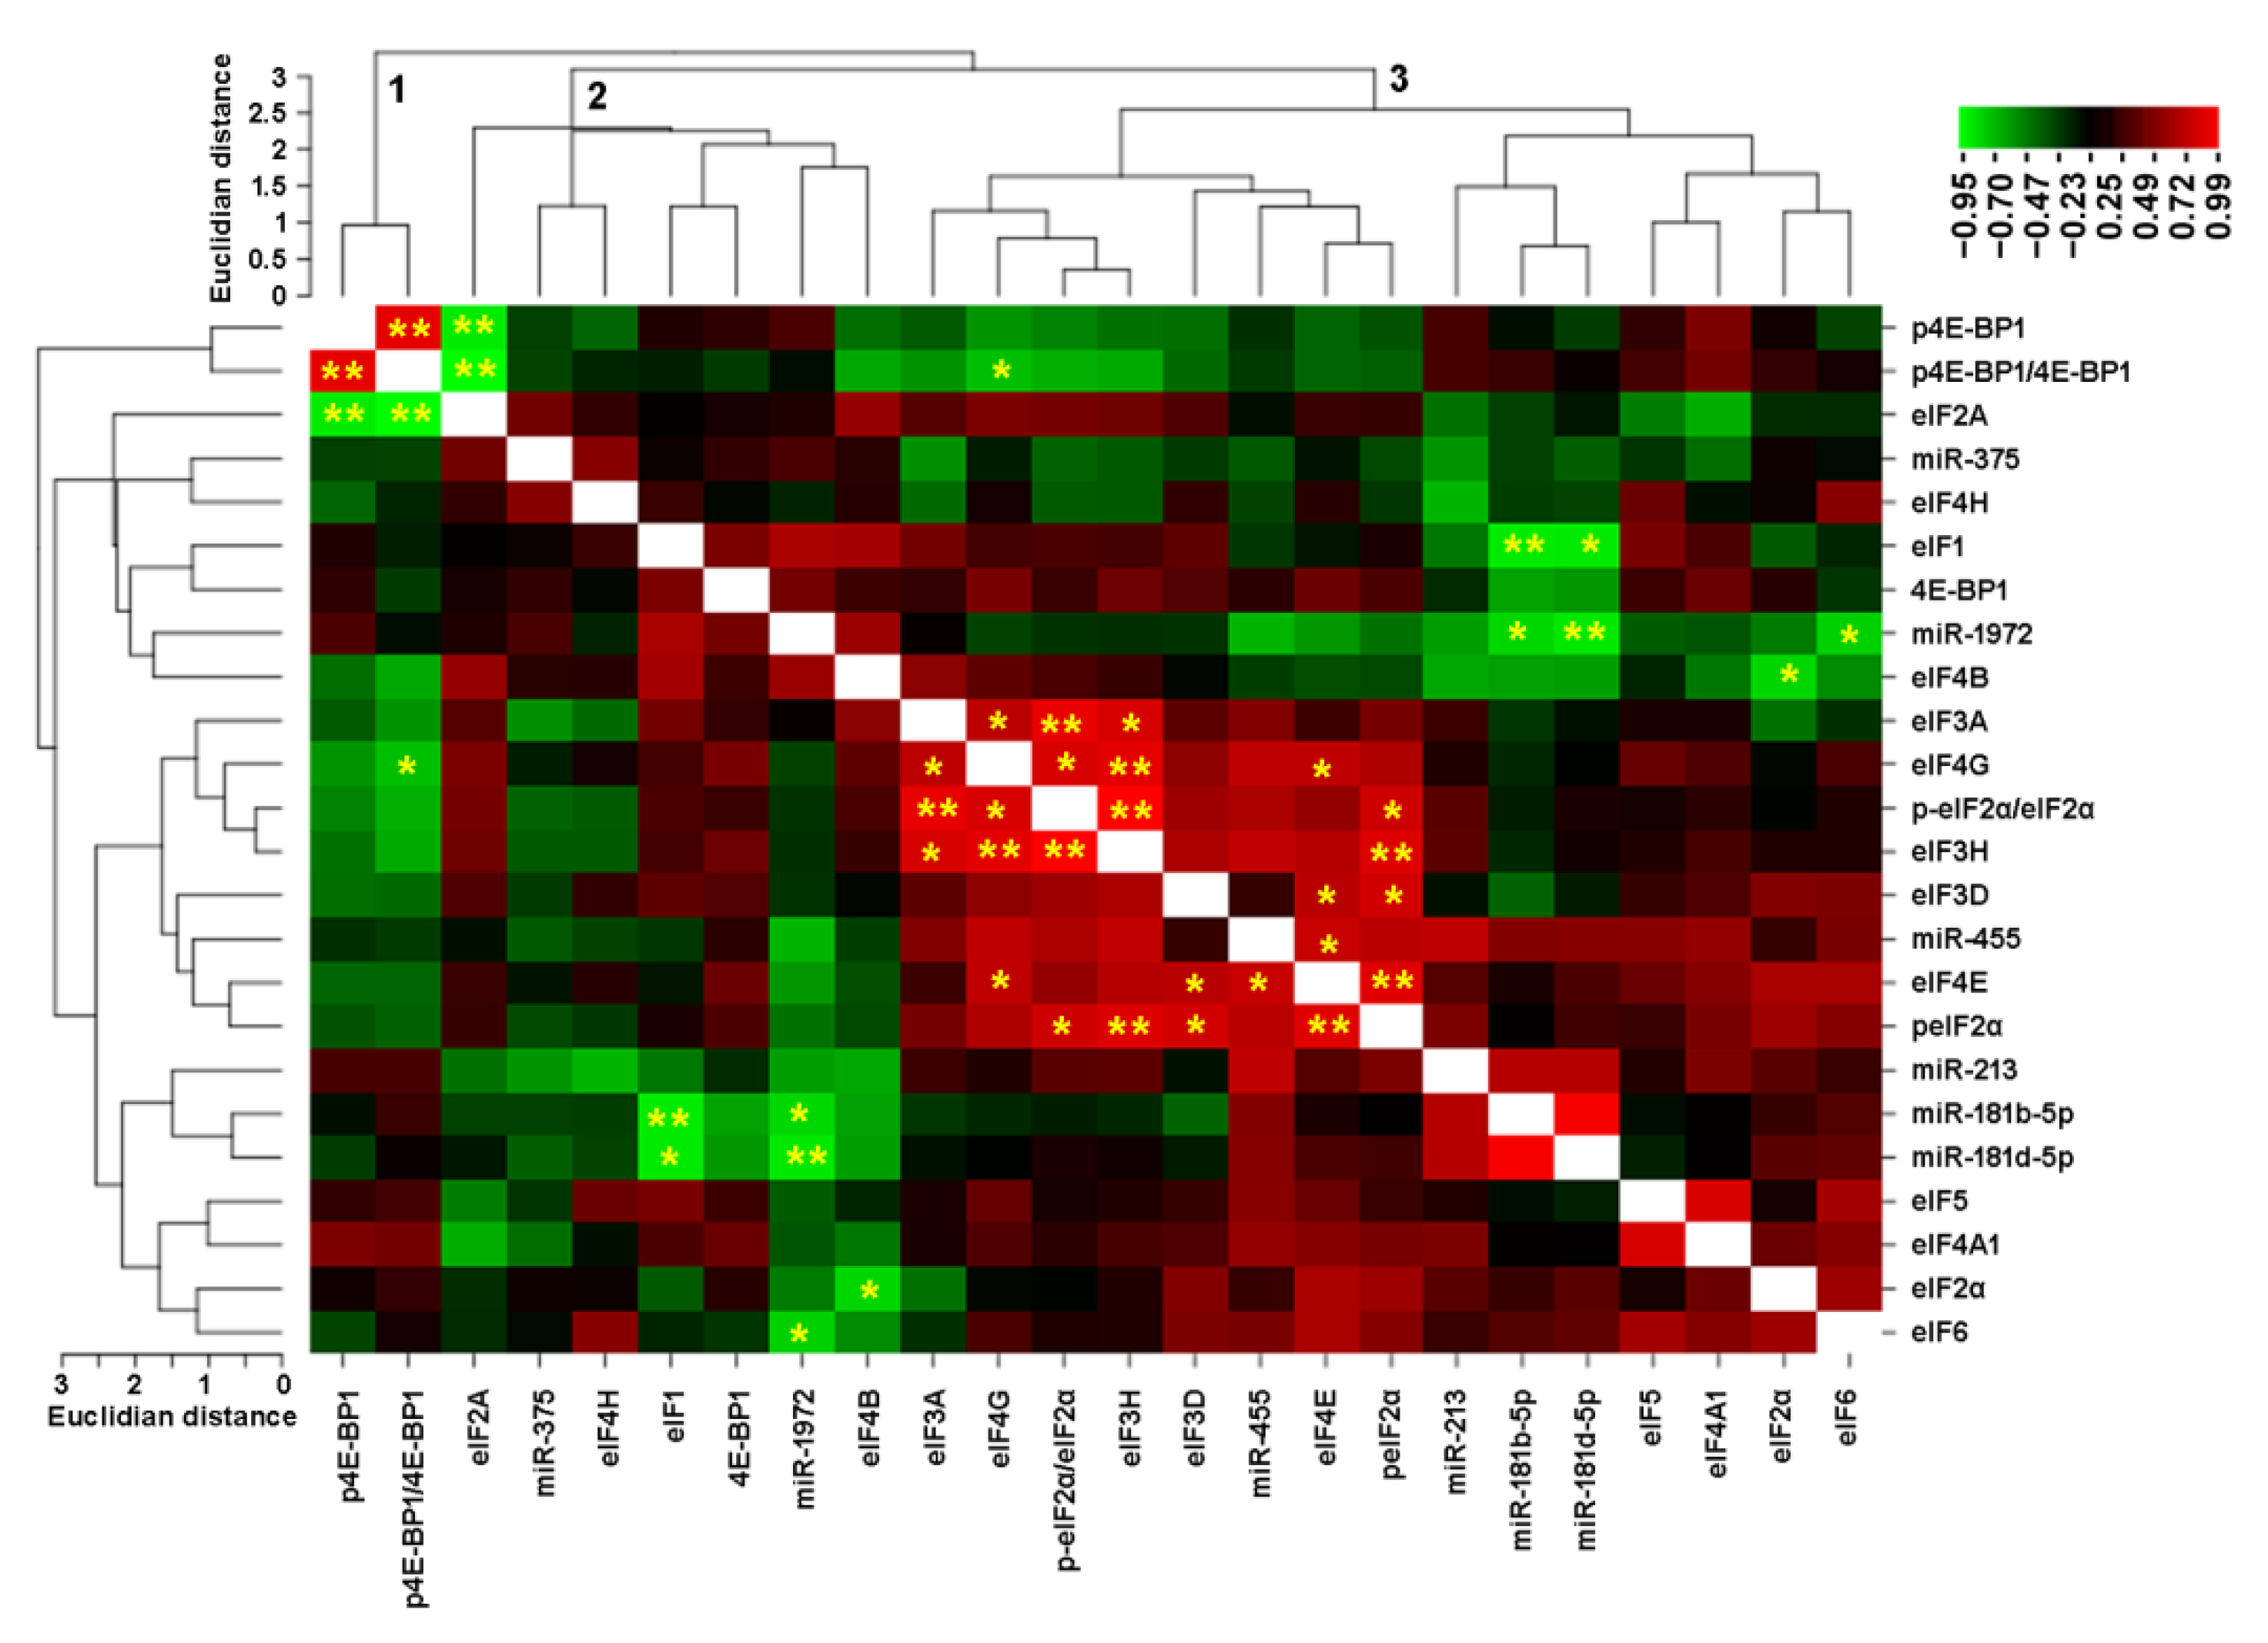
3.6. Correlation Analysis for eIFs and microRNAs in Breast Cancer Cell Lines
3.7. Transfections Using the miR-1972 Mimic
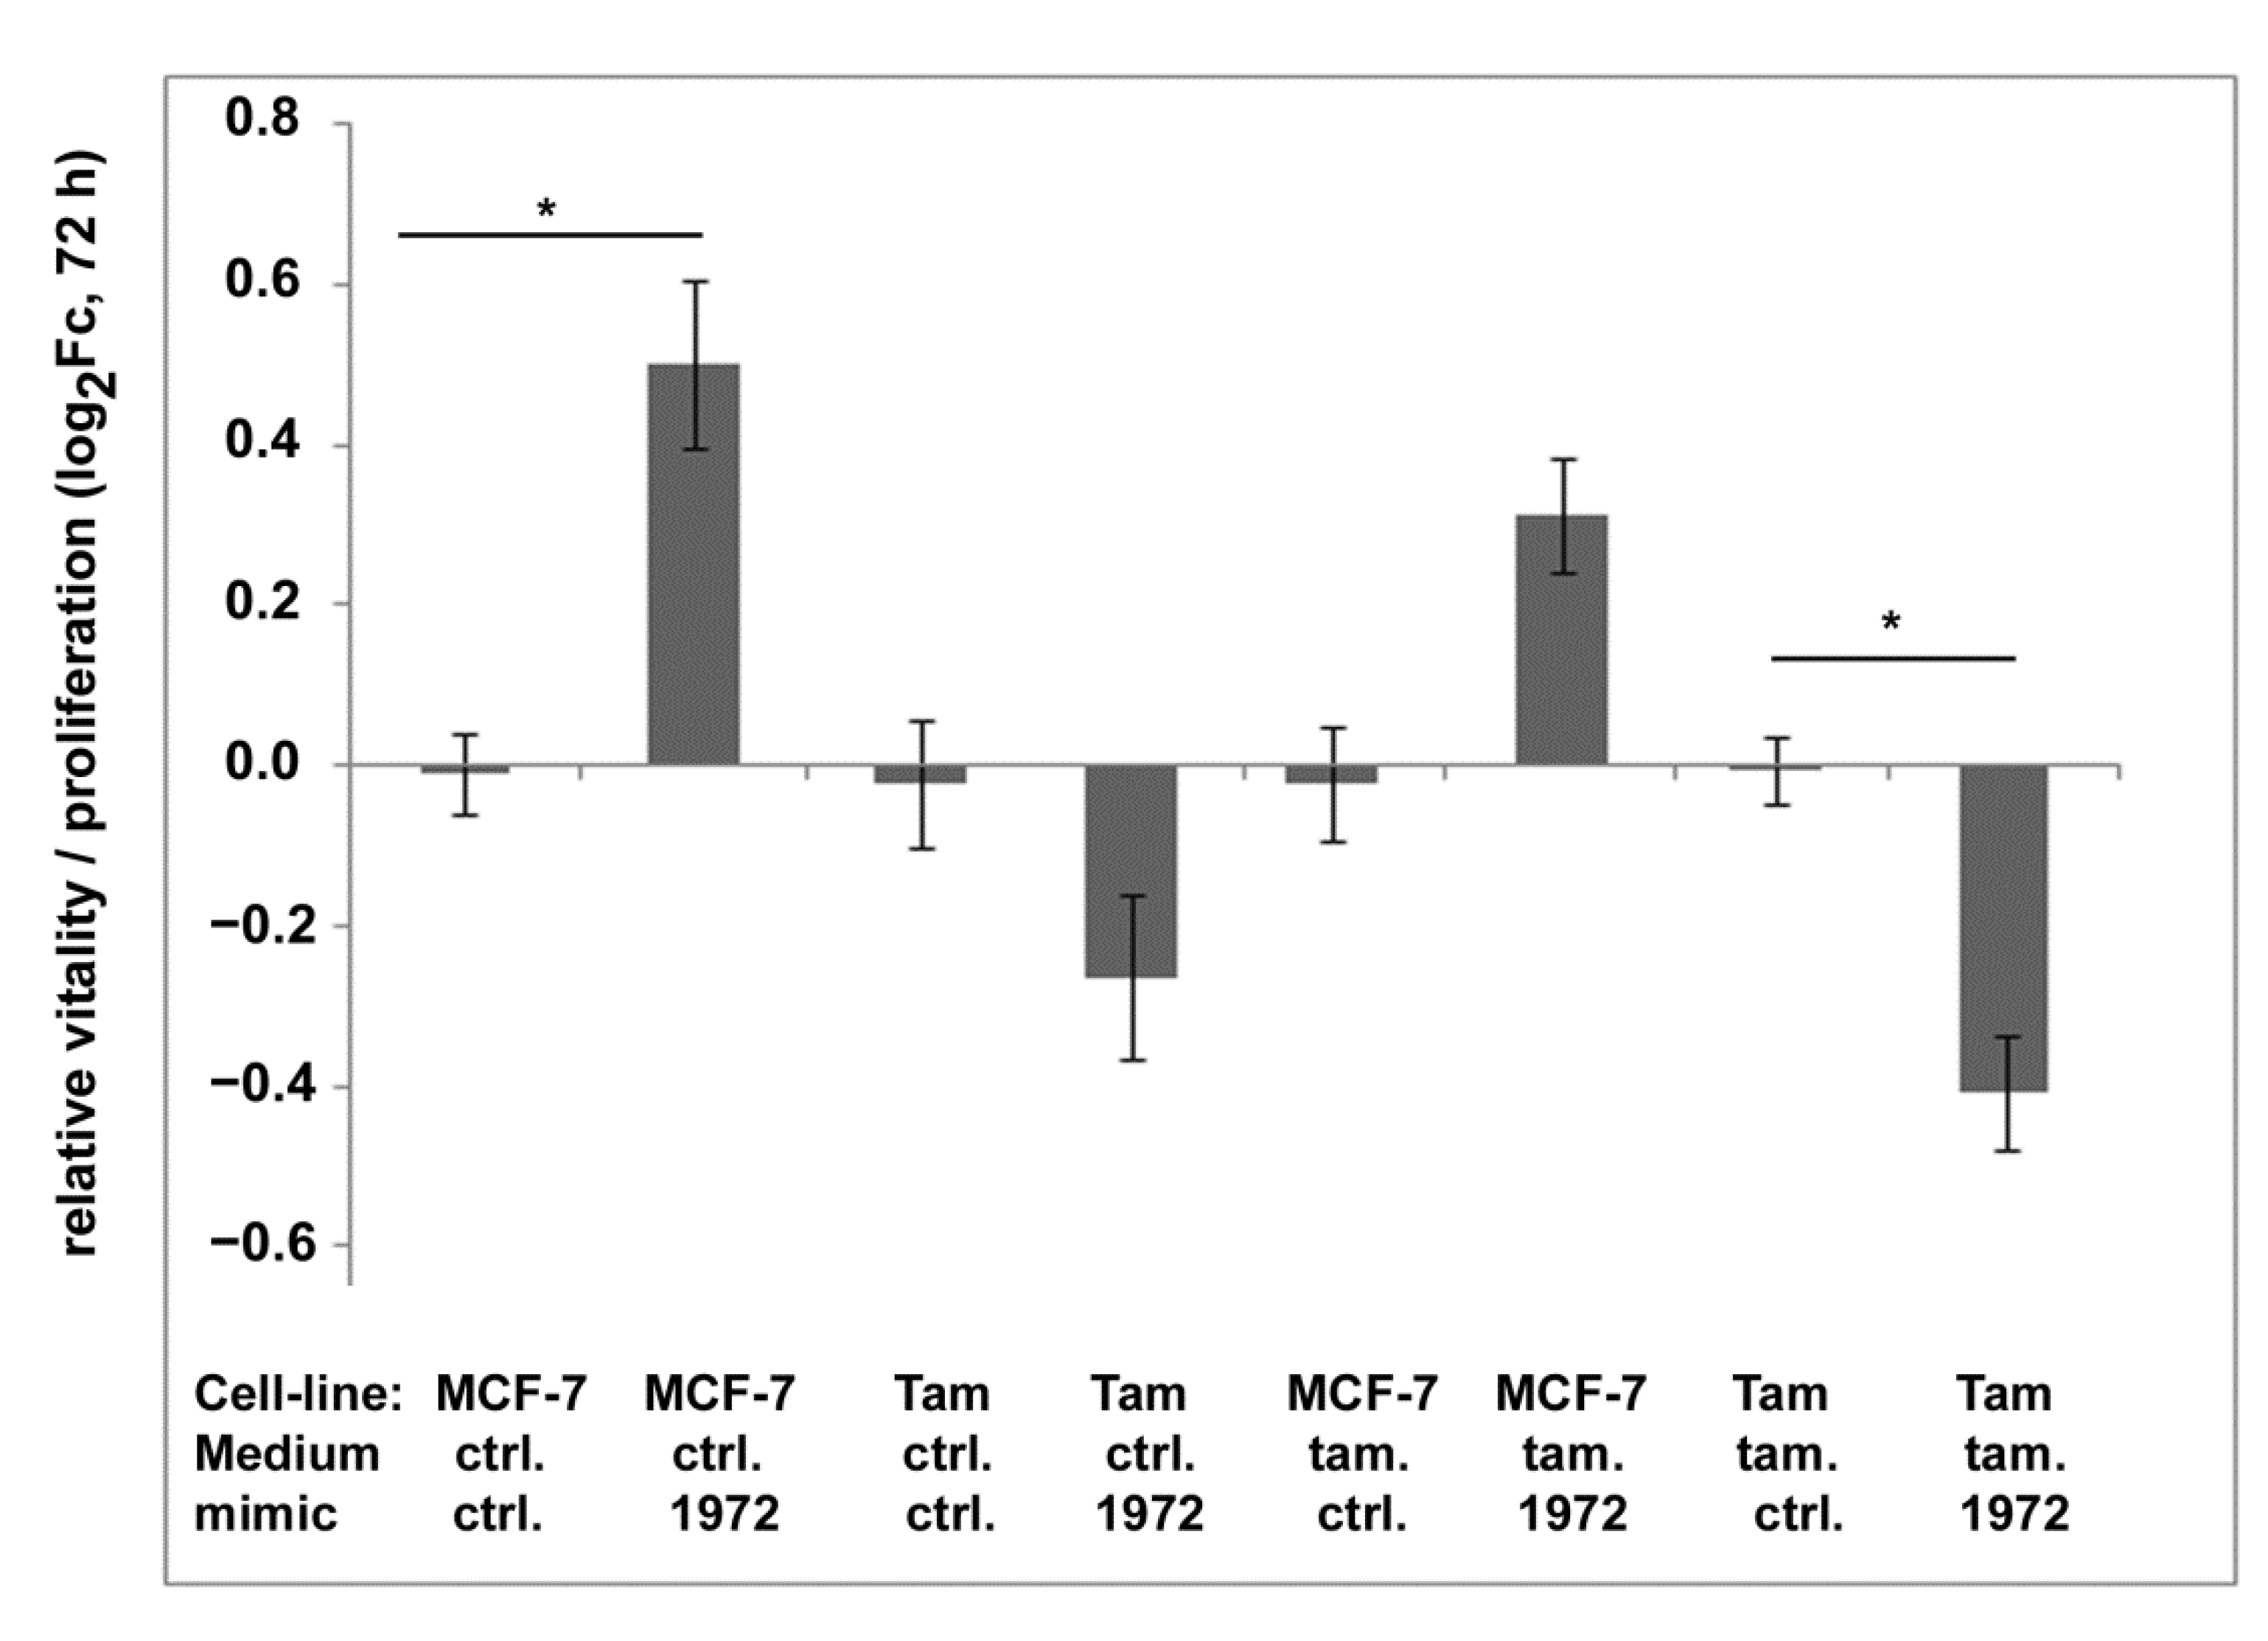
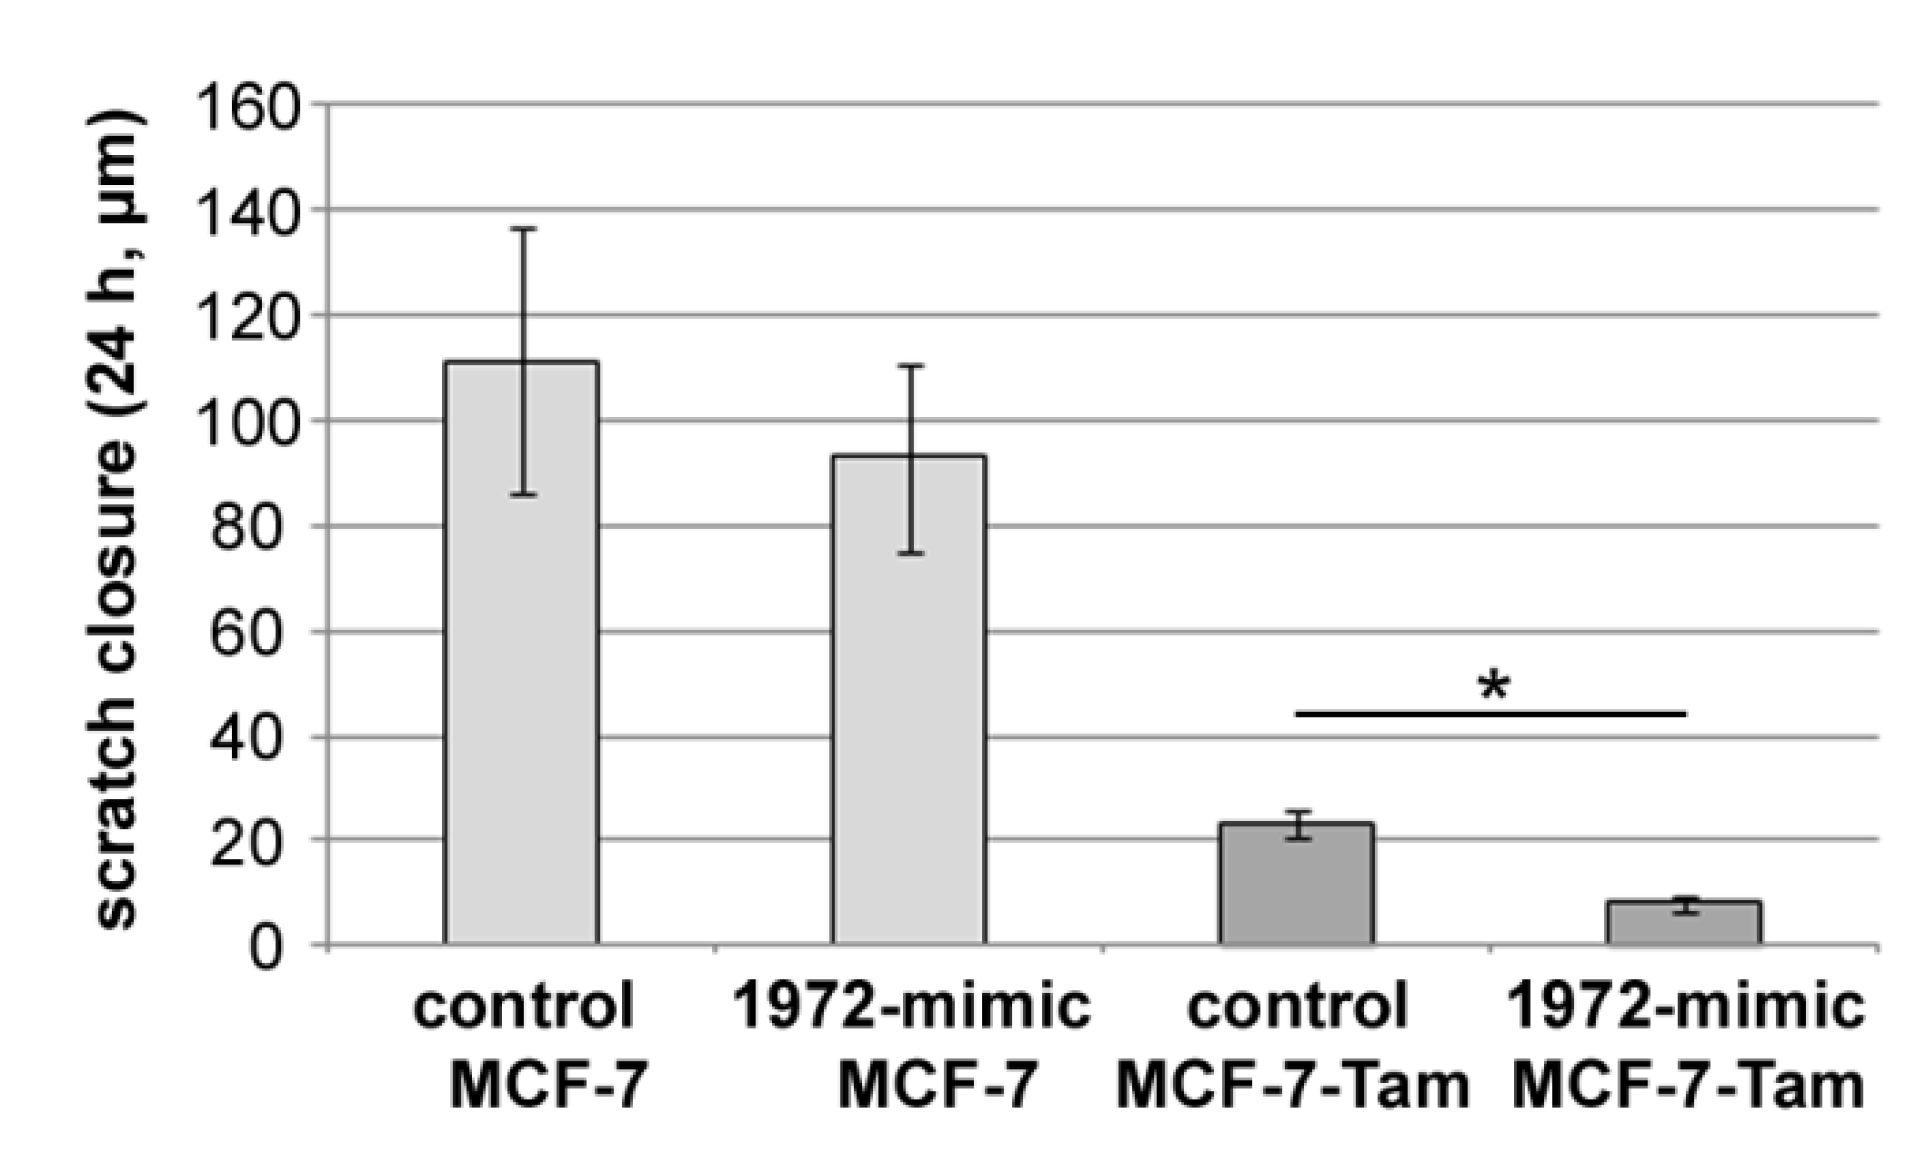
3.8. Effect of the miR1972-Mimic on Proliferation and Migration
4. Discussion
5. Conclusions
Supplementary Materials
Author Contributions
Funding
Institutional Review Board Statement
Informed Consent Statement
Data Availability Statement
Acknowledgments
Conflicts of Interest
References
- Ahmad, A. Breast Cancer Statistics: Recent Trends. Adv. Exp. Med. Biol. 2019, 1152, 1–7. [Google Scholar] [CrossRef]
- Hennigs, A.; Riedel, F.; Gondos, A.; Sinn, P.; Schirmacher, P.; Marmé, F.; Jäger, D.; Kauczor, H.-U.; Stieber, A.; Lindel, K.; et al. Prognosis of Breast Cancer Molecular Subtypes in Routine Clinical Care: A Large Prospective Cohort Study. BMC Cancer 2016, 16, 734. [Google Scholar] [CrossRef] [Green Version]
- Yersal, O.; Barutca, S. Biological Subtypes of Breast Cancer: Prognostic and Therapeutic Implications. World J. Clin. Oncol. 2014, 5, 412–424. [Google Scholar] [CrossRef]
- Dai, X.; Li, T.; Bai, Z.; Yang, Y.; Liu, X.; Zhan, J.; Shi, B. Breast Cancer Intrinsic Subtype Classification, Clinical Use and Future Trends. Am. J. Cancer Res. 2015, 5, 2929–2943. [Google Scholar] [PubMed]
- Lehmann, B.D.; Jovanović, B.; Chen, X.; Estrada, M.V.; Johnson, K.N.; Shyr, Y.; Moses, H.L.; Sanders, M.E.; Pietenpol, J.A. Refinement of Triple-Negative Breast Cancer Molecular Subtypes: Implications for Neoadjuvant Chemotherapy Selection. PLoS ONE 2016, 11, e0157368. [Google Scholar] [CrossRef] [PubMed]
- Manjunath, M.; Choudhary, B. Triple-Negative Breast Cancer: A Run-through of Features, Classification and Current Therapies. Oncol. Lett. 2021, 22, 512. [Google Scholar] [CrossRef] [PubMed]
- Francis, P.A.; Pagani, O.; Fleming, G.F.; Walley, B.A.; Colleoni, M.; Láng, I.; Gómez, H.L.; Tondini, C.; Ciruelos, E.; Burstein, H.J.; et al. Tailoring Adjuvant Endocrine Therapy for Premenopausal Breast Cancer. N. Engl. J. Med. 2018, 379, 122–137. [Google Scholar] [CrossRef] [Green Version]
- Tancredi, R.; Furlanetto, J.; Loibl, S. Endocrine Therapy in Premenopausal Hormone Receptor Positive/Human Epidermal Growth Receptor 2 Negative Metastatic Breast Cancer: Between Guidelines and Literature. Oncologist 2018, 23, 974–981. [Google Scholar] [CrossRef] [Green Version]
- Droog, M.; Beelen, K.; Linn, S.; Zwart, W. Tamoxifen Resistance: From Bench to Bedside. Eur. J. Pharmacol. 2013, 717, 47–57. [Google Scholar] [CrossRef]
- Najim, O.; Seghers, S.; Sergoynne, L.; Van Gaver, H.; Papadimitriou, K.; Wouters, K.; Trinh, X.B.; Huizing, M.T.; Tjalma, W. The Association between Type of Endocrine Therapy and Development of Estrogen Receptor-1 Mutation(s) in Patients with Hormone-Sensitive Advanced Breast Cancer: A Systematic Review and Meta-Analysis of Randomized and Non-Randomized Trials. Biochim. Biophys. Acta Rev. Cancer 2019, 1872, 188315. [Google Scholar] [CrossRef]
- Johnston, S.R. Acquired Tamoxifen Resistance in Human Breast Cancer--Potential Mechanisms and Clinical Implications. Anticancer. Drugs 1997, 8, 911–930. [Google Scholar] [CrossRef] [PubMed]
- Nass, N.; Kalinski, T. Tamoxifen Resistance: From Cell Culture Experiments towards Novel Biomarkers. Pathol. Res. Pract. 2015, 211, 189–197. [Google Scholar] [CrossRef] [PubMed]
- Shi, L.; Dong, B.; Li, Z.; Lu, Y.; Ouyang, T.; Li, J.; Wang, T.; Fan, Z.; Fan, T.; Lin, B.; et al. Expression of ER-{alpha}36, a Novel Variant of Estrogen Receptor {alpha}, and Resistance to Tamoxifen Treatment in Breast Cancer. J. Clin. Oncol. Off. J. Am. Soc. Clin. Oncol. 2009, 27, 3423–3429. [Google Scholar] [CrossRef] [PubMed] [Green Version]
- Sutherland, R.L.; Musgrove, E.A. CDK Inhibitors as Potential Breast Cancer Therapeutics: New Evidence for Enhanced Efficacy in ER+disease. Breast Cancer Res. 2009, 11, 112. [Google Scholar] [CrossRef] [PubMed] [Green Version]
- Roy, M.J.; Winkler, S.; Hughes, S.J.; Whitworth, C.; Galant, M.; Farnaby, W.; Rumpel, K.; Ciulli, A. SPR-Measured Dissociation Kinetics of PROTAC Ternary Complexes Influence Target Degradation Rate. ACS Chem. Biol. 2019, 14, 361–368. [Google Scholar] [CrossRef] [PubMed] [Green Version]
- Kumar, S.; Bhardwaj, V.K.; Singh, R.; Das, P.; Purohit, R. Evaluation of Plant-Derived Semi-Synthetic Molecules against BRD3-BD2 Protein: A Computational Strategy to Combat Breast Cancer. Mol. Syst. Des. Eng. 2022, 7, 381–391. [Google Scholar] [CrossRef]
- Barazetti, J.F.; Jucoski, T.S.; Carvalho, T.M.; Veiga, R.N.; Kohler, A.F.; Baig, J.; Al Bizri, H.; Gradia, D.F.; Mader, S.; Carvalho de Oliveira, J. From Micro to Long: Non-Coding RNAs in Tamoxifen Resistance of Breast Cancer Cells. Cancers 2021, 13, 3688. [Google Scholar] [CrossRef]
- Ward, A.; Balwierz, A.; Zhang, J.D.; Küblbeck, M.; Pawitan, Y.; Hielscher, T.; Wiemann, S.; Sahin, O. Re-Expression of MicroRNA-375 Reverses Both Tamoxifen Resistance and Accompanying EMT-like Properties in Breast Cancer. Oncogene 2012, 32, 1173–1182. [Google Scholar] [CrossRef] [Green Version]
- Ward, A.; Shukla, K.; Balwierz, A.; Soons, Z.; König, R.; Sahin, O.; Wiemann, S. MicroRNA-519a Is a Novel Oncomir Conferring Tamoxifen Resistance by Targeting a Network of Tumour-Suppressor Genes in ER+ Breast Cancer. J. Pathol. 2014, 233, 368–379. [Google Scholar] [CrossRef] [Green Version]
- Miller, T.E.; Ghoshal, K.; Ramaswamy, B.; Roy, S.; Datta, J.; Shapiro, C.L.; Jacob, S.; Majumder, S. MicroRNA-221/222 Confers Tamoxifen Resistance in Breast Cancer by Targeting P27Kip1. J. Biol. Chem. 2008, 283, 29897–29903. [Google Scholar] [CrossRef] [Green Version]
- Ren, L.; Zhou, H.; Lei, L.; Zhang, Y.; Cai, H.; Wang, X. Long Non-Coding RNA FOXD3 Antisense RNA 1 Augments Anti-Estrogen Resistance in Breast Cancer Cells through the MicroRNA-363/ Trefoil Factor 1/ Phosphatidylinositol 3-Kinase/Protein Kinase B Axis. Bioengineered 2021, 12, 5266–5278. [Google Scholar] [CrossRef] [PubMed]
- Bergamaschi, A.; Katzenellenbogen, B.S. Tamoxifen Downregulation of MiR-451 Increases 14-3-3ζ and Promotes Breast Cancer Cell Survival and Endocrine Resistance. Oncogene 2012, 31, 39–47. [Google Scholar] [CrossRef] [PubMed] [Green Version]
- Dever, T.E.; Kinzy, T.G.; Pavitt, G.D. Mechanism and Regulation of Protein Synthesis in Saccharomyces Cerevisiae. Genetics 2016, 203, 65–107. [Google Scholar] [CrossRef] [PubMed] [Green Version]
- Thoma, C.; Fraterman, S.; Gentzel, M.; Wilm, M.; Hentze, M.W. Translation Initiation by the C-Myc MRNA Internal Ribosome Entry Sequence and the Poly(A) Tail. RNA N. Y. N 2008, 14, 1579–1589. [Google Scholar] [CrossRef] [PubMed] [Green Version]
- Modelska, A.; Turro, E.; Russell, R.; Beaton, J.; Sbarrato, T.; Spriggs, K.; Miller, J.; Gräf, S.; Provenzano, E.; Blows, F.; et al. The Malignant Phenotype in Breast Cancer Is Driven by EIF4A1-Mediated Changes in the Translational Landscape. Cell Death Dis. 2015, 6, e1603. [Google Scholar] [CrossRef] [PubMed] [Green Version]
- Avanzino, B.C.; Fuchs, G.; Fraser, C.S. Cellular Cap-Binding Protein, EIF4E, Promotes Picornavirus Genome Restructuring and Translation. Proc. Natl. Acad. Sci. USA 2017, 114, 9611–9616. [Google Scholar] [CrossRef] [Green Version]
- Liberman, N.; Gandin, V.; Svitkin, Y.V.; David, M.; Virgili, G.; Jaramillo, M.; Holcik, M.; Nagar, B.; Kimchi, A.; Sonenberg, N. DAP5 Associates with EIF2β and EIF4AI to Promote Internal Ribosome Entry Site Driven Translation. Nucleic Acids Res. 2015, 43, 3764–3775. [Google Scholar] [CrossRef] [Green Version]
- Chen, Q.; Yang, B.; Nass, N.; Schatz, C.; Haybaeck, J. Impact of Eukaryotic Translation Initiation Factors on Breast Cancer: Still Much to Investigate. Cancers 2020, 12, E1984. [Google Scholar] [CrossRef]
- Yao, Y.-S.; Qiu, W.-S.; Yao, R.-Y.; Zhang, Q.; Zhuang, L.-K.; Zhou, F.; Sun, L.-B.; Yue, L. MiR-141 Confers Docetaxel Chemoresistance of Breast Cancer Cells via Regulation of EIF4E Expression. Oncol. Rep. 2015, 33, 2504–2512. [Google Scholar] [CrossRef] [Green Version]
- Xue, F.; Liang, Y.; Li, Z.; Liu, Y.; Zhang, H.; Wen, Y.; Yan, L.; Tang, Q.; Xiao, E.; Zhang, D. MicroRNA-9 Enhances Sensitivity to Cetuximab in Epithelial Phenotype Hepatocellular Carcinoma Cells through Regulation of the Eukaryotic Translation Initiation Factor 5A-2. Oncol. Lett. 2018, 15, 813–820. [Google Scholar] [CrossRef] [Green Version]
- Liu, M.; Gong, C.; Xu, R.; Chen, Y.; Wang, X. MicroRNA-5195-3p Enhances the Chemosensitivity of Triple-Negative Breast Cancer to Paclitaxel by Downregulating EIF4A2. Cell. Mol. Biol. Lett. 2019, 24, 47. [Google Scholar] [CrossRef] [PubMed]
- Porsch, M.; Özdemir, E.; Wisniewski, M.; Graf, S.; Bull, F.; Hoffmann, K.; Ignatov, A.; Haybaeck, J.; Grosse, I.; Kalinski, T.; et al. Time Resolved Gene Expression Analysis during Tamoxifen Adaption of MCF-7 Cells Identifies Long Non-Coding RNAs with Prognostic Impact. RNA Biol. 2019, 16, 661–674. [Google Scholar] [CrossRef] [PubMed]
- Ignatov, A.; Ignatov, T.; Roessner, A.; Costa, S.D.; Kalinski, T. Role of GPR30 in the Mechanisms of Tamoxifen Resistance in Breast Cancer MCF-7 Cells. Breast Cancer Res. Treat. 2010, 123, 87–96. [Google Scholar] [CrossRef]
- Bastien, R.R.L.; Rodríguez-Lescure, Á.; Ebbert, M.T.W.; Prat, A.; Munárriz, B.; Rowe, L.; Miller, P.; Ruiz-Borrego, M.; Anderson, D.; Lyons, B.; et al. PAM50 Breast Cancer Subtyping by RT-QPCR and Concordance with Standard Clinical Molecular Markers. BMC Med. Genomics 2012, 5, 44. [Google Scholar] [CrossRef] [PubMed] [Green Version]
- Vo, D.-K.; Engler, A.; Stoimenovski, D.; Hartig, R.; Kaehne, T.; Kalinski, T.; Naumann, M.; Haybaeck, J.; Nass, N. Interactome Mapping of EIF3A in a Colon Cancer and an Immortalized Embryonic Cell Line Using Proximity-Dependent Biotin Identification. Cancers 2021, 13, 1293. [Google Scholar] [CrossRef]
- Ruhs, S.; Nass, N.; Bartling, B.; Brömme, H.-J.; Leuner, B.; Somoza, V.; Friess, U.; Silber, R.-E.; Simm, A. Preconditioning with Maillard Reaction Products Improves Antioxidant Defence Leading to Increased Stress Tolerance in Cardiac Cells. Exp. Gerontol. 2010, 45, 752–762. [Google Scholar] [CrossRef] [Green Version]
- Agarwal, V.; Bell, G.W.; Nam, J.-W.; Bartel, D.P. Predicting Effective MicroRNA Target Sites in Mammalian MRNAs. eLife 2015, 4, e05005. [Google Scholar] [CrossRef]
- Oliveros, J.C. VENNY. An Interactive Tool for Comparing Lists with Venn Diagrams. 2007–2015. Available online: https://bioinfogp.cnb.csic.es/tools/venny/index.html (accessed on 15 June 2022).
- Kuleshov, M.V.; Jones, M.R.; Rouillard, A.D.; Fernandez, N.F.; Duan, Q.; Wang, Z.; Koplev, S.; Jenkins, S.L.; Jagodnik, K.M.; Lachmann, A.; et al. Enrichr: A Comprehensive Gene Set Enrichment Analysis Web Server 2016 Update. Nucleic Acids Res. 2016, 44, W90–W97. [Google Scholar] [CrossRef] [Green Version]
- Warde-Farley, D.; Donaldson, S.L.; Comes, O.; Zuberi, K.; Badrawi, R.; Chao, P.; Franz, M.; Grouios, C.; Kazi, F.; Lopes, C.T.; et al. The GeneMANIA Prediction Server: Biological Network Integration for Gene Prioritization and Predicting Gene Function. Nucleic Acids Res. 2010, 38, W214–W220. [Google Scholar] [CrossRef]
- Franz, M.; Rodriguez, H.; Lopes, C.; Zuberi, K.; Montojo, J.; Bader, G.D.; Morris, Q. GeneMANIA Update 2018. Nucleic Acids Res. 2018, 46, W60–W64. [Google Scholar] [CrossRef] [Green Version]
- Rice, J.C.; Massey-Brown, K.S.; Futscher, B.W. Aberrant Methylation of the BRCA1 CpG Island Promoter Is Associated with Decreased BRCA1 MRNA in Sporadic Breast Cancer Cells. Oncogene 1998, 17, 1807–1812. [Google Scholar] [CrossRef] [PubMed] [Green Version]
- Joshi, T.; Elias, D.; Stenvang, J.; Alves, C.L.; Teng, F.; Lyng, M.B.; Lykkesfeldt, A.E.; Brünner, N.; Wang, J.; Gupta, R.; et al. Integrative Analysis of MiRNA and Gene Expression Reveals Regulatory Networks in Tamoxifen-Resistant Breast Cancer. Oncotarget 2016, 7, 57239–57253. [Google Scholar] [CrossRef] [PubMed] [Green Version]
- Györffy, B.; Lanczky, A.; Eklund, A.C.; Denkert, C.; Budczies, J.; Li, Q.; Szallasi, Z. An Online Survival Analysis Tool to Rapidly Assess the Effect of 22,277 Genes on Breast Cancer Prognosis Using Microarray Data of 1,809 Patients. Breast Cancer Res. Treat. 2010, 123, 725–731. [Google Scholar] [CrossRef] [Green Version]
- Curtis, C.; Shah, S.P.; Chin, S.-F.; Turashvili, G.; Rueda, O.M.; Dunning, M.J.; Speed, D.; Lynch, A.G.; Samarajiwa, S.; Yuan, Y.; et al. The Genomic and Transcriptomic Architecture of 2,000 Breast Tumours Reveals Novel Subgroups. Nature 2012, 486, 346–352. [Google Scholar] [CrossRef] [PubMed]
- Perou, C.M.; Sørlie, T.; Eisen, M.B.; van de Rijn, M.; Jeffrey, S.S.; Rees, C.A.; Pollack, J.R.; Ross, D.T.; Johnsen, H.; Akslen, L.A.; et al. Molecular Portraits of Human Breast Tumours. Nature 2000, 406, 747–752. [Google Scholar] [CrossRef]
- Ochoa, S.; de Anda-Jáuregui, G.; Hernández-Lemus, E. Multi-Omic Regulation of the PAM50 Gene Signature in Breast Cancer Molecular Subtypes. Front. Oncol. 2020, 10, 845. [Google Scholar] [CrossRef]
- Nielsen, T.; Wallden, B.; Schaper, C.; Ferree, S.; Liu, S.; Gao, D.; Barry, G.; Dowidar, N.; Maysuria, M.; Storhoff, J. Analytical Validation of the PAM50-Based Prosigna Breast Cancer Prognostic Gene Signature Assay and NCounter Analysis System Using Formalin-Fixed Paraffin-Embedded Breast Tumor Specimens. BMC Cancer 2014, 14, 177. [Google Scholar] [CrossRef] [Green Version]
- Parker, J.S.; Mullins, M.; Cheang, M.C.U.; Leung, S.; Voduc, D.; Vickery, T.; Davies, S.; Fauron, C.; He, X.; Hu, Z.; et al. Supervised Risk Predictor of Breast Cancer Based on Intrinsic Subtypes. J. Clin. Oncol. Off. J. Am. Soc. Clin. Oncol. 2009, 27, 1160–1167. [Google Scholar] [CrossRef]
- Weinstein, J.N.; Myers, T.G.; O’Connor, P.M.; Friend, S.H.; Fornace, A.J.; Kohn, K.W.; Fojo, T.; Bates, S.E.; Rubinstein, L.V.; Anderson, N.L.; et al. An Information-Intensive Approach to the Molecular Pharmacology of Cancer. Science 1997, 275, 343–349. [Google Scholar] [CrossRef] [Green Version]
- Weinstein, J.N.; Myers, T.; Buolamwini, J.; Raghavan, K.; van Osdol, W.; Licht, J.; Viswanadhan, V.N.; Kohn, K.W.; Rubinstein, L.V.; Koutsoukos, A.D. Predictive Statistics and Artificial Intelligence in the U.S. National Cancer Institute’s Drug Discovery Program for Cancer and AIDS. Stem Cells Dayt. Ohio 1994, 12, 13–22. [Google Scholar] [CrossRef] [PubMed]
- Kastrati, I.; Joosten, S.E.P.; Semina, S.E.; Alejo, L.H.; Brovkovych, S.D.; Stender, J.D.; Horlings, H.M.; Kok, M.; Alarid, E.T.; Greene, G.L.; et al. The NF-ΚB Pathway Promotes Tamoxifen Tolerance and Disease Recurrence in Estrogen Receptor-Positive Breast Cancers. Mol. Cancer Res. MCR 2020, 18, 1018–1027. [Google Scholar] [CrossRef] [PubMed] [Green Version]
- Semina, S.E.; Pal, P.; Kansara, N.S.; Huggins, R.J.; Alarid, E.T.; Greene, G.L.; Frasor, J. Selective Pressure of Endocrine Therapy Activates the Integrated Stress Response through NFκB Signaling in a Subpopulation of ER Positive Breast Cancer Cells. Breast Cancer Res. BCR 2022, 24, 19. [Google Scholar] [CrossRef] [PubMed]
- Zhou, Y.; Eppenberger-Castori, S.; Eppenberger, U.; Benz, C.C. The NFkappaB Pathway and Endocrine-Resistant Breast Cancer. Endocr. Relat. Cancer 2005, 12 (Suppl. 1), S37–S46. [Google Scholar] [CrossRef] [PubMed]
- Nass, N.; Brömme, H.-J.; Hartig, R.; Korkmaz, S.; Sel, S.; Hirche, F.; Ward, A.; Simm, A.; Wiemann, S.; Lykkesfeldt, A.E.; et al. Differential Response to α-Oxoaldehydes in Tamoxifen Resistant MCF-7 Breast Cancer Cells. PLoS ONE 2014, 9, e101473. [Google Scholar] [CrossRef] [Green Version]
- Czapiewski, P.; Cornelius, M.; Hartig, R.; Kalinski, T.; Haybaeck, J.; Dittmer, A.; Dittmer, J.; Ignatov, A.; Nass, N. BCL3 Expression Is Strongly Associated with the Occurrence of Breast Cancer Relapse under Tamoxifen Treatment in a Retrospective Cohort Study. Virchows Arch. Int. J. Pathol. 2022, 480, 529–541. [Google Scholar] [CrossRef]
- Gabel, F.; Aubry, A.-S.; Hovhannisyan, V.; Chavant, V.; Weinsanto, I.; Maduna, T.; Darbon, P.; Goumon, Y. Unveiling the Impact of Morphine on Tamoxifen Metabolism in Mice in Vivo. Front. Oncol. 2020, 10, 25. [Google Scholar] [CrossRef]
- Chiang, Y.-C.; Wang, R.-Y.; Huang, C.-L.; Chen, S.-H.; Ho, W.-J.; Lane, H.-Y.; Ho, I.-K.; Yang, H.-T.; Ma, W.-L. Reduced Dosing and Liability in Methadone Maintenance Treatment by Targeting Oestrogen Signal for Morphine Addiction. J. Cell. Mol. Med. 2017, 21, 3552–3564. [Google Scholar] [CrossRef] [Green Version]
- Steelman, L.S.; Chappell, W.H.; Akula, S.M.; Abrams, S.L.; Cocco, L.; Manzoli, L.; Ratti, S.; Martelli, A.M.; Montalto, G.; Cervello, M.; et al. Therapeutic Resistance in Breast Cancer Cells Can Result from Deregulated EGFR Signaling. Adv. Biol. Regul. 2020, 78, 100758. [Google Scholar] [CrossRef]
- Roninson, I.B.; Győrffy, B.; Mack, Z.T.; Shtil, A.A.; Shtutman, M.S.; Chen, M.; Broude, E.V. Identifying Cancers Impacted by CDK8/19. Cells 2019, 8, E821. [Google Scholar] [CrossRef] [Green Version]
- Chew, N.J.; Nguyen, E.V.; Su, S.-P.; Novy, K.; Chan, H.C.; Nguyen, L.K.; Luu, J.; Simpson, K.J.; Lee, R.S.; Daly, R.J. FGFR3 Signaling and Function in Triple Negative Breast Cancer. Cell Commun. Signal. CCS 2020, 18, 13. [Google Scholar] [CrossRef] [PubMed] [Green Version]
- Hu, T.; Lu, C.; Xia, Y.; Wu, L.; Song, J.; Chen, C.; Wang, Q. Small Nucleolar RNA SNORA71A Promotes Epithelial-Mesenchymal Transition by Maintaining ROCK2 MRNA Stability in Breast Cancer. Mol. Oncol. 2022, 16, 1947–1965. [Google Scholar] [CrossRef] [PubMed]
- Agatheeswaran, S.; Pattnayak, N.C.; Chakraborty, S. Identification and Functional Characterization of the MiRNA-Gene Regulatory Network in Chronic Myeloid Leukemia Lineage Negative Cells. Sci. Rep. 2016, 6, 32493. [Google Scholar] [CrossRef] [PubMed] [Green Version]
- Zhao, X.-G.; Hu, J.-Y.; Tang, J.; Yi, W.; Zhang, M.-Y.; Deng, R.; Mai, S.-J.; Weng, N.-Q.; Wang, R.-Q.; Liu, J.; et al. MiR-665 Expression Predicts Poor Survival and Promotes Tumor Metastasis by Targeting NR4A3 in Breast Cancer. Cell Death Dis. 2019, 10, 479. [Google Scholar] [CrossRef]
- DbDEMC 3.0: Functional Exploration of Differentially Expressed MiRNAs in Cancers of Human and Model Organisms—PubMed. Available online: https://pubmed.ncbi.nlm.nih.gov/35643191/ (accessed on 13 June 2022).
- Salinas-Vera, Y.M.; Valdés, J.; Hidalgo-Miranda, A.; Cisneros-Villanueva, M.; Marchat, L.A.; Nuñez-Olvera, S.I.; Ramos-Payán, R.; Pérez-Plasencia, C.; Arriaga-Pizano, L.A.; Prieto-Chávez, J.L.; et al. Three-Dimensional Organotypic Cultures Reshape the MicroRNAs Transcriptional Program in Breast Cancer Cells. Cancers 2022, 14, 2490. [Google Scholar] [CrossRef]
- Schrauder, M.G.; Strick, R.; Schulz-Wendtland, R.; Strissel, P.L.; Kahmann, L.; Loehberg, C.R.; Lux, M.P.; Jud, S.M.; Hartmann, A.; Hein, A.; et al. Circulating Micro-RNAs as Potential Blood-Based Markers for Early Stage Breast Cancer Detection. PLoS ONE 2012, 7, e29770. [Google Scholar] [CrossRef]
- Hoppe, R.; Fan, P.; Büttner, F.; Winter, S.; Tyagi, A.K.; Cunliffe, H.; Jordan, V.C.; Brauch, H. Profiles of MiRNAs Matched to Biology in Aromatase Inhibitor Resistant Breast Cancer. Oncotarget 2016, 7, 71235–71254. [Google Scholar] [CrossRef] [Green Version]
- Dai, W.; Jin, X.; Han, L.; Huang, H.; Ji, Z.; Xu, X.; Tang, M.; Jiang, B.; Chen, W. Exosomal LncRNA DOCK9-AS2 Derived from Cancer Stem Cell-like Cells Activated Wnt/β-Catenin Pathway to Aggravate Stemness, Proliferation, Migration, and Invasion in Papillary Thyroid Carcinoma. Cell Death Dis. 2020, 11, 743. [Google Scholar] [CrossRef]
- Wang, Y.; Zeng, X.; Wang, N.; Zhao, W.; Zhang, X.; Teng, S.; Zhang, Y.; Lu, Z. Long Noncoding RNA DANCR, Working as a Competitive Endogenous RNA, Promotes ROCK1-Mediated Proliferation and Metastasis via Decoying of MiR-335-5p and MiR-1972 in Osteosarcoma. Mol. Cancer 2018, 17, 89. [Google Scholar] [CrossRef]
- Guo, J.; Pan, H. Long Noncoding RNA LINC01125 Enhances Cisplatin Sensitivity of Ovarian Cancer via MiR-1972. Med. Sci. Monit. Int. Med. J. Exp. Clin. Res. 2019, 25, 9844–9854. [Google Scholar] [CrossRef]
- Zhou, F.-C.; Zhang, Y.-H.; Liu, H.-T.; Song, J.; Shao, J. LncRNA LINC00588 Suppresses the Progression of Osteosarcoma by Acting as a CeRNA for MiRNA-1972. Front. Pharmacol. 2020, 11, 255. [Google Scholar] [CrossRef] [PubMed]
- Wang, S.; Qiu, J.; Wang, L.; Wu, Z.; Zhang, X.; Li, Q.; Jiang, F. Long Non-Coding RNA LINC01207 Promotes Prostate Cancer Progression by Downregulating MicroRNA-1972 and Upregulating LIM and SH3 Protein 1. IUBMB Life 2020, 72, 1960–1975. [Google Scholar] [CrossRef] [PubMed]
- Loh, Y.N.; Hedditch, E.L.; Baker, L.A.; Jary, E.; Ward, R.L.; Ford, C.E. The Wnt Signalling Pathway Is Upregulated in an in Vitro Model of Acquired Tamoxifen Resistant Breast Cancer. BMC Cancer 2013, 13, 174. [Google Scholar] [CrossRef] [PubMed] [Green Version]
- Fu, Y.; Wang, Z.; Luo, C.; Wang, Y.; Wang, Y.; Zhong, X.; Zheng, H. Downregulation of CXXC Finger Protein 4 Leads to a Tamoxifen-Resistant Phenotype in Breast Cancer Cells Through Activation of the Wnt/β-Catenin Pathway. Transl. Oncol. 2020, 13, 423–440. [Google Scholar] [CrossRef] [PubMed]
- Jungers, C.F.; Elliff, J.M.; Masson-Meyers, D.S.; Phiel, C.J.; Origanti, S. Regulation of Eukaryotic Translation Initiation Factor 6 Dynamics through Multisite Phosphorylation by GSK3. J. Biol. Chem. 2020, 295, 12796–12813. [Google Scholar] [CrossRef] [PubMed]


| Antibody/Antigen | Supplier | Order-Nr. |
|---|---|---|
| eIF1 | Cell Signaling | #12496 |
| eIF2A(EPR11042)RabmAb | abcam | ab169528 |
| eIF3A | Cell Signaling | #2538 |
| EIF3D | GeneTex | GTX101424 |
| eIF3H (D9C1) XP | Cell Signalling | #3413 |
| Phospho-4E-BP1(Ser65) | Cell Signaling | #9456 |
| 4E-BP1 | Cell Signaling | #9452 |
| eIF4A1 | Cell Signaling | #2490 |
| eIF4B | GeneTex | GTX33175 |
| eIF4E | Cell Signaling | #9742 |
| eIF4G | Cell Signaling | #2498 |
| eIF4H | Cell Signaling | #3469 |
| eIF6 | Cell Signalling | # 3263 |
| β-actin | Sigma Aldrich | A5441 |
| nCounter Results | Relative to MCF-7 | |
|---|---|---|
| miRNA | log2FC | adj. p-value |
| hsa-miR-181b-5p+hsa-miR-181d-5p | 5.91 | 0.01 |
| hsa-miR-1972 | −3.66 | 0.01 |
| hsa-miR-375 | −7.00 | 0.01 |
| hsa-miR-181a-3p = hsa-miR-213 | 5.85 | 0.02 |
| hsa-miR-455-5p | 6.38 | 0.03 |
| qRT-PCR results | log2FC | p-value |
| hsa-miR-181b-5p | 5.30 | <0.01 |
| miR-181d-5p | 4.89 | <0.01 |
| hsa-miR-1972 | −2.63 | <0.01 |
| hsa-miR-213 (181a-3p) | 2.25 | <0.01 |
| hsa-miR-375-3p | −4.90 | <0.01 |
| hsa-miR-455-5p | 2.87 | <0.01 |
| Micro RNA | HR (p) All Cases | HR (p) ER+ | HR (p) Endocrine Therapy | Regulation by 4OH-Tamoxifen |
|---|---|---|---|---|
| miR-181a | 1.5 (0.00013) | 1.57 (0.00028) | 1.75 (0.00028) | Up |
| miR-181b | 1.47 (0.00029) | 1.67 (3.8 × 10⁻⁵) | 1.63 (0.00059) | Up |
| miR-181d | 0.75 (0.0043) | 0.73 (0.0065) | 0.69 (0.0078) | Up |
| miR-375 | 1.29 (0.02) | 1.67 (0.00043) | 1.64 (0.0055) | Down |
| miR-455 | 0.78 (0.019) | 0.67 (0.0019) | 0.63 (0.00089) | Up |
| miR-1972 * | 2.23 (2e-6) | n.a. | n.a. | Down |
| miRNA | Targets (Targetscan) | Overlap n (%) | KEGG | REACTOME | GEO Kinase Perturbations (Up or Down) |
|---|---|---|---|---|---|
| miR-1972 | 4772 | 171 (3.6) | - | - | FGFR3 SNRK CDK19 CDK8 LRRK2 BRAF PLK1 |
| miR-181-5p | 1371 | 55 (4.0) | - | - | BRAF, LRRK2 JAK2 SYK DDR1 CDK19 ROCK2 ERBB3 |
| miR-213 | 595 | 19 (3.2) | - | - | - |
| miR-375 | 304 | 18 (5.9) | - | - | - |
| miR-455 | 258 | 9 (3.5) | - | - | - |
| All miRNAs | 6209 | 225 (3.6) | Leishmaniasis Morphine addiction Th1- and Th2- differentiation HTLV1 infection | - | LRRK2 FGFR3 BRAF CDK19 CDK8 ROCK2 ERBB3 ULK1 SNRK HIPK2 PLK-1 EGFR |
| Gene | Log2Fc 12 Weeks |
|---|---|
| EIF4A1 | −0.72 ** |
| EIF5A | −0.73 ** |
| EIF4EBP1 | −0.72 ** |
| EIF5A2 | −0.63 ** |
| EIF5 | 0.53 ** |
| EIF2AK4 | −0.41 ** |
| EIF2AK2 | −0.43 ** |
| EIF2B3 | −0.32 ** |
| EIF1AX | −0.36 * |
| EIF2B2 | 0.45 * |
| EIF4B | −0.30 * |
| EIF4E3 | 0.36 * |
| ANKHD1-EIF4EBP3 | 0.30 * |
| EIF5AL1 | 0.36 * |
| eIF Gene | miRNA | Total Context++ Score |
|---|---|---|
| EIF4E1B | hsa-miR-1972 | −0.47 |
| EIF4G3 | hsa-miR-375 | −0.35 |
| EIF5AL1 | hsa-miR-1972 | −0.37 |
| EIF4A2 | hsa-miR-181a-5p | −0.32 |
| EIF4A3 | hsa-miR-1972 | −0.32 |
| EIF2B2 | hsa-miR-181a-3p | −0.25 |
| EIF4E | hsa-miR-1972 | −0.22 |
| EIF1 | hsa-miR-1972 | −0.21 |
| EIF2S3 | hsa-miR-1972 | −0.25 |
| EIF4H | hsa-miR-375 | −0.18 |
| EIF4EBP2 | hsa-miR-1972 | −0.17 |
| EIF2S1 | hsa-miR-181a-3p | −0.17 |
| EIF1 | hsa-miR-375 | −0.15 |
| EIF2AK2 | hsa-miR-1972 | −0.13 |
| EIF2AK1 | hsa-miR-181a-3p | −0.09 |
| EIF5 | hsa-miR-1972 | −0.07 |
| EIF3H | hsa-miR-375 | −0.06 |
| EIF5A | hsa-miR-1972 | −0.05 |
| EIF5B | hsa-miR-1972 | −0.04 |
| EIF4H | hsa-miR-1972 | −0.02 |
Publisher’s Note: MDPI stays neutral with regard to jurisdictional claims in published maps and institutional affiliations. |
© 2022 by the authors. Licensee MDPI, Basel, Switzerland. This article is an open access article distributed under the terms and conditions of the Creative Commons Attribution (CC BY) license (https://creativecommons.org/licenses/by/4.0/).
Share and Cite
Behringer, A.; Stoimenovski, D.; Porsch, M.; Hoffmann, K.; Behre, G.; Grosse, I.; Kalinski, T.; Haybaeck, J.; Nass, N. Relationship of micro-RNA, mRNA and eIF Expression in Tamoxifen-Adapted MCF-7 Breast Cancer Cells: Impact of miR-1972 on Gene Expression, Proliferation and Migration. Biomolecules 2022, 12, 916. https://doi.org/10.3390/biom12070916
Behringer A, Stoimenovski D, Porsch M, Hoffmann K, Behre G, Grosse I, Kalinski T, Haybaeck J, Nass N. Relationship of micro-RNA, mRNA and eIF Expression in Tamoxifen-Adapted MCF-7 Breast Cancer Cells: Impact of miR-1972 on Gene Expression, Proliferation and Migration. Biomolecules. 2022; 12(7):916. https://doi.org/10.3390/biom12070916
Chicago/Turabian StyleBehringer, Akhil, Darko Stoimenovski, Martin Porsch, Katrin Hoffmann, Gerhard Behre, Ivo Grosse, Thomas Kalinski, Johannes Haybaeck, and Norbert Nass. 2022. "Relationship of micro-RNA, mRNA and eIF Expression in Tamoxifen-Adapted MCF-7 Breast Cancer Cells: Impact of miR-1972 on Gene Expression, Proliferation and Migration" Biomolecules 12, no. 7: 916. https://doi.org/10.3390/biom12070916
APA StyleBehringer, A., Stoimenovski, D., Porsch, M., Hoffmann, K., Behre, G., Grosse, I., Kalinski, T., Haybaeck, J., & Nass, N. (2022). Relationship of micro-RNA, mRNA and eIF Expression in Tamoxifen-Adapted MCF-7 Breast Cancer Cells: Impact of miR-1972 on Gene Expression, Proliferation and Migration. Biomolecules, 12(7), 916. https://doi.org/10.3390/biom12070916