Author Contributions
Conceptualization, F.E.O., Z.K. and W.F.G.; methodology, F.E.O., Z.K. and W.F.G.; software, F.E.O., Z.K., M.H.; validation, F.E.O. and Z.K.; formal analysis, F.E.O. and Z.K.; investigation, F.E.O., Z.K., M.H. and R.R.; resources, W.F.G.; data curation, F.E.O. and Z.K.; writing—original draft preparation, F.E.O. and Z.K.; writing—review and editing, W.F.G. and R.M.; visualization, F.E.O. and Z.K.; supervision, W.F.G.; project administration, W.F.G.; funding acquisition, W.F.G. All authors have read and agreed to the published version of the manuscript.
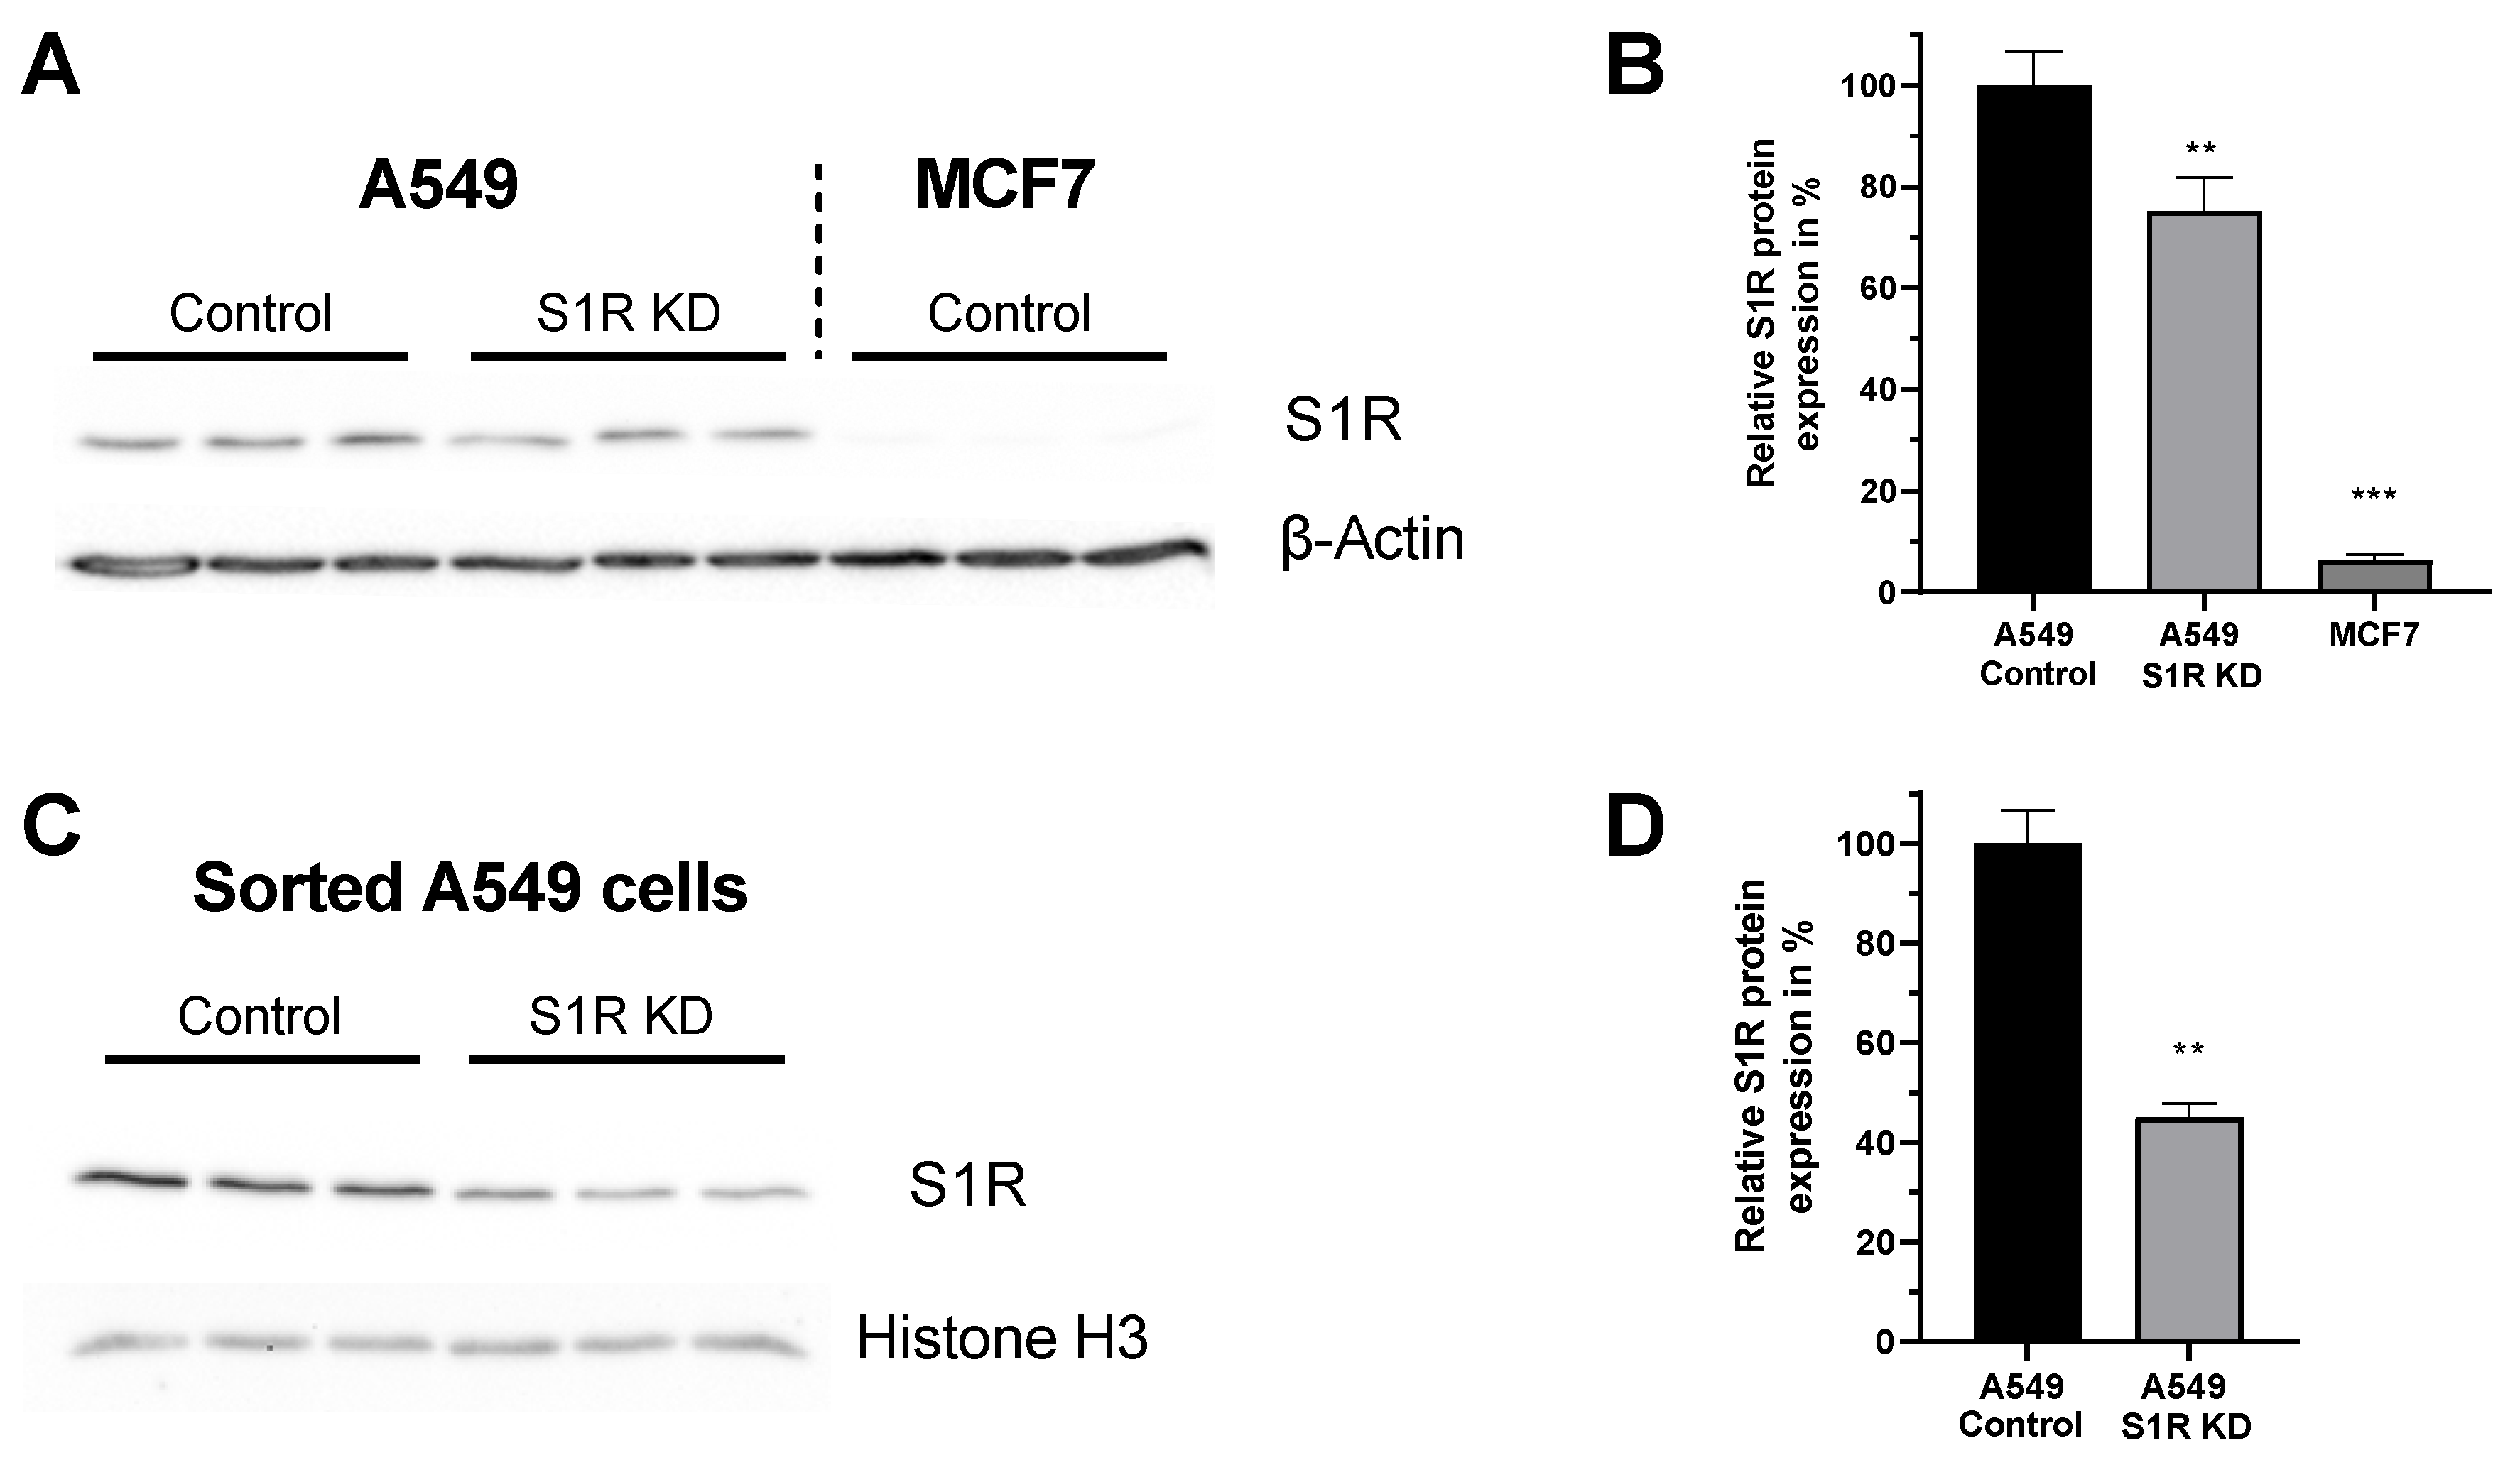
Figure 1.
Expression level of S1R in A549 and MCF-7 Cells. (A) Immunoblot images show the expression level of S1R in cells transfected either with control siRNA or siRNA against S1R (left) in A549 cells and non-transfected MCF7 cells (right). (B) Bar graphs represent immunoblot analysis of S1R expression as MEAN±SEM in A549 cells transfected with control siRNA or siRNA against S1R and non-transfected MCF7 cells. (C) Immunoblot images show the expression level of S1R in cells transfected either with control siRNA or siRNA against S1R in sorted, transfection positive A549 cells. (D) Bar graphs represent immunoblot analysis of S1R expression as MEAN±SEM in sorted A549 cells. Significant differences were assessed using one-way ANOVA with Tukey’s multiple comparison test (for B) or unpaired t-test (for D) and presented as (** p < 0.01, *** p < 0.001). A549 cells: A549 Control (n = 3), A549 S1R KD (n = 3), MCF7: (n = 3), sorted A549 Control (n = 3), sorted A549 S1R KD (n = 3).
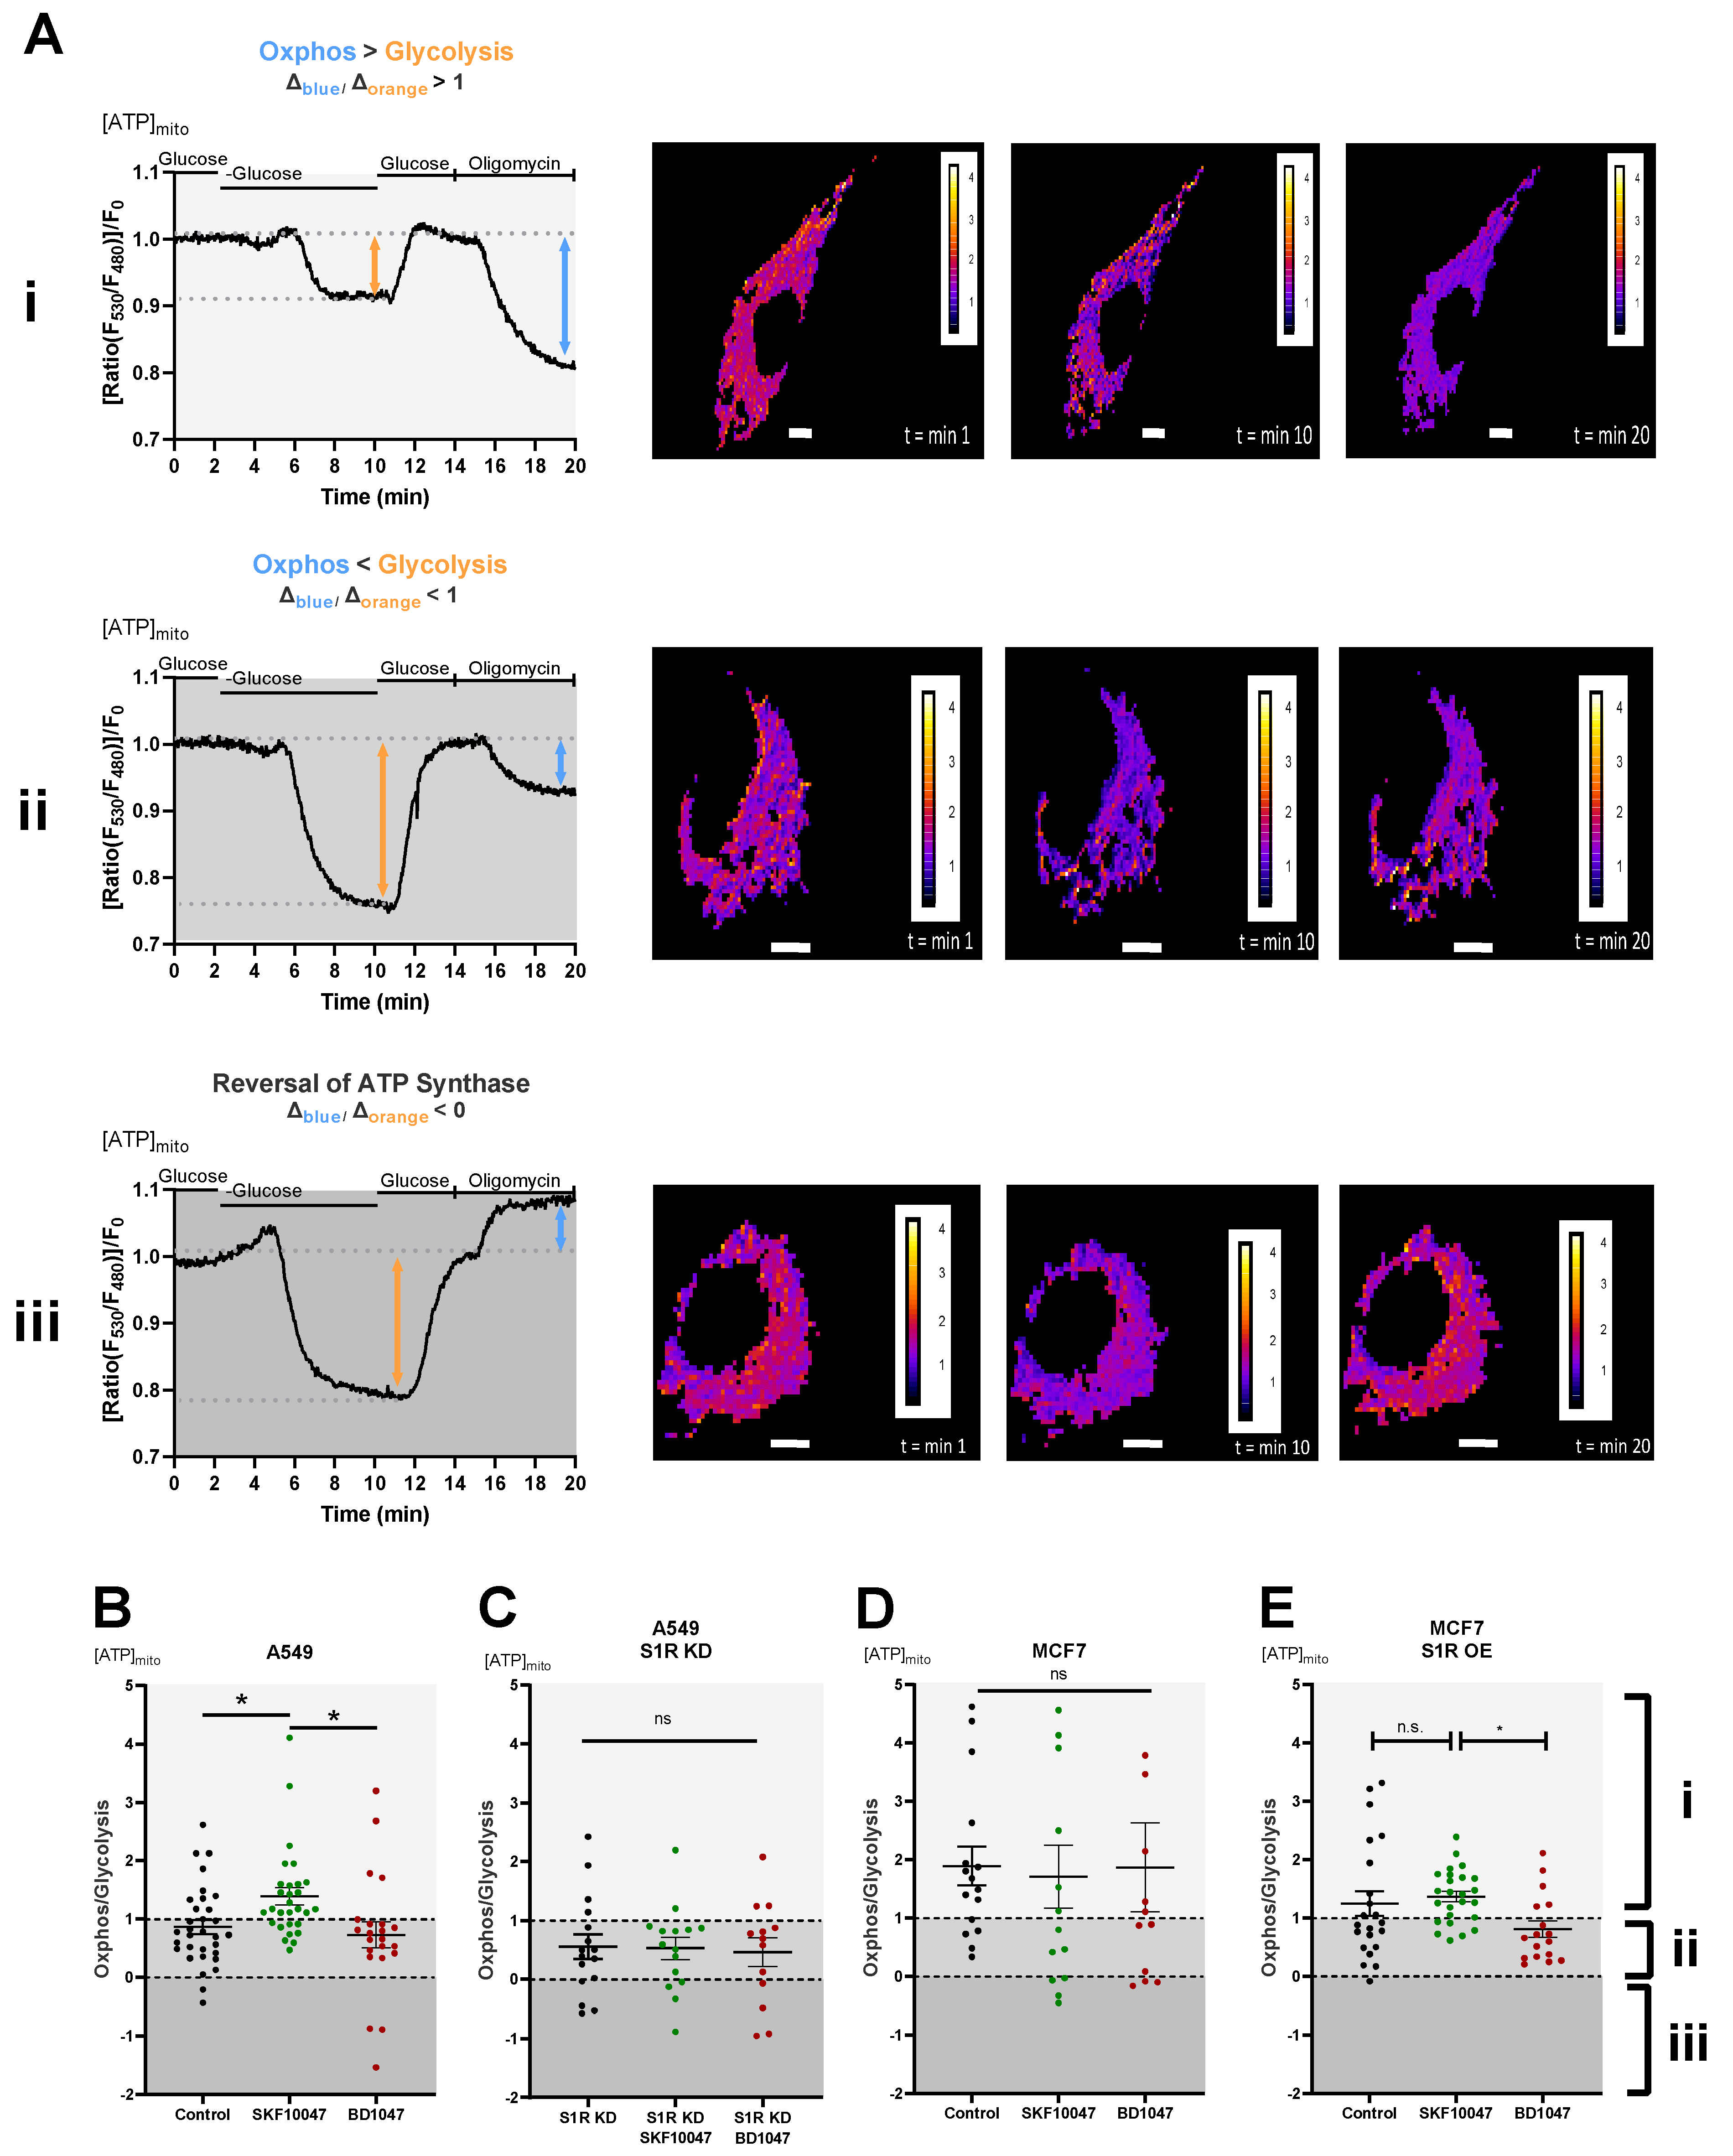
Figure 2.
Effect of pharmacological activation of S1R on mitochondrial energy status. (A) Representative traces of mitochondrial ATP levels with corresponding representative images of the cells transfected with mtAT.1.03 in MCF7 (i) and A549 (ii,iii) cells. The cells have been pseudocolored to represent mitochondrial ATP level as mtAT1.04 ratio; calibration bars are inserted on the right-hand side of the cells. The inserted white scale bar represents 10 µm. Change in ratio of oligomycin addition to glucose deprivation was used as a Oxphos/Glycolysis ratio and presented as Oxphos > Glycolysis (A(i)), Oxphos < Glycolysis (A(ii)), and reversal of ATP synthase (A(iii)). White area in panels (B–E) (indicated with (i)) represents Oxphos > Glycolysis, light gray area in panels (B–E) (indicates with (ii)) represents Oxphos < Glycolysis, and dark gray area in panels (B–E) (indicated by (iii)) represents reversal of ATP synthase. Scatter plots with individual values represent the ratio of Oxphos to Glycolysis in single cells with MEAN±SEM for (B) Control (black), Control+SKF10047 (green), Control+BD1047 (red), (C) S1R KD (black), S1R KD +SKF10047 (green) and S1R KD +BD1047 (red) in A549 cells, (D) for Control (black), Control+SKF10047 (green), Control+BD1047 (red) in MCF7 cells, and (E) for Control (black), Control+SKF10047 (green), Control+BD1047 (red) in MCF7 cells with S1R OE. Cells were treated with BD1047 and SKF10047 2–4 h prior to each experiment. Significant differences were assessed using one-way ANOVA with Tukey’s multiple comparison test and presented as (* p < 0.05, ns: not significant). A549 cells: Control (32 cells/16 experiments), Control + SKF10047 (29 cells/15 experiments), Control + BD1047 (22 cells/13 experiments), SR1 KD (16 cells/10 experiments), S1R KD + SKF10047 (15 cells/10 experiments) and S1RKD + BD1047 (13 cells/8 experiments). MCF7 cells: Control (15 cells/6 experiments), Control + SKF10047 (13 cells/4 experiments), Control + BD1047 (11 cells/5 experiments), S1R OE (22 cells/7 experiments), S1R OE + SKF10047 (25 cells/8 experiments), and S1R OE + BD1047 (18 cells/5 experiments).
![Biomolecules 12 00762 g002]()
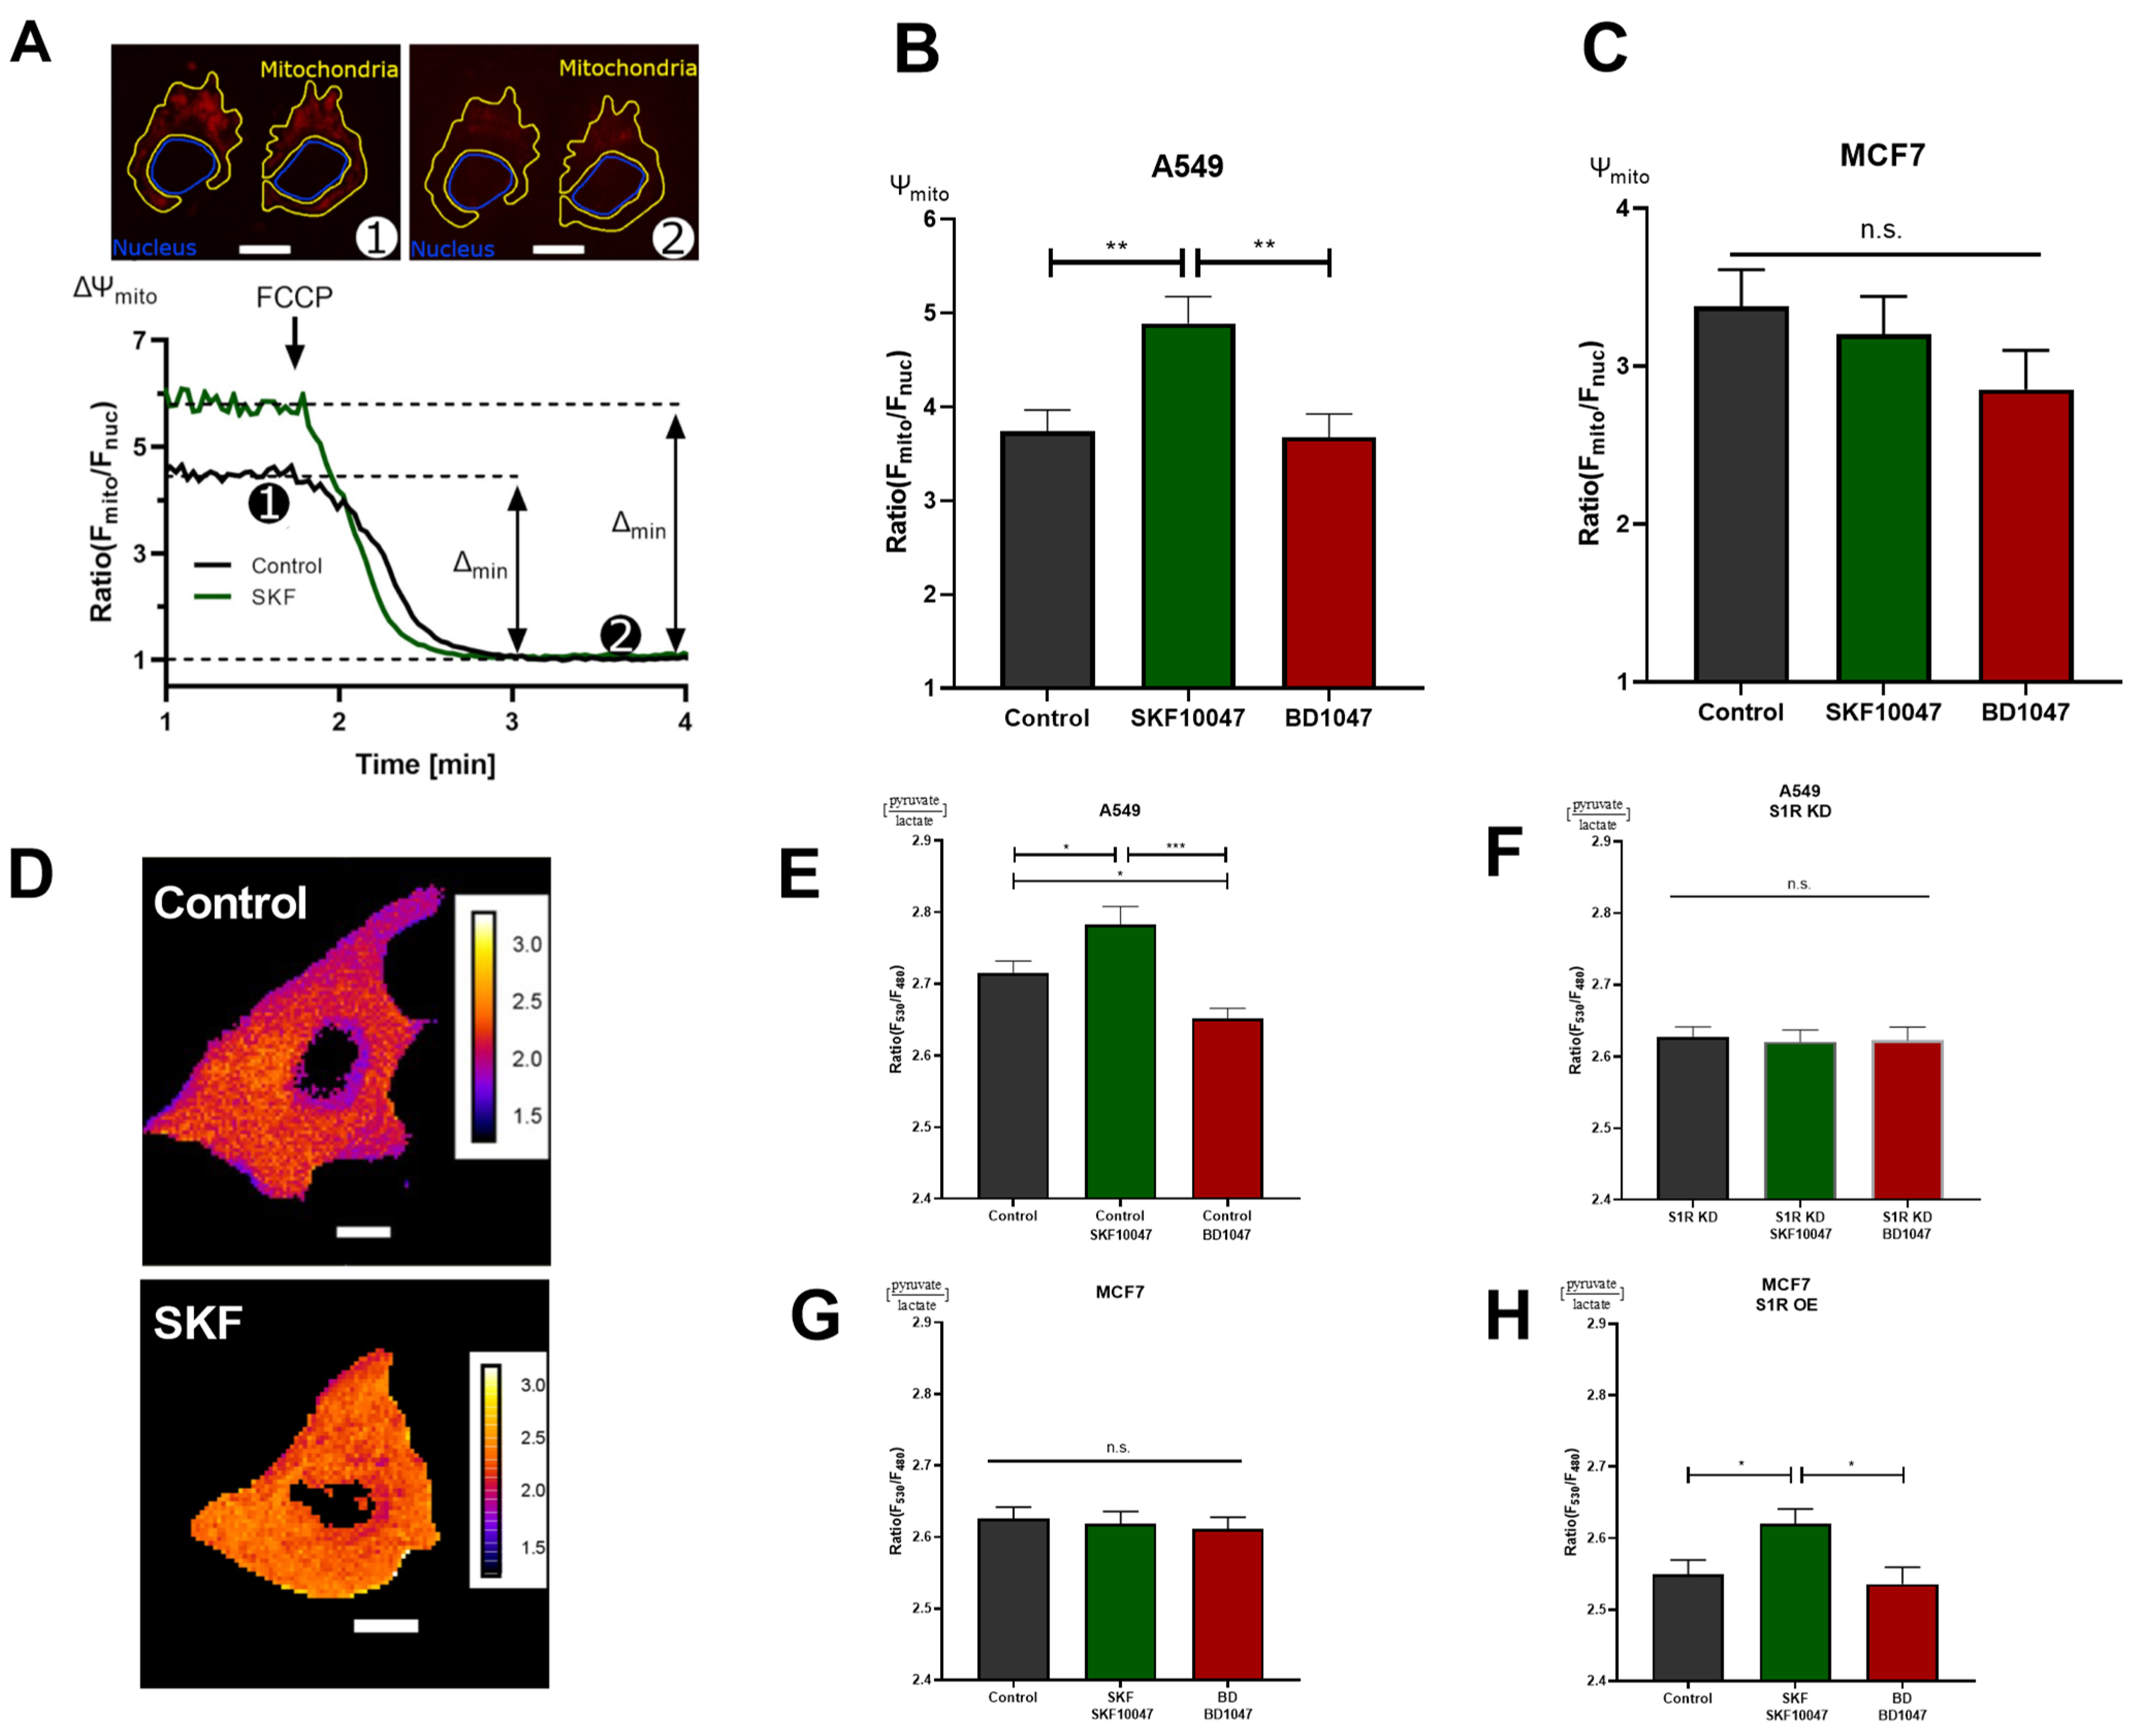
Figure 3.
S1R ligands modulate cancer cell energy metabolism. (A) Exemplary images of A549 cells stained with TMRM and selected regions of interest (ROI) for mitochondria and nucleus. The inserted white scale bar represents 10 µm. The experimental protocol with representative ratio traces of mitochondrial to nucleus ROIs is shown for control (black) and control+SKF10047 (green) are shown. Protocol indicated in (A) was used to obtain mitochondrial membrane potential for Control (black) and Control+SKF10047 (green) by calculating the change in fluorescence ratio in mitochondria and in nucleus after 1 µM FCCP treatment. (B) Bar graphs with MEAN±SEM represent the mitochondrial membrane potential for Control (black), Control+SKF10047 (green) and Control+BD1047 (red) in A549 cells and (C) in MCF7 cells. (D) Exemplary images of A549 cells transfected with ratiometric pyruvate/lactate sensor for Control (above) and Control+SKF10047 (below). The cells have been pseudocolored to represent pyruvate/lactate ratio, calibration bars are inserted on the right-hand side of both cells. The inserted white scale bar represents 10 µm. (E) Bar graphs with MEAN±SEM represent the cytoplasmic ratio of pyruvate to lactate for Control (black), Control+SKF10047 (green), Control+BD1047 (red), (F) S1R KD (black), S1R KD +SKF10047 (green) and S1R KD +BD1047 (red) in A549 cells, (G) Control (black), Control+SKF10047 (green), Control+BD1047 (red) in MCF7 cells, and (H) Control (black), Control+SKF10047 (green), Control+BD1047 (red) in MCF7 cells with S1R OE. Cells were treated with BD1047 and SKF10047 2–4 h prior to each experiment. Significant differences were assessed using one-way ANOVA with Tukey’s multiple comparison test and presented as (* p < 0.05, ** p < 0.01, *** p < 0.001, ns: not significant). A549 cells TMRM measurements: Control (90 cells/4 experiments), Control + SKF10047 (114 cells/5 experiments), Control + BD1047 (92 cells/4 experiments). MCF7 cells TMRM measurements: Control (72 cells/4 experiments), Control + SKF10047 (111 cells/4 experiments) and Control + BD1047 (81 cells/4 experiments). A549 cells pyruvate to lactate ratio: Control (69 cells/6 experiments), Control + SKF10047 (60 cells/6 experiments), Control + BD1047 (69 cells/6 experiments), SR1 KD (58 cells/5 experiments), S1R KD + SKF10047 (49 cells/4 experiments) and S1RKD + BD1047 (45 cells/4 experiments). MCF7 cells pyruvate to lactate ratio: Control (54 cells/4 experiments), Control + SKF10047 (52 cells/4 experiments) and Control + BD1047 (53 cells/4 experiments). S1R-mCherry OE in MCF7 cells pyruvate to lactate ratio: Control (65 cells/8 experiments), Control + SKF10047 (83 cells/9 experiments) and Control + BD1047 (49 cells/7 experiments).
![Biomolecules 12 00762 g003]()
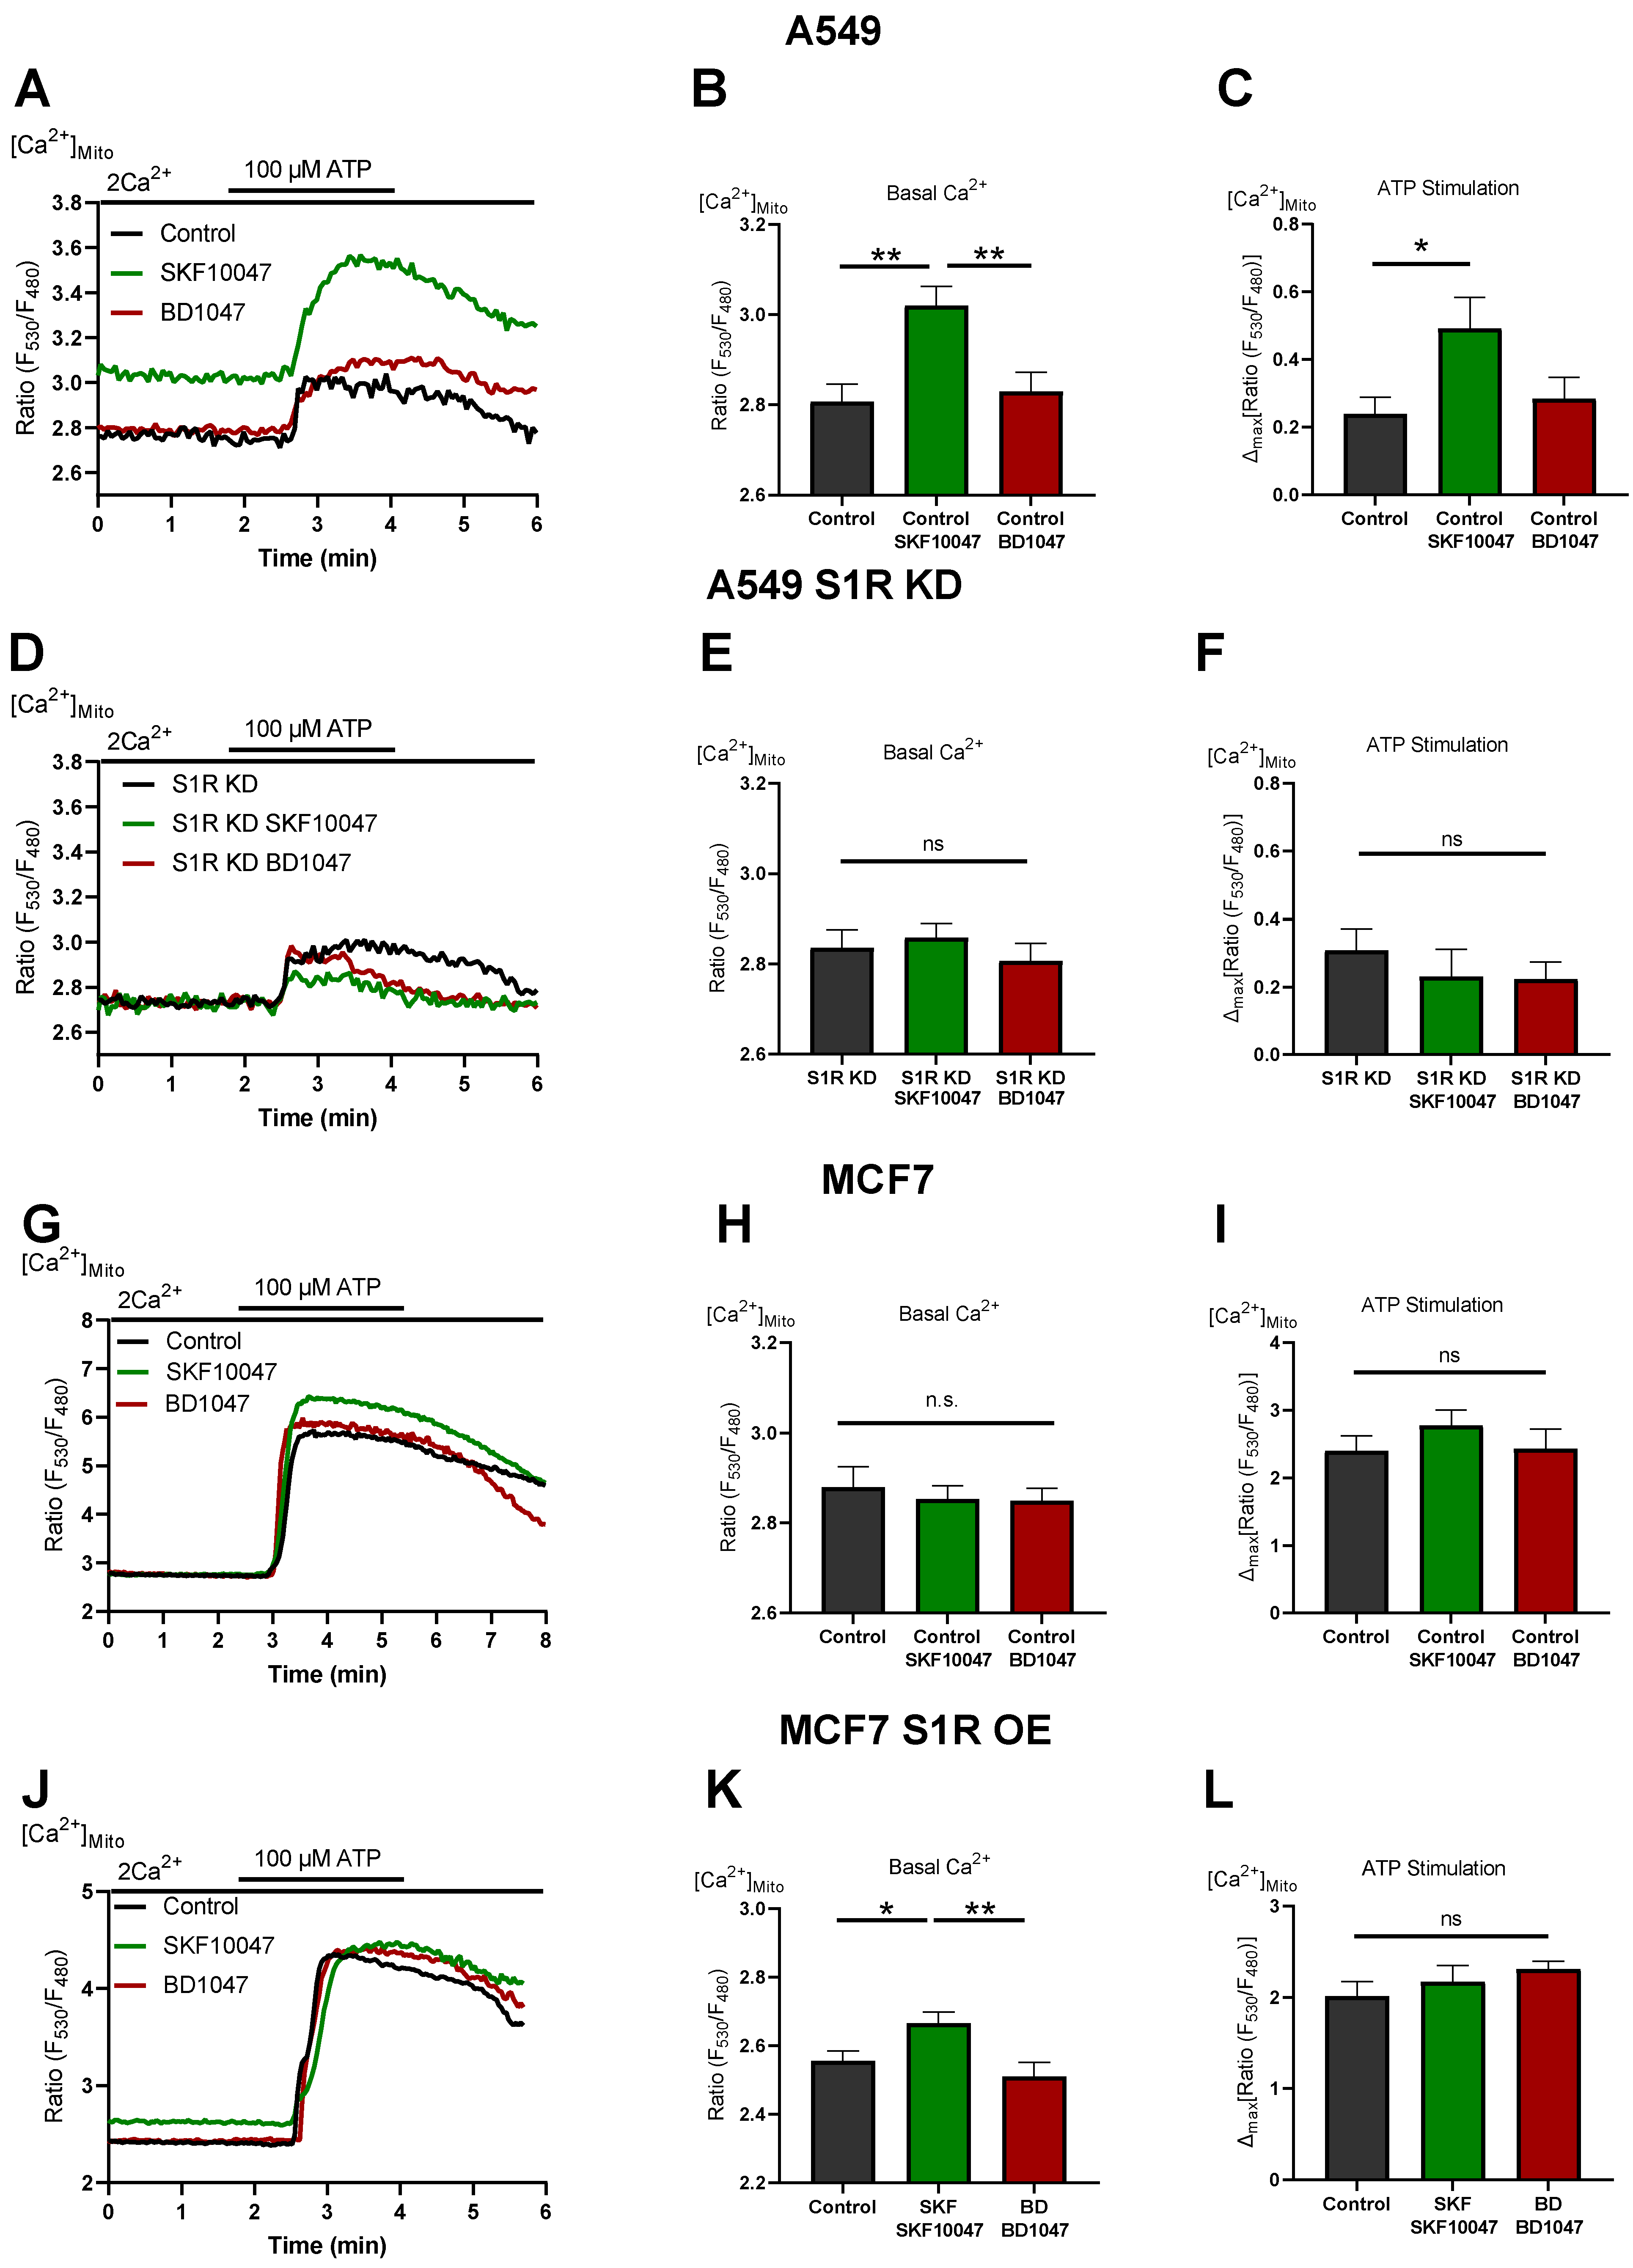
Figure 4.
S1R activation increases basal and agonist-induced mitochondrial Ca2+ uptake. (A) Representative traces of mitochondrial Ca2+ dynamics measured with 4mtD3cpv for control (black), Control+SKF10047 (green) and Control + BD1047 (red) in A549 cells. (B) Bar graphs with MEAN±SEM represent basal mitochondrial Ca2+ level for Control (black), Control+SKF10047 (green) and Control+BD1047 (red) in A549 cells. (C) Bar graphs with MEAN±SEM represent ATP (100 µM) induced mitochondrial Ca2+ uptake for Control (black), Control+SKF10047 (green) and Control+BD1047 (red) in A549 cells. (D) Representative traces of mitochondrial Ca2+ dynamics for S1R KD (black), S1R KD +SKF10047 (green) and S1R KD +BD1047 (red) in A549 cells. (E) Bar graphs with MEAN±SEM represent basal mitochondrial Ca2+ level for S1R KD (black), S1R KD +SKF10047 (green) and S1R KD +BD1047 (red) in A549 cells. (F) Bar graphs with MEAN±SEM represent ATP (100 µM) induced mitochondrial Ca2+ uptake for S1R KD (black), S1R KD +SKF10047 (green) and S1R KD +BD1047 (red) in A549 cells. (G) Representative traces of mitochondrial Ca2+ dynamics for Control (black), Control+SKF10047 (green) and Control+BD1047 (red) in MCF7 cells. (H) Bar graphs with MEAN±SEM represent basal mitochondrial Ca2+ level for Control (black), Control+SKF10047 (green) and Control+BD1047 (red) in MCF7 cells. (I) Bar graphs with MEAN±SEM represent ATP (100 µM) induced mitochondrial Ca2+ uptake for Control (black), Control+SKF10047 (green) and Control+BD1047 (red) in MCF7 cells. (J) Representative traces of mitochondrial Ca2+ dynamics for Control (black), Control+SKF10047 (green) and Control+BD1047 (red) in S1R-mCherry OE MCF7 cells. (K) Bar graphs with MEAN±SEM represent basal mitochondrial Ca2+ level for Control (black), Control+SKF10047 (green) and Control+BD1047 (red) in S1R-mCherry OE MCF7 cells. (L) Bar graphs with MEAN±SEM represent ATP (100 µM) induced mitochondrial Ca2+ uptake for Control (black), Control+SKF10047 (green) and Control+BD1047 (red) in S1R-mCherry OE MCF7 cells. Cells were treated with BD1047 and SKF10047 2–4 h prior to each experiment. Significant differences were assessed using one-way ANOVA with Tukey’s multiple comparison test and presented as specific p-values (* p < 0.05, ** p < 0.01, ns: not significant). A549 cells basal Ca2+ measurements: Control (44 cells/9 experiments), Control + SKF10047 (44 cells/8 experiments), Control + BD1047 (38 cells/7 experiments), SR1 KD (32 cells/7 experiments), S1R KD + SKF10047 (43 cells/8 experiments) and S1RKD + BD1047 (25 cells/7 experiments). A549 cells ATP stimulation: Control (17 cells/9 experiments), Control + SKF10047 (20 cells/8 experiments), Control + BD1047 (18 cells/7 experiments), SR1 KD (11 cells/7 experiments), S1R KD + SKF10047 (12 cells/8 experiments) and S1RKD + BD1047 (9 cells/7 experiments). MCF7 cells basal Ca2+ measurements: Control (34 cells/3 experiments), Control + SKF10047 (54 cells/5 experiments) and Control + BD1047 (44 cells/4 experiments). MCF7 cells ATP stimulation: Control (16 cells/3 experiments), Control + SKF10047 (18 cells/5 experiments) and Control + BD1047 (20 cells/4 experiments). S1R-mCherry OE MCF7 cells basal Ca2+ measurements: Control (26 cells/6 experiments), Control + SKF10047 (31 cells/6 experiments) and Control + BD1047 (22 cells/6 experiments). S1R-mCherry OE MCF7 cells ATP stimulation: Control (17 cells/6 experiments), Control + SKF10047 (17 cells/6 experiments) and Control + BD1047 (14 cells/6 experiments).
![Biomolecules 12 00762 g004]()


 ,
, 
