Article

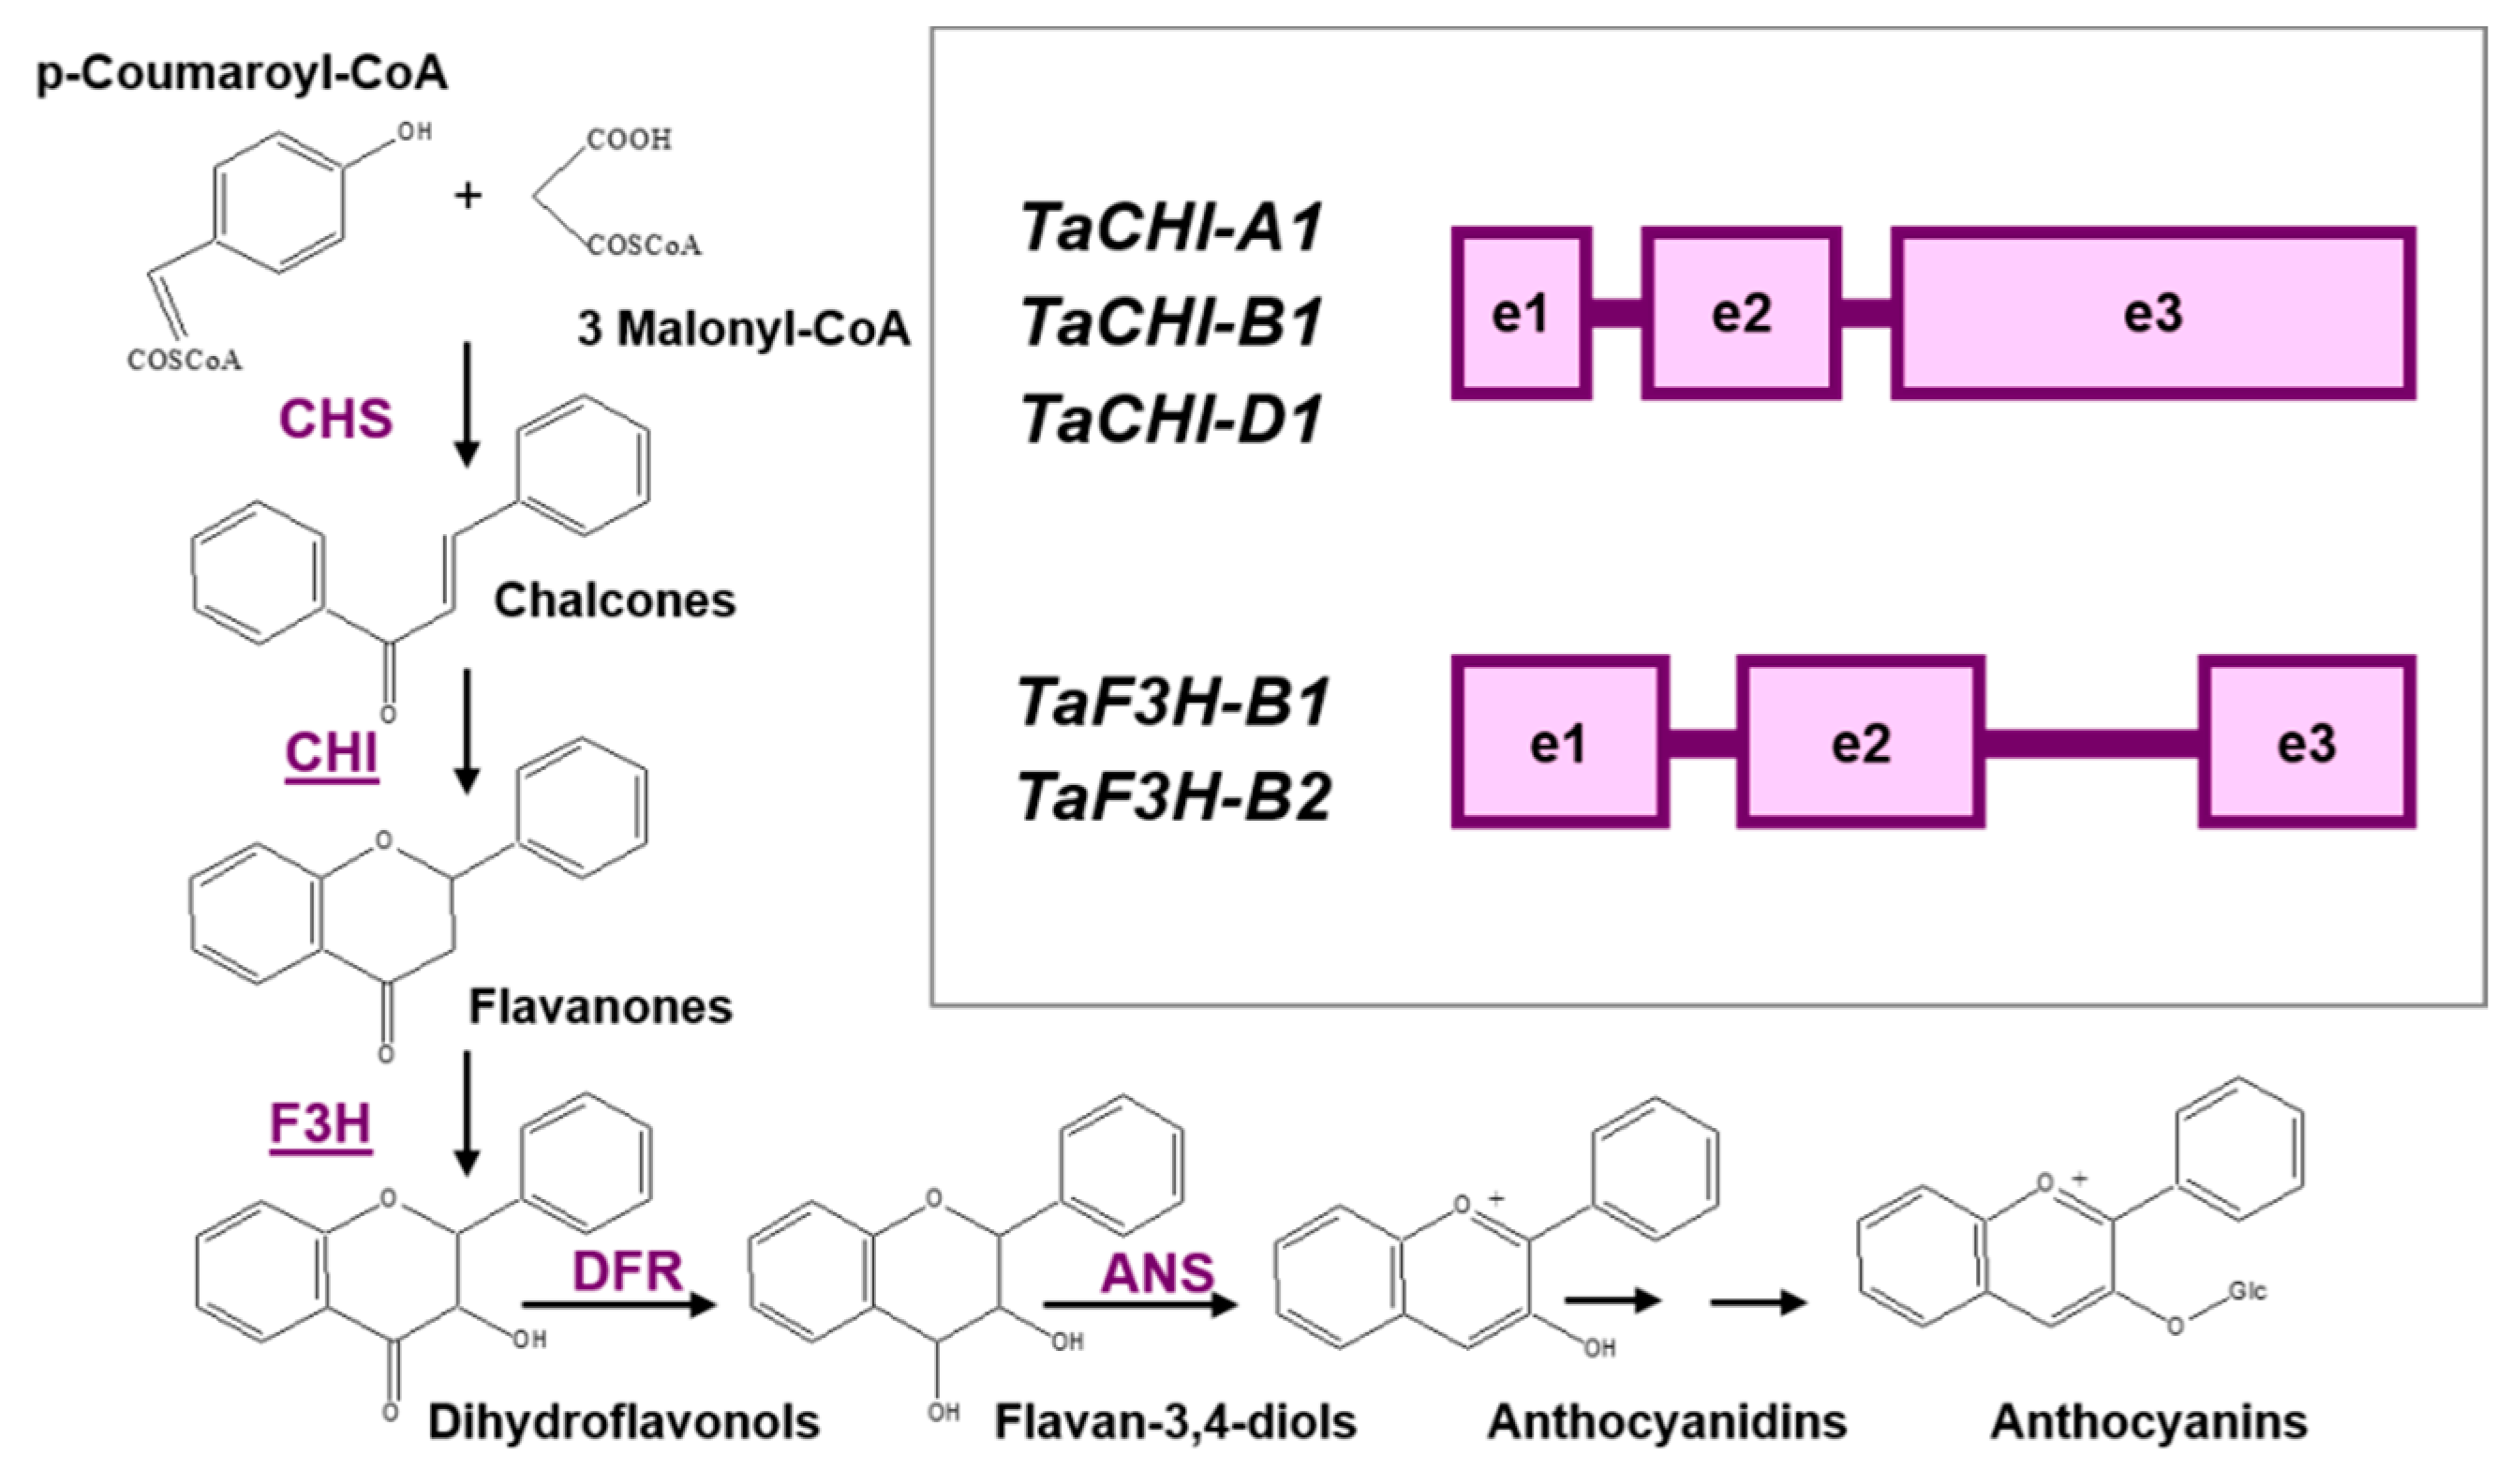
Flavonoid Biosynthesis Genes in Triticum aestivum L.: Methylation Patterns in Cis-Regulatory Regions of the Duplicated CHI and F3H Genes

Postgenomic Studies Laboratory, Federal Research Center N. I. Vavilov All-Russian Institute of Plant Genetic Resources, 190000 St. Petersburg, Russia
*
Author to whom correspondence should be addressed.
Biomolecules 2022, 12(5), 689; https://doi.org/10.3390/biom12050689
Submission received: 21 February 2022 / Revised: 27 April 2022 / Accepted: 28 April 2022 / Published: 11 May 2022
(This article belongs to the Special Issue Molecular-Genetic Bases of Plant Breeding)

Abstract

:
Flavonoids are a diverse group of secondary plant metabolites that play an important role in the regulation of plant development and protection against stressors. The biosynthesis of flavonoids occurs through the activity of several enzymes, including chalcone isomerase (CHI) and flavanone 3-hydroxylase (F3H). A functional divergence between some copies of the structural TaCHI and TaF3H genes was previously shown in the allohexaploid bread wheat Triticum aestivum L. (BBAADD genome). We hypothesized that the specific nature of TaCHI and TaF3H expression may be induced by the methylation of the promoter. It was found that the predicted position of CpG islands in the promoter regions of the analyzed genes and the actual location of methylation sites did not match. We found for the first time that differences in the methylation status could affect the expression of TaCHI copies, but not the expression of TaF3Hs. At the same time, we revealed significant differences in the structure of the promoters of only the TaF3H genes, while the TaCHI promoters were highly homologous. We assume that the promoter structure in TaF3Hs primarily affects the change in the nature of gene expression. The data obtained are important for understanding the mechanisms that regulate the synthesis of flavonoids in allopolyploid wheat and show that differences in the structure of promoters have a key effect on gene expression.

1. Introduction

Many important crop species, including allohexaploid bread wheat (Triticum aestivum L., BBAADD genome, 2n = 6x = 42), have a complex polyploid genome. Regulation of gene expression in polyploid organisms, such as bread wheat, is complicated by the presence of homeologous copies in addition to paralogous ones [1]. This makes polyploid organisms an interesting model for studying regulation of the expression of gene copies, including the effect of DNA methylation [2,3,4,5,6].
Flavonoids, including anthocyanins, are a diverse group of phenolic plant metabolites. Flavonoids act as plant pigments that can stain tissues with various shades of reddish-purple, blue, and pink [7]. However, a significant proportion of flavonoid compounds are colorless.
Flavonoid biosynthesis is one of the most fully described metabolic pathways in plants [7,8]. Biosynthesis of the flavonoid compounds anthocyanidins, precursors of anthocyanin pigments, requires the activity of seven enzymes: chalcone synthase (CHS), chalcone isomerase (CHI), flavanone 3-hydroxylase (F3H), flavonoid 3′-hydroxylase (F3′H), flavonoid 3′,5′-hydroxylase (F3’5’H), dihydroflavonol 4-reductase (DFR), and anthocyanidin synthase (ANS, also known as LDOX: leucoanthocyanidin reductase) (Figure 1). Enzymes belonging to the classes of methyltransferases (MT) and acyltransferases (AT) convert anthocyanidins into anthocyanins.
The sequences of key structural genes and their copies were identified in the flavonoid biosynthesis pathway within the T. aestivum genome [9,10,11,12,13,14,15,16,17,18,19]. Previously, we showed the functional divergence between three CHI copies (TaCHI-A1, TaCHI-B1, and TaCHI-D1) and four F3H copies (TaF3H-A1, TaF3H-B1, TaF3H-B2, and TaF3H-D1) in T. aestivum (Figure 1 and Figure 2) [15,16,18]. The RT-PCR demonstrated that TaCHI-A1 and TaCHI-D1 were strongly expressed in the coleoptile and roots, while TaCHI-B1 was strongly expressed in the coleoptile and weakly in the roots. TaF3H-B2 was particularly expressed in wheat roots, unlike the TaF3H-A1, TaF3H-B1, and TaF3H-D1 genes; their expression was absent in the roots but occurred in various other plant parts, including the coleoptile (Figure 2). The relative expression level of each copy in different wheat tissues was not measured due to the high identity of gene sequences (copies had over 96% identity) [15,17,20,21,22,23,24]. Nevertheless, it was shown that the total TaCHI expression in shoots was higher than in roots, while the TaF3H-1 genes had higher expression in the anthocyanin-colored coleoptile compared to the colorless one, and the TaF3H-1 and TaCHI expression in seedlings increased under salinity stress [10,21,25]. However, the regulation mechanisms for tissue-specific expression of these gene copies have been poorly studied.
We hypothesized in this study that the specific nature of the expression manifested by individual copies of the flavonoid biosynthesis genes TaCHIs and TaF3Hs may be related to the difference in methylation patterns of the same copies in different tissues. The homeologous TaCHI-A1, TaCHI-B1, and TaCHI-D1, and paralogous TaF3H-B1 and TaF3H-B2 genes, were selected to test this hypothesis. We predicted possible sites of methylation and compared these with the actual location of 5mC in two organs of T. aestivum, in which a significant change in the expression level of TaCHI and TaF3H genes was previously shown. We also compared whether methylation coincides with the binding sites of key transcription factors. The obtained results provide better understanding of the tissue-specific regulation of gene expression in T. aestivum.

2. Materials and Methods

2.1. Plant Material, DNA Isolation, and Sodium Bisulfite Treatment

The plant material used in this study included the allohexaploid wheat (T. aestivum) cultivar ‘Saratovskaya 29′. To isolate DNA from the coleoptile and roots, 15 wheat seeds were germinated in a Rubarth Apparate climate chamber (RUMED, Lostorf, Switzerland) on wet filter paper with a 12-hour photoperiod with LEDs plant growth (RUMED, Lostorf, Switzerland) at 20 °C. Total genomic DNA was isolated from the coleoptile (weak anthocyanin coloration) and roots (absence of pigmentation) (Figure 2) using the DNeasy Plant Mini Kit (QIAGEN, Hilden, Germany) on the fifth day after germination. The EpiTect Fast Bisulfite Kit (QIAGEN, Hilden, Germany) was used to treat 1 μg of the genomic DNA from each sample with sodium bisulfite according to the manufacturer’s instructions.

2.2. In Silico Promoter Analysis, and Primers’ Design

The TaCHI-A1 (GenBank: JN039037), TaCHI-B1 (GenBank: JN039038), TaCHI-D1 (GenBank: JN039039), TaF3H-B1 (GenBank: AB223025), and TaF3H-B2 (GenBank: JN384122) nucleotide sequences were aligned using Clustal Omega and Multalin Multiple Sequence alignment [25,26]. The available promoter sequences were analyzed with New PLACE (Tsukuba, Japan) [27] and PlantPAN 3.0 (Tainan, Taiwan) [28,29,30]. Prediction of CpG islands and primer designing were carried out using MethPrimer 2.0 (Beijing, China) and Oligo Primer Analysis Software v7 (Colorado Springs, Colorado, USA) [31,32]. The primers were designed against cytosine-converted sequences. The sequences of primers used in the study are listed in Table 1.

2.3. PCR, Electrophoretic Analysis, Extraction, and Purification

DNA amplification was performed in 20 μL of PCR mixture with 70 ng of the DNA template, 1 ng of each primer, and HotStarTaq DNA Polymerase (QIAGEN, Hilden, Germany) according to the manufacturer’s instructions. After initial denaturation at 94 °C for 15 min, 35 cycles were implemented at 94 °C for 1 min, 50–55 °C for 1 min, and 72 °C for 2 min, followed by a final elongation step at 72 °C for 5 min. Electrophoretic analysis was performed in 1% agarose gel (HydraGene, Co. Ltd., Piscataway, NJ, USA) prepared on a TAE buffer (40 mM Tris-HCl, pH 8.0; 20 mM sodium acetate; 1 mM EDTA) with ethidium bromide. Amplified fragments were isolated from agarose gel using the MinElute Gel Extraction Kit (QIAGEN, Hilden, Germany).

2.4. Cloning and Sequencing the Amplified PCR Fragments

The amplified PCR products were cloned for each sample using the PCR Cloning Kit (QIAGEN) and Escherichia coli (Migula 1895) Castellani and Chalmers 1919 XL-1 Blue competent cells (Evrogen, Moscow, Russia). Plasmid DNA was isolated using the “diaGene” kit (DIA-M, Moscow, Russia) according to the manufacturer’s instructions. Plasmid DNA of 10 positive clones for each PCR product was amplified in both directions using M13 primers. DNA sequencing was performed using the BigDye™ Terminator v3.1 Cycle Sequencing Kit (Applied Biosystems™, Waltham, Massachusetts, USA) and the SB RAS Genomics core facilities (Novosibirsk, Russia). All sequences obtained were deposited in GenBank (NCBI): TaCHI-A1-coleoptile MZ826579-MZ826588, TaCHI-A1-root MZ826589-MZ826598, TaCHI-B1-coleoptile MZ826599-MZ826608, TaCHI-B1-root MZ826609-MZ826618, TaCHI-D1-coleoptile MZ826619-MZ826628, TaCHI-D1-root MZ826629-MZ826638, TaF3H-B1-coleoptile MZ826639-MZ826648, TaF3H-B1-root MZ826649-MZ826658, TaF3H-B2-coleoptile MZ826659-MZ826668, and TaF3H-B2-root MZ826669-MZ826678.

3. Results

3.1. Prediction of CpG Islands

CpG islands are DNA regions with a high frequency of CpG dinucleotides. We predicted possible sites of CpG methylation for the TaCHI and TaF3H genes in silico (Supplementary Materials). The sequences of TaCHI genes with promoters were used for the analysis (TaCHI-A1 JN039037, TaCHI-B1 JN039038, and TaCHI-D1 JN039039). The gene promoters were aligned and compared (Supplementary Materials). The analyzed regions approximated 1600 bp; about 600 bp of them were highly homologous promoter sequences. The presence of two islands was predicted for all TaCHIs. In the TaCHI-A1 gene, Island 1 was in the promoter, and Island 2 captured the end of the promoter, the first exons, and the middle of the 1st intron. Unlike TaCHI-A1, Island 1 in the TaCHI-B1 and TaCHI-D1 genes ended at the 1st exon and Island 2 started on the 1st intron (Supplementary Materials).
The promoters and exons of the TaF3H genes (TaF3H-B1 AB223025, and TaF3H-B2 JN384122) differed in length and structure [14]. Thus, the length of the analyzed regions in TaF3H-B1 and TaF3H-B2 also differed. We used the gene sequences with promoters for the analysis, and we found four CpG islands in TaF3H-B1 and three in TaF3H-B2 (Supplementary Materials). Island 1 in TaF3H-B1 started in the middle of the promoter, while the other three islands were in the gene body. Island 1 in TaF3H-B2 started 15 bp before the 1st exon; Islands 2 and 3 corresponded to Islands 3 and 4 in TaF3H-B1, respectively. The difference in the number of islands caused the differences in the structure of promoters (Supplementary Materials).

3.2. Analysis of Promoters

In addition to the basic motifs, like CAAT and CGCG boxes, the analysis of promoter elements for the TaCHI and TaF3H genes revealed motifs responsible for light-dependent activation (yellow) as well as TF-dependent elements required for genes involved in the biosynthesis of flavonoid compounds (red), tissue-specific (green), and stress-specific elements (blue) (Supplementary Materials). The most representative elements were DOF, MYB, and MYC/bHLH. Among the light-dependent elements, only the TaCHI genes had SORLIP motifs (Sequences Over-Represented in Light-Induced Promoters). Among the stress-specific elements, the motifs for dehydration response were most typical for the TaCHI genes, and the reaction to heavy metals for TaF3H-B2. The TaF3H-B2 promoter also stood out for the abundance of pollen-specific motifs. The TaCHI genes had multiple root-specific motifs (Supplementary Materials).

3.3. DNA Methylation in the Promoters of the TaCHI and TaF3H Genes

We developed specific primers for the promoters of each analyzed gene (Table 1) in order to verify the presence of CpG islands in the cis-regulatory regions and identify differences in methylation of regulatory elements. The TaCHI-D1 gene, strongly expressed in the coleoptile and roots, was completely unmethylated both in the coleoptile and in the roots (Figure 3, Table 2).
In the TaCHI-A1 gene (Table 2), strongly expressed in the coleoptile and roots, we detected large amounts of individual DNA methylation marks both at the CpG and non-CpG sites from the beginning of Island 2 to the beginning of the 1st exon (Figure 3, Supplementary Materials). Contrariwise, in the TaCHI-B1 gene (Table 2), strongly expressed in the coleoptile and weakly in the roots, we found stable DNA methylation marks in the roots, but not in the coleoptile, at the beginning of the analyzed region (Figure 3). The marks did not correspond to the predicted islands (Supplementary Materials). Methylation detected in both TaCHI-A1 and TaCHI-B1 was affected mostly the MYB TF recognition sites, light-induced elements, and stress-responsive ones (Table 3).
Analyzing the methylation patterns in the TaF3H genes disclosed many methylation marks in Island 1 in the promoter of the TaF3H-B1 gene (expressed in different plant parts, except roots) and few marks in Island 1 in the promoter of the TaF3H-B2 gene (particularly expressed in the roots) (Figure 4, Table 2). The detected methylation affected mostly bZIP and MYB TF recognition sites, and hormone- and stress-responsive elements (Table 3). However, almost no differences were observed for both TaF3H-B1 and TaF3H-B2 in the DNA extracted from roots or coleoptiles.

4. Discussion

Biological processes are implemented under the control of the spatial and temporal gene expression determined with high accuracy. Regulation of gene expression is an important aspect in the life of all organisms, therefore its adaptation in the context of evolution is especially significant [33,34,35]. Numerous sequential changes, including gene duplication, are a necessary part of such adaptation. For example, duplication of genes encoding TFs, followed by the structural and functional divergence of the obtained copies, makes an essential contribution to the development of transcription regulatory networks [2,35,36,37,38]. The redundancy provided by duplicated genes could contribute to the adaptation of species and genetic resistance to changes in environmental conditions [3].
Normalization of the gene dose occurs due to genetic and epigenetic changes. Methylation in the 5’-region of the gene (including the promoter and part of the transcribed region) and the 3’-region (including part of the transcribed region and 3’-flanking sequences) could inhibit gene expression [39,40,41]. It has been suggested that methylation in the promoter region inhibits the binding of regulatory proteins and, as a consequence, the transcription, while methylation within introns and exons correlates with highly expressed genes [41,42,43]. For example, among three homeologous copies of the LEAFY HULL STERILE1 (WLHS1) gene of the allohexaploid bread wheat T. aestivum, one gene lost its functionality due to a mutation in the functional domain, the other copy was not transcribed due to hypermethylation, and only the third gene retained its functionality [44].
Generally, cytosine methylation makes a universal contribution to the growth and development of eukaryotic cells through the regulation of gene activity. In this study, we decided to find what was hidden behind the functional divergence of TaCHI and TaF3H gene copies in T. aestivum. We assumed that the cause was the tissue-specific gene expression associated with differences in the promoter structure and the methylation pattern.
Previously, it was shown that TaCHIs were expressed in different parts of wheat independently of the coloration, even though in some intensively colored organs a certain increase in the gene expression can be observed [15]. The promoter structure of TaCHI-B1 was insignificantly different from that of TaCHI-A1 or TaCHI-D1, with the presence of additional MYB-recognition elements and G-box (ACE: ACGT-containing element) [15]. These differences, together with the identified stable methylation marks, are likely to be the cause of a decreased gene expression in roots (Figure 3b, Supplementary Materials). MYB TFs are known to serve as key regulators for the synthesis of flavonoids in various plant organs [21,38,45,46,47,48]. Methylation in TaCHI-B1 was stable and appeared in all clones at the beginning of the analyzed region. We assume that this site may be critical for a decrease in the level of gene expression, especially because this region contains MYB-binding domains.
The results obtained for the TaCHI-A1 gene imply that the presence of methylation marks in the promoter and the 1st exon in two clones did not affect the gene expression (Figure 3a). Nevertheless, Shoeva et al. (2014b) noticed that in cv. ‘Saratovskaya 29′ with weak anthocyanin pigmentation of the coleoptile (which coincides with the genotype studied here), the expression of TaCHI-A1 was weaker than in the near-isogenic line (NILs) ‘i:S29Pp1Pp2’ with strong anthocyanin pigmentation of the coleoptile. This difference could be explained by the presence of the dominant flavonoid biosynthesis regulator gene TaMyc-A1 (encoding MYC/bHLH TF) in the NILs, which led to a purple color change in many parts of the plant [49,50].
Four copies of the gene encoding F3H were previously identified in wheat. Three copies (TaF3H-A1, TaF3H-B1, and TaF3H-D1) resulted from allopolyploidization of the wheat genome. These genes are co-transcribed and localized in the syntenic regions of chromosomes 2A, 2B, and 2D, showing high similarity in the structure of the coding regions and promoters [9]. The fourth copy (TaF3H-B2) is a paralogous copy in chromosome 2B, differing in structure and transcriptional activity [14].
The presence of a paralogous copy of F3H in wheat and in some of its relatives is unique among plants. Comparison between TaF3H-B2 and TaF3H-1 copies indicates that conservative amino acid residues are still present in TaF3H-B2; they are necessary for the formation of the enzyme’s active sites [14,51]. However, the fact that TaF3H-B2 is not transcribed during the biosynthesis of anthocyanins, but is transcribed in wheat roots, suggests that TaF3H-B2 probably participates in the biosynthesis of other flavonoid compounds (while the TaF3H-1 genes do exactly the opposite).
Khlestkina et al. (2013) and the present study demonstrated a significant difference in the structure of TaF3H-1 and TaF3H-2 promoters. For TaF3H-B1, active methylation both in the coleoptile and roots mainly affected the TF and stress-responsive elements and did not affect MYB-binding sites near the ATG start codon (Figure 4, Supplementary Materials). Moreover, only one type of the light-dependent element GATABOX, required for high-level and tissue-specific gene expression, was methylated (Table 3). We assume that, since the remaining light-dependent elements and TF binding sites were not methylated, the expression of TaF3H-B1 is possible in the coleoptile under the studied conditions.
It was previously reported that TaF3H-1 was expressed only in colored tissues and not expressed in colorless ones, such as the uncolored pericarp or roots of ‘Saratovskaya 29′ [52]. Other structural genes, such as TaCHS, TaCHI, TaDFR, or TaANS, were transcribed in the absence of anthocyanin pigments, but at a lower level than in intensively colored tissues. The lack of this gene’s expression in the pericarp and roots coincided with the pattern of TaMyc-A1 expression, suggesting that the TaF3H-1 genes are the key structural genes that determine the origin of anthocyanin biosynthesis and the main targets of TF [50]. The features associated with the regulation of expression or substrate specificity of TaF3H-B2 have not yet been studied. The weak methylation status in both the coleoptile and roots as well as single changes in the promoter methylation pattern could not be the cause of the difference in TaF3H-B2 activity (Figure 4, Table 3). According to the results of this study, differences in the promoter structure and TF specificity should lead to tissue-specific expression of these genes.
Thus, we assume that DNA methylation, divergence of promoter sequences, and gene expression regulation together underpin the specific pattern of the duplicated TaCHI and TaF3H genes in T. aestivum.

Supplementary Materials

Supporting information can be downloaded from: https://www.mdpi.com/article/10.3390/biom12050689/s1. Supplementary Section S1: The alignment of TaCHI promoters; Supplementary Section S2: The alignment of TaF3H promoters; Supplementary Section S3: CpG island prediction in promoters of TaCHI and TaF3H genes made with MethPrimer 2.0; Supplementary Section S4: The alignment of TaCHI promoter sequences and assembled promoter sequences after bisulfite treatment; Supplementary Section S5: Results of the signal scan search request in promoters of TaCHI and TaF3H genes made with New PLACE and PlantPAN 3.0.

Author Contributions

K.S. performed all molecular-genetic and in silico experiments, contributed to data interpretation, and participated in the drafting of the manuscript. E.K. contributed to the conception and design of the study, data interpretation, and critical revision of the manuscript. All authors have read and agreed to the published version of the manuscript.

Funding

This work was funded by the Russian Science Foundation, No. 21-66-00012.

Institutional Review Board Statement

Not applicable.

Informed Consent Statement

Not applicable.

Data Availability Statement

Not applicable.

Conflicts of Interest

The authors declare no conflict of interest.

References

  1. Glover, N.M.; Redestig, H.; Dessimoz, C. Homoeologs: What Are They and How Do We Infer Them? Trends Plant Sci. 2016, 21, 609–621. [Google Scholar] [CrossRef] [Green Version]
  2. Chen, Z.J. Genetic and Epigenetic Mechanisms for Gene Expression and Phenotypic Variation in Plant Polyploids. Annu. Rev. Plant Biol. 2007, 58, 377–406. [Google Scholar] [CrossRef] [PubMed] [Green Version]
  3. Chen, Z.J.; Birchler, J.A. Polyploid and Hybrid Genomics; Chen, Z.J., Birchler, J.A., Eds.; John Wiley & Sons, Inc.: Oxford, UK, 2013; ISBN 9781118552872. [Google Scholar]
  4. Kaufmann, K.; Pajoro, A.; Angenent, G.C. Regulation of transcription in plants: Mechanisms controlling developmental switches. Nat. Rev. Genet. 2010, 11, 830–842. [Google Scholar] [CrossRef] [PubMed]
  5. Gardiner, L.-J.; Quinton-Tulloch, M.; Olohan, L.; Price, J.; Hall, N.; Hall, A. A genome-wide survey of DNA methylation in hexaploid wheat. Genome Biol. 2015, 16, 273. [Google Scholar] [CrossRef] [Green Version]
  6. Yuan, J.; Jiao, W.; Liu, Y.; Ye, W.; Wang, X.; Liu, B.; Song, Q.; Chen, Z.J. Dynamic and reversible DNA methylation changes induced by genome separation and merger of polyploid wheat. BMC Biol. 2020, 18, 171. [Google Scholar] [CrossRef]
  7. Winkel-Shirley, B. Flavonoid Biosynthesis. A Colorful Model for Genetics, Biochemistry, Cell Biology, and Biotechnology. Plant Physiol. 2001, 126, 485–493. [Google Scholar] [CrossRef] [Green Version]
  8. Strygina, K.V. Synthesis of Flavonoid Pigments in Grain of Representatives of Poaceae: General Patterns and Exceptions in N.I. Vavilov’s Homologous Series. Russ. J. Genet. 2020, 56, 1345–1358. [Google Scholar] [CrossRef]
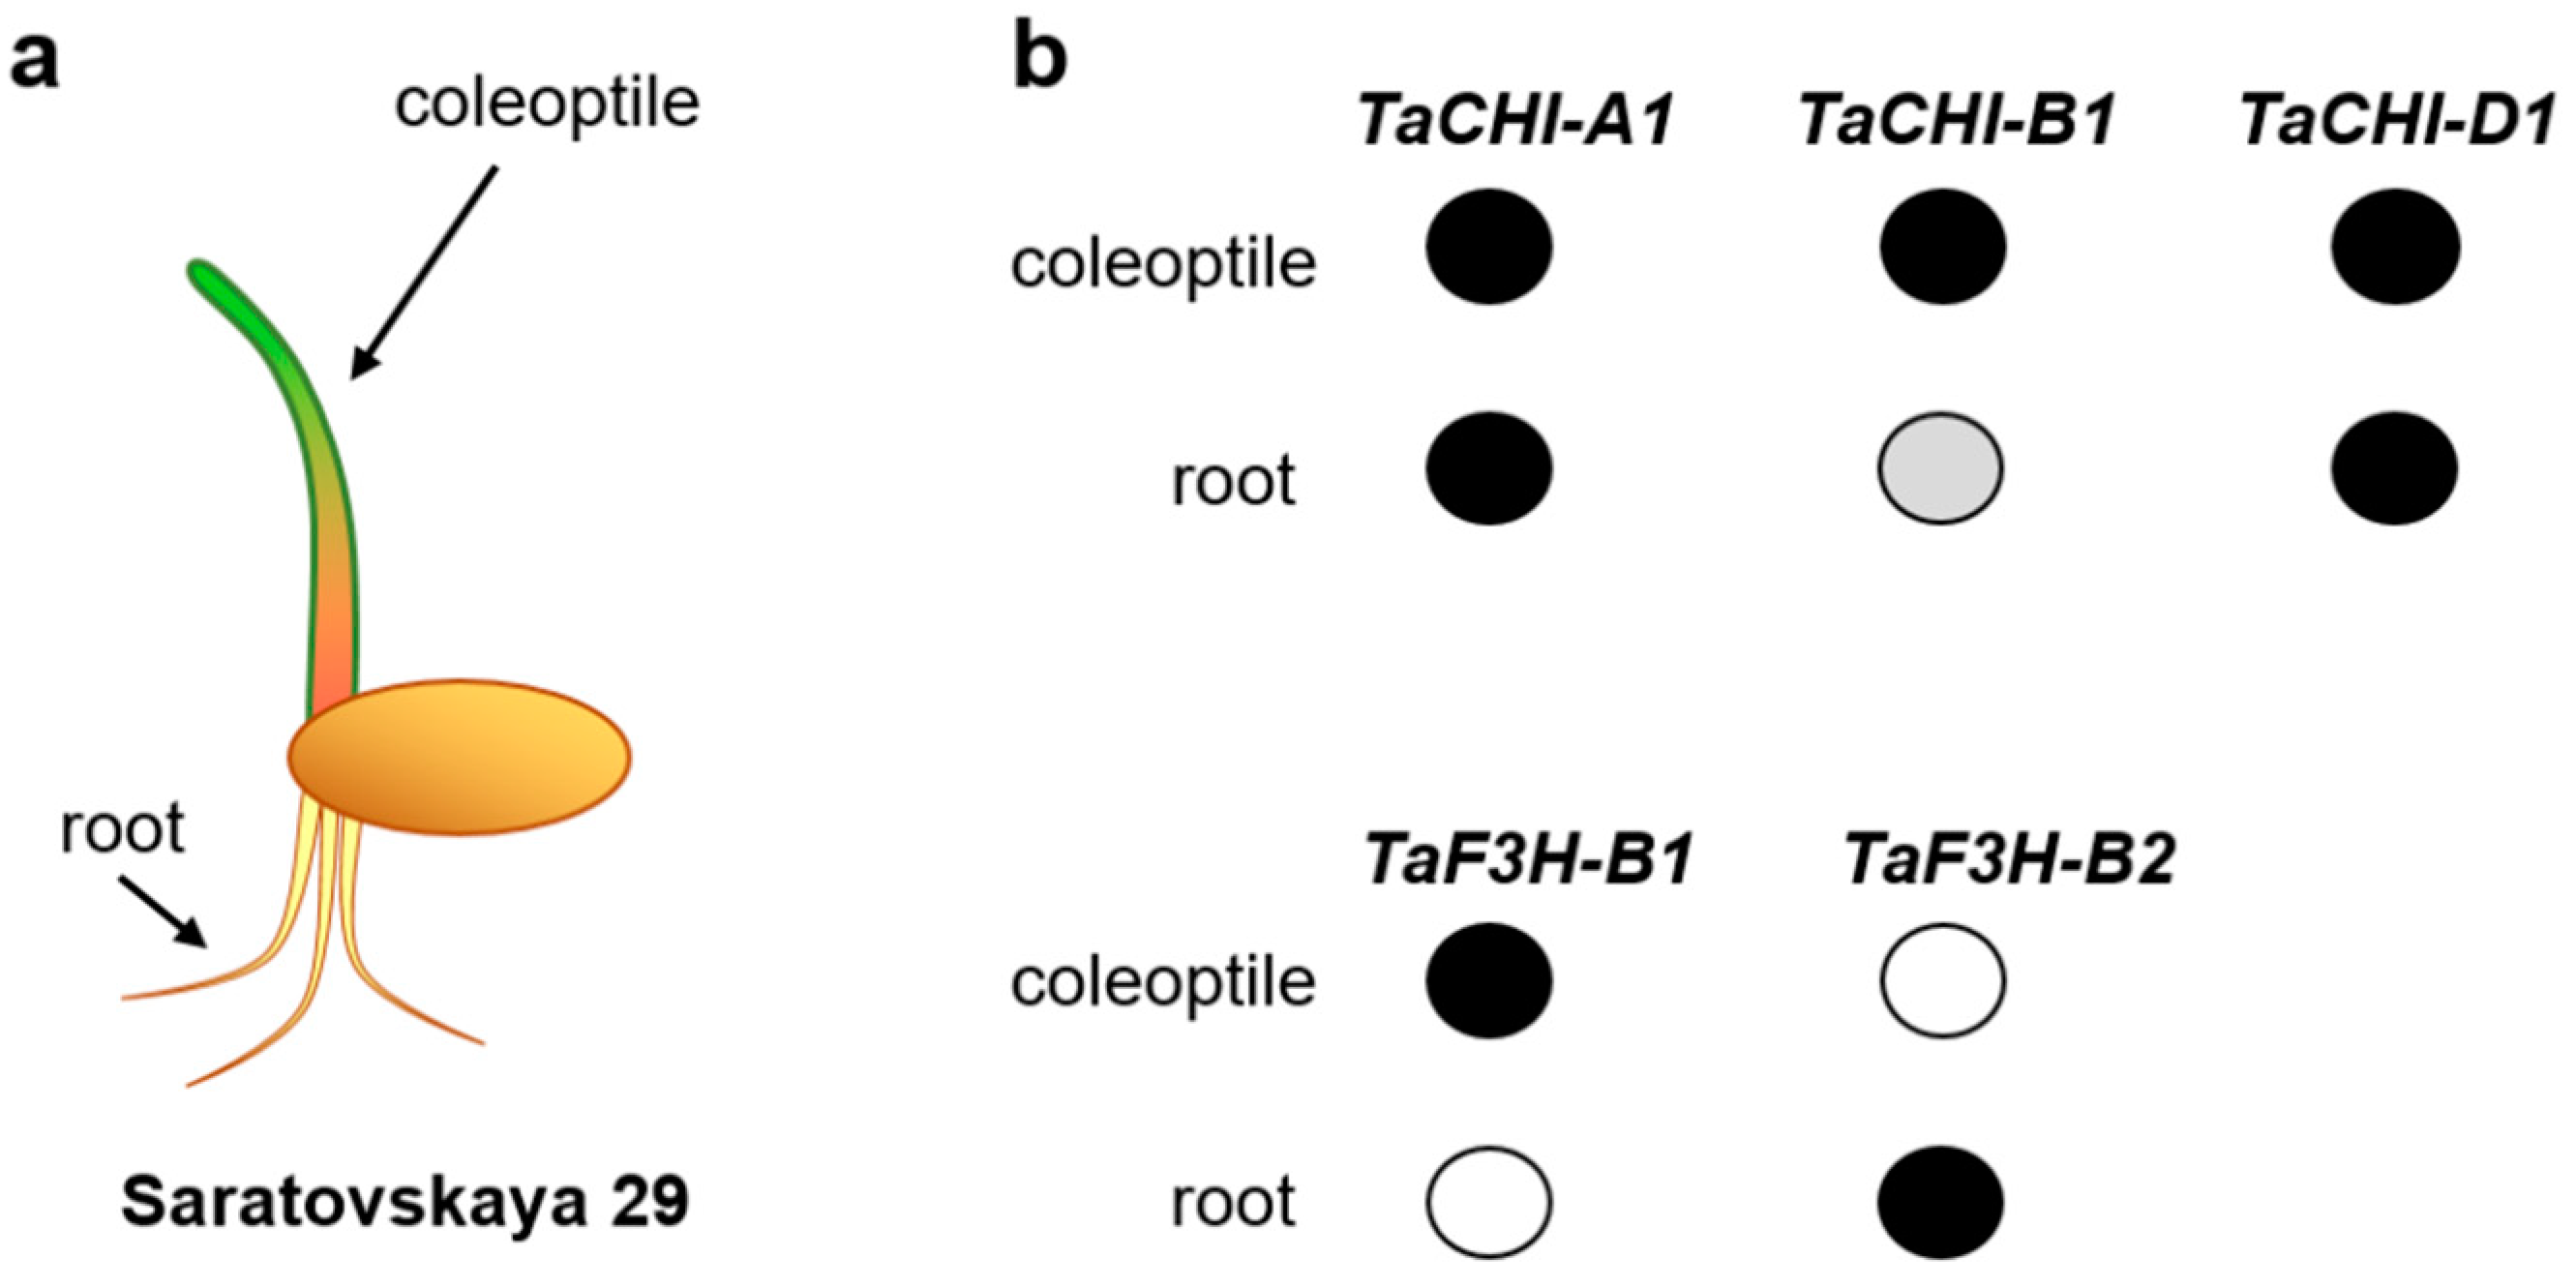
  9. Himi, E.; Maekawa, M.; Noda, K. Differential Expression of Three Flavanone 3-Hydroxylase Genes in Grains and Coleoptiles of Wheat. Int. J. Plant Genomics 2011, 2011, 1–11. [Google Scholar] [CrossRef] [PubMed] [Green Version]
  10. Himi, E.; Noda, K. Isolation and location of three homoeologous dihydroflavonol-4-reductase (DFR) genes of wheat and their tissue-dependent expression. J. Exp. Bot. 2004, 55, 365–375. [Google Scholar] [CrossRef]
  11. Glagoleva, A.Y.; Ivanisenko, N.V.; Khlestkina, E.K. Organization and evolution of the chalcone synthase gene family in bread wheat and relative species. BMC Genet. 2019, 20, 30. [Google Scholar] [CrossRef] [Green Version]
  12. Khlestkina, E.K.; Röder, M.S.; Salina, E.A. Relationship between homoeologous regulatory and structural genes in allopolyploid genome—A case study in bread wheat. BMC Plant Biol. 2008, 8, 88. [Google Scholar] [CrossRef] [PubMed] [Green Version]
  13. Khlestkina, E.K.; Tereshchenko, O.Y.; Salina, E.A. Anthocyanin biosynthesis genes location and expression in wheat–rye hybrids. Mol. Genet. Genomics 2009, 282, 475. [Google Scholar] [CrossRef] [PubMed]
  14. Khlestkina, E.K.; Dobrovolskaya, O.B.; Leonova, I.N.; Salina, E.A. Diversification of the Duplicated F3h Genes in Triticeae. J. Mol. Evol. 2013, 76, 261–266. [Google Scholar] [CrossRef] [PubMed]
  15. Shoeva, O.Y.; Khlestkina, E.K.; Berges, H.; Salina, E.A. The homoeologous genes encoding chalcone–flavanone isomerase in Triticum aestivum L.: Structural characterization and expression in different parts of wheat plant. Gene 2014, 538, 334–341. [Google Scholar] [CrossRef] [PubMed]
  16. Yang, G.H.; Li, B.; Gao, J.W.; Liu, J.Z.; Zhao, X.Q.; Zheng, Q.; Tong, Y.P.; Li, Z.S.; Yang, G.H.; Li, B.; et al. Cloning and expression of two chalcone synthase and a flavonoid 3’5’-hydroxylase 3’-end cDNAs from developing seeds of blue-grained wheat involved in anthocyanin biosynthetic pathway. Acta Bot. Sin. 2004, 46, 588–594. [Google Scholar]
  17. Shoeva, O.Y.; Khlestkina, E.K. F3h gene expression in various organs of wheat. Mol. Biol. 2013, 47, 901–903. [Google Scholar] [CrossRef]
  18. Khlestkina, E. The adaptive role of flavonoids: Emphasis on cereals. Cereal Res. Commun. 2013, 41, 185–198. [Google Scholar] [CrossRef]
  19. Himi, E.; Taketa, S. Barley Ant17, encoding flavanone 3-hydroxylase (F3H), is a promising target locus for attaining anthocyanin/proanthocyanidin-free plants without pleiotropic reduction of grain dormancy. Genome 2015, 58, 43–53. [Google Scholar] [CrossRef]
  20. Shoeva, O.Y.; Dobrovolskaya, O.B.; Leonova, I.N.; Salina, E.A.; Khlestkina, E.K. The B-, G- and S-genomic Chi genes in family Triticeae. Biol. Plant. 2016, 60, 279–284. [Google Scholar] [CrossRef]
  21. Jiang, W.; Liu, T.; Nan, W.; Jeewani, D.C.; Niu, Y.; Li, C.; Wang, Y.; Shi, X.; Wang, C.; Wang, J.; et al. Two transcription factors TaPpm1 and TaPpb1 co-regulate anthocyanin biosynthesis in purple pericarps of wheat. J. Exp. Bot. 2018, 69, 2555–2567. [Google Scholar] [CrossRef] [Green Version]
  22. Presinszka, M.; Stiasna, K.; Vyhnanek, T.; Trojan, V.; Schweiger, W.; Bartos, J.A.N.; Havel, L. Primer efficiency determination for flavanone 3-hydroxylase gene in wheat (Triticum aestivum L.). In Proceedings of the International Ph.D. Students Conference on MendelNet 2014At: At Fac Agron, Brno, Czech Republic, 19–20 November 2014; pp. 469–473. [Google Scholar]
  23. Liu, D.; Li, S.; Chen, W.; Zhang, B.; Liu, D.; Liu, B.; Zhang, H. Transcriptome Analysis of Purple Pericarps in Common Wheat (Triticum aestivum L.). PLoS ONE 2016, 11, e0155428. [Google Scholar] [CrossRef] [PubMed] [Green Version]
  24. Wang, X.; Zhang, X.; Hou, H.; Ma, X.; Sun, S.; Wang, H.; Kong, L. Metabolomics and gene expression analysis reveal the accumulation patterns of phenylpropanoids and flavonoids in different colored-grain wheats (Triticum aestivum L.). Food Res. Int. 2020, 138, 109711. [Google Scholar] [CrossRef] [PubMed]
  25. Sievers, F.; Wilm, A.; Dineen, D.; Gibson, T.J.; Karplus, K.; Li, W.; Lopez, R.; McWilliam, H.; Remmert, M.; Söding, J.; et al. Fast, scalable generation of high-quality protein multiple sequence alignments using Clustal Omega. Mol. Syst. Biol. 2011, 7, 539. [Google Scholar] [CrossRef] [PubMed]
  26. Corpet, F. Multiple sequence alignment with hierarchical clustering. Nucleic Acids Res. 1988, 16, 10881–10890. [Google Scholar] [CrossRef]
  27. Higo, K.; Ugawa, Y.; Iwamoto, M.; Korenaga, T. Plant cis-acting regulatory DNA elements (PLACE) database: 1999. Nucleic Acids Res. 1999, 27, 297–300. [Google Scholar] [CrossRef] [Green Version]
  28. Chang, W.-C.; Lee, T.-Y.; Huang, H.-D.; Huang, H.-Y.; Pan, R.-L. PlantPAN: Plant promoter analysis navigator, for identifying combinatorial cis-regulatory elements with distance constraint in plant gene groups. BMC Genomics 2008, 9, 561. [Google Scholar] [CrossRef] [Green Version]
  29. Chow, C.-N.; Zheng, H.-Q.; Wu, N.-Y.; Chien, C.-H.; Huang, H.-D.; Lee, T.-Y.; Chiang-Hsieh, Y.-F.; Hou, P.-F.; Yang, T.-Y.; Chang, W.-C. PlantPAN 2.0: An update of plant promoter analysis navigator for reconstructing transcriptional regulatory networks in plants. Nucleic Acids Res. 2016, 44, D1154–D1160. [Google Scholar] [CrossRef] [Green Version]
  30. Chow, C.-N.; Lee, T.-Y.; Hung, Y.-C.; Li, G.-Z.; Tseng, K.-C.; Liu, Y.-H.; Kuo, P.-L.; Zheng, H.-Q.; Chang, W.-C. PlantPAN3.0: A new and updated resource for reconstructing transcriptional regulatory networks from ChIP-seq experiments in plants. Nucleic Acids Res. 2019, 47, D1155–D1163. [Google Scholar] [CrossRef] [Green Version]
  31. Li, L.-C.; Dahiya, R. MethPrimer: Designing primers for methylation PCRs. Bioinformatics 2002, 18, 1427–1431. [Google Scholar] [CrossRef] [Green Version]
  32. Rychlik, W. OLIGO 7 primer analysis software. Methods Mol. Biol. 2007, 402, 35–59. [Google Scholar] [CrossRef]
  33. Gu, Z.; Rifkin, S.A.; White, K.P.; Li, W.-H. Duplicate genes increase gene expression diversity within and between species. Nat. Genet. 2004, 36, 577–579. [Google Scholar] [CrossRef] [PubMed] [Green Version]
  34. Teichmann, S.A.; Babu, M.M. Gene regulatory network growth by duplication. Nat. Genet. 2004, 36, 492–496. [Google Scholar] [CrossRef]
  35. Voordeckers, K.; Pougach, K.; Verstrepen, K.J. How do regulatory networks evolve and expand throughout evolution? Curr. Opin. Biotechnol. 2015, 34, 180–188. [Google Scholar] [CrossRef] [PubMed] [Green Version]
  36. Strygina, K.V.; Khlestkina, E.K. Myc-like transcriptional factors in wheat: Structural and functional organization of the subfamily I members. BMC Plant Biol. 2019, 19, 50. [Google Scholar] [CrossRef] [PubMed]
  37. Strygina, K.V.; Börner, A.; Khlestkina, E.K. Identification and characterization of regulatory network components for anthocyanin synthesis in barley aleurone. BMC Plant Biol. 2017, 17, 184. [Google Scholar] [CrossRef] [Green Version]
  38. Strygina, K.V.; Khlestkina, E.K. Structural and functional divergence of the Mpc1 genes in wheat and barley. BMC Evol. Biol. 2019, 19, 45. [Google Scholar] [CrossRef]
  39. Gehring, M.; Henikoff, S. DNA methylation dynamics in plant genomes. Biochim. Biophys. Acta-Gene Struct. Expr. 2007, 1769, 276–286. [Google Scholar] [CrossRef]
  40. Zilberman, D.; Gehring, M.; Tran, R.K.; Ballinger, T.; Henikoff, S. Genome-wide analysis of Arabidopsis thaliana DNA methylation uncovers an interdependence between methylation and transcription. Nat. Genet. 2007, 39, 61–69. [Google Scholar] [CrossRef]
  41. Bewick, A.J.; Schmitz, R.J. Gene body DNA methylation in plants. Curr. Opin. Plant Biol. 2017, 36, 103–110. [Google Scholar] [CrossRef] [Green Version]
  42. Zhang, X.; Yazaki, J.; Sundaresan, A.; Cokus, S.; Chan, S.W.L.; Chen, H.; Henderson, I.R.; Shinn, P.; Pellegrini, M.; Jacobsen, S.E.; et al. Genome-wide High-Resolution Mapping and Functional Analysis of DNA Methylation in Arabidopsis. Cell 2006, 126, 1189–1201. [Google Scholar] [CrossRef] [Green Version]
  43. To, T.K.; Saze, H.; Kakutani, T. DNA Methylation within Transcribed Regions. Plant Physiol. 2015, 168, 1219–1225. [Google Scholar] [CrossRef] [PubMed] [Green Version]
  44. Shitsukawa, N.; Tahira, C.; Kassai, K.-I.; Hirabayashi, C.; Shimizu, T.; Takumi, S.; Mochida, K.; Kawaura, K.; Ogihara, Y.; Murai, K. Genetic and Epigenetic Alteration among Three Homoeologous Genes of a Class E MADS Box Gene in Hexaploid Wheat. Plant Cell 2007, 19, 1723–1737. [Google Scholar] [CrossRef] [PubMed] [Green Version]
  45. Paz-Ares, J.; Ghosal, D.; Wienand, U.; Peterson, P.A.; Saedler, H. The regulatory c1 locus of Zea mays encodes a protein with homology to myb proto-oncogene products and with structural similarities to transcriptional activators. EMBO J. 1987, 6, 3553. [Google Scholar] [CrossRef]
  46. Himi, E.; Taketa, S. Isolation of candidate genes for the barley Ant1 and wheat Rc genes controlling anthocyanin pigmentation in different vegetative tissues. Mol. Genet. Genomics 2015, 290, 1287–1298. [Google Scholar] [CrossRef] [PubMed]
  47. Shoeva, O.Y.; Kukoeva, T.V.; Börner, A.; Khlestkina, E.K. Barley Ant1 is a homolog of maize C1 and its product is part of the regulatory machinery governing anthocyanin synthesis in the leaf sheath. Plant Breed. 2015, 134, 400–405. [Google Scholar] [CrossRef]
  48. Shin, D.H.; Choi, M.-G.; Kang, C.-S.; Park, C.-S.; Choi, S.-B.; Park, Y.-I. A wheat R2R3-MYB protein PURPLE PLANT1 (TaPL1) functions as a positive regulator of anthocyanin biosynthesis. Biochem. Biophys. Res. Commun. 2016, 469, 686–691. [Google Scholar] [CrossRef] [PubMed]
  49. Gordeeva, E.I.; Shoeva, O.Y.; Khlestkina, E.K. Marker-assisted development of bread wheat near-isogenic lines carrying various combinations of purple pericarp (Pp) alleles. Euphytica 2015, 203, 469–476. [Google Scholar] [CrossRef]
  50. Shoeva, O.; Gordeeva, E.; Khlestkina, E. The Regulation of Anthocyanin Synthesis in the Wheat Pericarp. Molecules 2014, 19, 20266–20279. [Google Scholar] [CrossRef] [Green Version]
  51. Sharma, A.; Punetha, A.; Grover, A.; Sundar, D. Insights into the key enzymes of secondary metabolites biosynthesis in Camellia sinensis. J. Bioinforma. Seq. Anal. 2010, 2, 53–68. [Google Scholar]
  52. Tereshchenko, O.Y.; Arbuzova, V.S.; Khlestkina, E.K. Allelic state of the genes conferring purple pigmentation in different wheat organs predetermines transcriptional activity of the anthocyanin biosynthesis structural genes. J. Cereal Sci. 2013, 57, 10–13. [Google Scholar] [CrossRef]
Figure 1. Scheme of the anthocyanin biosynthesis pathway. The rectangle shows the exon-intron structure of the TaCHI-A1, TaCHI-B1 and TaCHI-D1, plus TaF3H-B1 and TaF3H-B2 genes of bread wheat (T. aestivum). Enzymes: ANS—anthocyanidin synthase; CHI—chalcone-flavanone isomerase; CHS—chalcone synthase; DFR—dihydroflavonol 4-reductase; F3H—flavanone 3-hydroxylase.
Biomolecules 12 00689 g001
Figure 2. (a) A germinating grain of the wheat cultivar ‘Saratovskaya 29′. (b) Expression of the TaCHI-A1, TaCHI-B1 and TaCHI-D1, plus TaF3H-B1 and TaF3H-B2 genes in ‘Saratovskaya 29′. The data concerning (1) TaCHIs expression were obtained using RT-PCR by [15], and (2) TaF3Hs expression were obtained using RT-PCR by [17]. The black circle means strong expression, the grey circle means weak expression, and the white circle means no expression.
Biomolecules 12 00689 g002
Figure 3. Methylation patterns of promoter regions for the (a) TaCHI-A1 gene (799 bp), (b) TaCHI-B1 (923 bp), and (c) TaCHI-D1 (715 bp) in the wheat coleoptile and roots. Arrows indicate the primers. Vertical red strokes are the predicted methylation sites. Vertical green strokes are the detected non-canonical methylation sites. Red circles mark the detected methylation site.
Biomolecules 12 00689 g003
Figure 4. Methylation patterns of promoter regions for the (a) TaF3H-B1 (737 bp) and (b) TaF3H-B2 (598 bp) genes in the wheat coleoptile and roots. Arrows indicate the primers. Vertical red strokes are the predicted methylation sites. Vertical green strokes are the detected non-canonical methylation sites. Red circles mark the detected methylation sites.
Biomolecules 12 00689 g004
Table 1. Gene-specific primers used for amplification of the TaCHI and TaF3H genes in the present study. R—purine (A, G), Y—pyrimidine (C, T).
GeneForward PrimerReverse PrimerPCR Product Length (bp)Annealing Temperature (°C)
TaCHI-A15′ TTATTAATTAAGTAGAAAAGAATTGTTTAGTTAA 3′5′ TAAAAACRTAATTAATAATAATTAAAAAAAACAC 3′37450
5′ GTTTTTGYGTGAGTTGAATGGTAG 3′5′ ACRAAATAATCAACTAAAATAATAATACC 3′29850
5′ GGAGAGGGTATTATTATTTTAGTTG 3′5′ AAACCRTTAACTAAATAATCACCTAC 3′27350
TaCHI-B15′ TTTGATTATTGTTATTTTTATTTTAAATATGTATGT 3′5′ ATATAAAAACRTAATTAATAATAATTAAAAAAAACA 3′43650
5′ TYGTAGGGTGGTTTTTTTTGAGA 3′5′ TAACRAACAAACACTTATATTAATAAAAC 3′46450
5′ AGTTGTTGYGGTGTTATATAGGG 3′5′ ACCAAATACRTTAAAACAAAATCTAAAATC 3′34353
TaCHI-D15′ TATATTTTATAAGGTGGTTTTTTTAATTTTGTTGAG 3′5′ TAAAAACRTAATTAATAATAATTAAAAAAAACAC 3′32053
5′ GTGYGTGAGTTGAATGGTAGTTTG 3′5′ TAATAATACRTACCCCCCCTATATAACACC 3′29455
5′ GYGTAGGTTAGAGAATTAGATTAG 3′5′ AAATAAACRTACTCRAAACCCRAC 3′32650
TaF3H-B15′ ATGATGTATAGGTTTTAGATATTGGG 3′5′ ATATACRCACAACACACACATCAC 3′40053
5′ ATATGAGYGTTTGTATTTGGATTGTG 3′5′ CTCRTATAATAATTTATTCCTTAATAAAAAACTC 3′36553
5′ TAAAYGGTYGAGTTTTTTATTAAGGAATAAATTATT 3′5′ TCRAAAAAAACRTCTCGTTACTCACC 3′12553
TaF3H-B25′ GYGAGTTTAGATGGTTAGATATTTTTTGT 3′5′ CACTAAATAAACATCACCAAAAAATCTAAAAT 3′41053
5′ TTATTTTAGATTTTTTGGTGATGTTTATTTA 3′5′ AAACAAAAACATCCTATTACTCAC 3′22250
Table 2. The number of methylation sites in the TaCHI and TaF3H genes. The table shows the ratio of the number of the identified methylated sites to the total number of potential CpG, CpHpG, and CpHpH sites in the sequenced E. coli colonies.
GeneTissueMethylation Sites in Colonies
CpGCpHpGCpHpH
TaCHI-A1coleoptile0/60 in 100/54 in 100/125 in 10
root0/60 in 8
11/60 in 2
0/54 in 8
7/54 in 2
0/125 in 8
15/125 in 2
TaCHI-B1coleoptile0/50 in 100/42 in 100/118 in 10
root7/50 in 102/42 in 101/118 in 10
TaCHI-D1coleoptile0/44 in 100/46 in 100/112 in 10
root0/44 in 100/46 in 100/112 in 10
TaF3H-B1coleoptile25/59 in 4
26/59 in 6
4/41 in 4
5/41 in 1
7/41 in 4
8/41 in 1
12/72 in 2
13/72 in 1
14/72 in 1
18/72 in 1
25/72 in 2
26/72 in 2
27/72 in 1
root25/59 in 4
26/59 in 6
5/41 in 2
7/41 in 8
17/72 in 1
18/72 in 1
24/72 in 3
25/72 in 5
TaF3H-B2coleoptile0/12 in 6
1/12 in 1
3/12 in 1
4/12 in 3
0/13 in 6
2/13 in 4
0/76 in 6
3/76 in 1
4/76 in 3
root0/12 in 7
4/12 in 3
0/13 in 7
2/13 in 3
0/76 in 7
6/76 in 3
Table 3. Methylation status of regulatory motifs in the TaCHIs and TaF3Hs promoter sequences. R = A/G, Y = C/T, K = G/T, W = T/A, V = A/C/G, B = G/T/C, N = A/T/G/C.
Methylation Status
GeneMotif NameSequenceFunctionReferenceColeoptileRoot
TaCHI-A1ABRELATERD1ACGTGElement required for etiolation-induced expression of the gene responsive to dehydrationS000414-+
ACGTATERD1 ACGT Sequence required for etiolation-induced expression S000415-+
CBFHVRYCGACDehydration-responsive element S000497-+
CGACGOSAMY3CGACGCoupling element for the G box elementS000205-+
CGCGBOXATVCGCGBElement in promoters of many genesS000501-+
CRTDREHVCBF2 GTCGAC Core CRT/DRE motifS000411-+
HEXAMERATH4 CCGTCG Hexamer motif of the Arabidopsis thaliana histone H4 promoterS000146-+
MYBCORECNGTTRBinding site for animal and plant MYB proteinsS000176-+
SORLIP2ATGGGCCSequences over-represented in light-induced promotersS000483-+
SURECOREATSULTR11GAGACCore of sulfur-responsive elementS000499-+
TaCHI-B1CBFHVRYCGACDehydration-responsive element S000497-+
DRECRTCOREATRCCGACCore motif of a dehydration-responsive element/C-repeat cis-acting elementS000418-+
LTRECOREATCOR15CCGACCore of low temperature-responsive elementS000153-+
MYB2CONSENSUSATYAACKGMYB recognition site S000409-+
MYBCORECNGTTRBinding site for animal and plant MYB proteinsS000176-+
MYBCOREATCYCB1AACGGMyb coreS000502-+
PALBOXAPCCCGTCCBox AS000137-+
TaF3H-B1ABRELATERD1ACGTGElement required for etiolation-induced expression of the gene responsive to dehydrationS000414++
ABRERATCALMACGYGB“Repeated sequence motifs” identified DE in the upstream regions of Ca(2+)-responsive upregulated DE genesS000507++
ARFATTGTCTCARF (auxin response factor) binding site found in the promoters DE of primary/early auxin response genes in Arabidopsis thalianaS000270++
ACGTATERD1ACGTSequence required for etiolation-induced expressionS000415++
CBFHVRYCGACDehydration-responsive element S000497++
CGACGOSAMY3CGACGCoupling element for the G box elementS000205++
CGCGBOXATVCGCGBElement in promoters of many genesS000501++
CRTDREHVCBF2GTCGACCore CRT/DRE motifS000411++
CURECORECRGTACCore of a copper-response elementS000493++
DOFCOREZMAAAGCore site required for binding of DofS000265++
DPBFCOREDCDC3ACACNNGBinding core sequence of f-bZIP transcription factorsS000292++
GATABOXGATAMotif required for high-level, light-regulated, and tissue-specific expressionS000039++
LTRE1HVBLT49CCGAAALow-temperature-responsive elementS000250++
MYBCOREATCYCB1AACGGMyb coreS000502++
MYBST1GGATACore motif of MYB binding siteS000180++
NODCON2GMCTCTTPutative nodulin consensus sequencesS000462++
OSE2ROOTNODULECTCTTOne of the consensus sequence motifs of organ-specific elements DE (OSE) characteristic of the promoters activated in infected cells DE of root nodulesS000468++
RHERPATEXPA7KCACGWRight part of RHEs (Root Hair-specific cis-Elements)S000512++
SEBFCONSSTPR10AYTGTCWCBinding site of the potato silencing element binding factor DE (SEBF) gene found in the promoter of the pathogenesis-related gene DE (PR-10a)S000391++
SURECOREATSULTR11GAGACCore of sulfur-responsive elementS000499++
TaF3H-B2CURECORECRGTACCore motif of a CuRE (copper-response element)S000493++
DPBFCOREDCDC3ACACNNGbZIP transcription factor binding core sequenceS000292-+
ERELEE4AWTTCAAAEthylene responsive elementS000037+-
GATABOXGATAMotif required for high-level, light-regulated, and tissue-specific expressionS000039++
REALPHALGLHCB21AACCAAMotif required for phytochrome regulation; the DNA binding activity is high in etiolated plantsS000362++
RHERPATEXPA7KCACGWRight part of RHEs S000512-+
Publisher’s Note: MDPI stays neutral with regard to jurisdictional claims in published maps and institutional affiliations.

