
Distribution of Charged Residues Affects the Average Size and Shape of Intrinsically Disordered Proteins

 ,
,  , ,
, ,  ,
,  and
and 
Abstract
:
1. Introduction
2. Materials and Methods
2.1. Gene Design and Cloning
2.2. Production and Purification of κ Variants
2.3. Bioinformatics Analysis
2.4. Far-UV Circular Dichroism (CD) Spectroscopy
2.5. Analytical SEC
2.6. Native MS Analyses
2.7. Application of Ellipsoid Model
3. Results
3.1. Design of Model IDPs by Permutation of Charged Residues
3.2. Impact of Charge Clustering on the Rh of the Model IDPs
3.3. Impact of Charge Clustering on the Conformational Ensemble of the Model IDPs
3.4. Average Shape of the Model IDPs
4. Discussion
5. Conclusions
Supplementary Materials
Author Contributions
Funding
Institutional Review Board Statement
Informed Consent Statement
Data Availability Statement
Acknowledgments
Conflicts of Interest
References
- Uversky, V.N. Intrinsically Disordered Proteins and Their “Mysterious” (Meta) Physics. Front. Phys. 2019, 7, 10. [Google Scholar] [CrossRef] [Green Version]
- Theillet, F.-X.; Kalmar, L.; Tompa, P.; Han, K.-H.; Selenko, P.; Dunker, A.K.; Daughdrill, G.W.; Uversky, V.N. The Alphabet of Intrinsic Disorder: I. Act like a Pro: On the Abundance and Roles of Proline Residues in Intrinsically Disordered Proteins. Intrinsically Disord. Proteins 2013, 1, e24360. [Google Scholar] [CrossRef] [PubMed] [Green Version]
- Ruff, K.M. Predicting Conformational Properties of Intrinsically Disordered Proteins from Sequence. In Intrinsically Disordered Proteins; Kragelund, B.B., Skriver, K., Eds.; Methods in Molecular Biology; Springer US: New York, NY, USA, 2020; Volume 2141, pp. 347–389. ISSN 978-1-07-160523-3. [Google Scholar]
- Mao, A.H.; Crick, S.L.; Vitalis, A.; Chicoine, C.L.; Pappu, R.V. Net Charge per Residue Modulates Conformational Ensembles of Intrinsically Disordered Proteins. Proc. Natl. Acad. Sci. USA 2010, 107, 8183–8188. [Google Scholar] [CrossRef] [PubMed] [Green Version]
- Das, R.K.; Pappu, R.V. Conformations of Intrinsically Disordered Proteins Are Influenced by Linear Sequence Distributions of Oppositely Charged Residues. Proc. Natl. Acad. Sci. USA 2013, 110, 13392–13397. [Google Scholar] [CrossRef] [Green Version]
- Sawle, L.; Ghosh, K. A Theoretical Method to Compute Sequence Dependent Configurational Properties in Charged Polymers and Proteins. J. Chem. Phys. 2015, 143, 085101. [Google Scholar] [CrossRef] [PubMed]
- Das, R.K.; Huang, Y.; Phillips, A.H.; Kriwacki, R.W.; Pappu, R.V. Cryptic Sequence Features within the Disordered Protein p27 Kip1 Regulate Cell Cycle Signaling. Proc. Natl. Acad. Sci. USA 2016, 113, 5616–5621. [Google Scholar] [CrossRef] [Green Version]
- Beveridge, R.; Migas, L.G.; Das, R.K.; Pappu, R.V.; Kriwacki, R.W.; Barran, P.E. Ion Mobility Mass Spectrometry Uncovers the Impact of the Patterning of Oppositely Charged Residues on the Conformational Distributions of Intrinsically Disordered Proteins. J. Am. Chem. Soc. 2019, 141, 4908–4918. [Google Scholar] [CrossRef] [Green Version]
- Tedeschi, G.; Salladini, E.; Santambrogio, C.; Grandori, R.; Longhi, S.; Brocca, S. Conformational Response to Charge Clustering in Synthetic Intrinsically Disordered Proteins. Biochim. Et Biophys. Acta Gen. Subj. 2018, 1862, 2204–2214. [Google Scholar] [CrossRef]
- Sherry, K.P.; Das, R.K.; Pappu, R.V.; Barrick, D. Control of Transcriptional Activity by Design of Charge Patterning in the Intrinsically Disordered RAM Region of the Notch Receptor. Proc. Natl. Acad. Sci. USA 2017, 114, E9243–E9252. [Google Scholar] [CrossRef] [Green Version]
- Uversky, V.N. What Does It Mean to Be Natively Unfolded?: Natively Unfolded Proteins. Eur. J. Biochem. 2002, 269, 2–12. [Google Scholar] [CrossRef]
- Schramm, A.; Bignon, C.; Brocca, S.; Grandori, R.; Santambrogio, C.; Longhi, S. An Arsenal of Methods for the Experimental Characterization of Intrinsically Disordered Proteins—How to Choose and Combine Them? Arch. Biochem. Biophys. 2019, 676, 108055. [Google Scholar] [CrossRef] [PubMed]
- Kodera, N.; Noshiro, D.; Dora, S.K.; Mori, T.; Habchi, J.; Blocquel, D.; Gruet, A.; Dosnon, M.; Salladini, E.; Bignon, C.; et al. Structural and Dynamics Analysis of Intrinsically Disordered Proteins by High-Speed Atomic Force Microscopy. Nat. Nanotechnol. 2021, 16, 181–189. [Google Scholar] [CrossRef] [PubMed]
- Gomes, G.-N.W.; Krzeminski, M.; Namini, A.; Martin, E.W.; Mittag, T.; Head-Gordon, T.; Forman-Kay, J.D.; Gradinaru, C.C. Conformational Ensembles of an Intrinsically Disordered Protein Consistent with NMR, SAXS, and Single-Molecule FRET. J. Am. Chem. Soc. 2020, 142, 15697–15710. [Google Scholar] [CrossRef] [PubMed]
- Müller-Späth, S.; Soranno, A.; Hirschfeld, V.; Hofmann, H.; Rüegger, S.; Reymond, L.; Nettels, D.; Schuler, B. Charge Interactions Can Dominate the Dimensions of Intrinsically Disordered Proteins. Proc. Natl. Acad. Sci. USA 2010, 107, 14609–14614. [Google Scholar] [CrossRef] [Green Version]
- Corti, R.; Marrano, C.A.; Salerno, D.; Brocca, S.; Natalello, A.; Santambrogio, C.; Legname, G.; Mantegazza, F.; Grandori, R.; Cassina, V. Depicting Conformational Ensembles of α-Synuclein by Single Molecule Force Spectroscopy and Native Mass Spectroscopy. Int. J. Mol. Sci. 2019, 20, 5181. [Google Scholar] [CrossRef] [Green Version]
- Santambrogio, C.; Natalello, A.; Brocca, S.; Ponzini, E.; Grandori, R. Conformational Characterization and Classification of Intrinsically Disordered Proteins by Native Mass Spectrometry and Charge-State Distribution Analysis. Proteomics 2019, 19, 1800060. [Google Scholar] [CrossRef]
- Li, J.; Santambrogio, C.; Brocca, S.; Rossetti, G.; Carloni, P.; Grandori, R. Conformational Effects in Protein Electrospray-Ionization Mass Spectrometry: Native Protein Esi-Ms. Mass Spec. Rev. 2016, 35, 111–122. [Google Scholar] [CrossRef]
- Konijnenberg, A.; van Dyck, J.F.; Kailing, L.L.; Sobott, F. Extending Native Mass Spectrometry Approaches to Integral Membrane Proteins. Biol. Chem. 2015, 396, 991–1002. [Google Scholar] [CrossRef]
- Kaltashov, I.A.; Bobst, C.E.; Abzalimov, R.R. Mass Spectrometry-Based Methods to Study Protein Architecture and Dynamics: MS-Based Methods to Study Protein Architecture and Dynamics. Protein Sci. 2013, 22, 530–544. [Google Scholar] [CrossRef] [Green Version]
- Mehmood, S.; Allison, T.M.; Robinson, C.V. Mass Spectrometry of Protein Complexes: From Origins to Applications. Annu. Rev. Phys. Chem. 2015, 66, 453–474. [Google Scholar] [CrossRef]
- Natalello, A.; Santambrogio, C.; Grandori, R. Are Charge-State Distributions a Reliable Tool Describing Molecular Ensembles of Intrinsically Disordered Proteins by Native MS? J. Am. Soc. Mass Spectrom. 2017, 28, 21–28. [Google Scholar] [CrossRef] [PubMed]
- Testa, L.; Brocca, S.; Grandori, R. Charge-Surface Correlation in Electrospray Ionization of Folded and Unfolded Proteins. Anal. Chem. 2011, 83, 6459–6463. [Google Scholar] [CrossRef] [PubMed]
- Hall, Z.; Robinson, C.V. Do Charge State Signatures Guarantee Protein Conformations? J. Am. Soc. Mass Spectrom. 2012, 23, 1161–1168. [Google Scholar] [CrossRef] [PubMed] [Green Version]
- Kaltashov, I.A.; Mohimen, A. Estimates of Protein Surface Areas in Solution by Electrospray Ionization Mass Spectrometry. Anal. Chem. 2005, 77, 5370–5379. [Google Scholar] [CrossRef] [PubMed] [Green Version]
- Wu, H.; Zhang, R.; Zhang, W.; Hong, J.; Xiang, Y.; Xu, W. Rapid 3-Dimensional Shape Determination of Globular Proteins by Mobility Capillary Electrophoresis and Native Mass Spectrometry. Chem. Sci. 2020, 11, 4758–4765. [Google Scholar] [CrossRef]
- Longhi, S.; Receveur-Bréchot, V.; Karlin, D.; Johansson, K.; Darbon, H.; Bhella, D.; Yeo, R.; Finet, S.; Canard, B. The C-Terminal Domain of the Measles Virus Nucleoprotein Is Intrinsically Disordered and Folds upon Binding to the C-Terminal Moiety of the Phosphoprotein. J. Biol. Chem. 2003, 278, 18638–18648. [Google Scholar] [CrossRef] [Green Version]
- Habchi, J.; Mamelli, L.; Darbon, H.; Longhi, S. Structural Disorder within Henipavirus Nucleoprotein and Phosphoprotein: From Predictions to Experimental Assessment. PLoS ONE 2010, 5, e11684. [Google Scholar] [CrossRef]
- Yuan, A.; Rao, M.V.; Veeranna; Nixon, R.A. Neurofilaments and Neurofilament Proteins in Health and Disease. Cold Spring Harb. Perspect. Biol. 2017, 9, a018309. [Google Scholar] [CrossRef] [Green Version]
- Herrmann, H.; Aebi, U. Intermediate Filaments: Structure and Assembly. Cold Spring Harb. Perspect. Biol. 2016, 8, a018242. [Google Scholar] [CrossRef]
- Studier, F.W. Protein Production by Auto-Induction in High-Density Shaking Cultures. Protein Expr. Purif. 2005, 41, 207–234. [Google Scholar] [CrossRef]
- Holehouse, A.S.; Das, R.K.; Ahad, J.N.; Richardson, M.O.G.; Pappu, R.V. CIDER: Resources to Analyze Sequence-Ensemble Relationships of Intrinsically Disordered Proteins. Biophys. J. 2017, 112, 16–21. [Google Scholar] [CrossRef] [PubMed] [Green Version]
- Dosztanyi, Z.; Csizmok, V.; Tompa, P.; Simon, I. IUPred: Web Server for the Prediction of Intrinsically Unstructured Regions of Proteins Based on Estimated Energy Content. Bioinformatics 2005, 21, 3433–3434. [Google Scholar] [CrossRef] [PubMed] [Green Version]
- Micsonai, A.; Wien, F.; Bulyáki, É.; Kun, J.; Moussong, É.; Lee, Y.-H.; Goto, Y.; Réfrégiers, M.; Kardos, J. BeStSel: A Web Server for Accurate Protein Secondary Structure Prediction and Fold Recognition from the Circular Dichroism Spectra. Nucleic Acids Res. 2018, 46, W315–W322. [Google Scholar] [CrossRef] [PubMed]
- Irvine, G.B. Determination of Molecular Size by Size-Exclusion Chromatography (Gel Filtration). Curr. Protoc. Cell Biol. 2000, 6, 5.5.1–5.5.16. [Google Scholar] [CrossRef]
- Marsh, J.A.; Forman-Kay, J.D. Sequence Determinants of Compaction in Intrinsically Disordered Proteins. Biophys. J. 2010, 98, 2383–2390. [Google Scholar] [CrossRef] [Green Version]
- Brocca, S.; Testa, L.; Sobott, F.; Šamalikova, M.; Natalello, A.; Papaleo, E.; Lotti, M.; De Gioia, L.; Doglia, S.M.; Alberghina, L.; et al. Compaction Properties of an Intrinsically Disordered Protein: Sic1 and Its Kinase-Inhibitor Domain. Biophys. J. 2011, 100, 2243–2252. [Google Scholar] [CrossRef] [Green Version]
- Sinha, S.K.; Chakraborty, S.; Bandyopadhyay, S. Thickness of the Hydration Layer of a Protein from Molecular Dynamics Simulation. J. Phys. Chem. B 2008, 112, 8203–8209. [Google Scholar] [CrossRef]
- Pal, S.; Bandyopadhyay, S. Effects of Protein Conformational Flexibilities and Electrostatic Interactions on the Low-Frequency Vibrational Spectrum of Hydration Water. J. Phys. Chem. B 2013, 117, 5848–5856. [Google Scholar] [CrossRef]
- Rath, A.; Davidson, A.R.; Deber, C.M. The Structure of ?Unstructured? Regions in Peptides and Proteins: Role of the Polyproline II Helix in Protein Folding and Recognition. Biopolymers 2005, 80, 179–185. [Google Scholar] [CrossRef]
- Dunker, A.K.; Lawson, J.D.; Brown, C.J.; Williams, R.M.; Romero, P.; Oh, J.S.; Oldfield, C.J.; Campen, A.M.; Ratliff, C.M.; Hipps, K.W.; et al. Intrinsically Disordered Protein. J. Mol. Graph. Model. 2001, 19, 26–59. [Google Scholar] [CrossRef] [Green Version]
- Adzhubei, A.A.; Sternberg, M.J.E. Left-Handed Polyproline II Helices Commonly Occur in Globular Proteins. J. Mol. Biol. 1993, 229, 472–493. [Google Scholar] [CrossRef] [PubMed]
- Berman, H.M. The Protein Data Bank. Nucleic Acids Res. 2000, 28, 235–242. [Google Scholar] [CrossRef] [PubMed] [Green Version]
- Sickmeier, M.; Hamilton, J.A.; LeGall, T.; Vacic, V.; Cortese, M.S.; Tantos, A.; Szabo, B.; Tompa, P.; Chen, J.; Uversky, V.N.; et al. DisProt: The Database of Disordered Proteins. Nucleic Acids Res. 2007, 35, D786–D793. [Google Scholar] [CrossRef] [PubMed] [Green Version]
- Piovesan, D.; Tabaro, F.; Mičetić, I.; Necci, M.; Quaglia, F.; Oldfield, C.J.; Aspromonte, M.C.; Davey, N.E.; Davidović, R.; Dosztányi, Z.; et al. DisProt 7.0: A Major Update of the Database of Disordered Proteins. Nucleic Acids Res 2017, 45, D219–D227. [Google Scholar] [CrossRef] [PubMed] [Green Version]
- Vymětal, J.; Vondrášek, J.; Hlouchová, K. Sequence Versus Composition: What Prescribes IDP Biophysical Properties? Entropy 2019, 21, 654. [Google Scholar] [CrossRef] [Green Version]
- Blocquel, D.; Habchi, J.; Gruet, A.; Blangy, S.; Longhi, S. Compaction and Binding Properties of the Intrinsically Disordered C-Terminal Domain of Henipavirus Nucleoprotein as Unveiled by Deletion Studies. Mol. BioSyst. 2012, 8, 392–410. [Google Scholar] [CrossRef]
- Zeng, X.; Ruff, K.M.; Pappu, R.V. Competing Interactions Give Rise to Two-State Behavior and Switch-like Transitions in Charge-Rich Intrinsically Disordered Proteins. bioRxiv 2022. [Google Scholar] [CrossRef]


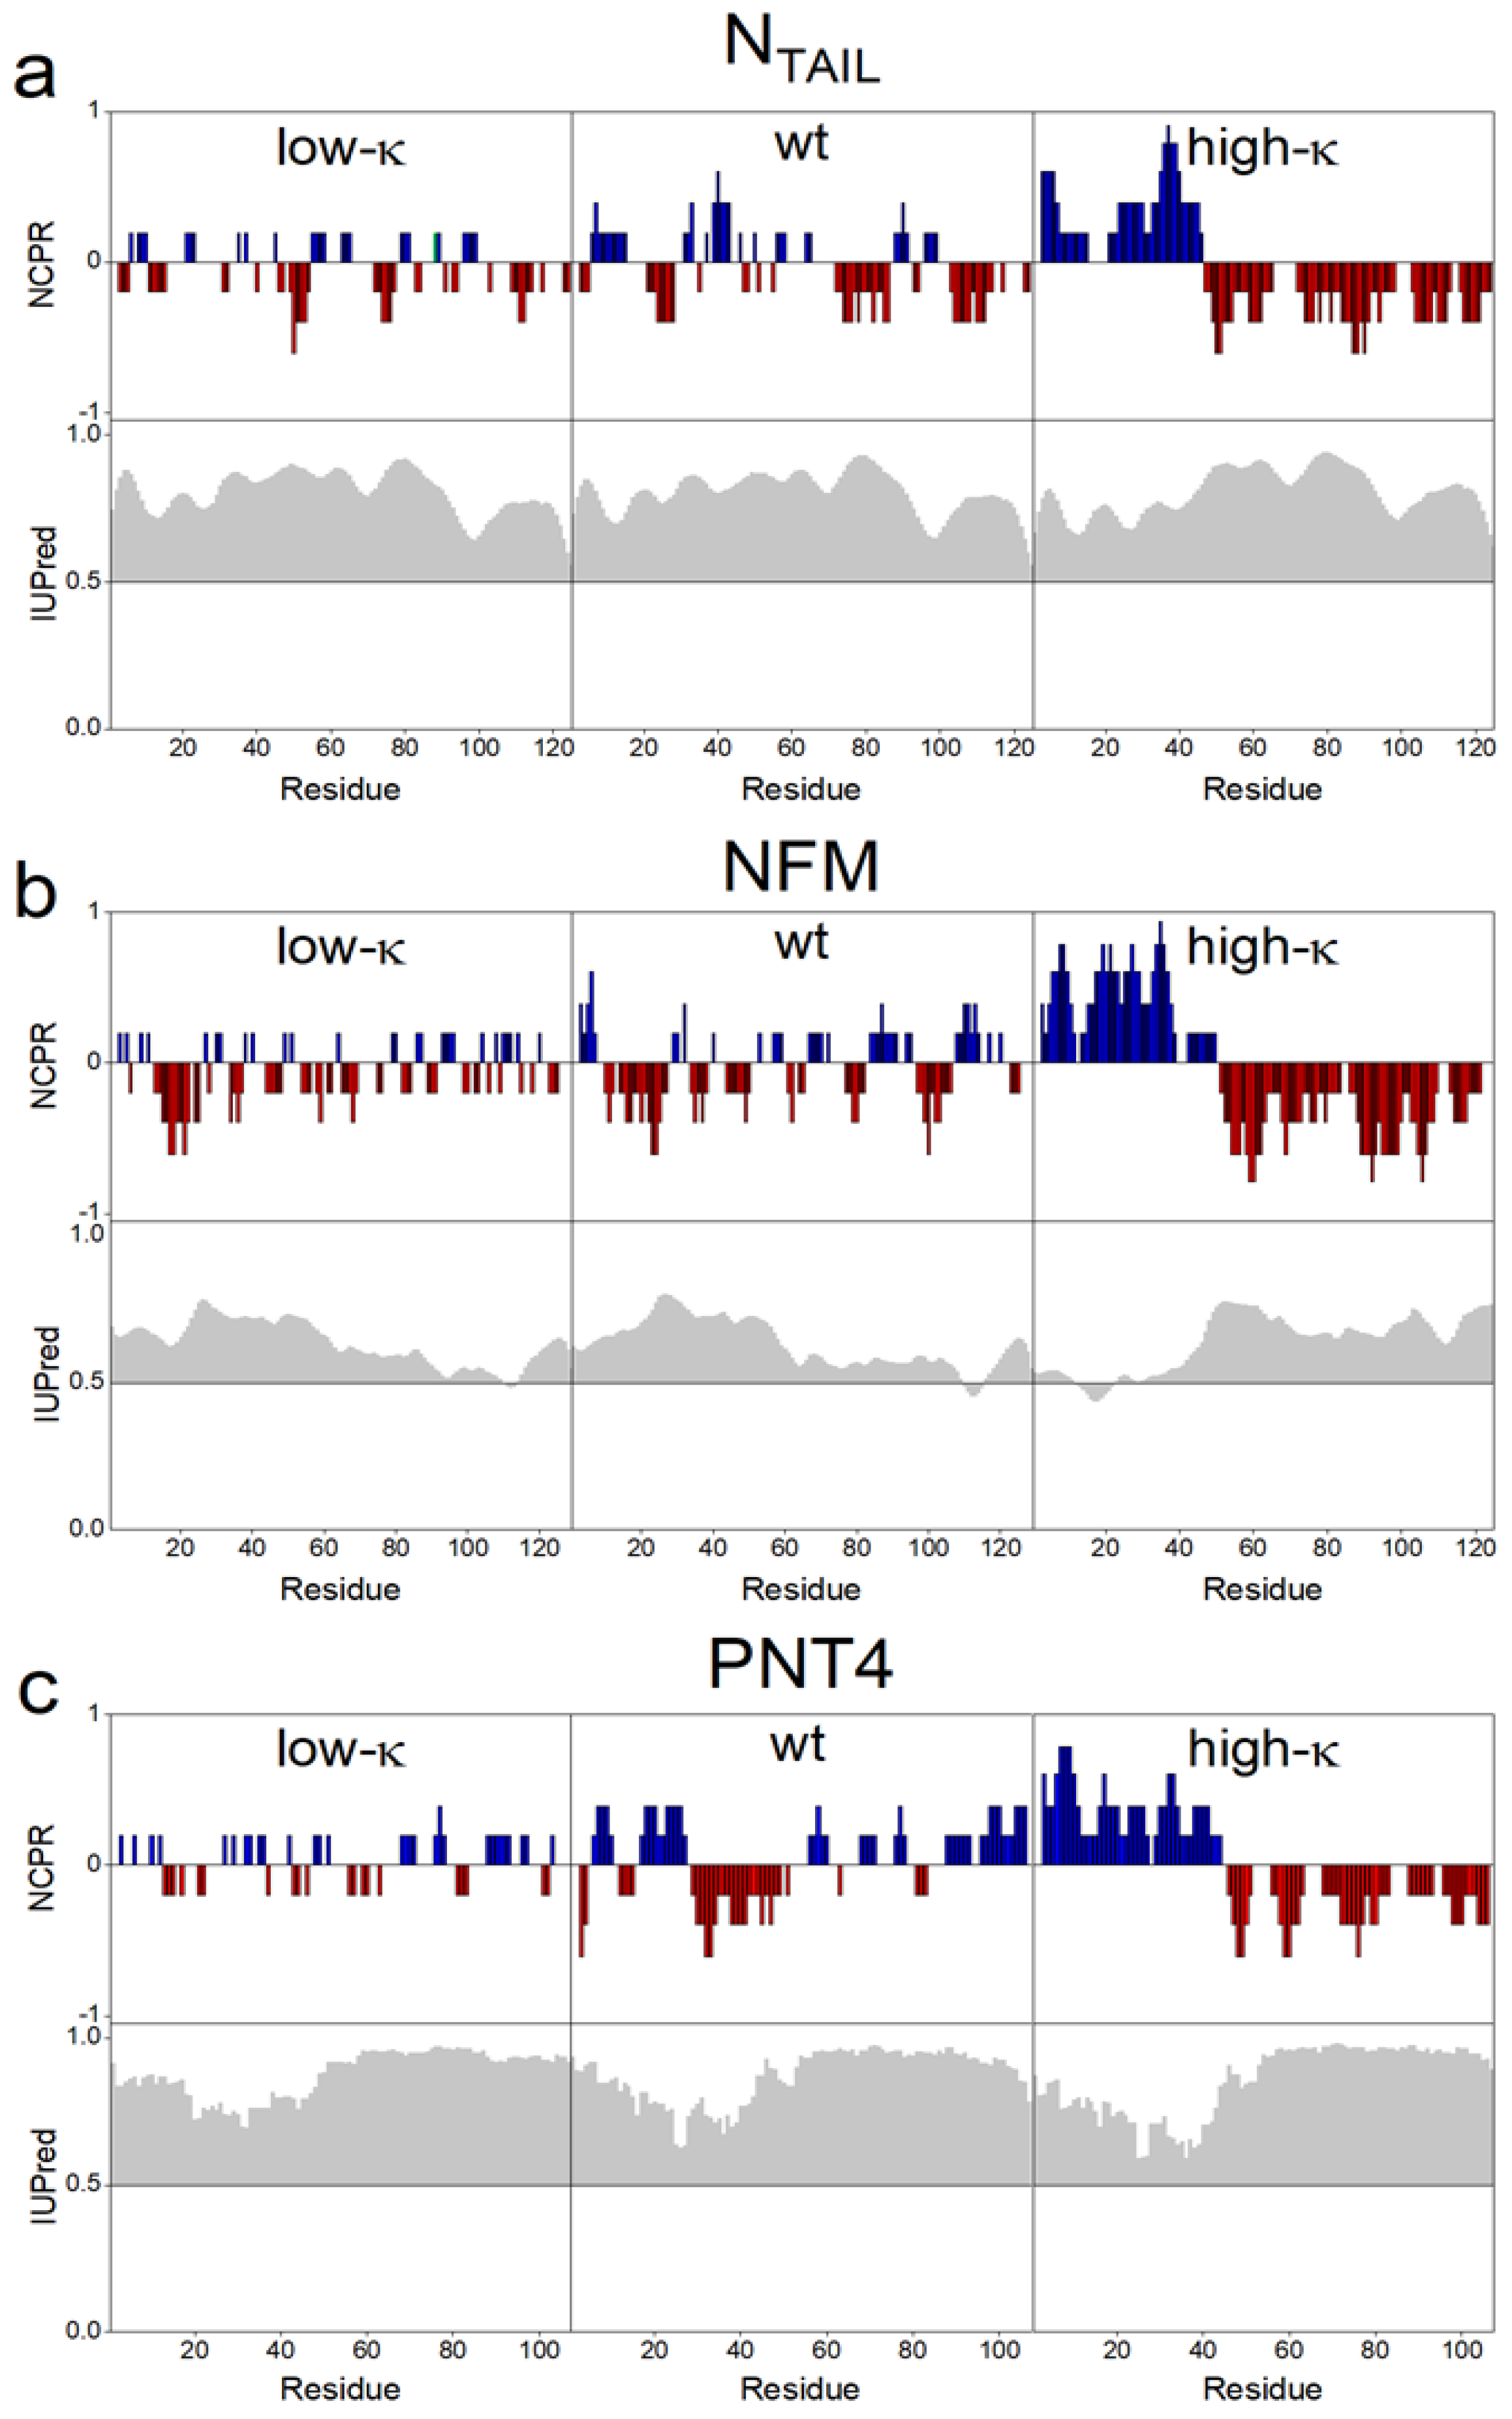
| Protein | Number of Residues | Number of Prolines | Mean Hydropathy | FCR | NCPR | Rt (nm) | κ | Variant |
|---|---|---|---|---|---|---|---|---|
| NTAIL | 134 | 7 | 3.35 | 0.299 | −0.045 | 2.64 | 0.078 | Low κ |
| 0.153 | wt | |||||||
| 0.431 | High κ | |||||||
| NFM | 136 | 1 | 3.40 | 0.390 | −0.051 | 2.54 | 0.037 | Low κ |
| 0.134 | wt | |||||||
| 0.516 | High κ | |||||||
| PNT4 | 114 | 13 | 3.26 | 0.298 | 0.018 | 2.54 | 0.044 | Low κ |
| 0.213 | wt | |||||||
| 0.421 | High κ |
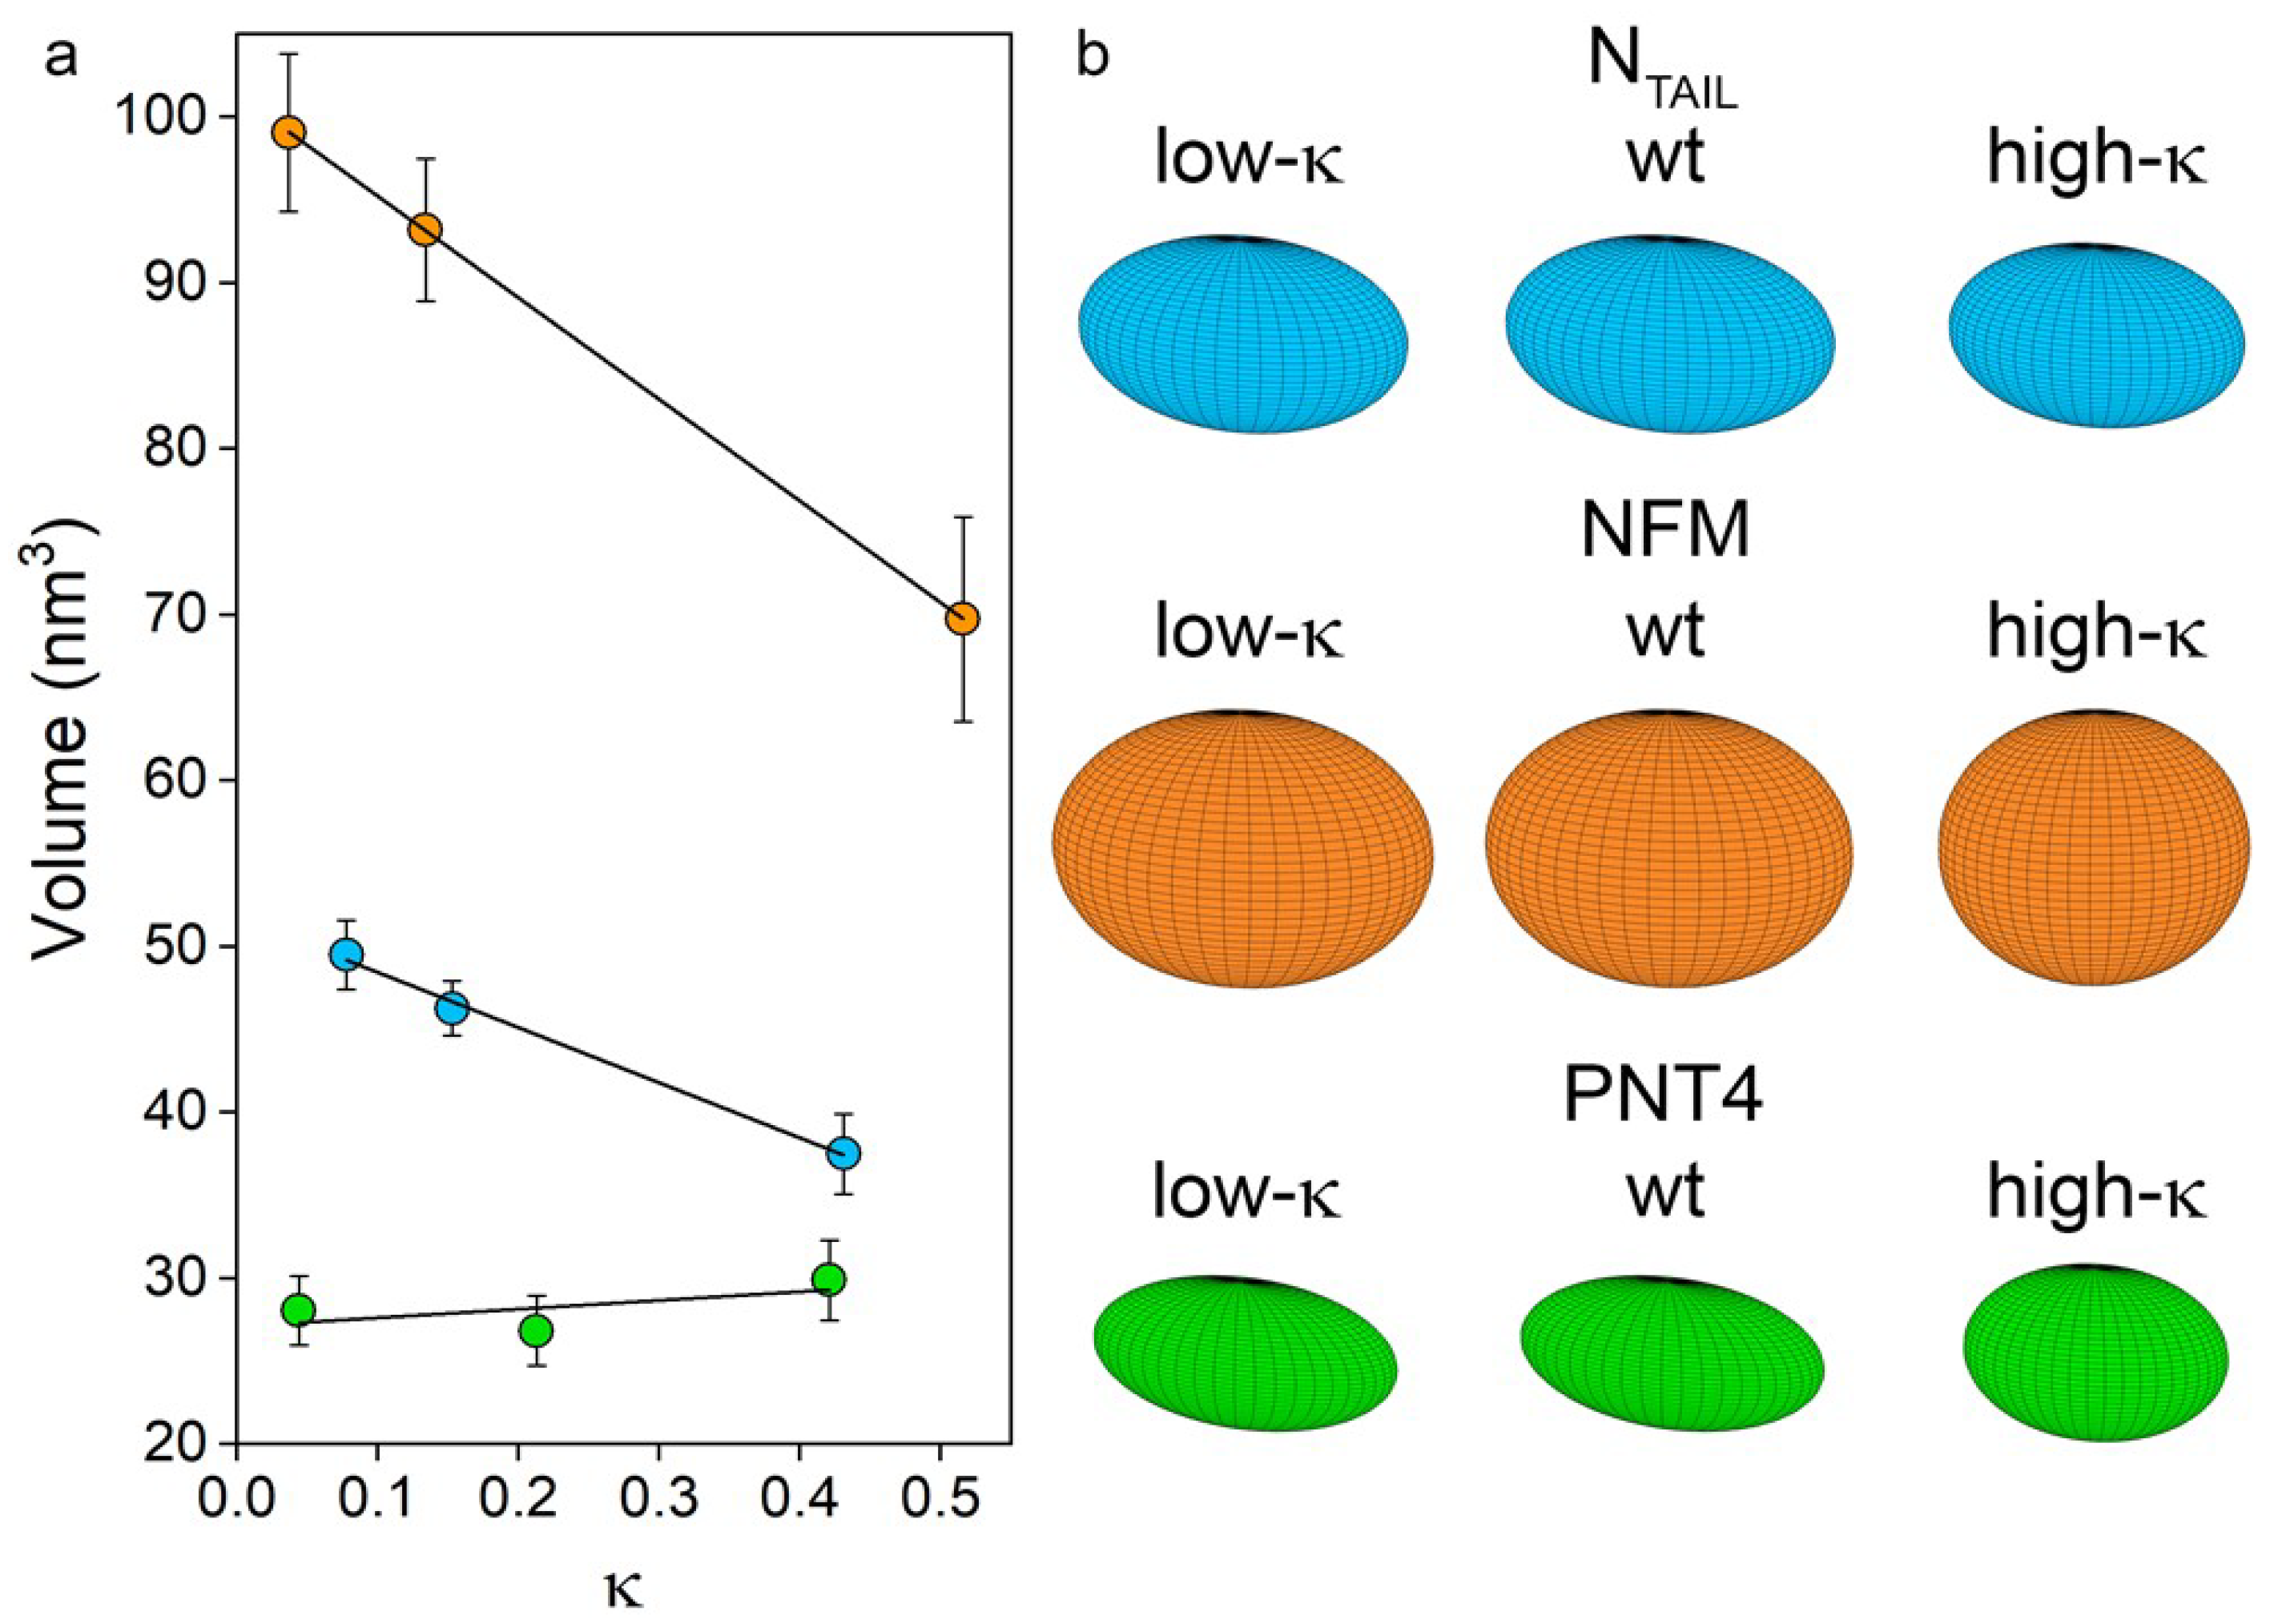
| Protein Variant | Rh (nm) | SASA (nm2) | Volume (nm3) | fb * | fc * | |
|---|---|---|---|---|---|---|
| NTAIL | Low κ | 2.78 ± 0.03 | 113.2 ± 2.1 | 49.5 ± 2.2 | 0.26 ± 0.02 | 0.41 ± 0.16 |
| wt | 2.73 ± 0.03 | 105.6 ± 1.4 | 46.3 ± 1.8 | 0.25 ± 0.01 | 0.39 ± 0.16 | |
| High κ | 2.58 ± 0.05 | 89.3 ± 1.0 | 37.5 ± 2.3 | 0.24 ± 0.02 | 0.38 ± 0.16 | |
| NFM | Low κ | 3.37 ± 0.05 | 136.2 ± 2.0 | 99.1 ± 5.0 | 0.14 ± 0.02 | 0.23 ± 0.12 |
| wt | 3.31 ± 0.04 | 124.5 ± 2.4 | 93.2 ± 4.8 | 0.12 ± 0.02 | 0.19 ± 0.10 | |
| High κ | 3.05 ± 0.10 | 81.5 ± 0.4 | 69.7 ± 8.0 | -0.03 ± 0.08 | 0.02 ± 0.09 | |
| PNT4 | Low κ | 2.39 ± 0.04 | 106.8 ± 3.0 | 28.1 ± 2.1 | 0.42 ± 0.03 | 0.53 ± 0.13 |
| wt | 2.36 ± 0.05 | 106.8 ± 2.5 | 26.8 ± 2.1 | 0.44 ± 0.03 | 0.54 ± 0.12 | |
| High κ | 2.43 ± 0.05 | 69.0 ± 1.0 | 29.9 ± 2.4 | 0.19 ± 0.03 | 0.31 ± 0.15 | |
Publisher’s Note: MDPI stays neutral with regard to jurisdictional claims in published maps and institutional affiliations. |
© 2022 by the authors. Licensee MDPI, Basel, Switzerland. This article is an open access article distributed under the terms and conditions of the Creative Commons Attribution (CC BY) license (https://creativecommons.org/licenses/by/4.0/).
Share and Cite
Bianchi, G.; Mangiagalli, M.; Barbiroli, A.; Longhi, S.; Grandori, R.; Santambrogio, C.; Brocca, S. Distribution of Charged Residues Affects the Average Size and Shape of Intrinsically Disordered Proteins. Biomolecules 2022, 12, 561. https://doi.org/10.3390/biom12040561
Bianchi G, Mangiagalli M, Barbiroli A, Longhi S, Grandori R, Santambrogio C, Brocca S. Distribution of Charged Residues Affects the Average Size and Shape of Intrinsically Disordered Proteins. Biomolecules. 2022; 12(4):561. https://doi.org/10.3390/biom12040561
Chicago/Turabian StyleBianchi, Greta, Marco Mangiagalli, Alberto Barbiroli, Sonia Longhi, Rita Grandori, Carlo Santambrogio, and Stefania Brocca. 2022. "Distribution of Charged Residues Affects the Average Size and Shape of Intrinsically Disordered Proteins" Biomolecules 12, no. 4: 561. https://doi.org/10.3390/biom12040561
APA StyleBianchi, G., Mangiagalli, M., Barbiroli, A., Longhi, S., Grandori, R., Santambrogio, C., & Brocca, S. (2022). Distribution of Charged Residues Affects the Average Size and Shape of Intrinsically Disordered Proteins. Biomolecules, 12(4), 561. https://doi.org/10.3390/biom12040561