

Assessing the Formation of Purine Lesions in Mitochondrial DNA of Cockayne Syndrome Cells

 ,
, 
 ,
,  ,
,  ,
,  and
and
Abstract
1. Introduction
2. Materials and Methods
2.1. Cell Lines and DNA Isolation
2.2. γ–Radiolysis Experiments
2.3. Enzymatic Digestion and Quantification of Modified Nucleosides by Stable Isotope LC–MS/MS
2.4. Statistical Analysis
3. Results and Discussion
3.1. Purine mtDNA Lesions Levels in Wild Type and Defective CSA and CSB Cells
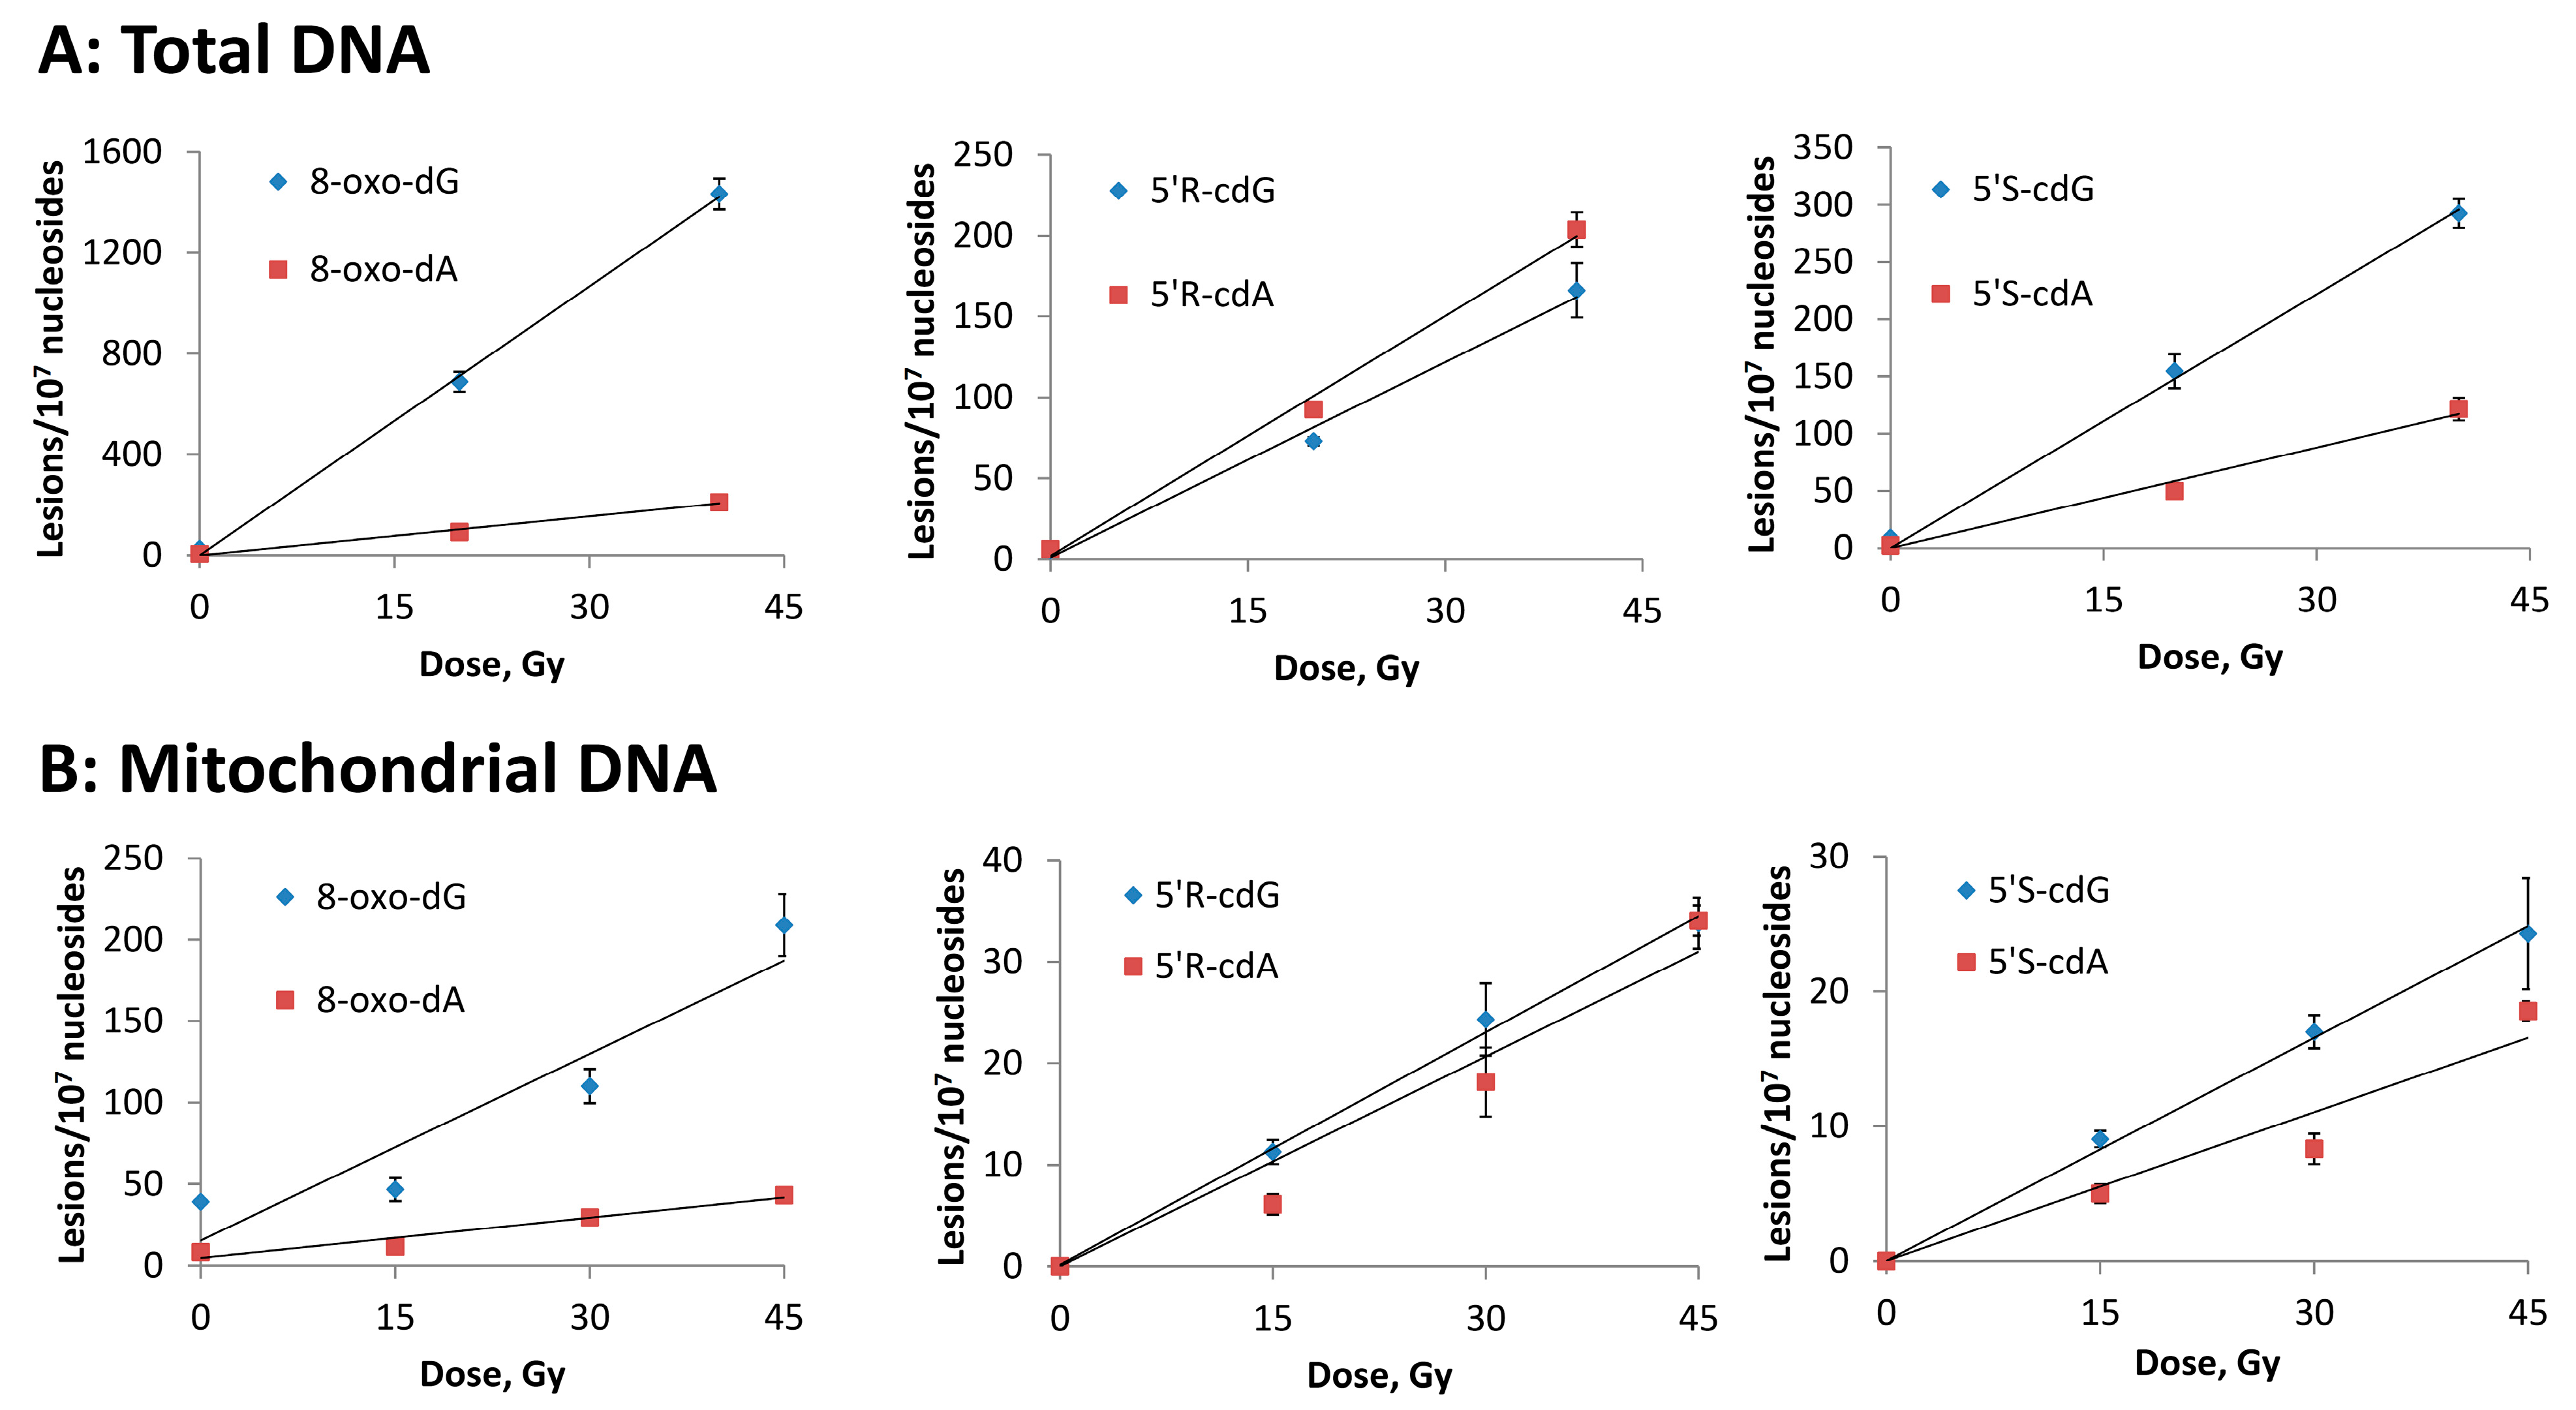
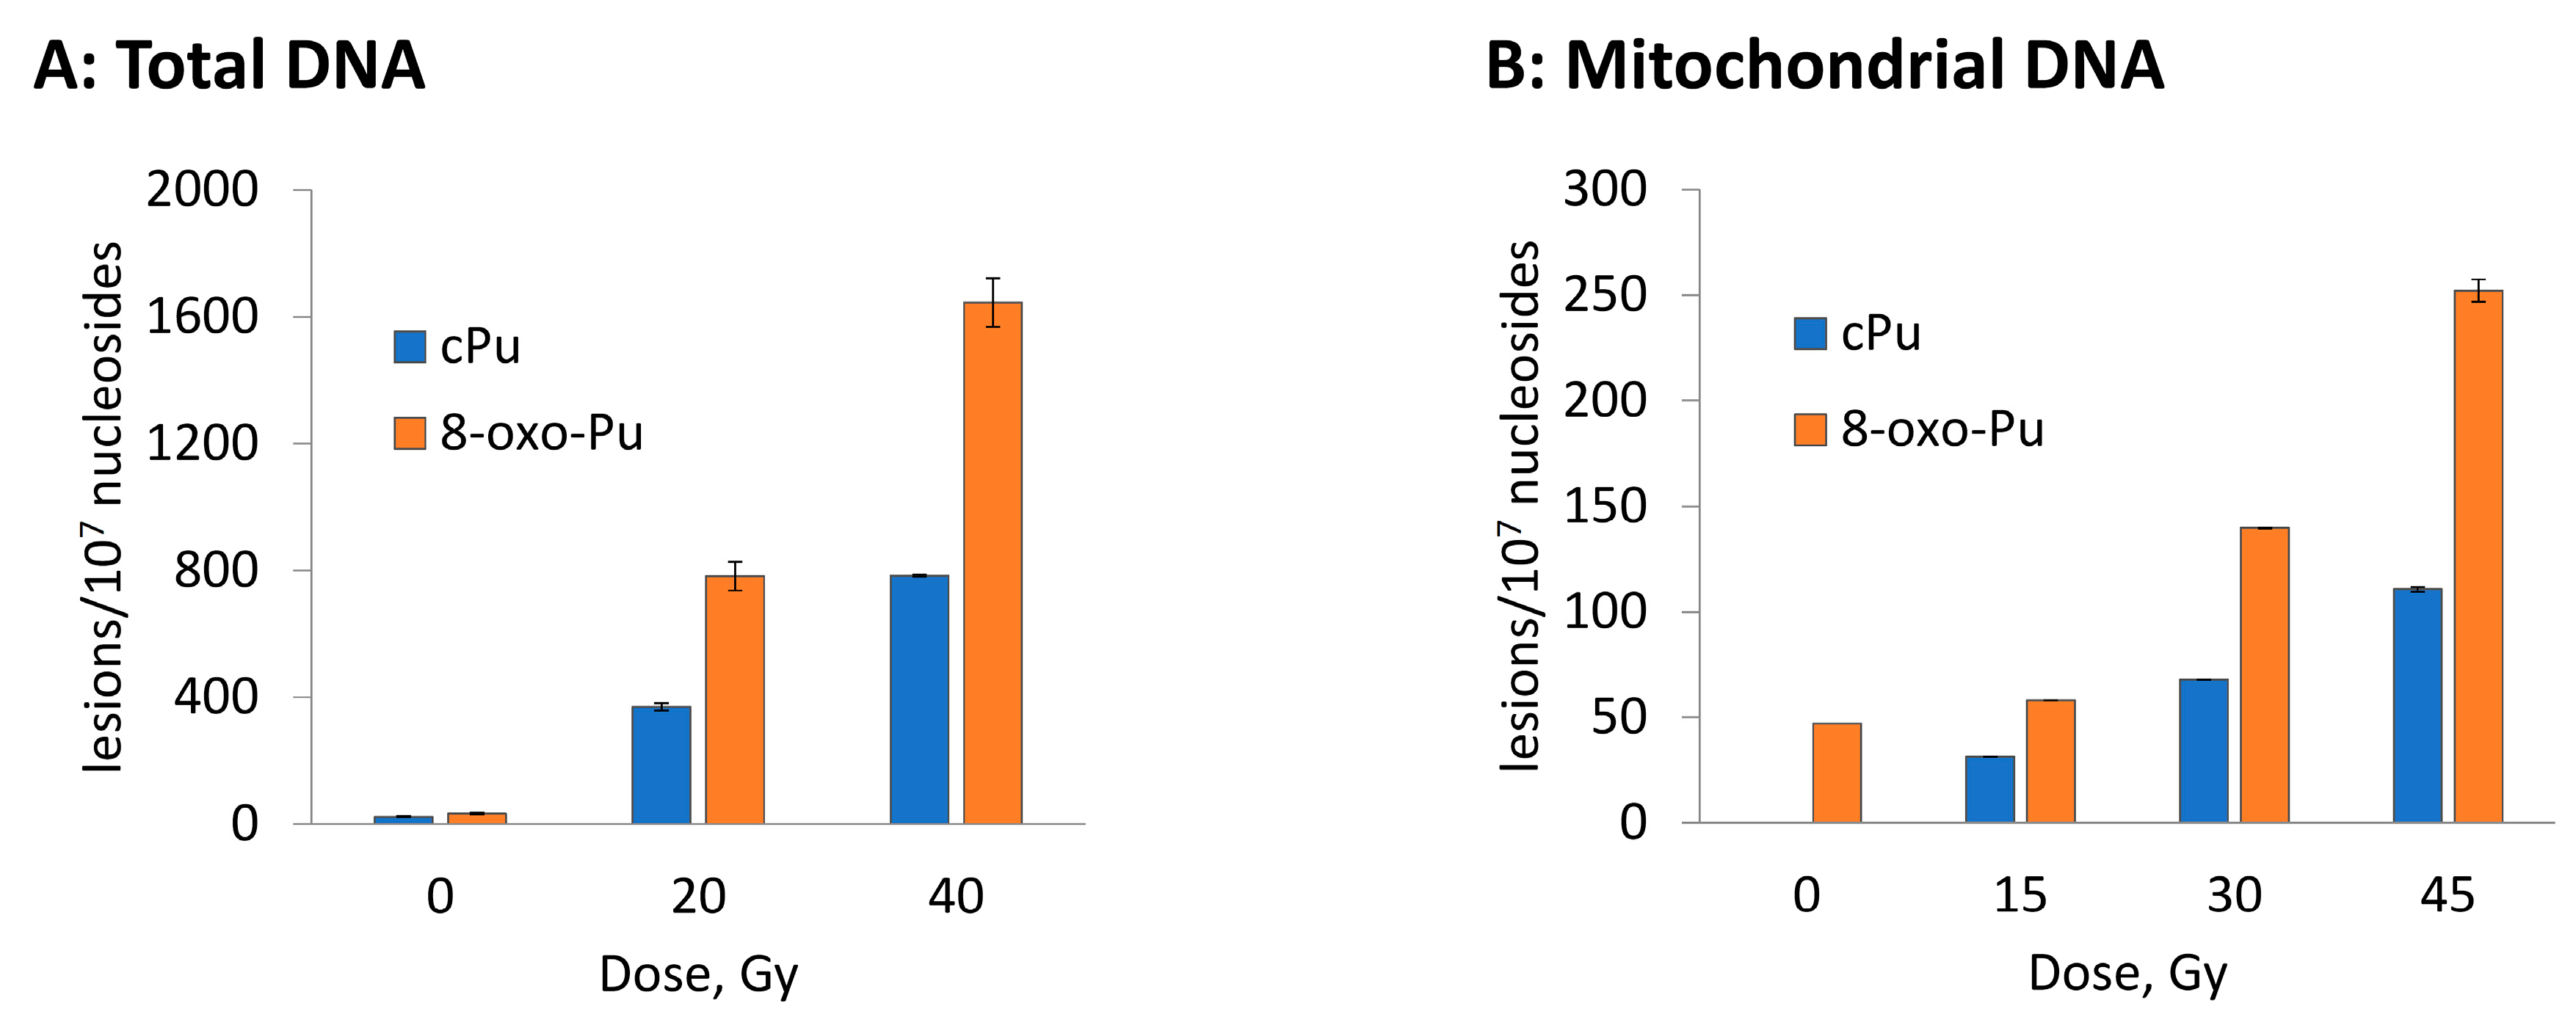
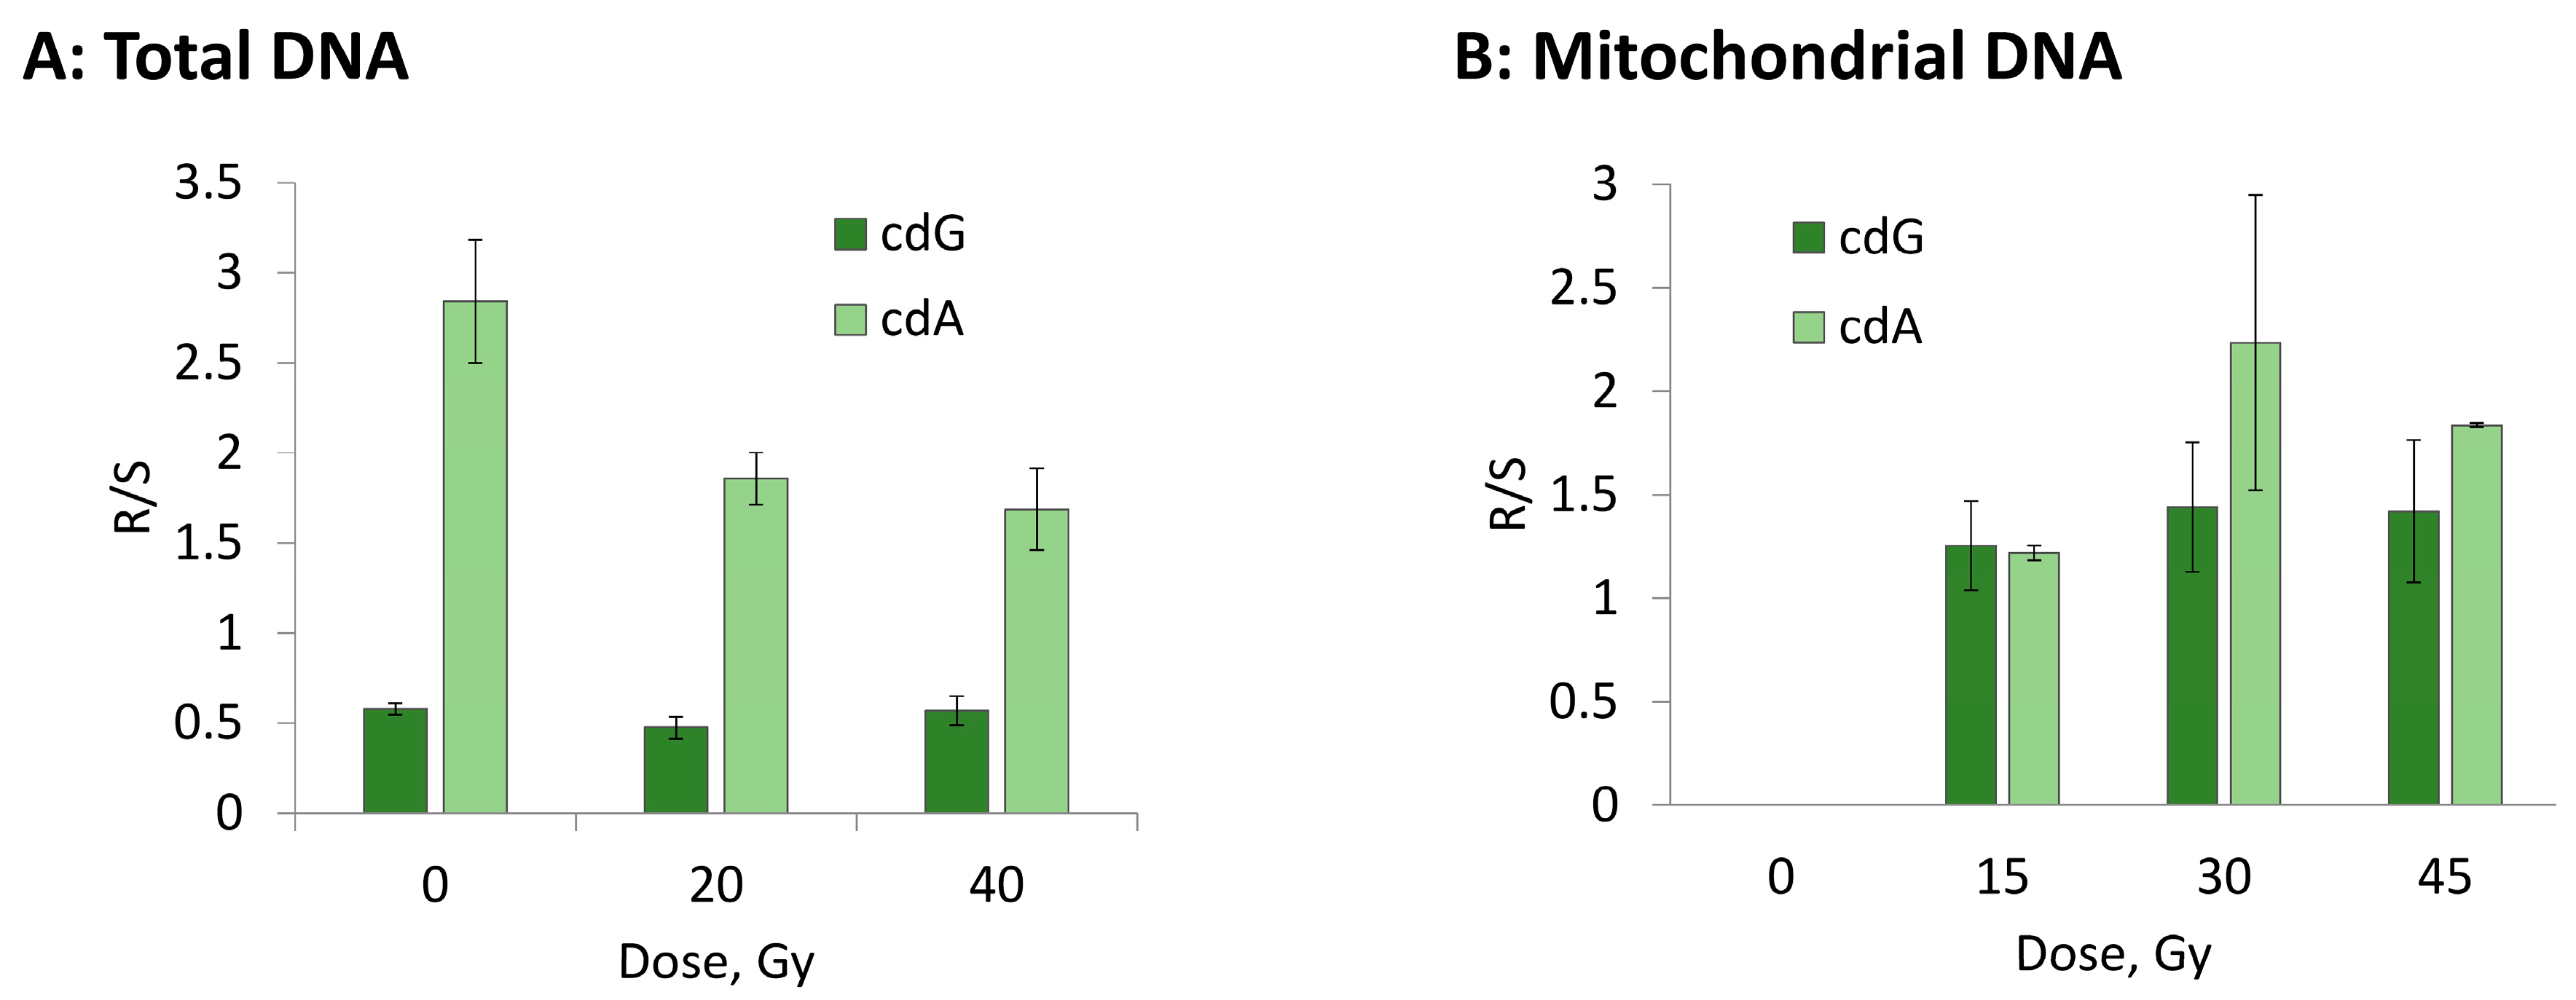
3.2. Hydroxyl Radical–Induced Formation of Purine Lesions: tDNA vs. mtDNA
4. Conclusions
Supplementary Materials
Author Contributions
Funding
Institutional Review Board Statement
Informed Consent Statement
Data Availability Statement
Acknowledgments
Conflicts of Interest
References
- Dröge, W. Free radicals in the physiological control of cell function. Physiol. Rev. 2002, 82, 47–95. [Google Scholar] [CrossRef] [PubMed]
- Shadel, G.S.; Horvath, T.L. Mitochondrial ROS signaling in organismal homeostasis. Cell 2015, 163, 560–569. [Google Scholar] [CrossRef] [PubMed]
- Sies, H.; Berndt, C.; Jones, D.P. Oxidative stress. Annu. Rev. Biochem. 2017, 86, 715–748. [Google Scholar] [CrossRef]
- Sies, H.; Jones, D.P. Reactive oxygen species (ROS) as pleiotropic physiological signalling agents. Nat. Rev. Mol. Cell. Biol. 2020, 21, 363–383. [Google Scholar] [CrossRef]
- Gammella, E.; Recalcati, S.; Cairo, G. Dual role of ROS as signal and stress agents: Iron tips the balance in favor of toxic effects. Oxid. Med. Cell. Longev. 2016, 2016, 1–9. [Google Scholar] [CrossRef]
- Murphy, M.P. How mitochondria produce reactive oxygen species. Biochem. J. 2009, 417, 1–13. [Google Scholar] [CrossRef]
- Solaini, G.; Baracca, A.; Lenaz, G.; Sgarbi, G. Hypoxia and mitochondrial oxidative metabolism. Biochim. Biophys. Acta 2010, 1797, 1171–1177. [Google Scholar] [CrossRef] [PubMed]
- Mailloux, R.J. Teaching the fundamentals of electron transfer reactions in mitochondria and the production and detection of reactive oxygen species. Redox Biol. 2015, 4, 381–398. [Google Scholar] [CrossRef] [PubMed]
- Mori, M.P.; Penjweini, R.; Knutson, J.R.; Wang, P.; Hwang, P.M. Mitochondria and oxygen homeostasis. FEBS J. 2021; online ahead of print. [Google Scholar] [CrossRef]
- Richter, C. Oxidative damage to mitochondrial DNA and its relationship to ageing. Int. J. Biochem. Cell Biol. 1995, 27, 647–653. [Google Scholar] [CrossRef]
- Harman, D. The biologic clock: The mitochondria? J. Am. Geriatr. Soc. 1972, 20, 145–147. [Google Scholar] [CrossRef]
- Anderson, S.; Bankier, A.T.; Barrell, B.G.; de Bruijn, M.H.; Coulson, A.R.; Drouin, J.; Eperon, I.C.; Nierlich, D.P.; Roe, B.A.; Sanger, F.; et al. Sequence and organization of the human mitochondrial genome. Nature 1981, 290, 457–465. [Google Scholar] [CrossRef] [PubMed]
- Nunnari, J.; Suomalainen, A. Mitochondria: In sickness and in health. Cell 2012, 148, 1145–1159. [Google Scholar] [CrossRef] [PubMed]
- Farge, G.; Falkenberg, M. Organization of DNA in mammalian mitochondria. Int. J. Mol. Sci. 2019, 20, 2770. [Google Scholar] [CrossRef] [PubMed]
- Mandavilli, B.S.; Santos, J.H.; Van Houten, B. Mitochondrial DNA repair and ageing. Mutat. Res. 2002, 509, 127–151. [Google Scholar] [CrossRef]
- Huang, Z.; Chen, Y.; Zhang, Y. Mitochondrial reactive oxygen species cause major oxidative mitochondrial DNA damages and repair pathways. J. Biosci. 2020, 45, 84. [Google Scholar] [CrossRef]
- Muftuoglu, M.; Mori, M.P.; de Souza–Pinto, N.C. Formation and repair of oxidative damage in the mitochondrial DNA. Mitochondrion 2014, 17, 164–181. [Google Scholar] [CrossRef]
- Kauppila, J.H.K.; Stewart, J.B. Mitochondrial DNA: Radically free of free–radical driven mutations. Biochim. Biophys. Acta 2015, 1847, 1354–1361. [Google Scholar] [CrossRef]
- Kopinski, P.K.; Singh, L.N.; Zhang, S.; Lott, M.T.; Wallace, D.C. Mitochondrial DNA variation and cancer. Nat. Rev. 2021, 21, 431–445. [Google Scholar] [CrossRef]
- D’Errico, M.; Parlanti, E.; Pascucci, B.; Filomeni, G.; Mastroberardino, P.G.; Dogliotti, E. The interplay between mitochondrial functionality and genome integrity in the prevention of human neurologic diseases. Arch. Biochem. Biophys. 2021, 710, 108977. [Google Scholar] [CrossRef]
- Chatgilialoglu, C.; Studer, A. (Eds.) Encyclopedia of Radicals in Chemistry, Biology and Materials; Wiley: Chichester, UK, 2012. [Google Scholar]
- Halliwell, B.; Gutteridge, J.M.C. Free Radicals in Biology and Medicine, 5th ed.; Oxford University Press: Oxford, UK, 2015. [Google Scholar]
- Fridovich, I. Superoxide radical and superoxide dismutases. Annu. Rev. Biochem. 1995, 64, 97–112. [Google Scholar] [CrossRef]
- Stohs, S.J.; Bagchi, D. Oxidative mechanisms in the toxicity of metal ions. Free Radic. Biol. Med. 1995, 18, 321–336. [Google Scholar] [CrossRef]
- Davies, M.J.; Hawkins, C.L. The role of myeloperoxidase in biomolecule modification, chronic inflammation, and disease. Antioxid. Redox Signal. 2020, 32, 957–981. [Google Scholar] [CrossRef] [PubMed]
- Winterbourn, C.C. Reconciling the chemistry and biology of reactive oxygen species. Nat. Chem. Biol. 2008, 4, 278–286. [Google Scholar] [CrossRef]
- Dizdaroglu, M.; Lloyd, R.S. DNA Damage, DNA Repair and Disease; Royal Society of Chemistry: Croydon, UK, 2021. [Google Scholar]
- Alexeyev, M.; Shokolenko, I.; Wilson, G.; Ledoux, S. The maintenance of mitochondrial DNA integrity—Critical analysis and update. Cold Spring Harb. Perspect. Biol. 2013, 5, a012641. [Google Scholar] [CrossRef] [PubMed]
- Shokolenko, I.; Venediktova, N.; Bochkareva, A.; Wilson, G.L.; Alexeyev, M.F. Oxidative stress induces degradation of mitochondrial DNA. Nucleic Acids Res. 2009, 37, 2539–2548. [Google Scholar] [CrossRef] [PubMed]
- Furda, A.M.; Marrangoni, A.M.; Lokshin, A.; Van Houten, B. Oxidants and not alkylating agents induce rapid mtDNA loss and mitochondrial dysfunction. DNA Repair. 2012, 11, 684–692. [Google Scholar] [CrossRef]
- Moretton, A.; Morel, F.; Macao, B.; Lachaume, P.; Ishak, L.; Lefebvre, M.; Garreau-Balandier, I.; Vernet, P.; Falkenberg, M.; Farge, G. Selective mitochondrial DNA degradation following double-strand breaks. PLoS ONE 2017, 12, e0176795. [Google Scholar] [CrossRef]
- Peeva, V.; Blei, D.; Trombly, G.; Corsi, S.; Szukszto, M.J.; Rebelo-Guiomar, P.; Gammage, P.A.; Kudin, A.P.; Becker, C.; Altmüller, J.; et al. Linear mitochondrial DNA is rapidly degraded by components of the replication machinery. Nat. Commun. 2018, 9, 1727. [Google Scholar] [CrossRef]
- Chatgilialoglu, C.; Ferreri, C.; Krokidis, M.G.; Masi, A.; Terzidis, M.A. On the relevance of hydroxyl radical to purine DNA damage. Free Radic. Res. 2021, 55, 384–404. [Google Scholar] [CrossRef]
- Chatgilialoglu, C.; Ferreri, C.; Terzidis, M.A. Purine 5′,8–cyclonucleoside lesions: Chemistry and biology. Chem. Soc. Rev. 2011, 40, 1368–1382. [Google Scholar] [CrossRef]
- Dizdaroglu, M.; Jaruga, P. Mechanisms of free radical–induced damage to DNA. Free Radic. Res. 2012, 46, 382–419. [Google Scholar] [CrossRef] [PubMed]
- Chatgilialoglu, C.; Ferreri, C.; Geacintov, N.E.; Krokidis, M.G.; Liu, Y.; Masi, A.; Shafirovich, N.; Terzidis, M.A.; Tsegay, P.S. 5′,8–Cyclopurine lesions in DNA damage: Chemical, analytical, biological and diagnostic significance. Cells 2019, 8, 513. [Google Scholar] [CrossRef] [PubMed]
- Cui, L.; Ye, W.; Prestwich, E.G.; Wishnok, J.S.; Taghizadeh, K.; Dedon, P.C.; Tannenbaum, S.R. Comparative analysis of four oxidized guanine lesions from reactions of DNA with peroxynitrite, single oxygen, and γ–radiation. Chem. Res. Toxicol. 2013, 26, 195–202. [Google Scholar] [CrossRef]
- Brooks, P.J.; Wise, D.S.; Berry, D.A.; Kosmoski, J.V.; Smerdon, M.J.; Somers, R.L.; Mackie, H.; Spoonde, A.Y.; Ackerman, E.J.; Coleman, K.; et al. The oxidative DNA lesion 8,5′–(S)–cyclo–2′–deoxyadenosine is repaired by the nucleotide excision repair pathway and blocks gene expression in mammalian cells. J. Biol. Chem. 2000, 275, 22355–22362. [Google Scholar] [CrossRef]
- Kuraoka, I.; Bender, C.; Romieu, A.; Cadet, J.; Wood, R.D.; Lindahl, T. Removal of oxygen free–radical–induced 5′,8–purine cyclodeoxynucleosides from DNA by the nucleotide excision– repair pathway in human cells. Proc. Natl. Acad. Sci. USA 2000, 97, 3832–3837. [Google Scholar] [CrossRef] [PubMed]
- Pande, P.; Das, R.S.; Sheppard, C.; Kow, Y.W.; Basu, A.K. Repair efficiency of (5′S)–8,5–cyclo–2′–deoxyguanosine and (5′ S)–8,5′–cyclo–2′–deoxyadenosine depends on the complementary base. DNA Repair. 2012, 11, 926–931. [Google Scholar] [CrossRef][Green Version]
- Kropachev, K.; Ding, S.; Terzidis, M.A.; Masi, A.; Liu, Z.; Cai, Y.; Kolbanovskiy, M.; Chatgilialoglu, C.; Broyde, S.; Geacintov, N.E.; et al. Structural basis for the recognition of diastereomeric 5′,8–cyclo–2′–deoxypurine lesions by the human nucleotide excision repair system. Nucleic Acids Res. 2014, 42, 5020–5032. [Google Scholar] [CrossRef]
- Krasikova, Y.; Rechkunova, N.; Lavrik, O. Nucleotide excision repair: From molecular defects to neurological abnormalities. Int. J. Mol. Sci. 2021, 22, 6220. [Google Scholar] [CrossRef]
- Hanawalt, P.C.; Spivak, G. Transcription–coupled DNA repair: Two decades of progress and surprises. Nat. Rev. Mol. Cell. Biol. 2008, 9, 958–970. [Google Scholar] [CrossRef]
- D’Errico, M.; Pascucci, B.; Iorio, E.; Van Houten, B.; Dogliotti, E. The role of CSA and CSB protein in the oxidative stress response. Mech. Ageing Dev. 2013, 134, 261–269. [Google Scholar] [CrossRef]
- Pascucci, B.; Fragale, A.; Marabitti, V.; Leuzzi, G.; Calcagnile, A.S.; Parlanti, E.; Franchitto, A.; Dogliotti, E.; D’Errico, M. CSA and CSB play a role in the response to DNA breaks. Oncotarget 2018, 9, 11581–11591. [Google Scholar] [CrossRef] [PubMed]
- Krokidis, M.G.; D’Errico, M.; Pascucci, B.; Parlanti, E.; Masi, A.; Ferreri, C.; Chatgilialoglu, C. Oxygen–Dependent Accumulation of Purine DNA Lesions in Cockayne Syndrome Cells. Cells 2021, 9, 1671, Correction in Cells 2021, 10, 41. [Google Scholar] [CrossRef] [PubMed]
- Ferreri, C.; Sansone, A.; Krokidis, M.G.; Masi, A.; Pascucci, B.; D’Errico, M.; Chatgilialoglu, C. Effects of Oxygen Tension for Membrane Lipidome Remodeling of Cockayne Syndrome Cell Models. Cells 2022, 11, 1286. [Google Scholar] [CrossRef] [PubMed]
- Chatgilialoglu, C. Cyclopurine (cPu) lesions: What, how and why? Free Radic. Res. 2019, 53, 941–943. [Google Scholar] [CrossRef] [PubMed]
- Chatgilialoglu, C. Biomimetic Radical Chemistry and Applications. Molecules 2022, 27, 2042. [Google Scholar] [CrossRef]
- D’Errico, M.; Teson, M.; Calcagnile, A.; Nardo, T.; De Luca, N.; Lazzari, C.; Soddu, S.; Zambruno, G.; Stefanini, M.; Dogliotti, E. Differential role of transcription–coupled repair in UVB–induced response of human fibroblasts and keratinocytes. Cancer Res. 2005, 65, 232–238. [Google Scholar] [CrossRef]
- Pascucci, B.; D’Errico, M.; Romagnoli, A.; De Nuccio, C.; Savino, M.; Pietraforte, D.; Lanzafame, M.; Calcagnile, A.S.; Fortini, P.; Baccarini, S.; et al. Overexpression of parkin rescues the defective mitochondrial phenotype and the increased apoptosis of Cockayne syndrome A cells. Oncotarget 2016, 8, 102852–102867. [Google Scholar] [CrossRef][Green Version]
- Pascucci, B.; Lemma, T.; Iorio, E.; Giovannini, S.; Vaz, B.; Iavarone, I.; Calcagnile, A.; Narciso, L.; Degan, P.; Podo, F.; et al. An altered redox balance mediates the hypersensitivity of Cockayne syndrome primary fibroblasts to oxidative stress. Aging Cell 2012, 11, 520–529. [Google Scholar] [CrossRef]
- Spinks, J.W.T.; Woods, R.J. An Introduction to Radiation Chemistry, 3rd ed.; John–Wiley and Sons, Inc.: New York, NY, USA, 1990; p. 100. [Google Scholar]
- Terzidis, M.A.; Chatgilialoglu, C. An ameliorative protocol for the quantification of purine 5′,8–cyclo–2′–deoxynucleosides in oxidized DNA. Front. Chem. 2015, 3, 47. [Google Scholar] [CrossRef]
- Chatgilialoglu, C.; Krokidis, M.G.; Masi, A.; Barata–Vallejo, S.; Ferreri, C.; Terzidis, M.A.; Szreder, T.; Bobrowski, K. New insights into the reaction paths of hydroxyl radicals with purine moieties in DNA and double-stranded oligonucleotides. Molecules 2019, 24, 3860. [Google Scholar] [CrossRef]
- Chatgilialoglu, C.; Eriksson, L.A.; Krokidis, M.G.; Masi, A.; Wang, S.; Zhang, R. Oxygen dependent purine lesions in double-stranded oligodeoxynucleotides: Kinetic and computational studies highlight the mechanism for 5′,8–cyclopurine formation. J. Am. Chem. Soc. 2020, 142, 5825–5833. [Google Scholar] [CrossRef] [PubMed]
- Pascucci, B.; Spadaro, F.; Pietraforte, D.; De Nuccio, C.; Visentin, S.; Giglio, P.; Dogliotti, E.; D’Errico, M. DRP1 Inhibition Rescues Mitochondrial Integrity and Excessive Apoptosis in CS–A Disease Cell Models. Int. J. Mol. Sci. 2021, 22, 7123. [Google Scholar] [CrossRef] [PubMed]
- Chatre, L.; Biard, D.S.F.; Sarasin, A.; Ricchetti, M. Reversal of mitochondrial defects with CSB–dependent serine protease inhibitors in patient cells of the progeroid Cockayne syndrome. Proc. Natl. Acad. Sci. USA 2015, 112, E2910–E2919. [Google Scholar] [CrossRef] [PubMed]
- Wiesner, R.J.; Rüegg, C.; Morano, I. Counting target molecules by exponential polymerase chain reaction: Copy number of mitochondrial DNA in rat tissues. Biochem. Biophys. Res. Commun. 1992, 183, 553–559. [Google Scholar] [CrossRef]
- D’Erchia, A.M.; Atlante, A.; Gadaleta, G.; Pavesi, G.; Chiara, M.; De Virgilio, C.; Manzari, C.; Mastropasqua, F.; Prazzoli, G.M.; Picardi, E.; et al. Tissue–specific mtDNA abundance from exome data and its correlation with mitochondrial transcription, mass and respiratory activity. Mitochondrion 2015, 20, 13–21. [Google Scholar] [CrossRef]
- Shafirovich, V.; Kolbanovskiy, M.; Kropachev, K.; Liu, Z.; Cai, Y.; Terzidis, M.A.; Masi, A.; Chatgilialoglu, C.; Amin, S.; Dadali, A.; et al. Nucleotide excision repair and impact of site–specific 5′,8–cyclopurine and bulky DNA lesions on the physical properties of nucleosomes. Biochemistry 2019, 58, 561–574. [Google Scholar] [CrossRef] [PubMed]
- von Sonntag, C. Free–Radical–Induced DNA Damage and Its Repair. A Chemical Perspective; Springer Science: Berlin/Heidelberg, Germany, 2006. [Google Scholar]
- Buxton, G.V.; Greenstock, C.L.; Helman, W.P.; Ross, A.B. Critical review of rate constants for hydrated electrons, hydrogen atoms and hydroxyl radicals (OH/O−) in aqueous solution. J. Phys. Chem. Ref. Data 1988, 17, 513–886. [Google Scholar] [CrossRef]
- Ross, A.B.; Mallard, W.G.; Helman, W.P.; Buxton, G.V.; Huie, R.E.; Neta, P. NDRLNIST Solution Kinetic Database–Ver. 3; Notre Dame Radiation Laboratory, Notre Dame, IN and NIST Standard Reference Data: Gaithersburg, MD, USA, 1998.
- Bergeron, F.; Auvré, F.; Radicella, J.P.; Ravanat, J.-L. HO• radicals induce an unexpected high proportion of tandem base lesions refractory to repair by DNA glycosylases. Proc. Natl. Acad. Sci. USA 2010, 107, 5528–5533. [Google Scholar] [CrossRef]
- Ravanat, J.-L. Endogenous natural and radiation–induced DNA lesions: Differences and similarities and possible implications for human health and radiological protection. Radioprotection 2018, 53, 241–248. [Google Scholar] [CrossRef]
- Chatgilialoglu, C. The Two Faces of the Guanyl Radical: Molecular Context and Behavior. Molecules 2021, 26, 3511. [Google Scholar] [CrossRef]
- Terzidis, M.A.; Prisecaru, A.; Molphy, Z.; Barron, N.; Randazzo, A.; Dumont, E.; Krokidis, M.G.; Kellett, A.; Chatgilialoglu, C. Radical–induced purine lesion formation is dependent on DNA helical topology. Free Radic. Res. 2016, 50, S91–S101. [Google Scholar] [CrossRef] [PubMed]
- Krokidis, M.G.; Louka, M.; Efthimiadou, E.K.; Zervou, S.K.; Papadopoulos, K.; Hiskia, A.; Ferreri, C.; Chatgilialoglu, C. Membrane lipidome reorganization and accumulation of tissue DNA lesions in tumor–bearing mice: An exploratory study. Cancers 2019, 11, 480. [Google Scholar] [CrossRef] [PubMed]
- Yu, Y.; Guerrero, C.R.; Liu, S.; Amato, N.J.; Sharma, Y.; Gupta, S.; Wang, Y. Comprehensive assessment of oxidatively induced modifications of DNA in a rat model of human Wilson’s disease. Mol. Cell. Proteom. 2016, 15, 810–817. [Google Scholar] [CrossRef]
- Krokidis, M.G.; Prasinou, P.; Efthimiadou, E.K.; Boari, A.; Ferreri, C.; Chatgilialoglu, C. Effects of Aging and Disease Conditions in Brain of Tumor–Bearing Mice: Evaluation of Purine DNA Damages and Fatty Acid Pool Changes. Biomolecules 2022, 12, 1075. [Google Scholar] [CrossRef] [PubMed]
- Egler, R.A.; Fernandes, E.; Rothermund, K.; Sereika, S.; de Souza–Pinto, N.; Jaruga, P.; Dizdaroglu, M.; Prochownik, E.V. Regulation of reactive oxygen species, DNA damage, and c–Myc function by peroxiredoxin 1. Oncogene 2005, 24, 8038–8050. [Google Scholar] [CrossRef] [PubMed]
- Chatgilialoglu, C.; Bazzanini, R.; Jimenez, L.B.; Miranda, M.A. (5′S)– and (5′R)–5′,8–cyclo–2′–deoxyguanosine: Mechanistic insights on the 2′–deoxyguanosin–5′–yl radical cyclization. Chem. Res. Toxicol. 2007, 20, 1820–1824. [Google Scholar] [CrossRef]
- Boussicault, F.; Kaloudis, P.; Caminal, C.; Mulazzani, Q.G.; Chatgilialoglu, C. The fate of C5′ radicals of purine nucleosides under oxidative conditions. J. Am. Chem. Soc. 2008, 130, 8377–8385. [Google Scholar] [CrossRef]


| mtDNA | 8–oxo–dG 1 | 8–oxo–dA 1 |
|---|---|---|
| CS3BE–wtCSA | 28.30 ± 0.13 | 7.32 ± 0.13 |
| CS3BE | 29.31 ± 0.22 | 7.58 ± 0.07 |
| CS1AN–wtCSB | 39.00 ± 0.18 * | 8.08 ± 0.15 |
| CS1AN | 40.90 ± 0.22 * | 8.71 ± 0.17 |
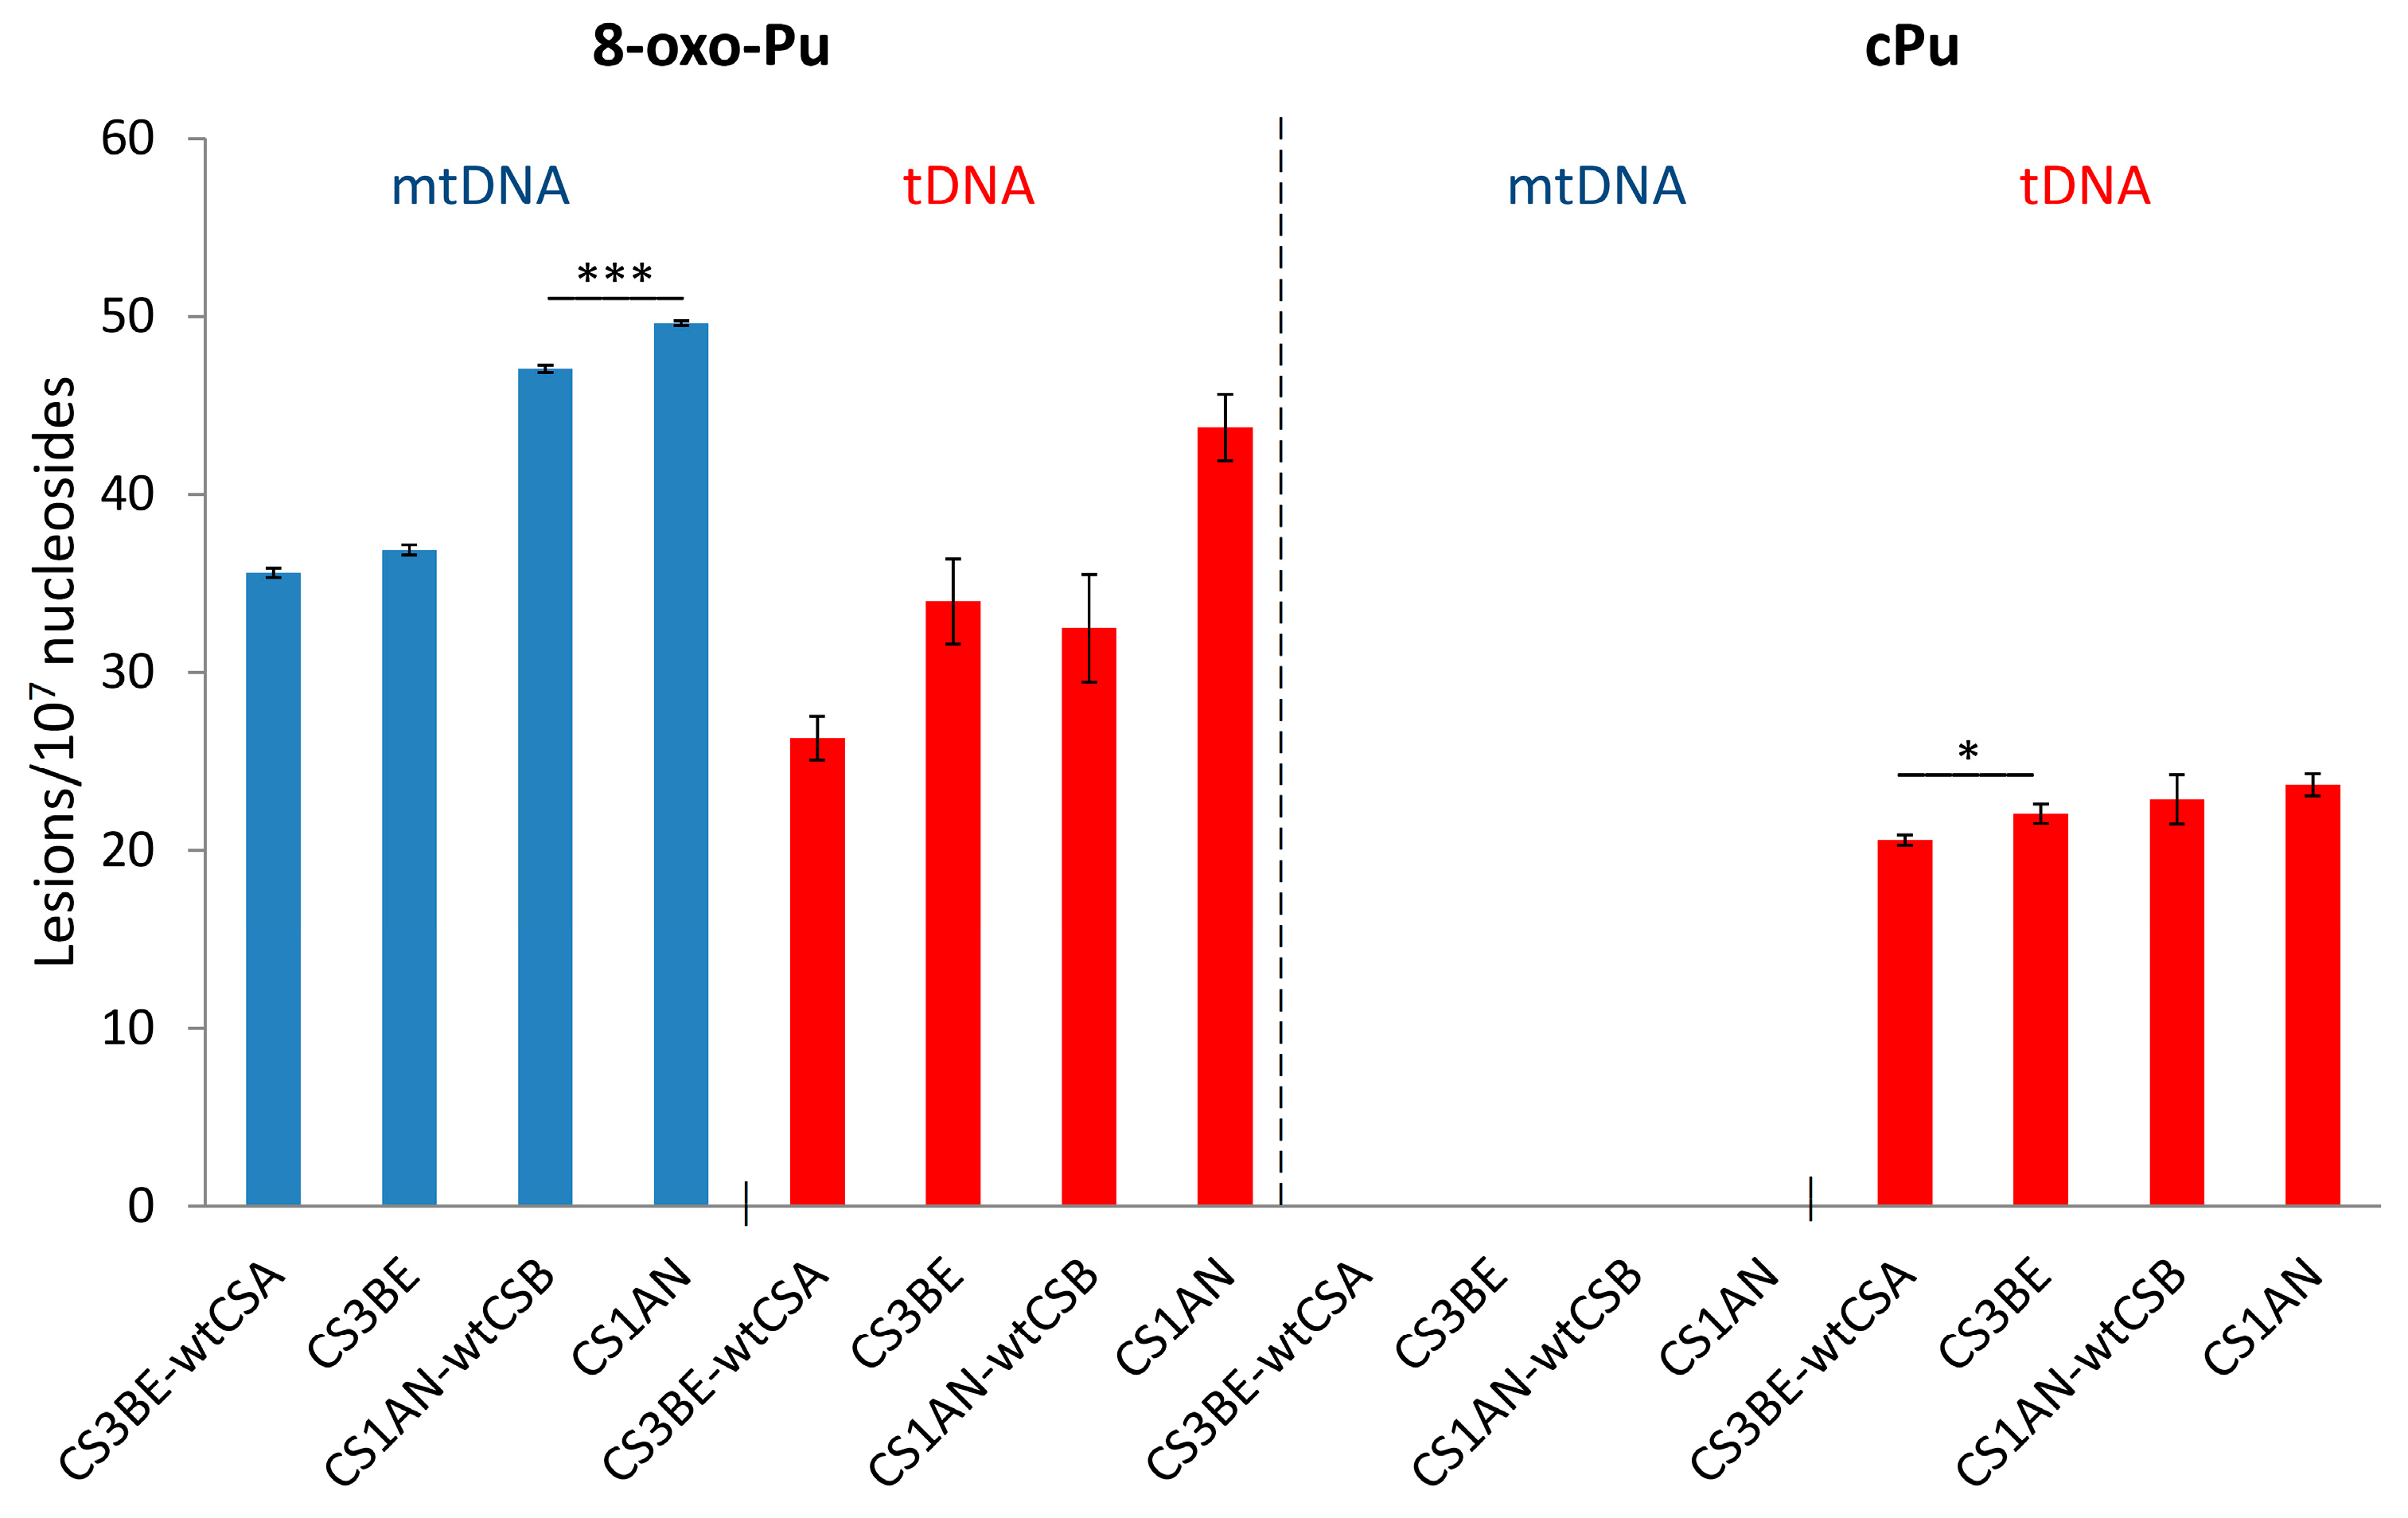
| 8–oxo–Pu 1 | cPu 1 | |||
|---|---|---|---|---|
| mtDNA 2 | tDNA 3 | mtDNA 2 | tDNA 3 | |
| CS3BE–wtCSA | 35.62 ± 0.26 | 26.32 ± 1.22 | N/D | 20.56 ± 0.30 * |
| CS3BE | 36.89 ± 0.28 | 33.98 ± 2.40 | N/D | 22.04 ± 0.55 * |
| CS1AN–wtCSB | 47.08 ± 0.21 *** | 32.49 ± 3.04 | N/D | 22.84 ± 1.39 |
| CS1AN | 49.61 ± 0.13 *** | 43.73 ± 1.86 | N/D | 23.67 ± 0.62 |
| Lesion | tDNA | mtDNA |
|---|---|---|
| 8–oxo–dG | 35.2 | 3.8 |
| 8–oxo–dA | 5.1 | 0.8 |
| 5′R–cdG | 4.0 | 0.8 |
| 5′R–cdA | 4.9 | 0.8 |
| 5′S–cdG | 7.1 | 0.5 |
| 5′S–cdA | 3.0 | 0.4 |
Publisher’s Note: MDPI stays neutral with regard to jurisdictional claims in published maps and institutional affiliations. |
© 2022 by the authors. Licensee MDPI, Basel, Switzerland. This article is an open access article distributed under the terms and conditions of the Creative Commons Attribution (CC BY) license (https://creativecommons.org/licenses/by/4.0/).
Share and Cite
Chatgilialoglu, C.; Krokidis, M.G.; Masi, A.; Barata-Vallejo, S.; Ferreri, C.; Pascucci, B.; D’Errico, M. Assessing the Formation of Purine Lesions in Mitochondrial DNA of Cockayne Syndrome Cells. Biomolecules 2022, 12, 1630. https://doi.org/10.3390/biom12111630
Chatgilialoglu C, Krokidis MG, Masi A, Barata-Vallejo S, Ferreri C, Pascucci B, D’Errico M. Assessing the Formation of Purine Lesions in Mitochondrial DNA of Cockayne Syndrome Cells. Biomolecules. 2022; 12(11):1630. https://doi.org/10.3390/biom12111630
Chicago/Turabian StyleChatgilialoglu, Chryssostomos, Marios G. Krokidis, Annalisa Masi, Sebastian Barata-Vallejo, Carla Ferreri, Barbara Pascucci, and Mariarosaria D’Errico. 2022. "Assessing the Formation of Purine Lesions in Mitochondrial DNA of Cockayne Syndrome Cells" Biomolecules 12, no. 11: 1630. https://doi.org/10.3390/biom12111630
APA StyleChatgilialoglu, C., Krokidis, M. G., Masi, A., Barata-Vallejo, S., Ferreri, C., Pascucci, B., & D’Errico, M. (2022). Assessing the Formation of Purine Lesions in Mitochondrial DNA of Cockayne Syndrome Cells. Biomolecules, 12(11), 1630. https://doi.org/10.3390/biom12111630