
A Set of 17 microRNAs Common for Brain and Cerebrospinal Fluid Differentiates Primary Central Nervous System Lymphoma from Non-Malignant Brain Tumors

 , , , , , ,
Abstract
:1. Introduction
2. Materials and Methods
2.1. Patients and Samples
2.2. RNA Extraction
2.3. Next-Generation Sequencing
2.4. Quantitative Real-Time PCR
2.5. Statistical Analysis
3. Results
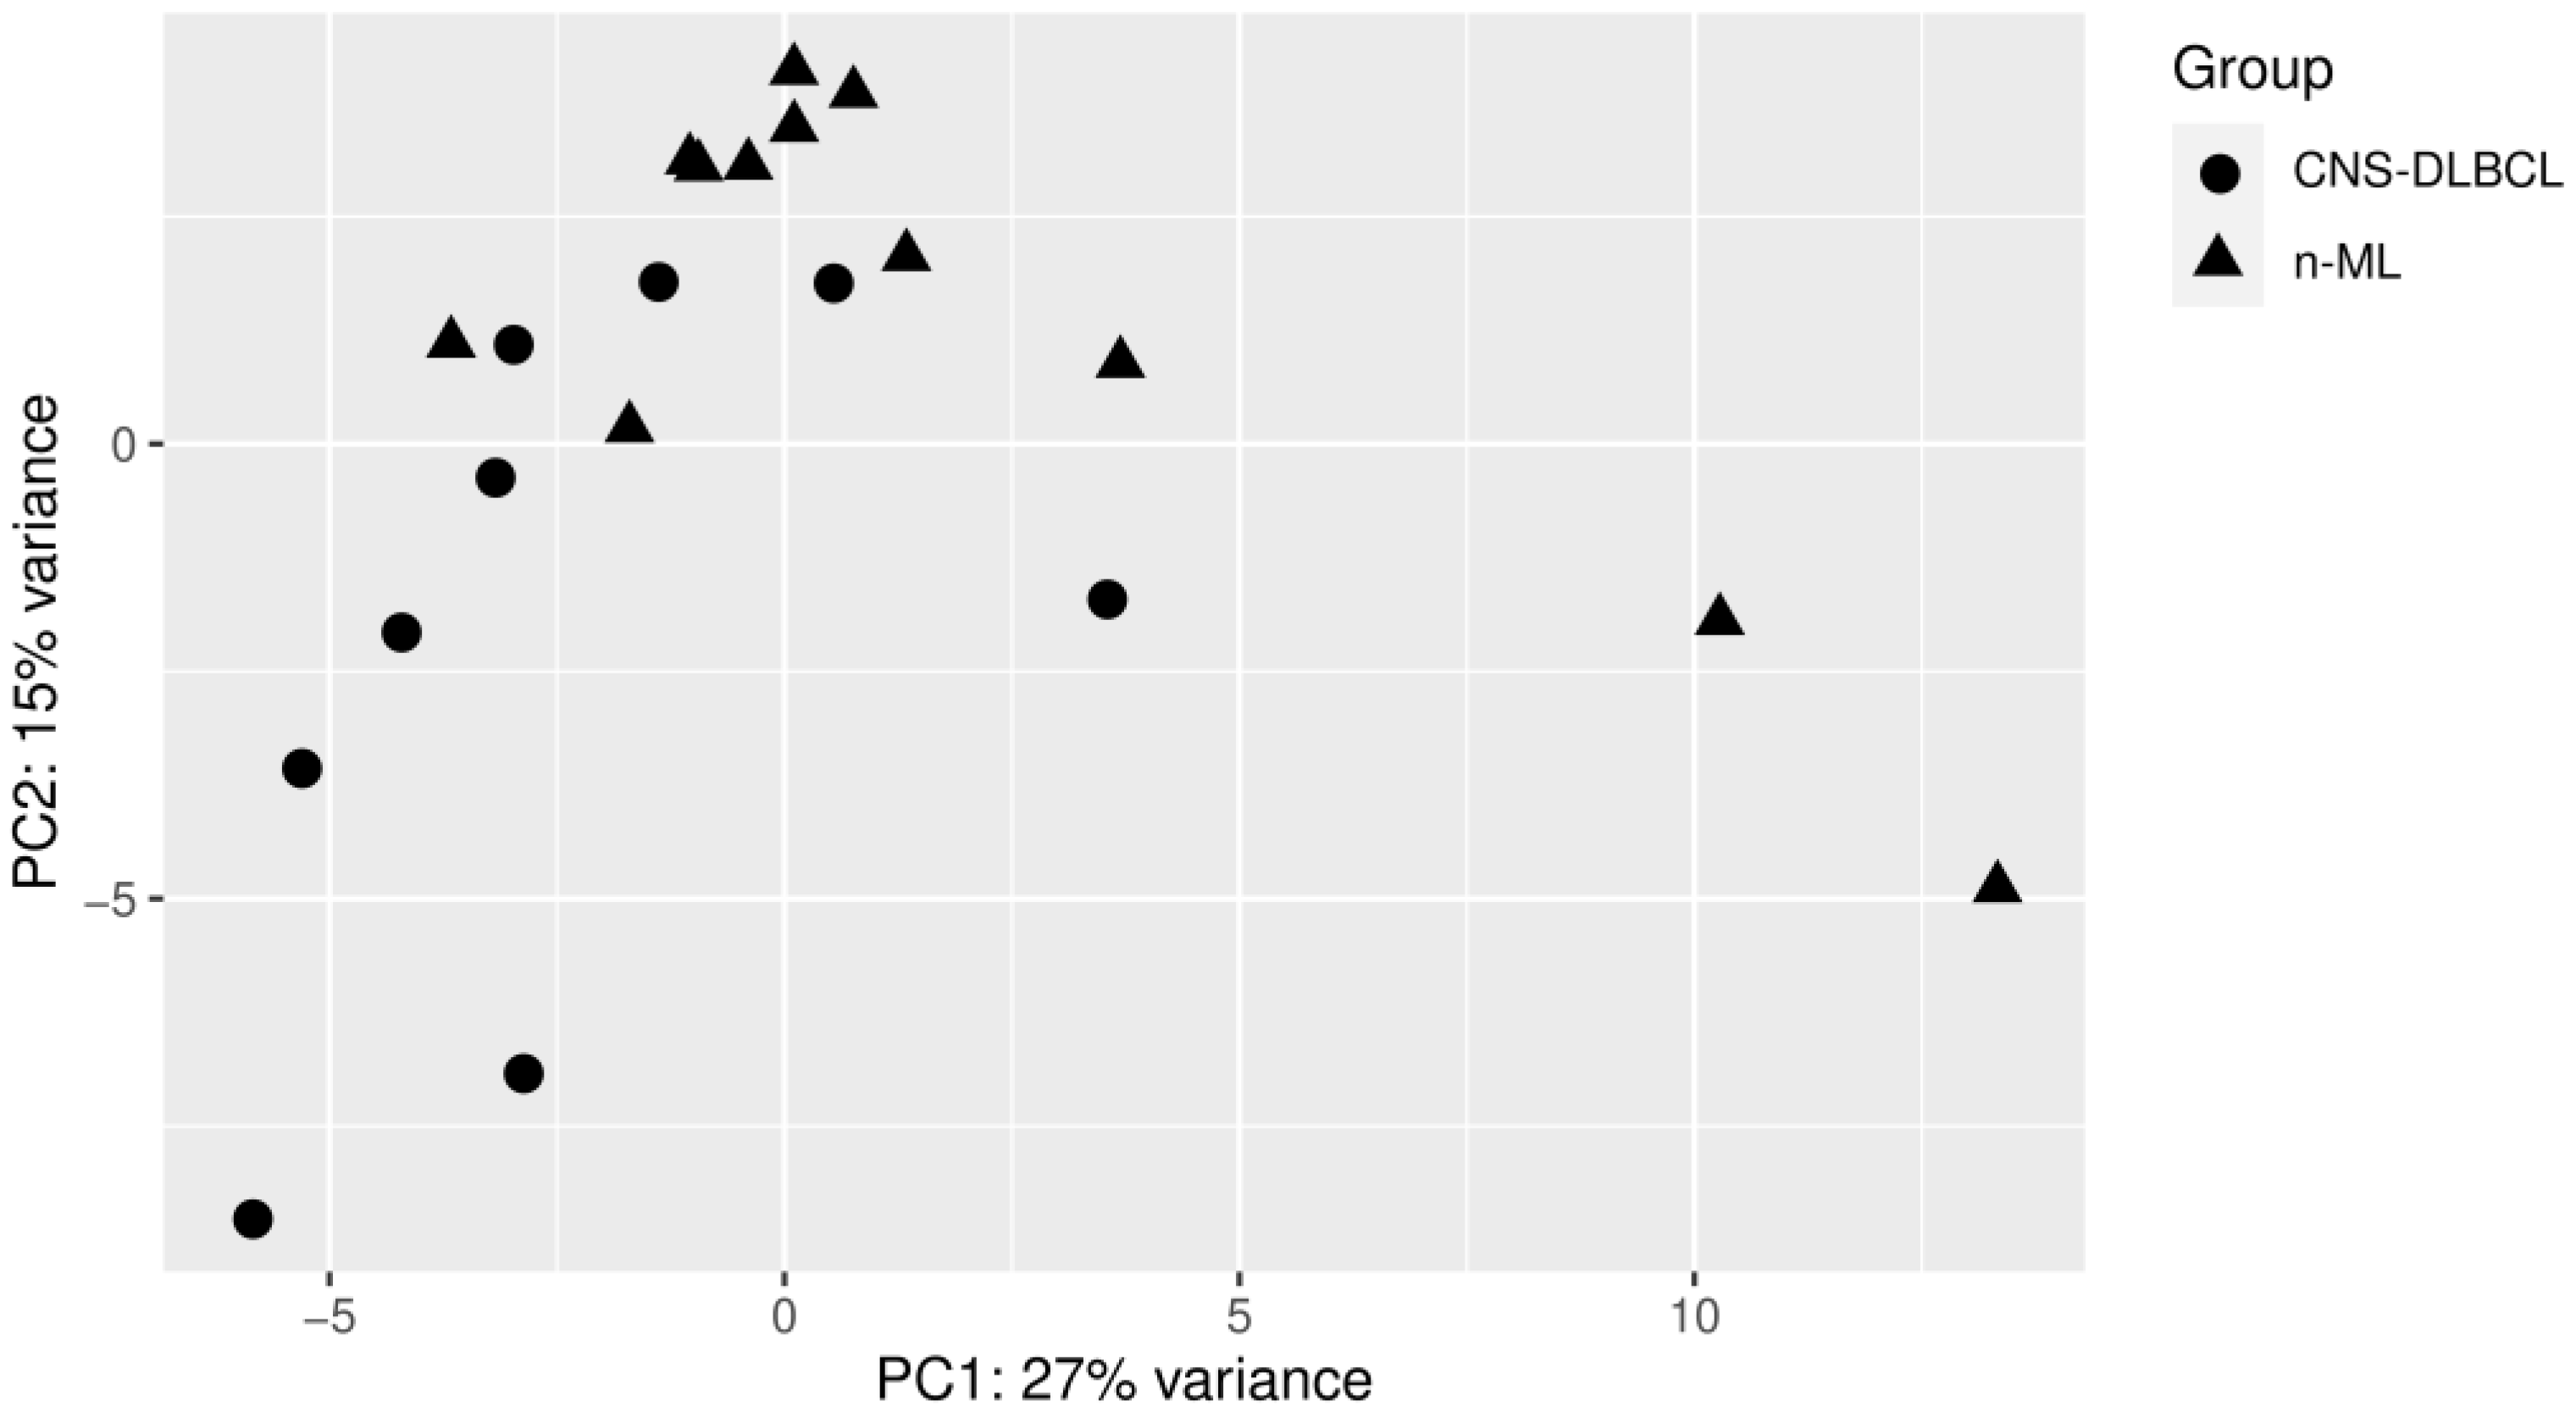
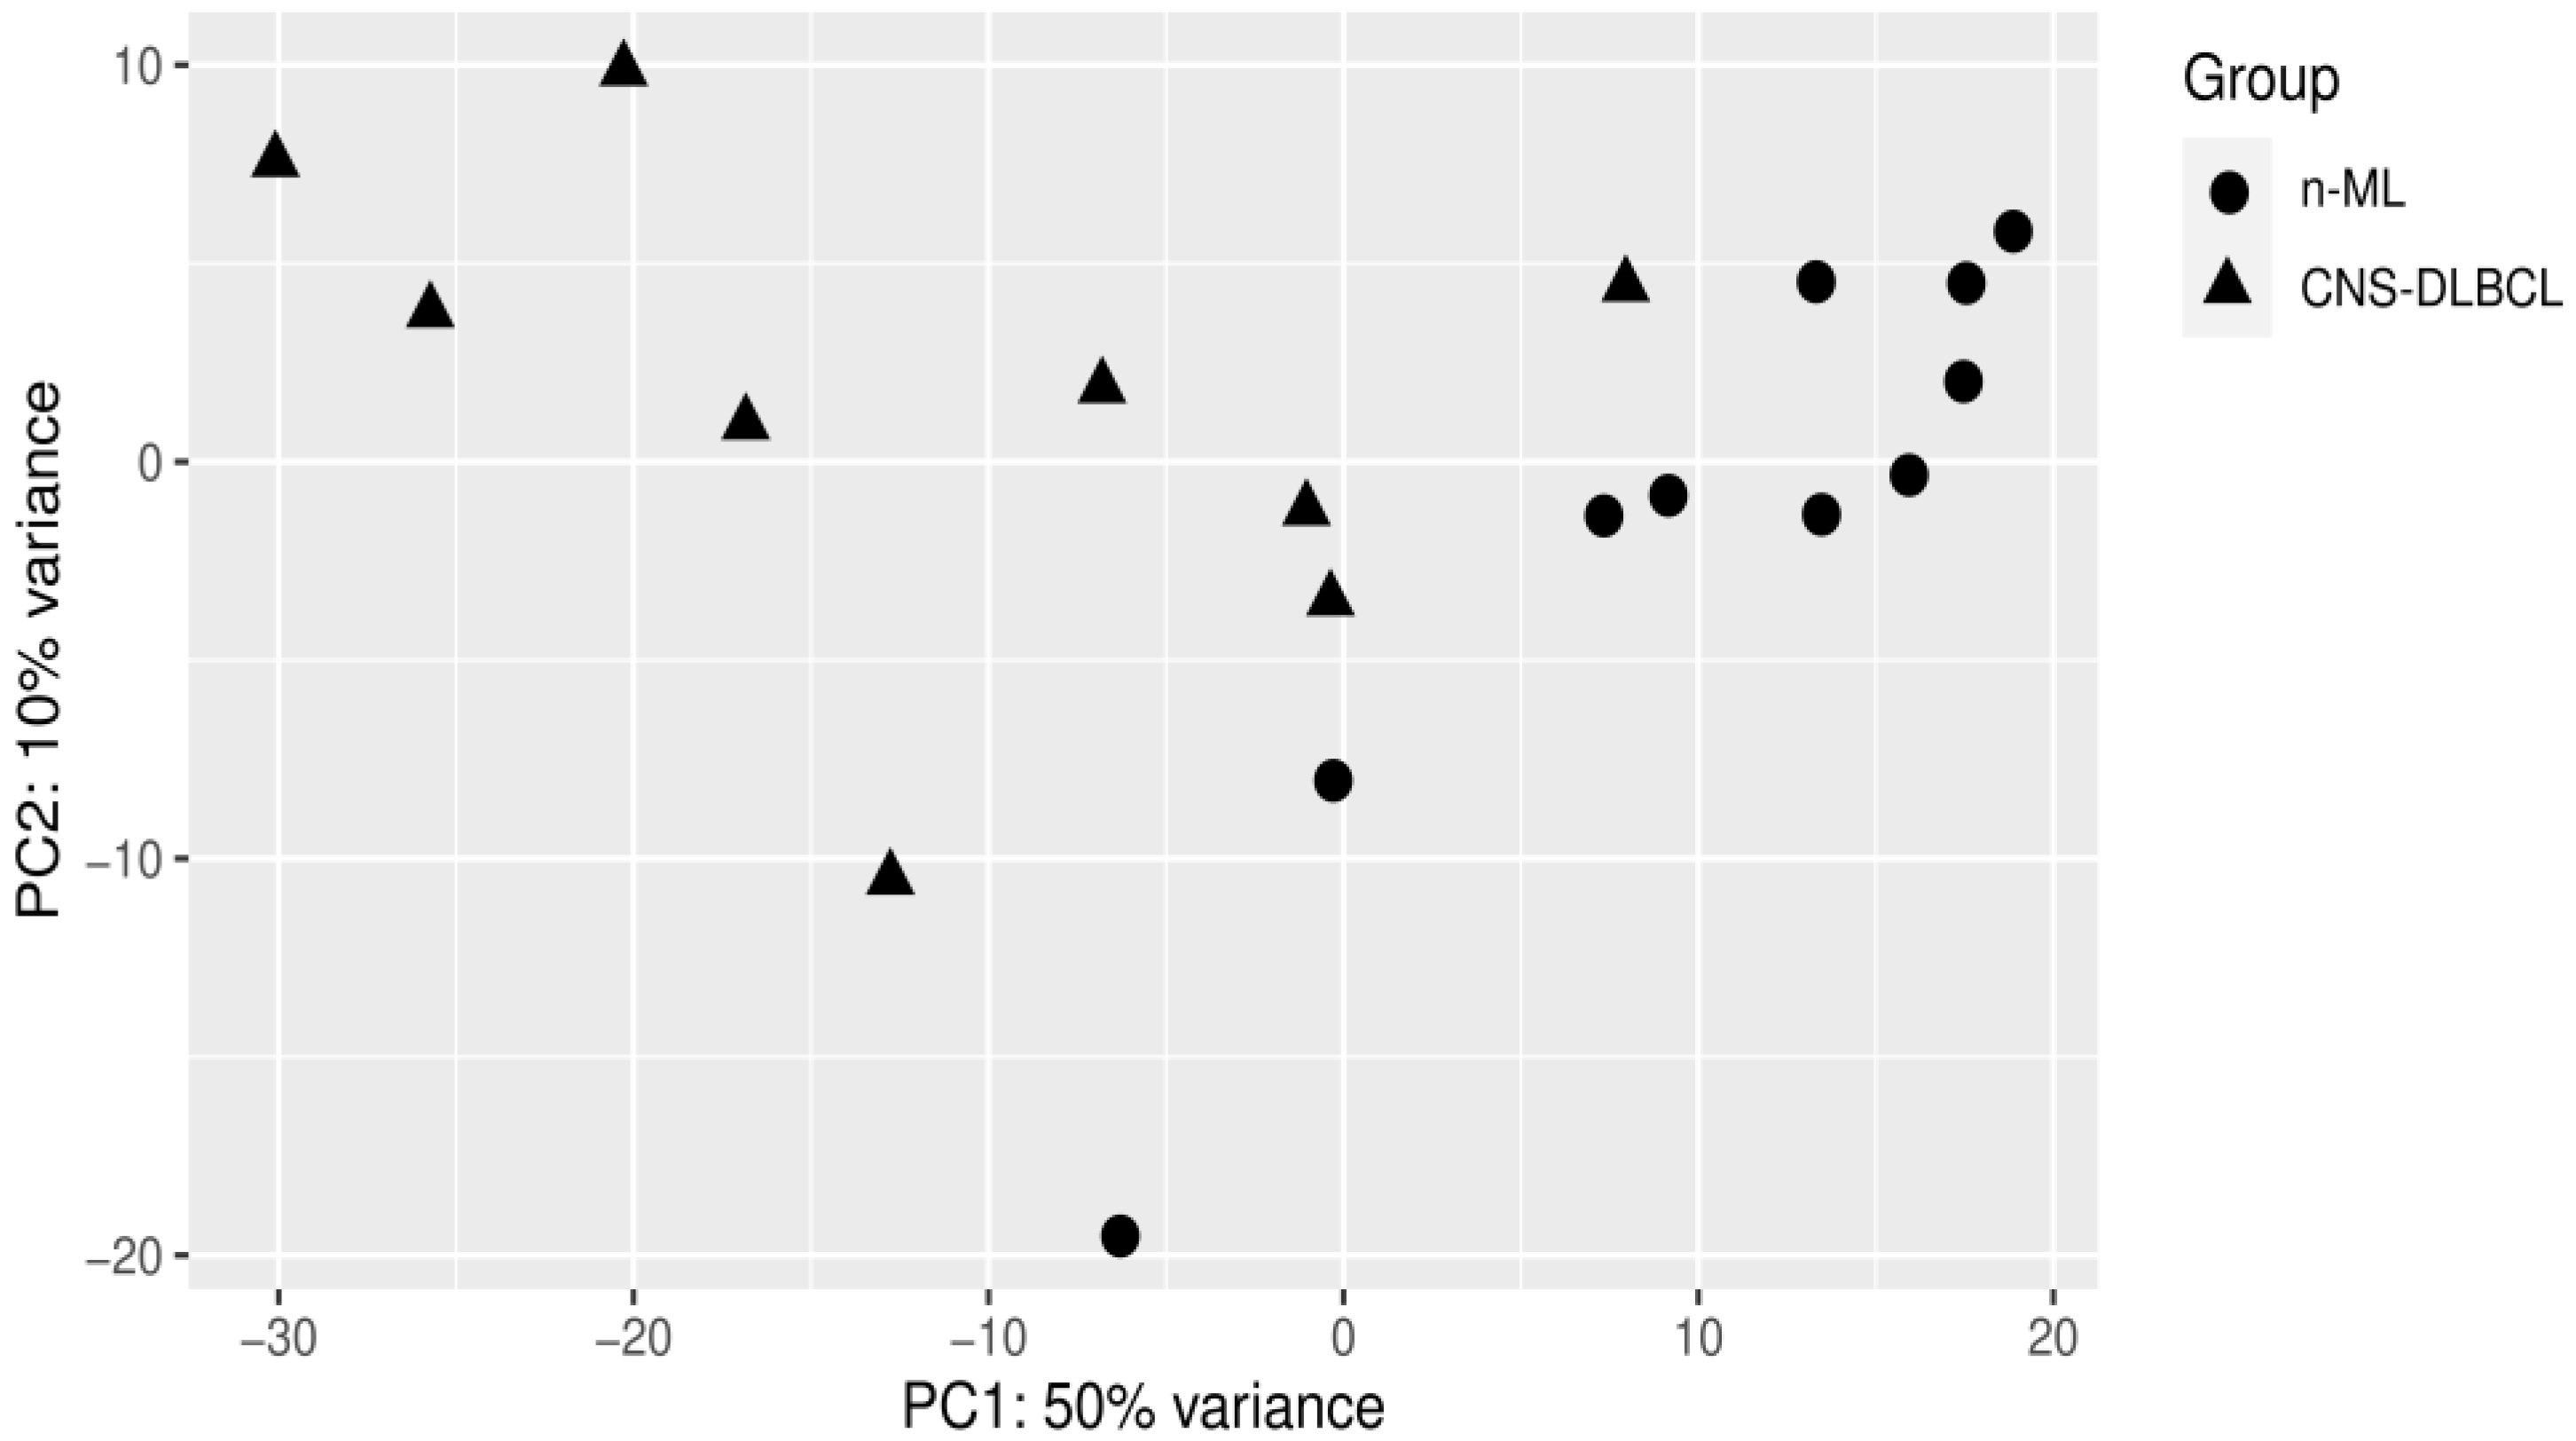
3.1. PCA Analyses
3.2. CNS DLBCL-Specific CSF miR Profile
3.3. CNS DLBCL-Specific miR Profile of Brain Tumors
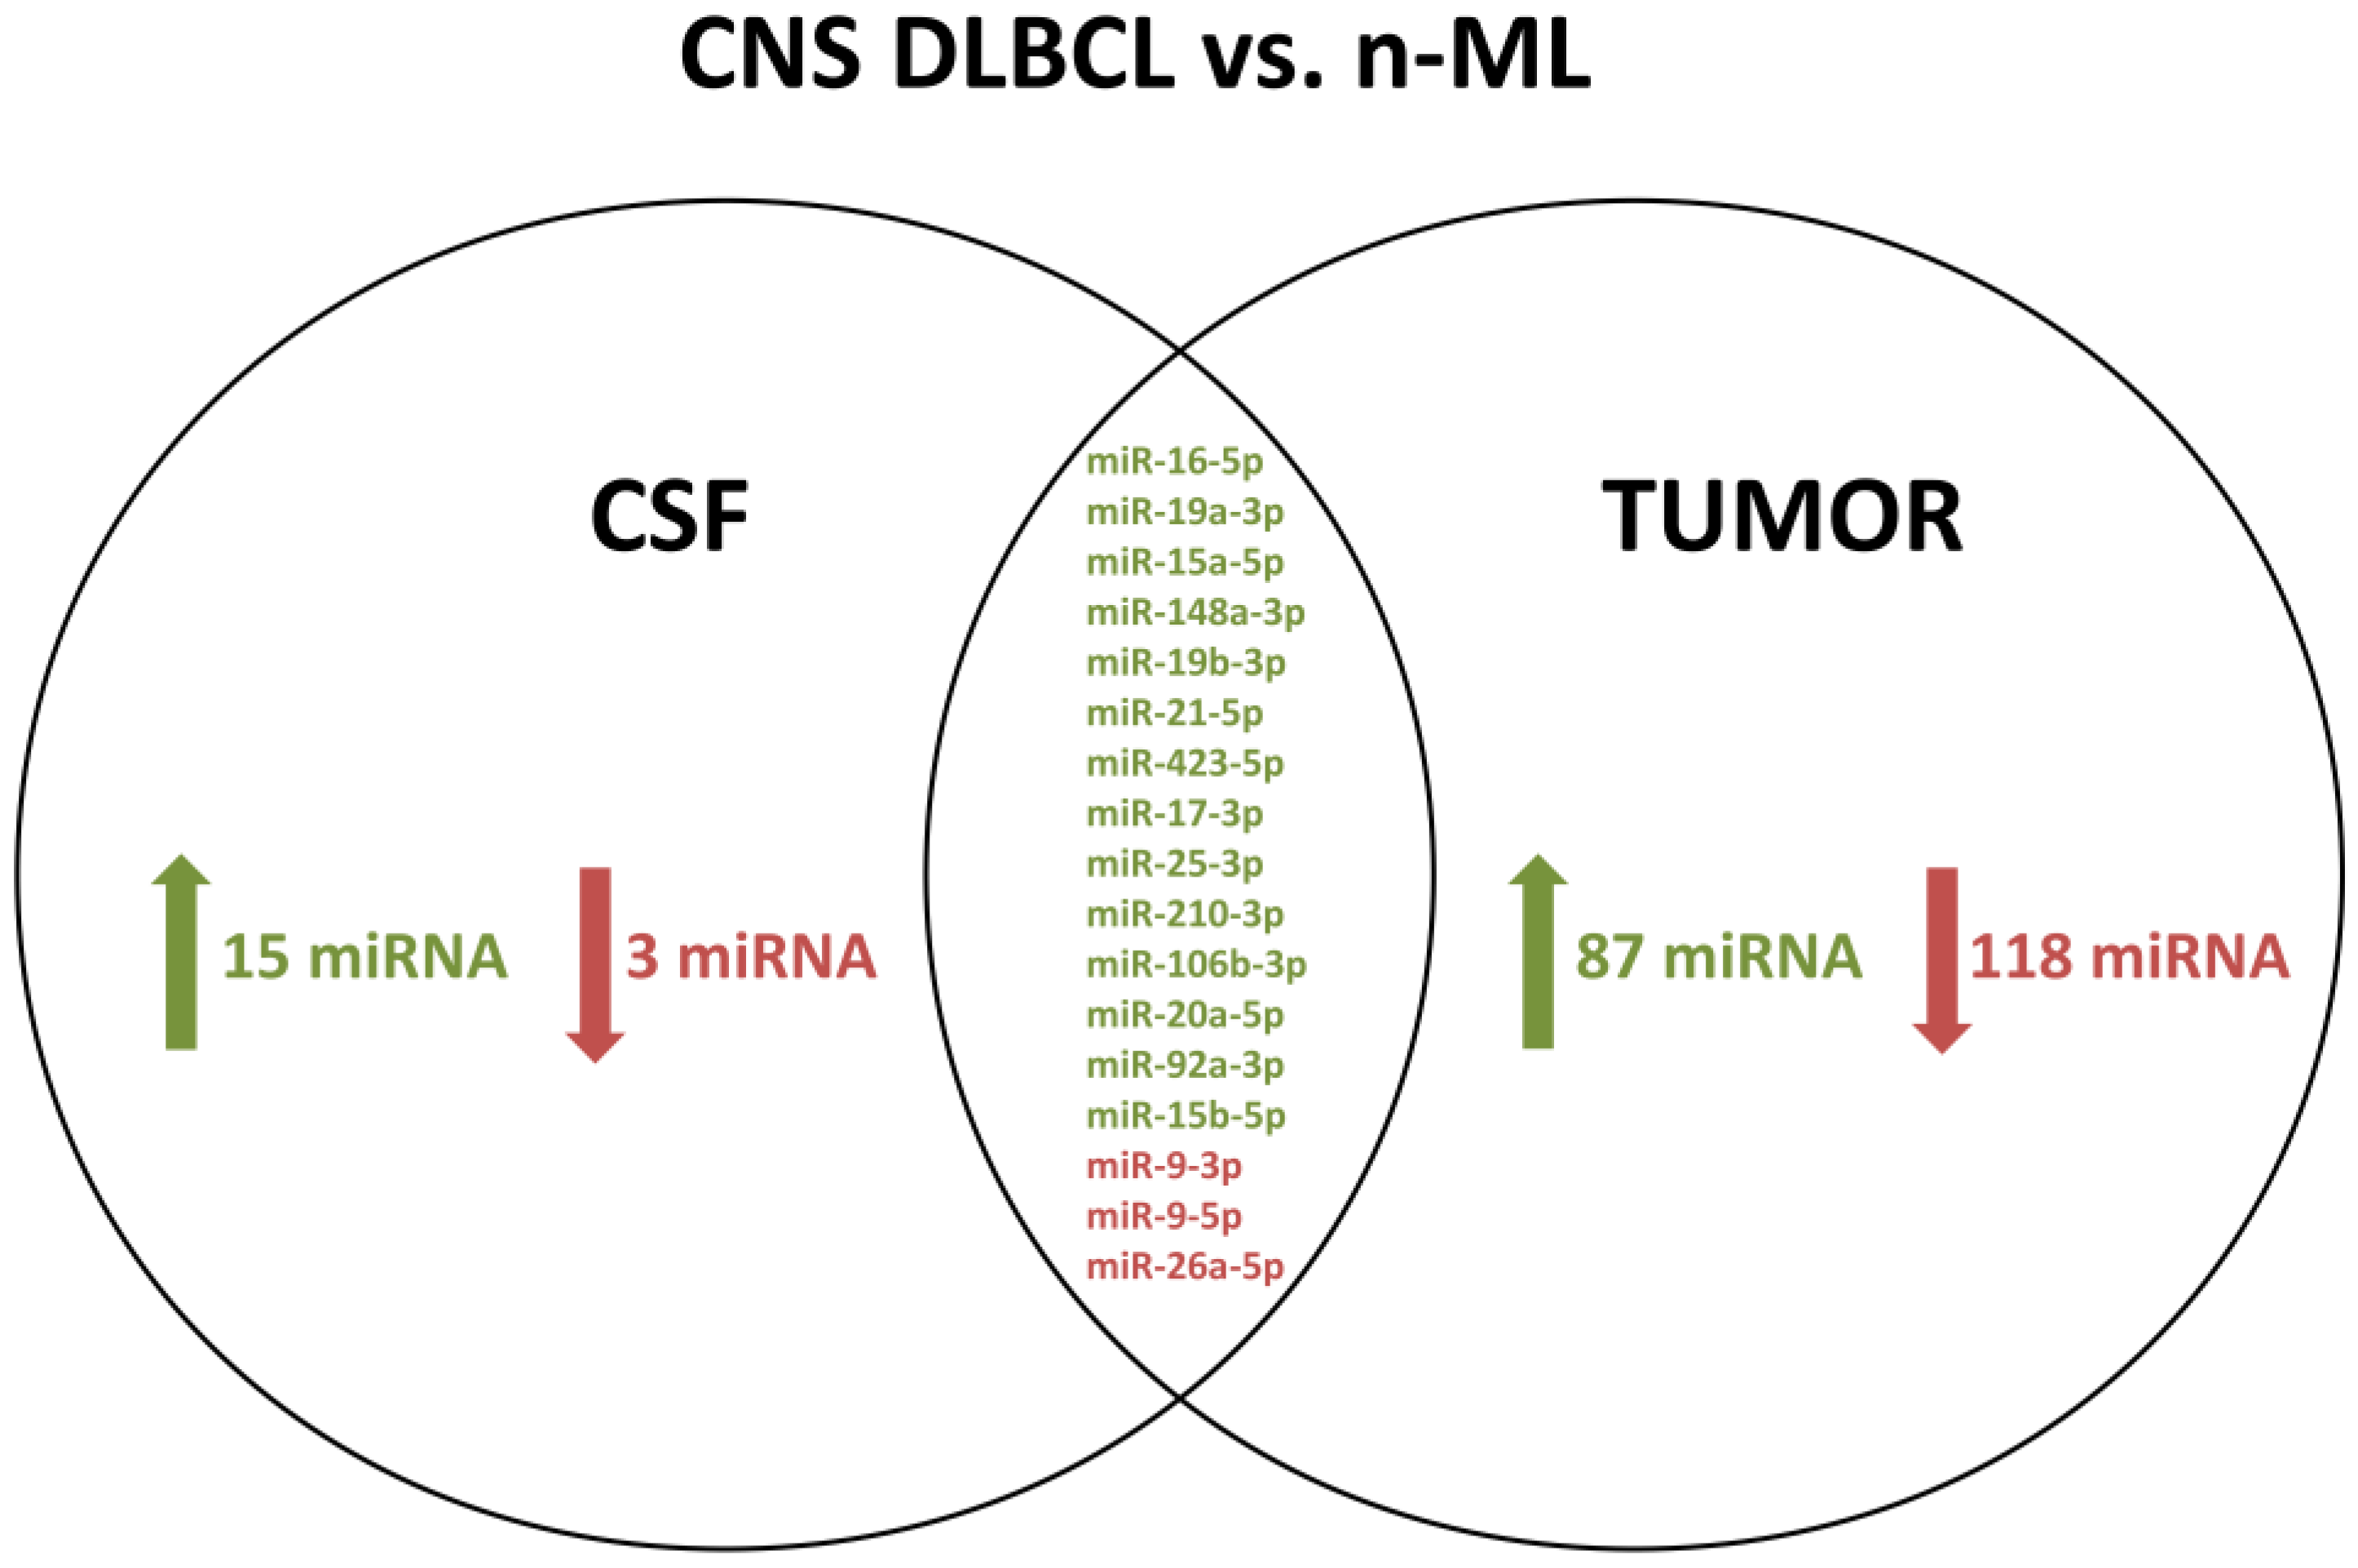
3.4. A Common set of CSF and Tumor miRs Differentially Expressed between CNS DLBCL and Non-Malignant CNS Diseases
3.5. miR Profiles in Paired CSF/Brain Samples from Patients with CNS DLBCL
3.6. New, Previously Unannotated micoRNA Molecules
3.7. RT-qPCR Validation of the NGS Results
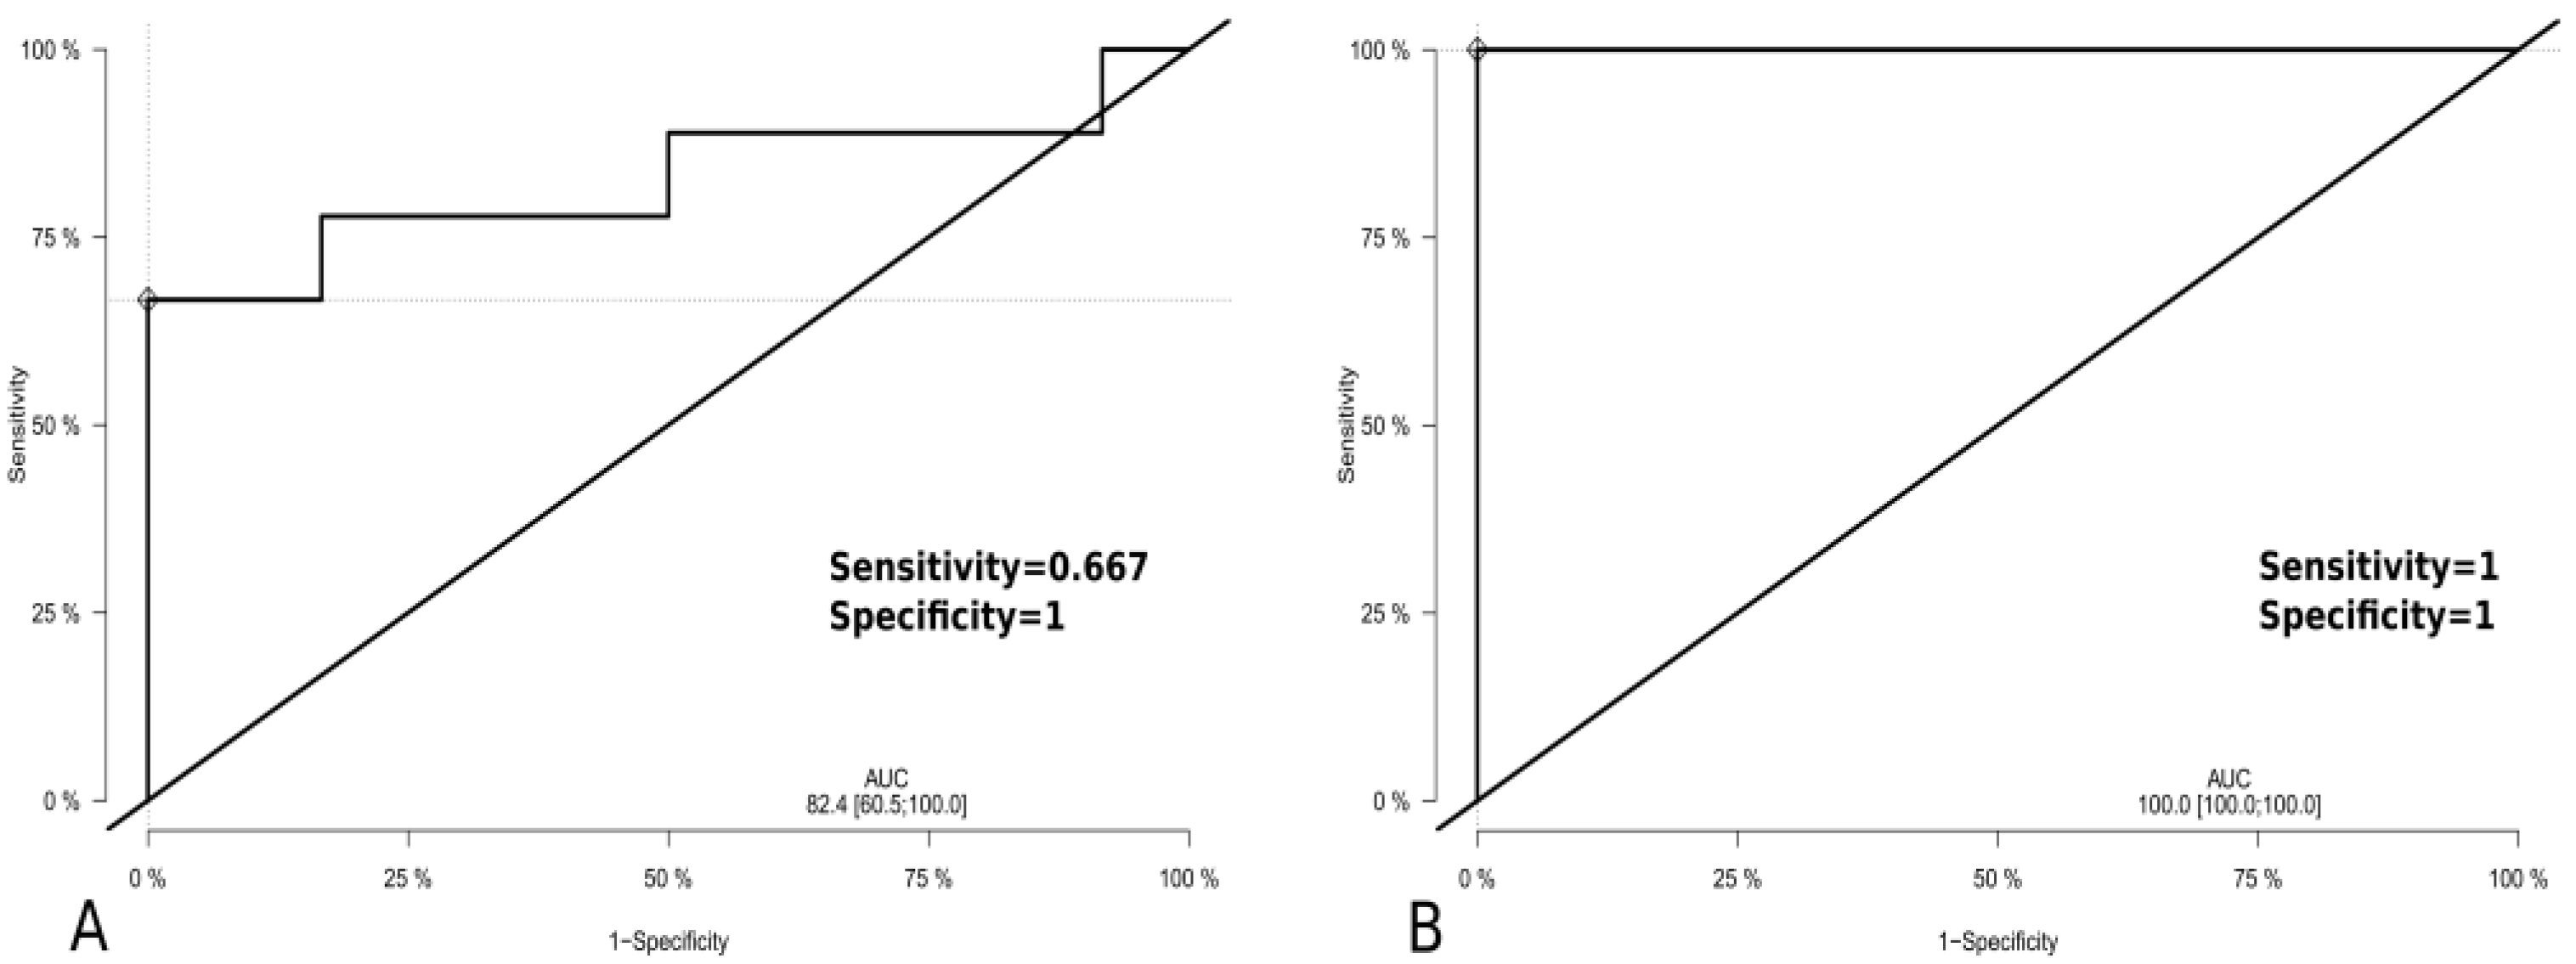
3.8. ROC Analyses
3.9. Functional Analyses of CNS DLBCL-Specific CSF and Tumor miR Profiles
3.9.1. Bioinformatic Analysis of CNS DLBCL-Specific CSF miR Profile
3.9.2. Bioinformatic Analysis of CNS DLBCL-Specific Tumor miR Profile
4. Discussion
5. Conclusions
Supplementary Materials
Author Contributions
Funding
Institutional Review Board Statement
Informed Consent Statement
Acknowledgments
Conflicts of Interest
References
- Han, C.H.; Batchelor, T.T. Diagnosis and management of primary central nervous system lymphoma. Cancer 2017, 123, 4314–4324. [Google Scholar] [CrossRef]
- Abrey, L.E.; Batchelor, T.T.; Ferreri, A.J.; Gospodarowicz, M.; Pulczynski, E.J.; Zucca, E.; Smith, J.R.; Korfel, A.; Soussain, C.; DeAngelis, L.M.; et al. Report of an international workshop to standardize baseline evaluation and response criteria for primary CNS lymphoma. J. Clin. Oncol. 2005, 23, 5034–5043. [Google Scholar] [CrossRef] [PubMed]
- Hoang-Xuan, K.; Bessell, E.; Bromberg, J.; Hottinger, A.F.; Preusser, M.; Ruda, R.; Schlegel, U.; Siegal, T.; Soussain, C.; Abacioglu, U.; et al. Diagnosis and treatment of primary CNS lymphoma in immunocompetent patients: Guidelines from the European Association for Neuro-Oncology. Lancet Oncol. 2015, 16, e322–e332. [Google Scholar] [CrossRef] [Green Version]
- Deckert, M.; Engert, A.; Bruck, W.; Ferreri, A.J.; Finke, J.; Illerhaus, G.; Klapper, W.; Korfel, A.; Kuppers, R.; Maarouf, M.; et al. Modern concepts in the biology, diagnosis, differential diagnosis and treatment of primary central nervous system lymphoma. Leukemia 2011, 25, 1797–1807. [Google Scholar] [CrossRef]
- Bruck, W.; Brunn, A.; Klapper, W.; Kuhlmann, T.; Metz, I.; Paulus, W.; Deckert, M.; Netzwerk Lymphome und Lymphomatoide Lasionen des, N. Differential diagnosis of lymphoid infiltrates in the central nervous system: Experience of the Network Lymphomas and Lymphomatoid Lesions in the Nervous System. Pathologe 2013, 34, 186–197. [Google Scholar] [CrossRef]
- Sasayama, T.; Nakamizo, S.; Nishihara, M.; Kawamura, A.; Tanaka, H.; Mizukawa, K.; Miyake, S.; Taniguchi, M.; Hosoda, K.; Kohmura, E. Cerebrospinal fluid interleukin-10 is a potentially useful biomarker in immunocompetent primary central nervous system lymphoma (PCNSL). Neuro-oncology 2012, 14, 368–380. [Google Scholar] [CrossRef] [PubMed] [Green Version]
- Rubenstein, J.L.; Wong, V.S.; Kadoch, C.; Gao, H.X.; Barajas, R.; Chen, L.; Josephson, S.A.; Scott, B.; Douglas, V.; Maiti, M.; et al. CXCL13 plus interleukin 10 is highly specific for the diagnosis of CNS lymphoma. Blood 2013, 121, 4740–4748. [Google Scholar] [CrossRef] [PubMed] [Green Version]
- Viaccoz, A.; Ducray, F.; Tholance, Y.; Barcelos, G.K.; Thomas-Maisonneuve, L.; Ghesquieres, H.; Meyronet, D.; Quadrio, I.; Cartalat-Carel, S.; Louis-Tisserand, G.; et al. CSF neopterin level as a diagnostic marker in primary central nervous system lymphoma. Neuro-oncology 2015, 17, 1497–1503. [Google Scholar] [CrossRef] [PubMed] [Green Version]
- van Westrhenen, A.; Smidt, L.C.A.; Seute, T.; Nierkens, S.; Stork, A.C.J.; Minnema, M.C.; Snijders, T.J. Diagnostic markers for CNS lymphoma in blood and cerebrospinal fluid: A systematic review. Br. J. Haematol. 2018, 182, 384–403. [Google Scholar] [CrossRef]
- Rao, P.; Benito, E.; Fischer, A. MicroRNAs as biomarkers for CNS disease. Front. Mol. Neurosci. 2013, 6, 39. [Google Scholar] [CrossRef] [Green Version]
- Wei, D.; Wan, Q.; Li, L.; Jin, H.; Liu, Y.; Wang, Y.; Zhang, G. MicroRNAs as Potential Biomarkers for Diagnosing Cancers of Central Nervous System: A Meta-analysis. Mol. Neurobiol. 2015, 51, 1452–1461. [Google Scholar] [CrossRef]
- Baraniskin, A.; Kuhnhenn, J.; Schlegel, U.; Chan, A.; Deckert, M.; Gold, R.; Maghnouj, A.; Zollner, H.; Reinacher-Schick, A.; Schmiegel, W.; et al. Identification of microRNAs in the cerebrospinal fluid as marker for primary diffuse large B-cell lymphoma of the central nervous system. Blood 2011, 117, 3140–3146. [Google Scholar] [CrossRef] [Green Version]
- Zajdel, M.; Rymkiewicz, G.; Sromek, M.; Cieslikowska, M.; Swoboda, P.; Kulinczak, M.; Goryca, K.; Bystydzienski, Z.; Blachnio, K.; Ostrowska, B.; et al. Tumor and Cerebrospinal Fluid microRNAs in Primary Central Nervous System Lymphomas. Cancers 2019, 11, 1647. [Google Scholar] [CrossRef] [Green Version]
- Zajdel, M.; Rymkiewicz, G.; Chechlinska, M.; Blachnio, K.; Pienkowska-Grela, B.; Grygalewicz, B.; Goryca, K.; Cieslikowska, M.; Bystydzienski, Z.; Swoboda, P.; et al. miR expression in MYC-negative DLBCL/BL with partial trisomy 11 is similar to classical Burkitt lymphoma and different from diffuse large B-cell lymphoma. Tumour Biol. 2015, 36, 5377–5388. [Google Scholar] [CrossRef] [PubMed]
- Borowitz, M.J.; Chan, J.K.C.; Béné, M.C.; Arber, D.A. T-lymphoblastic leukaemia/lymphoma. In WHO Classification of Tumours of Haematopoietic and Lymphoid Tissues, Revised, 4th ed.; Swerdlow, S.H., Campo, E., Harris, N.L., Jaffe, E.S., Pileri, S.A., Stein, H., Thiele, J., Arber, D.A., Hasserjian, R.P., Le Beau, M.M., et al., Eds.; IARC: Lyon, France, 2017; pp. 209–212. [Google Scholar]
- Louis, D.N.; Perry, A.; Reifenberger, G.; von Deimling, A.; Figarella-Branger, D.; Cavenee, W.K.; Ohgaki, H.; Wiestler, O.D.; Kleihues, P.; Ellison, D.W. The 2016 World Health Organization Classification of Tumors of the Central Nervous System: A summary. Acta Neuropathol. 2016, 131, 803–820. [Google Scholar] [CrossRef] [Green Version]
- Borowitz, M.J.; Chan, J.K.C. T lymphoblastic leukaemia/lymphoma. In WHO Classification of Tumours of Haematopoietic and Lymphoid Tissues, 4th ed.; Swerdlow, S.H., Campo, E., Harris, N.L., Jaffe, E.S., Pileri, S.A., Stein, H., Thiele, J., Vardiman, J.W., Eds.; IARC: Lyon, France, 2008; pp. 176–178. [Google Scholar]
- Metpally, R.P.; Nasser, S.; Malenica, I.; Courtright, A.; Carlson, E.; Ghaffari, L.; Villa, S.; Tembe, W.; Van Keuren-Jensen, K. Comparison of Analysis Tools for miRNA High Throughput Sequencing Using Nerve Crush as a Model. Front. Genet. 2013, 4, 20. [Google Scholar] [CrossRef] [PubMed] [Green Version]
- Waller, R.; Wyles, M.; Heath, P.R.; Kazoka, M.; Wollff, H.; Shaw, P.J.; Kirby, J. Small RNA Sequencing of Sporadic Amyotrophic Lateral Sclerosis Cerebrospinal Fluid Reveals Differentially Expressed miRNAs Related to Neural and Glial Activity. Front. Neurosci. 2017, 11, 731. [Google Scholar] [CrossRef]
- Liu, X.; Wang, S.; Meng, F.; Wang, J.; Zhang, Y.; Dai, E.; Yu, X.; Li, X.; Jiang, W. SM2miR: A database of the experimentally validated small molecules’ effects on microRNA expression. Bioinformatics 2013, 29, 409–411. [Google Scholar] [CrossRef]
- Cogswell, J.P.; Ward, J.; Taylor, I.A.; Waters, M.; Shi, Y.; Cannon, B.; Kelnar, K.; Kemppainen, J.; Brown, D.; Chen, C.; et al. Identification of miRNA changes in Alzheimer’s disease brain and CSF yields putative biomarkers and insights into disease pathways. J. Alzheimers Dis. 2008, 14, 27–41. [Google Scholar] [CrossRef] [PubMed]
- Bekris, L.M.; Lutz, F.; Montine, T.J.; Yu, C.E.; Tsuang, D.; Peskind, E.R.; Leverenz, J.B. MicroRNA in Alzheimer’s disease: An exploratory study in brain, cerebrospinal fluid and plasma. Biomarkers 2013, 18, 455–466. [Google Scholar] [CrossRef] [Green Version]
- Llorens, F.; Thune, K.; Marti, E.; Kanata, E.; Dafou, D.; Diaz-Lucena, D.; Vivancos, A.; Shomroni, O.; Zafar, S.; Schmitz, M.; et al. Regional and subtype-dependent miRNA signatures in sporadic Creutzfeldt-Jakob disease are accompanied by alterations in miRNA silencing machinery and biogenesis. PLoS Pathog. 2018, 14, e1006802. [Google Scholar] [CrossRef] [Green Version]
- Molinuevo, J.L.; Ayton, S.; Batrla, R.; Bednar, M.M.; Bittner, T.; Cummings, J.; Fagan, A.M.; Hampel, H.; Mielke, M.M.; Mikulskis, A.; et al. Current state of Alzheimer’s fluid biomarkers. Acta Neuropathol. 2018, 136, 821–853. [Google Scholar] [CrossRef] [Green Version]
- Cookson, V.J.; Bentley, M.A.; Hogan, B.V.; Horgan, K.; Hayward, B.E.; Hazelwood, L.D.; Hughes, T.A. Circulating microRNA profiles reflect the presence of breast tumours but not the profiles of microRNAs within the tumours. Cell. Oncol. 2012, 35, 301–308. [Google Scholar] [CrossRef]
- Halvorsen, A.R.; Bjaanaes, M.; LeBlanc, M.; Holm, A.M.; Bolstad, N.; Rubio, L.; Penalver, J.C.; Cervera, J.; Mojarrieta, J.C.; Lopez-Guerrero, J.A.; et al. A unique set of 6 circulating microRNAs for early detection of non-small cell lung cancer. Oncotarget 2016, 7, 37250–37259. [Google Scholar] [CrossRef] [PubMed] [Green Version]
- Bookland, M.; Gillan, E.; Song, X.; Kolmakova, A. Peripheral circulation miRNA expression of pediatric brain tumors and its relation to tumor miRNA expression levels. J. Neurosurg. Pediatr. 2020, 26, 136–144. [Google Scholar] [CrossRef] [PubMed]
- Armstrong, D.A.; Green, B.B.; Seigne, J.D.; Schned, A.R.; Marsit, C.J. MicroRNA molecular profiling from matched tumor and bio-fluids in bladder cancer. Mol. Cancer 2015, 14, 194. [Google Scholar] [CrossRef] [PubMed] [Green Version]
- Cecene, G.; Ak, S.; Eskiler, G.G.; Demirdogen, E.; Erturk, E.; Gokgoz, S.; Polatkan, V.; Egeli, U.; Tunca, B.; Tezcan, G.; et al. Circulating miR-195 as a Therapeutic Biomarker in Turkish Breast Cancer Patients. Asian Pac. J. Cancer Prev. 2016, 17, 4241–4246. [Google Scholar]
- Qattan, A.; Intabli, H.; Alkhayal, W.; Eltabache, C.; Tweigieri, T.; Amer, S.B. Robust expression of tumor suppressor miRNA’s let-7 and miR-195 detected in plasma of Saudi female breast cancer patients. BMC Cancer 2017, 17, 799. [Google Scholar] [CrossRef] [PubMed]
- McDermott, A.M.; Miller, N.; Wall, D.; Martyn, L.M.; Ball, G.; Sweeney, K.J.; Kerin, M.J. Identification and validation of oncologic miRNA biomarkers for luminal A-like breast cancer. PLoS ONE 2014, 9, e87032. [Google Scholar] [CrossRef] [Green Version]
- McAllister, S.S.; Weinberg, R.A. The tumour-induced systemic environment as a critical regulator of cancer progression and metastasis. Nat. Cell Biol. 2014, 16, 717–727. [Google Scholar] [CrossRef]
- Turchinovich, A.; Burwinkel, B. Distinct AGO1 and AGO2 associated miRNA profiles in human cells and blood plasma. RNA Biol. 2012, 9, 1066–1075. [Google Scholar] [CrossRef] [PubMed] [Green Version]
- Shalaby, T.; Grotzer, M.A. Tumor-Associated CSF MicroRNAs for the Prediction and Evaluation of CNS Malignancies. Int. J. Mol. Sci. 2015, 16, 29103–29119. [Google Scholar] [CrossRef]
- van den Berg, M.M.J.; Krauskopf, J.; Ramaekers, J.G.; Kleinjans, J.C.S.; Prickaerts, J.; Briede, J.J. Circulating microRNAs as potential biomarkers for psychiatric and neurodegenerative disorders. Prog. Neurobiol. 2020, 185, 101732. [Google Scholar] [CrossRef] [PubMed]
- Palmer, A.M. The role of the blood-CNS barrier in CNS disorders and their treatment. Neurobiol. Dis. 2010, 37, 3–12. [Google Scholar] [CrossRef]
- Pigati, L.; Yaddanapudi, S.C.; Iyengar, R.; Kim, D.J.; Hearn, S.A.; Danforth, D.; Hastings, M.L.; Duelli, D.M. Selective release of microRNA species from normal and malignant mammary epithelial cells. PLoS ONE 2010, 5, e13515. [Google Scholar] [CrossRef] [PubMed] [Green Version]
- Tosar, J.P.; Gambaro, F.; Sanguinetti, J.; Bonilla, B.; Witwer, K.W.; Cayota, A. Assessment of small RNA sorting into different extracellular fractions revealed by high-throughput sequencing of breast cell lines. Nucleic Acids Res. 2015, 43, 5601–5616. [Google Scholar] [CrossRef] [PubMed] [Green Version]
- Yagi, Y.; Ohkubo, T.; Kawaji, H.; Machida, A.; Miyata, H.; Goda, S.; Roy, S.; Hayashizaki, Y.; Suzuki, H.; Yokota, T. Next-generation sequencing-based small RNA profiling of cerebrospinal fluid exosomes. Neurosci. Lett. 2017, 636, 48–57. [Google Scholar] [CrossRef]
- Syed, S.N.; Frank, A.C.; Raue, R.; Brune, B. MicroRNA-A Tumor Trojan Horse for Tumor-Associated Macrophages. Cells 2019, 8, 1482. [Google Scholar] [CrossRef] [Green Version]
- Dang, X.; Ma, A.; Yang, L.; Hu, H.; Zhu, B.; Shang, D.; Chen, T.; Luo, Y. MicroRNA-26a regulates tumorigenic properties of EZH2 in human lung carcinoma cells. Cancer Genet. 2012, 205, 113–123. [Google Scholar] [CrossRef]
- Zhang, B.; Liu, X.X.; He, J.R.; Zhou, C.X.; Guo, M.; He, M.; Li, M.F.; Chen, G.Q.; Zhao, Q. Pathologically decreased miR-26a antagonizes apoptosis and facilitates carcinogenesis by targeting MTDH and EZH2 in breast cancer. Carcinogenesis 2011, 32, 2–9. [Google Scholar] [CrossRef] [Green Version]
- Lu, J.; He, M.L.; Wang, L.; Chen, Y.; Liu, X.; Dong, Q.; Chen, Y.C.; Peng, Y.; Yao, K.T.; Kung, H.F.; et al. MiR-26a inhibits cell growth and tumorigenesis of nasopharyngeal carcinoma through repression of EZH2. Cancer Res. 2011, 71, 225–233. [Google Scholar] [CrossRef] [Green Version]
- Li, Y.; Wang, P.; Wu, L.L.; Yan, J.; Pang, X.Y.; Liu, S.J. miR-26a-5p Inhibit Gastric Cancer Cell Proliferation and Invasion Through Mediated Wnt5a. Onco Targets Ther. 2020, 13, 2537–2550. [Google Scholar] [CrossRef] [Green Version]
- Koh, C.M.; Iwata, T.; Zheng, Q.; Bethel, C.; Yegnasubramanian, S.; De Marzo, A.M. Myc enforces overexpression of EZH2 in early prostatic neoplasia via transcriptional and post-transcriptional mechanisms. Oncotarget 2011, 2, 669–683. [Google Scholar] [CrossRef] [Green Version]
- Reuland, S.N.; Smith, S.M.; Bemis, L.T.; Goldstein, N.B.; Almeida, A.R.; Partyka, K.A.; Marquez, V.E.; Zhang, Q.; Norris, D.A.; Shellman, Y.G. MicroRNA-26a is strongly downregulated in melanoma and induces cell death through repression of silencer of death domains (SODD). J. Investig. Dermatol 2013, 133, 1286–1293. [Google Scholar] [CrossRef] [Green Version]
- Sander, S.; Bullinger, L.; Klapproth, K.; Fiedler, K.; Kestler, H.A.; Barth, T.F.; Moller, P.; Stilgenbauer, S.; Pollack, J.R.; Wirth, T. MYC stimulates EZH2 expression by repression of its negative regulator miR-26a. Blood 2008, 112, 4202–4212. [Google Scholar] [CrossRef] [PubMed] [Green Version]
- Tao, J.; Zhao, X.; Tao, J. c-MYC-miRNA circuitry: A central regulator of aggressive B-cell malignancies. Cell Cycle 2014, 13, 191–198. [Google Scholar] [CrossRef] [PubMed] [Green Version]
- Gill, K.Z.; Iwamoto, F.; Allen, A.; Hoehn, D.; Murty, V.V.; Alobeid, B.; Bhagat, G. MYC protein expression in primary diffuse large B-cell lymphoma of the central nervous system. PLoS ONE 2014, 9, e114398. [Google Scholar] [CrossRef] [Green Version]
- Brunn, A.; Nagel, I.; Montesinos-Rongen, M.; Klapper, W.; Vater, I.; Paulus, W.; Hans, V.; Blumcke, I.; Weis, J.; Siebert, R.; et al. Frequent triple-hit expression of MYC, BCL2, and BCL6 in primary lymphoma of the central nervous system and absence of a favorable MYC(low)BCL2 (low) subgroup may underlie the inferior prognosis as compared to systemic diffuse large B cell lymphomas. Acta Neuropathol. 2013, 126, 603–605. [Google Scholar] [CrossRef] [PubMed]
- Shi, Q.Y.; Feng, X.; Bao, W.; Ma, J.; Lv, J.H.; Wang, X.; Rao, Q.; Shi, Q.L. MYC/BCL2 Co-Expression Is a Stronger Prognostic Factor Compared With the Cell-of-Origin Classification in Primary CNS DLBCL. J. Neuropathol. Exp. Neurol. 2017, 76, 942–948. [Google Scholar] [CrossRef]
- Zhao, X.; Lwin, T.; Zhang, X.; Huang, A.; Wang, J.; Marquez, V.E.; Chen-Kiang, S.; Dalton, W.S.; Sotomayor, E.; Tao, J. Disruption of the MYC-miRNA-EZH2 loop to suppress aggressive B-cell lymphoma survival and clonogenicity. Leukemia 2013, 27, 2341–2350. [Google Scholar] [CrossRef] [PubMed] [Green Version]
- Fang, C.; Zhu, D.X.; Dong, H.J.; Zhou, Z.J.; Wang, Y.H.; Liu, L.; Fan, L.; Miao, K.R.; Liu, P.; Xu, W.; et al. Serum microRNAs are promising novel biomarkers for diffuse large B cell lymphoma. Ann. Hematol. 2012, 91, 553–559. [Google Scholar] [CrossRef] [PubMed]
- Beheshti, A.; Stevenson, K.; Vanderburg, C.; Ravi, D.; McDonald, J.T.; Christie, A.L.; Shigemori, K.; Jester, H.; Weinstock, D.M.; Evens, A.M. Identification of Circulating Serum Multi-MicroRNA Signatures in Human DLBCL Models. Sci. Rep. 2019, 9, 17161. [Google Scholar] [CrossRef]
- Guo, J.; Dong, Q.; Fang, Z.; Chen, X.; Lu, H.; Wang, K.; Yin, Y.; Cai, X.; Zhao, N.; Chen, J.; et al. Identification of miRNAs that are associated with tumor metastasis in neuroblastoma. Cancer Biol. Ther. 2010, 9, 446–452. [Google Scholar] [CrossRef] [Green Version]
- Xin, C.; Buhe, B.; Hongting, L.; Chuanmin, Y.; Xiwei, H.; Hong, Z.; Lulu, H.; Qian, D.; Renjie, W. MicroRNA-15a promotes neuroblastoma migration by targeting reversion-inducing cysteine-rich protein with Kazal motifs (RECK) and regulating matrix metalloproteinase-9 expression. FEBS J. 2013, 280, 855–866. [Google Scholar] [CrossRef]
- Zhang, X.; Chen, Y.; Zhao, P.; Zang, L.; Zhang, Z.; Wang, X. MicroRNA-19a functions as an oncogene by regulating PTEN/AKT/pAKT pathway in myeloma. Leuk. Lymphoma 2017, 58, 932–940. [Google Scholar] [CrossRef] [PubMed]
- Jiang, X.M.; Yu, X.N.; Liu, T.T.; Zhu, H.R.; Shi, X.; Bilegsaikhan, E.; Guo, H.Y.; Song, G.Q.; Weng, S.Q.; Huang, X.X.; et al. microRNA-19a-3p promotes tumor metastasis and chemoresistance through the PTEN/Akt pathway in hepatocellular carcinoma. Biomed. Pharmacother. 2018, 105, 1147–1154. [Google Scholar] [CrossRef] [PubMed]
- Bai, R.; Cui, Z.; Ma, Y.; Wu, Y.; Wang, N.; Huang, L.; Yao, Q.; Sun, J. The NF-kappaB-modulated miR-19a-3p enhances malignancy of human ovarian cancer cells through inhibition of IGFBP-3 expression. Mol. Carcinog. 2019, 58, 2254–2265. [Google Scholar] [CrossRef] [PubMed]
- Zhang, B.; Liu, Y.; Zhang, J. Silencing of miR-19a-3p enhances osteosarcoma cells chemosensitivity by elevating the expression of tumor suppressor PTEN. Oncol. Lett. 2019, 17, 414–421. [Google Scholar] [CrossRef] [PubMed] [Green Version]
- Cao, Z.; Liu, C.; Xu, J.; You, L.; Wang, C.; Lou, W.; Sun, B.; Miao, Y.; Liu, X.; Wang, X.; et al. Plasma microRNA panels to diagnose pancreatic cancer: Results from a multicenter study. Oncotarget 2016, 7, 41575–41583. [Google Scholar] [CrossRef] [Green Version]
- Liu, H.; Liu, Y.; Sun, P.; Leng, K.; Xu, Y.; Mei, L.; Han, P.; Zhang, B.; Yao, K.; Li, C.; et al. Colorectal cancer-derived exosomal miR-106b-3p promotes metastasis by down-regulating DLC-1 expression. Clin. Sci. 2020, 134, 419–434. [Google Scholar] [CrossRef] [Green Version]
- Moshiri, F.; Salvi, A.; Gramantieri, L.; Sangiovanni, A.; Guerriero, P.; De Petro, G.; Bassi, C.; Lupini, L.; Sattari, A.; Cheung, D.; et al. Circulating miR-106b-3p, miR-101-3p and miR-1246 as diagnostic biomarkers of hepatocellular carcinoma. Oncotarget 2018, 9, 15350–15364. [Google Scholar] [CrossRef] [PubMed]
- Qiao, G.; Dai, C.; He, Y.; Shi, J.; Xu, C. Effects of miR106b3p on cell proliferation and epithelialmesenchymal transition, and targeting of ZNRF3 in esophageal squamous cell carcinoma. Int. J. Mol. Med. 2019, 43, 1817–1829. [Google Scholar] [CrossRef] [PubMed]
- Li, S.; Zeng, A.; Hu, Q.; Yan, W.; Liu, Y.; You, Y. miR-423-5p contributes to a malignant phenotype and temozolomide chemoresistance in glioblastomas. Neuro-oncology 2017, 19, 55–65. [Google Scholar] [CrossRef] [Green Version]
- Sun, G.; Ding, X.; Bi, N.; Wu, L.; Wang, J.; Zhang, W.; Dong, X.; Lv, N.; Song, Y.; Zhan, Q.; et al. MiR-423-5p in brain metastasis: Potential role in diagnostics and molecular biology. Cell Death Dis. 2018, 9, 936. [Google Scholar] [CrossRef] [Green Version]
- Yang, H.; Fu, H.; Wang, B.; Zhang, X.; Mao, J.; Li, X.; Wang, M.; Sun, Z.; Qian, H.; Xu, W. Exosomal miR-423-5p targets SUFU to promote cancer growth and metastasis and serves as a novel marker for gastric cancer. Mol. Carcinog. 2018, 57, 1223–1236. [Google Scholar] [CrossRef]
- Larrabeiti-Etxebarria, A.; Lopez-Santillan, M.; Santos-Zorrozua, B.; Lopez-Lopez, E.; Garcia-Orad, A. Systematic Review of the Potential of MicroRNAs in Diffuse Large B Cell Lymphoma. Cancers 2019, 11, 144. [Google Scholar] [CrossRef] [PubMed] [Green Version]
- Hattab, E.M.; Martin, S.E.; Al-Khatib, S.M.; Kupsky, W.J.; Vance, G.H.; Stohler, R.A.; Czader, M.; Al-Abbadi, M.A. Most primary central nervous system diffuse large B-cell lymphomas occurring in immunocompetent individuals belong to the nongerminal center subtype: A retrospective analysis of 31 cases. Mod. Pathol. 2010, 23, 235–243. [Google Scholar] [CrossRef] [PubMed] [Green Version]
- Gurbuxani, S.; Anastasi, J.; Hyjek, E. Diffuse large B-cell lymphoma--more than a diffuse collection of large B cells: An entity in search of a meaningful classification. Arch. Pathol. Lab. Med. 2009, 133, 1121–1134. [Google Scholar] [CrossRef]
- Pan, X.; Hong, X.; Lai, J.; Cheng, L.; Cheng, Y.; Yao, M.; Wang, R.; Hu, N. Exosomal MicroRNA-221-3p Confers Adriamycin Resistance in Breast Cancer Cells by Targeting PIK3R1. Front. Oncol. 2020, 10, 441. [Google Scholar] [CrossRef] [PubMed]
- Yang, J.K.; Yang, J.P.; Tong, J.; Jing, S.Y.; Fan, B.; Wang, F.; Sun, G.Z.; Jiao, B.H. Exosomal miR-221 targets DNM3 to induce tumor progression and temozolomide resistance in glioma. J. Neurooncol. 2017, 131, 255–265. [Google Scholar] [CrossRef] [PubMed]
- Maes, A.; Maes, K.; De Raeve, H.; De Smedt, E.; Vlummens, P.; Szablewski, V.; Devin, J.; Faict, S.; De Veirman, K.; Menu, E.; et al. The anaphase-promoting complex/cyclosome: A new promising target in diffuse large B-cell lymphoma and mantle cell lymphoma. Br. J. Cancer 2019, 120, 1137–1146. [Google Scholar] [CrossRef]
- Beielstein, A.C.; Pallasch, C.P. Tumor Metabolism as a Regulator of Tumor-Host Interactions in the B-Cell Lymphoma Microenvironment-Fueling Progression and Novel Brakes for Therapy. Int. J. Mol. Sci. 2019, 20, 4158. [Google Scholar] [CrossRef] [PubMed] [Green Version]
- Breccia, M.; Cicconi, L.; Minotti, C.; Latagliata, R.; Gianni, L.; Lo-Coco, F. Efficacy of prolonged therapy with combined arsenic trioxide and ATRA for relapse of acute promyelocytic leukemia. Haematologica 2011, 96, 1390–1391. [Google Scholar] [CrossRef]
- Moodad, S.; El Hajj, R.; Hleihel, R.; Hajjar, L.; Tawil, N.; Karam, M.; Hamie, M.; Abou Merhi, R.; El Sabban, M.; El Hajj, H. Lenalidomide in Combination with Arsenic Trioxide: An Effective Therapy for Primary Effusion Lymphoma. Cancers 2020, 12, 2483. [Google Scholar] [CrossRef] [PubMed]
- Kchour, G.; Tarhini, M.; Kooshyar, M.M.; El Hajj, H.; Wattel, E.; Mahmoudi, M.; Hatoum, H.; Rahimi, H.; Maleki, M.; Rafatpanah, H.; et al. Phase 2 study of the efficacy and safety of the combination of arsenic trioxide, interferon alpha, and zidovudine in newly diagnosed chronic adult T-cell leukemia/lymphoma (ATL). Blood 2009, 113, 6528–6532. [Google Scholar] [CrossRef] [PubMed]
- Venugopal, B.; Evans, T.R. Developing histone deacetylase inhibitors as anti-cancer therapeutics. Curr. Med. Chem. 2011, 18, 1658–1671. [Google Scholar] [CrossRef]
- Imai, Y.; Maru, Y.; Tanaka, J. Action mechanisms of histone deacetylase inhibitors in the treatment of hematological malignancies. Cancer Sci. 2016, 107, 1543–1549. [Google Scholar] [CrossRef]
- Mann, B.S.; Johnson, J.R.; Cohen, M.H.; Justice, R.; Pazdur, R. FDA approval summary: Vorinostat for treatment of advanced primary cutaneous T-cell lymphoma. Oncologist 2007, 12, 1247–1252. [Google Scholar] [CrossRef]
- Ganai, S.A. Strategy for enhancing the therapeutic efficacy of histone deacetylase inhibitor dacinostat: The novel paradigm to tackle monotonous cancer chemoresistance. Arch. Pharm. Res. 2015. [Google Scholar] [CrossRef]
- Hontecillas-Prieto, L.; Flores-Campos, R.; Silver, A.; de Alava, E.; Hajji, N.; Garcia-Dominguez, D.J. Synergistic Enhancement of Cancer Therapy Using HDAC Inhibitors: Opportunity for Clinical Trials. Front. Genet. 2020, 11, 578011. [Google Scholar] [CrossRef]
- Ganai, S.A. Histone deacetylase inhibitor givinostat: The small-molecule with promising activity against therapeutically challenging haematological malignancies. J. Chemother. 2016, 28, 247–254. [Google Scholar] [CrossRef]
- Wang, M.; Fang, X.; Wang, X. Emerging role of histone deacetylase inhibitors in the treatment of diffuse large B-cell lymphoma. Leuk. Lymphoma 2020, 61, 763–775. [Google Scholar] [CrossRef]
- Gomez, S.; Tabernacki, T.; Kobyra, J.; Roberts, P.; Chiappinelli, K.B. Combining epigenetic and immune therapy to overcome cancer resistance. Semin. Cancer Biol. 2020, 65, 99–113. [Google Scholar] [CrossRef] [PubMed]
- Pera, B.; Tang, T.; Marullo, R.; Yang, S.N.; Ahn, H.; Patel, J.; Elstrom, R.; Ruan, J.; Furman, R.; Leonard, J.; et al. Combinatorial epigenetic therapy in diffuse large B cell lymphoma pre-clinical models and patients. Clin. Epigenet. 2016, 8, 79. [Google Scholar] [CrossRef] [PubMed] [Green Version]
- Fujimoto, K.; Shinojima, N.; Hayashi, M.; Nakano, T.; Ichimura, K.; Mukasa, A. Histone deacetylase inhibition enhances the therapeutic effects of methotrexate on primary central nervous system lymphoma. Neurooncol. Adv. 2020, 2, vdaa084. [Google Scholar] [CrossRef] [PubMed]

| Sample ID CSF/Tumor | Patient Age/Sex | Histopathology | IHC | |
|---|---|---|---|---|
| Cell of Origin | BCL2 Expression | |||
| F1/T1 | 63/f | CNS DLBCL | ABC | (++)h |
| F2/T2 | 36/m | CNS DLBCL | GCB | (++)h |
| F3/T3 | 55/m | CNS DLBCL | ABC | (++)h |
| F4/T4 | 73/f | CNS DLBCL | ABC | (+) |
| F5/T5 | 51/f | CNS DLBCL | ABC | (+) |
| F6/T6 | 56/f | IVLBCL with CNS involvement | GCB | (−) |
| F7/T7 | 49/f | CNS DLBCL | ABC | (++)h |
| F8/T8 | 31/f | CNS DLBCL | GCB | (+) |
| F9/T9 | 42/m | CNS DLBCL | ABC | (+) |
| –/T10 | 63/f | CNS DLBCL | CD5(+) | (+) |
| Sample ID | Age/Sex | ICD10 (Diagnosis)/HP | Cytology |
|---|---|---|---|
| CSFs | |||
| 1FN | 40/m | G35 (SM) | L, M |
| 2FN | 81/f | D43.1 (meningioma) | L, M |
| 3FN | 48/f | G37.9 | L, M |
| 4FN | 30/f | G35 (SM) | L, M, Neu |
| 5FN | 36/m | G37.9 | L |
| 6FN | 48/m | G04.9 (ADEM) | L, M |
| 7FN | 59/m | G04.8 | L |
| 8FN | 49/f | D33.1 | L, M, E |
| 9FN | 16/f | G04.0 | E, D |
| 10FN | 31/f | D33 | L, M |
| 11FN | 38/m | I67.7 | L, M, E |
| 12FN | 37/f | D33/reaction process. gliosis | L, M |
| Tumors | |||
| 11TN | 38/m | D33/reaction process. gliosis | - |
| 12TN | 35/f | reaction process. gliosis | - |
| 13TN | 41/f | hematoma. reaction process | - |
| 14TN | 40/m | Gliosis | - |
| 15TN | 54/f | hematoma | - |
| 16TN | 65/m | reaction process | - |
| 17TN | 59/m | cerebral hemispheres tissue | - |
| 18TN | 28/f | focal cortical dysplasia (FCD) type IIB | - |
| 19TC | 30/f | ischemic necrosis. gliosis | - |
| 20TC | 47/m | Hematoma | - |
| miRs | Tumor Samples | CSF Samples | ||||||||||
|---|---|---|---|---|---|---|---|---|---|---|---|---|
| NGS | RT-qPCR | NGS | RT-qPCR | |||||||||
| q*-Value | FC (CNS DLBCL /n-ML) | ROC (AUC) | Expression Level in CNS DLBCL (Median) | Expression Level in n-ML (Median) | p-Value | q-Value | FC (CNS DLBCL /n-ML) | ROC (AUC) | Expression Level in CNS DLBCL (Median) | Expression Level in n-ML (Median) | p-Value | |
| miR-9-3p | p < 0.001 | 0.24 | 0.86 | 0.15 | 0.69 | 0.0643 | 0.0165 | 0.14 | 0.84 | 0.26 | 0.39 | 0.3030 |
| miR-9-5p | p < 0.001 | 0.22 | 0.89 | 1.33 | 3.09 | 0.0455 | 0.0299 | 0.15 | 0.79 | 0.54 | 0.77 | 0.6965 |
| miR-15a-5p | 0.0132 | 2.05 | 0.81 | 1.49 | 0.56 | p < 0.001 | 0.0095 | 5.31 | 0.58 | 2.44 | 1.86 | 0.4532 |
| miR-15b-5p | p < 0.001 | 5.23 | 0.87 | 0.67 | 0.26 | 0.0022 | 0.0198 | 5.24 | 0.79 | 1.09 | 0.81 | 0.2713 |
| miR-16-5p | p < 0.001 | 2.57 | 0.93 | 4.20 | 1.36 | p < 0.001 | 0.0067 | 4.34 | 0.72 | 5.86 | 1.65 | 0.0251 |
| miR-17-3p | p < 0.001 | 5.37 | 0.9 | 0.07 | 0.02 | p < 0.001 | 0.0198 | 16.11 | 0.73 | 0.09 | 0.02 | 0.0601 |
| miR-19a-3p | p < 0.001 | 6.61 | 0.96 | 0.05 | 0.01 | p < 0.001 | p < 0.001 | 4.79 | 0.96 | 0.20 | 0.11 | 0.1902 |
| miR-19b-3p | p < 0.001 | 5.06 | 0.95 | 0.14 | 0.03 | 0.0022 | 0.0095 | 3.16 | 0.73 | 0.86 | 0.29 | 0.5961 |
| miR-20a-5p | p < 0.001 | 8.96 | 0.98 | 0.39 | 0.07 | p < 0.001 | 0.0334 | 5.71 | 0.68 | 0.36 | 0.15 | 0.1902 |
| miR-21-5p | 0.0311 | 2.78 | 0.83 | 4.86 | 0.52 | 0.0022 | 0.0165 | 3.40 | 0.76 | 5.90 | 3.77 | 0.0512 |
| miR-25-3p | p < 0.001 | 3.45 | 0.83 | 0.71 | 0.21 | p < 0.001 | 0.0260 | 12.46 | 0.37 | 0.60 | 0.36 | 0.1260 |
| miR-26a-5p | 0.0097 | 0.65 | 0.89 | 2.45 | 3.30 | 0.1211 | 0.0337 | 0.40 | 0.76 | 1.12 | 1.39 | 0.4122 |
| miR-92a-3p | p < 0.001 | 5.77 | 0.98 | 1.98 | 0.53 | 0.001 | 0.0219 | 6.08 | 0.61 | 6.76 | 0.88 | 0.0357 |
| miR-106b-3p | p < 0.001 | 7.09 | 1 | 0.02 | 0.01 | 0.0073 | 0.0253 | 19.51 | 0.32 | 0.05 | 0.02 | 0.0466 |
| miR-148a-3p | 0.0010 | 6.21 | 0.89 | 0.39 | 0.04 | p < 0.001 | 0.0095 | 9.45 | 0.70 | 0.57 | 0.71 | 0.6965 |
| miR-210-3p | p < 0.001 | 4.17 | 0.84 | 0.12 | 0.05 | 0.0036 | 0.0198 | 10.48 | 0.68 | 0.17 | 0.14 | 0.3030 |
| miR-423-5p | 0.0125 | 1.80 | 0.85 | 1.75 | 0.63 | 0.0057 | 0.0115 | 4.15 | 0.68 | 2.44 | 1.29 | 0.0424 |
Publisher’s Note: MDPI stays neutral with regard to jurisdictional claims in published maps and institutional affiliations. |
© 2021 by the authors. Licensee MDPI, Basel, Switzerland. This article is an open access article distributed under the terms and conditions of the Creative Commons Attribution (CC BY) license (https://creativecommons.org/licenses/by/4.0/).
Share and Cite
Sromek, M.; Rymkiewicz, G.; Paziewska, A.; Szafron, L.M.; Kulecka, M.; Zajdel, M.; Kulinczak, M.; Dabrowska, M.; Balabas, A.; Bystydzienski, Z.; et al. A Set of 17 microRNAs Common for Brain and Cerebrospinal Fluid Differentiates Primary Central Nervous System Lymphoma from Non-Malignant Brain Tumors. Biomolecules 2021, 11, 1395. https://doi.org/10.3390/biom11091395
Sromek M, Rymkiewicz G, Paziewska A, Szafron LM, Kulecka M, Zajdel M, Kulinczak M, Dabrowska M, Balabas A, Bystydzienski Z, et al. A Set of 17 microRNAs Common for Brain and Cerebrospinal Fluid Differentiates Primary Central Nervous System Lymphoma from Non-Malignant Brain Tumors. Biomolecules. 2021; 11(9):1395. https://doi.org/10.3390/biom11091395
Chicago/Turabian StyleSromek, Maria, Grzegorz Rymkiewicz, Agnieszka Paziewska, Lukasz Michal Szafron, Maria Kulecka, Michalina Zajdel, Mariusz Kulinczak, Michalina Dabrowska, Aneta Balabas, Zbigniew Bystydzienski, and et al. 2021. "A Set of 17 microRNAs Common for Brain and Cerebrospinal Fluid Differentiates Primary Central Nervous System Lymphoma from Non-Malignant Brain Tumors" Biomolecules 11, no. 9: 1395. https://doi.org/10.3390/biom11091395
APA StyleSromek, M., Rymkiewicz, G., Paziewska, A., Szafron, L. M., Kulecka, M., Zajdel, M., Kulinczak, M., Dabrowska, M., Balabas, A., Bystydzienski, Z., Chechlinska, M., & Siwicki, J. K. (2021). A Set of 17 microRNAs Common for Brain and Cerebrospinal Fluid Differentiates Primary Central Nervous System Lymphoma from Non-Malignant Brain Tumors. Biomolecules, 11(9), 1395. https://doi.org/10.3390/biom11091395