
Considerations about the Continuous Assay Methods, Spectrophotometric and Spectrofluorometric, of the Monophenolase Activity of Tyrosinase


 ,
, 
Abstract
:1. Introduction
- (a)
- (b)
- (c)
- Adducts and oxidized adducts caused by the coupling of MBTH with o-quinones show high molar absorptivity coefficients (see Table S1).
- (d)
- The method has no interferences since the absorbance measurement occurs in the visible area, where neither the substrates nor the enzyme absorbed.
- (e)
- The adducts are stable at acidic pH and at pH > 5.5 they evolve presenting an isosbestic point, this particularity makes it possible to measure different enzymes of fruits and vegetables that have an optimal pH in the range between 4.0 and 5.0 [18].
2. Material and Methods
2.1. Materials
2.2. Enzyme Source
2.3. Spectrophotometric Assays
2.4. Kinetic Data Analysis
2.5. Simulation Assays
3. Results
3.1. Kinetic Analysis. Diphenolase Activity
3.2. Kinetic Analysis. Monophenolase Activity
3.3. Simulation under Different Experimental Approximations of the Monophenolase Activity Mechanism
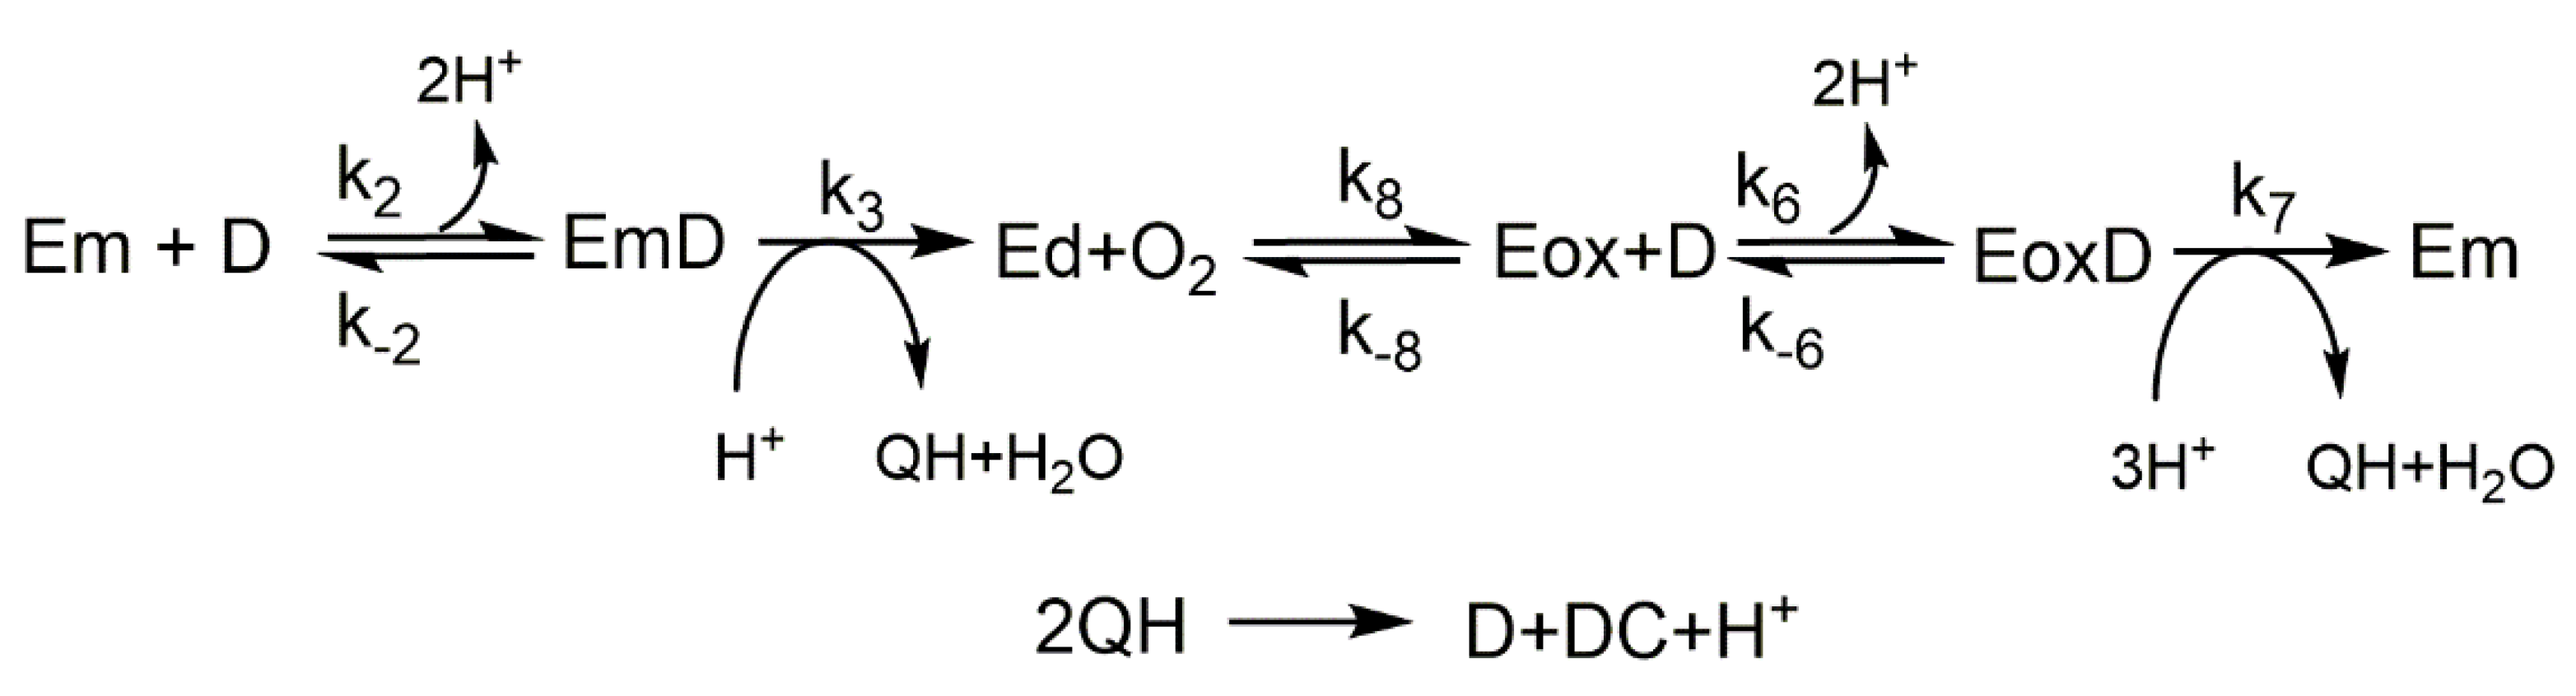
Monophenolase Activity
- (1)
- Action of tyrosinase on L-tyrosine. No o-diphenol (L-dopa) is added to the medium.The numerical integration of the set of differential equations that describe the mechanism (Scheme 1) (see Supplementary Material), was carried out obtaining the following results.
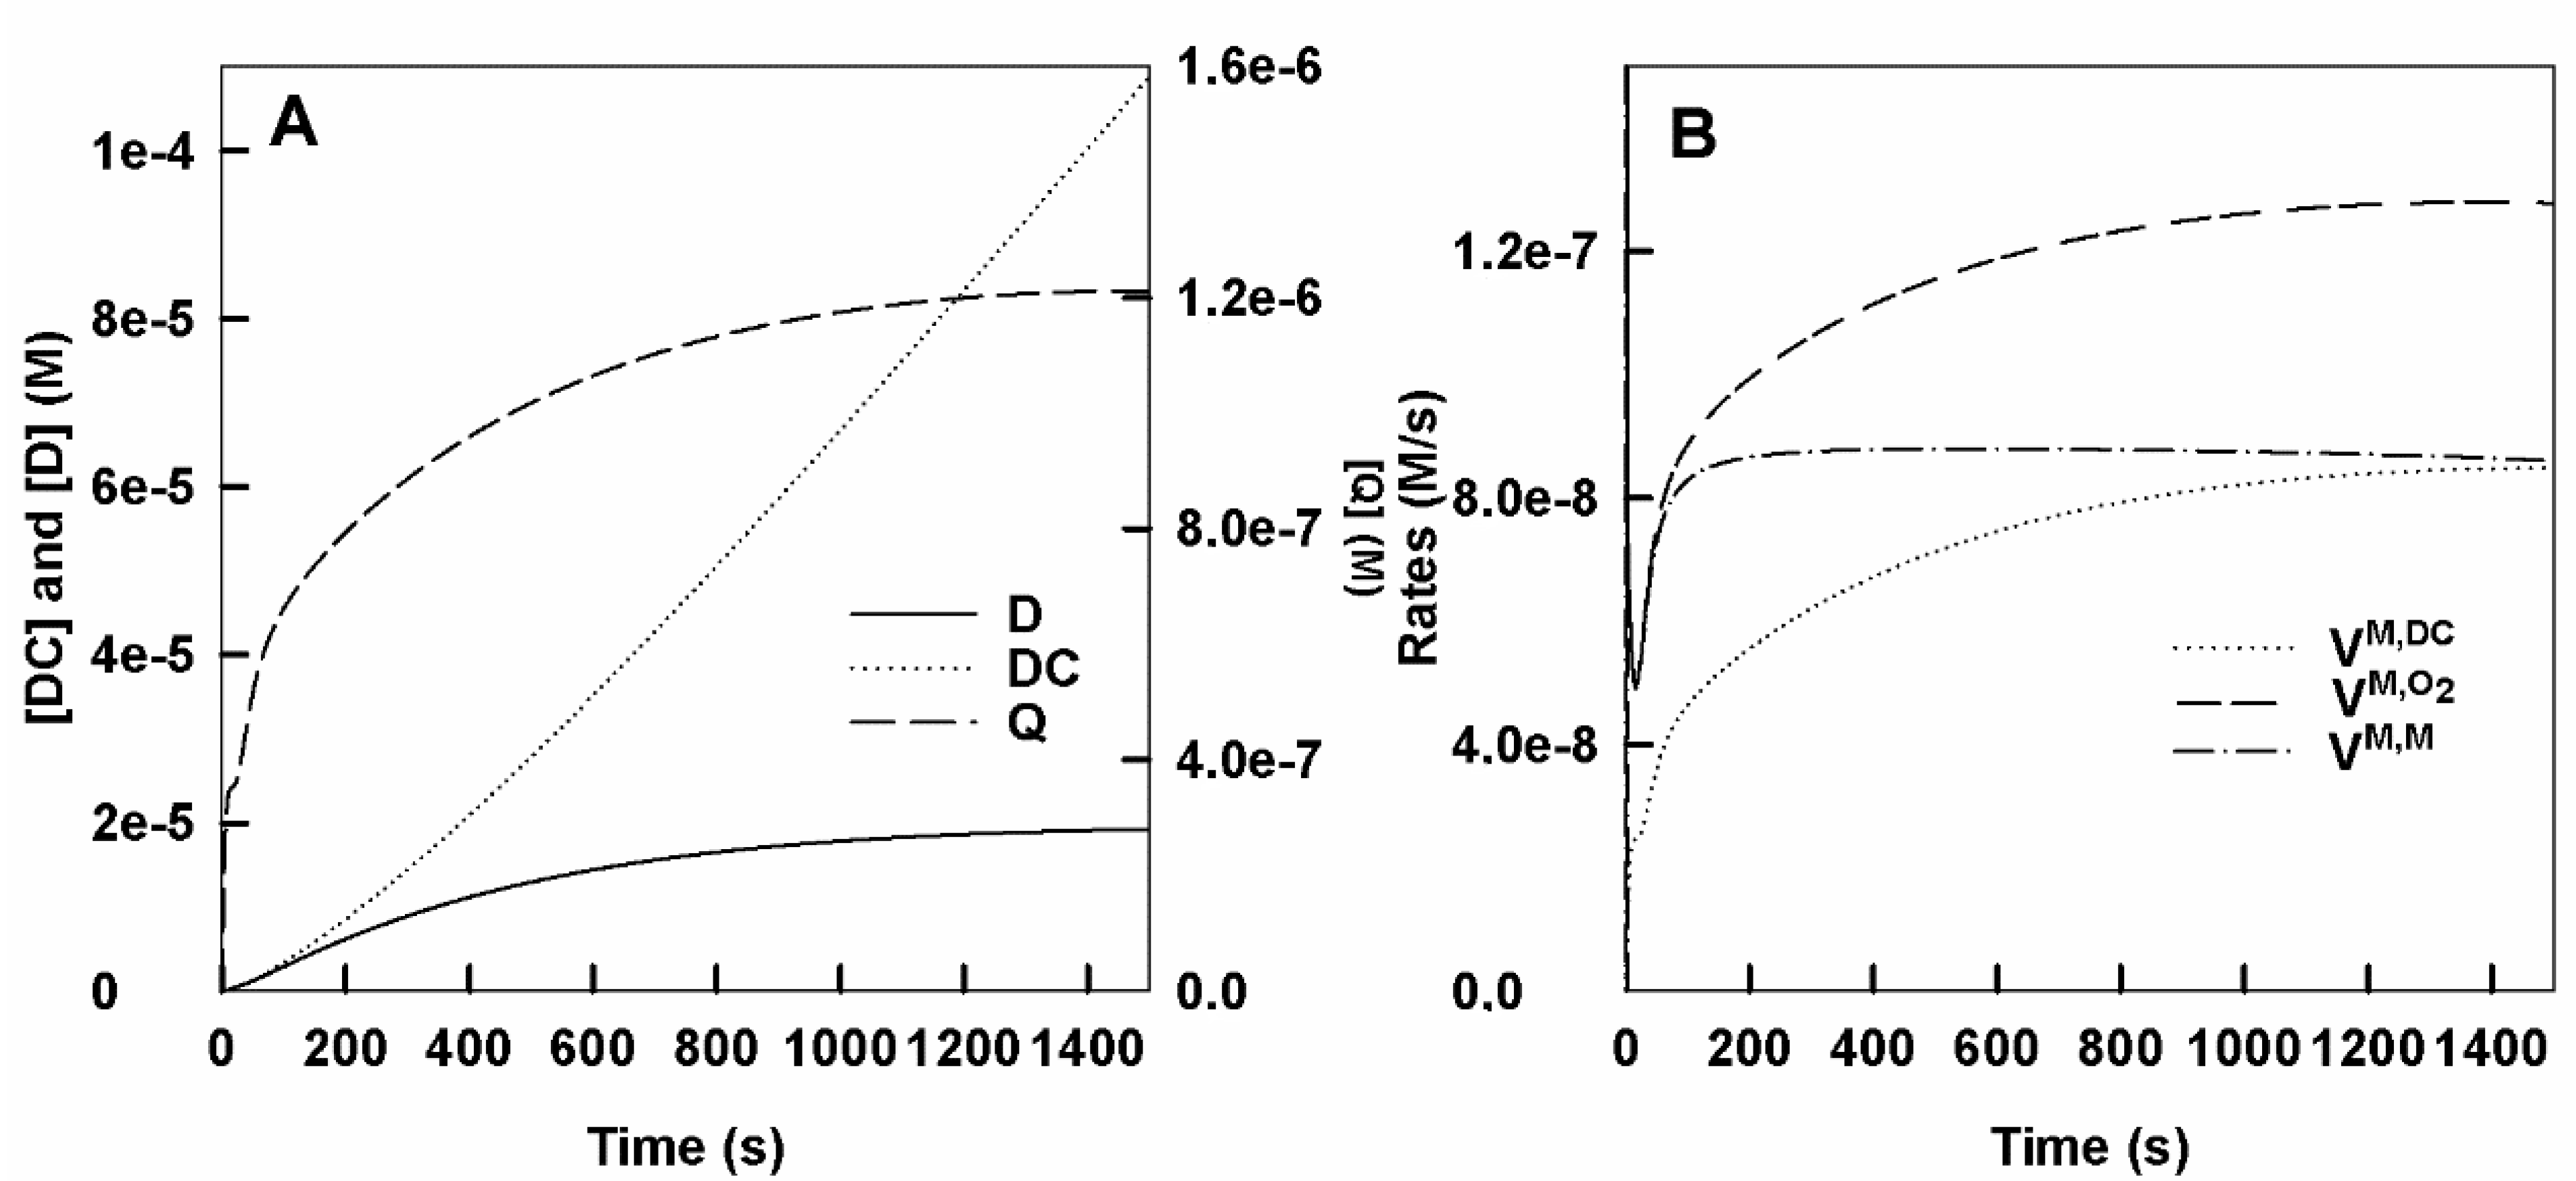
- (a)
- Accumulation of dopachrome, o-dopaquinone and o-diphenol in the medium. In Figure 1A, the DC, o-Q and D accumulation curves are shown. At short times, it is shown in Figure S1A.
- (b)
- Rates of monophenol consumption (), oxygen consumption () and dopachrome formation (). In Figure 1B, the rates of consumption of M and O2 and the formation of DC are shown. Figure S1B shows the curves of the velocities obtained in a short time.
- (c)
- Evolution over time of the different enzyme forms: Eox, Em and EmM. Figure S1C shows the evolution of these enzymatic forms with time.
- (d)
- Variation of the concentration and rate of accumulation of o-diphenol with time. Figure S1D shows the accumulation of D over time, until it reaches a steady-state with a constant level. Thus, Figure S1E shows the accumulation of D at short times, continuously increasing towards the steady state. Figure S1F shows the rate of D accumulation, it increases at the beginning of the reaction (step of Eox → Em), to decrease at longer times, until a value of the rate is equal to 0, in the steady state. At short times, in Figure S1G you can see a burst in the rate of D accumulation, followed by a lag and then another burst to decrease going towards the steady state.
- (2)
- Action of tyrosinase on L-tyrosine adding enough o-diphenol to the medium to reach the steady-state.
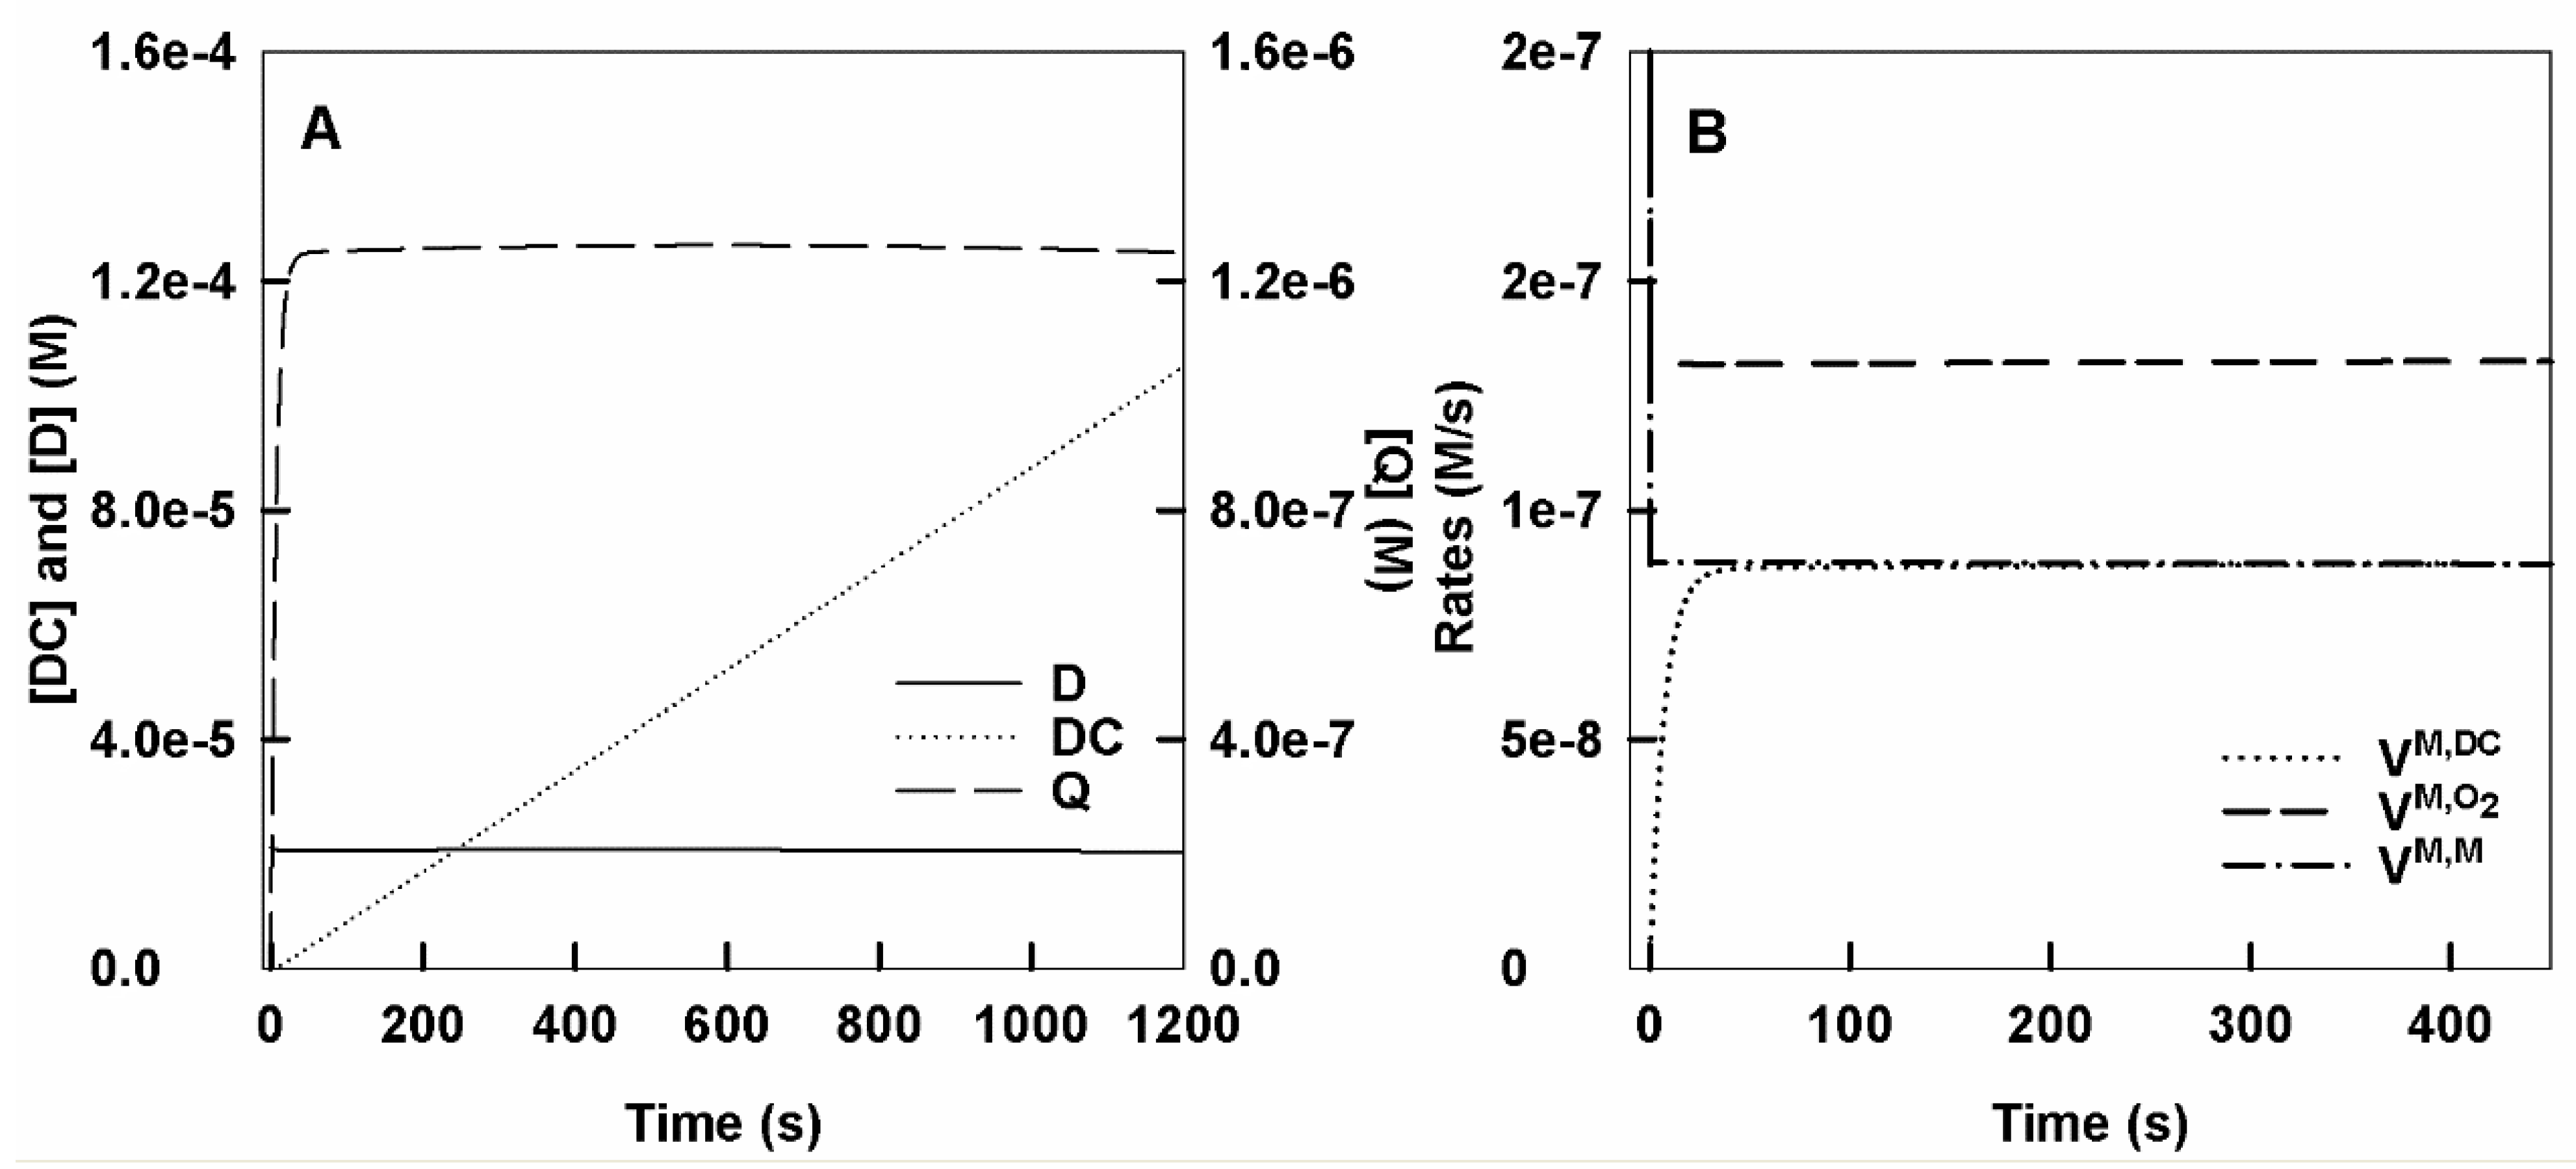
- (a)
- Accumulation of dopachrome, o-dopaquinone and o-diphenol in the medium. The curves shown in Figure 2A show the concentrations of o-Q, D and DC over time. In Figure S2A the short-time curves are shown, a small lag can be seen in the accumulation of DC and a burst in the accumulation of o-Q.
- (b)
- Rates of consumption of monophenol and oxygen and rate of dopachrome formation. In Figure 2B the consumption rates of O2, M and the rate of DC formation are shown and in Figure S2B, we show the same parameters but at short times.
- (c)
- Evolution over time of the different enzyme species. Figure S2C shows the evolution of the different species enzymes.
- (d)
- Variation of the concentration and rate of accumulation of o-diphenol with time. It is shown in the Figure S2D.
- (3)
- Action of tyrosinase on L-tyrosine, adding before starting the reaction an amount of o-diphenol, less than that necessary to reach steady state.
- (a)
- Accumulation of dopachrome, o-dopaquinone and o-diphenol in the reaction medium. Figures S3A and S6B show the accumulation of DC, o-Q and D. In Figure S6B, you can see the detail in short time.
- (b)
- Rates of consumption of monophenol and oxygen and rate of dopachrome formation. Rates are shown in Figure S3C and at short times in Figure S3D.
- (c)
- Evolution over time of the different enzyme species. A graph like that of Figures S1C and S2C is obtained. The enzyme accumulates mostly as EmM.
- (d)
- Variation of o-diphenol concentration with time. Figure S3E shows D variation.
- (4)
- Action of tyrosinase on L-tyrosine, adding before starting the reaction an amount of o-diphenol greater than that necessary to reach steady state. The speeds at long and short times are shown in Figure S4A,B, respectively.
- (5)
- Action of tyrosinase on L-tyrosine in the presence of a nucleophile N.
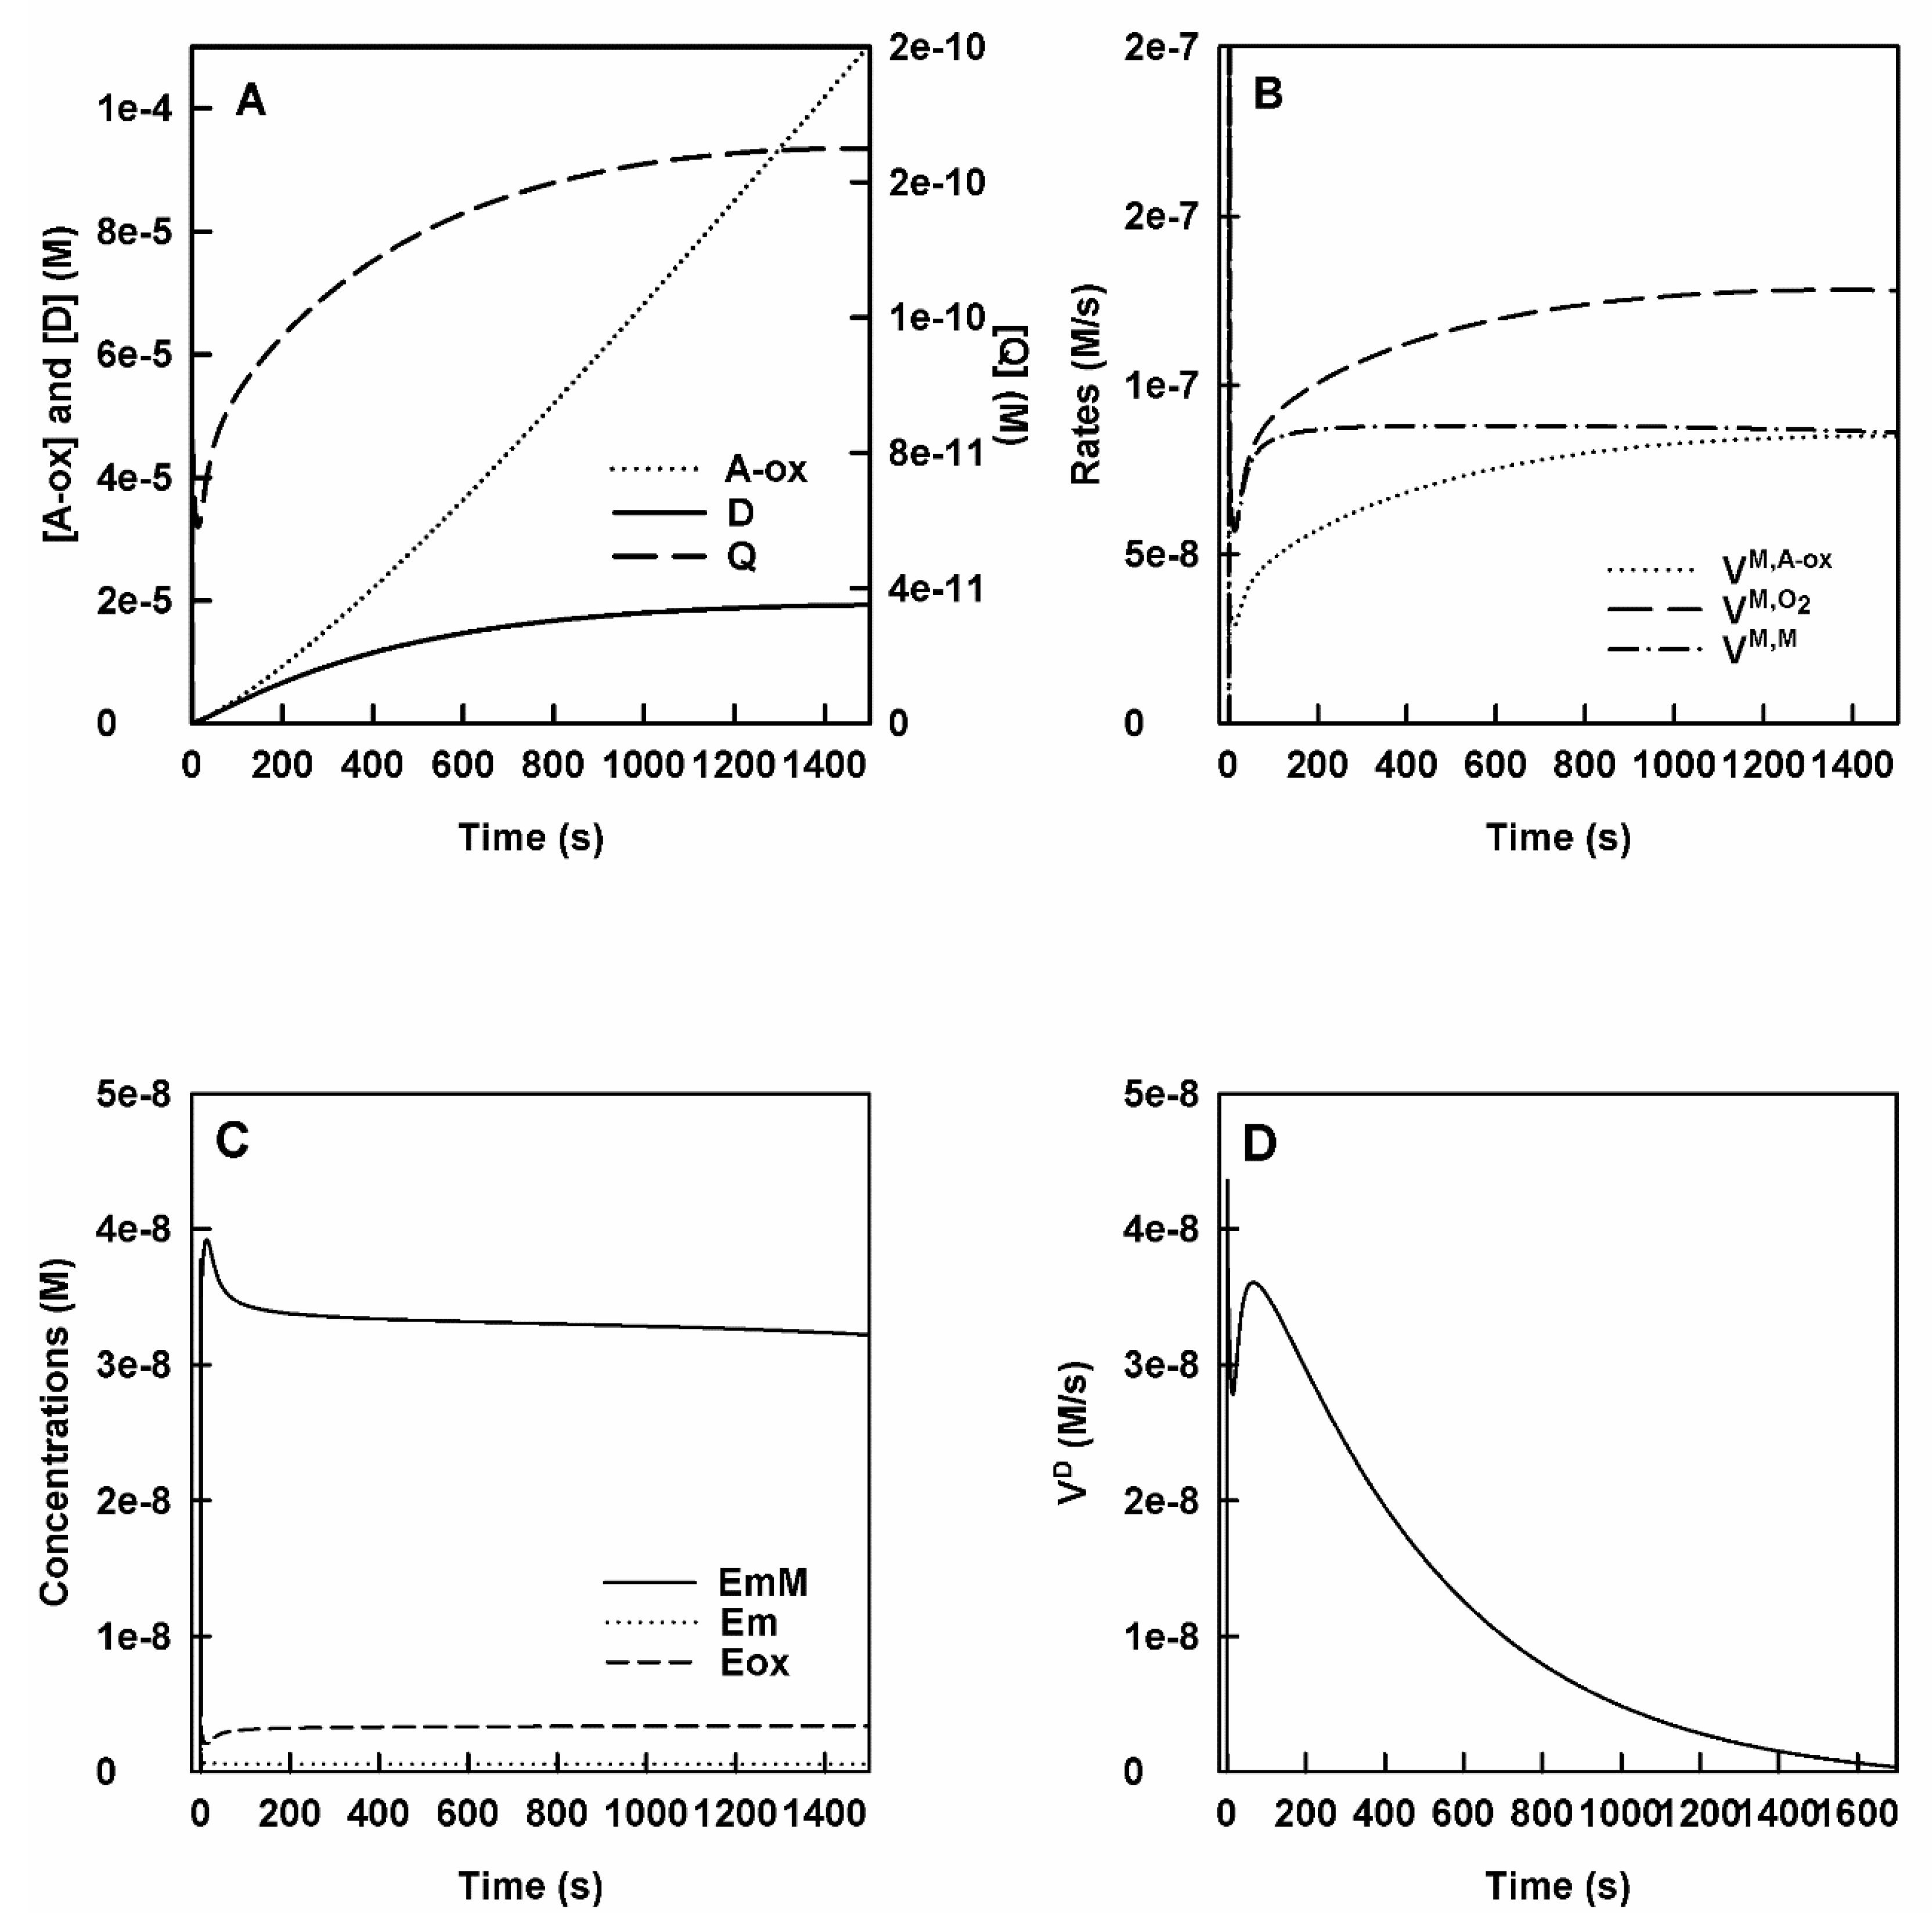
- (a)
- The curves obtained in this section are like those obtained in Section 1, the only difference is that the o-Q evolution constant becomes much larger as the nucleophilic attack of N is more powerful than the cyclization of o-Q. In the action of tyrosinase on M in the presence of N, Figure 3A shows the accumulation of o-Q, D and A-ox with time. It shows a burst for o-Q and D and a very small lag for A-ox.
- (b)
- Rates of consumption of M, O2 and the formation of A-ox. In Figure 3B, the curves obtained for the rate of consumption of M and O2 and that of accumulation of A-ox are shown.
- (c)
- Enzyme species evolve in a similar way to the other cases and the enzyme accumulates fundamentally as EmM, Figure 3C.
- (d)
- Variation of the concentration and rate of accumulation of D over time. It is shown in Figure 3D.
4. Discussion
4.1. Action of Tyrosinase on L-Tyrosine. No o-Diphenol (L-Dopa) Is Added to the Medium
4.2. Action of Tyrosinase on L-Tyrosine Adding Enough o-Diphenol to the Medium to Reach the Steady State
4.3. Action of Tyrosinase on L-Tyrosine, Adding before Starting the Reaction an Amount of o-Diphenol, Less Than That Necessary to Reach the Steady State
4.4. Action of Tyrosinase on L-Tyrosine, Adding before Starting the Reaction an Amount of o-Diphenol Greater Than That Necessary to Reach Steady-State
4.5. Action of Tyrosinase on L-Tyrosine in the Presence of a Nucleophile N
4.6. Comparison of the Measurement of Monophenolase Activity of Tyrosinase Obtained by Continuous Spectrophotometric Methods That Use MBTH as a Nucleophilic Reagent with Continuous Fluorometric Methods That Measure the Disappearance of L-Tyrosine through Quenching L-Dopa Fluorescence by Borate
- In spectrophotometric methods, product formation is measured in an area where substrates do not interfere and it is more sensitive to measure product formation than substrate disappearance [24]. In the proposed spectrofluorimetric methods, the disappearance of substrate L-tyrosine, is measured.
- In these spectrophotometric methods, product formation is measured. Moreover, there are no phototube saturation problems. Thus, the substrate concentration can be increased because it does not interfere. In the spectrofluorimetric methods proposed, when measuring the disappearance of substrate (L-tyrosine), by increasing its concentration, linearity can be lost, whereas in reality, it occurs in such a way that in the proposed methods [10,11,12], which follow fluorescence, only the behavior is linear up to a concentration of 100 µM of L-tyrosine.
- What is indicated in Section 2 is very important when characterizing the kinetics of tyrosinase monophenolase activity, as the concentration cannot be increased more than 100 µM. Indeed, if the initial velocity values are adjusted, with respect to the L-tyrosine concentration, erroneous kinetic parameters are obtained, because a true hyperbolic dependence of the values has not been obtained. Thus, the authors working with mushroom tyrosinase, obtain a value of KM = 19.51 µM [10,11,12], when the value found for this enzyme is between 0.21 mM [21] and 0.31 mM [34]. At high pH values, KM values are constants [35]. In general, this problem is encountered by most of the methods that attempt to measure the disappearance of substrate [24].
- The lack of linearity between the fluorescence measurement and the concentration of L-tyrosine above 100 µM make kinetic studies difficult and especially in the presence of inhibitors. Thus, when zinc ion is studied as a tyrosinase inhibitor [10], data are obtained that indicate that it is a competitive inhibitor, so in order to determine the KI value, the concentration of L-tyrosine must be increased by more than 100 µM, like this not possible, abnormal results are obtained. On the other hand, the IC50 value described is 14.64 µM and the KI value = 67.60 µM [10], but in the case of a competitive inhibitor, it can be shown that IC50 > KI, specifically IC50 = (n+1)KI, where n is the ratio of substrate concentration to Km [36]. This relationship between IC50 and KI is well established in the data shown in Tables 1 and 2 in [37] and in Table 1 in [38].
- The relationship of rates of consumption of M, O2 and formation of DC described in Table S5 of the Supporting Information [10] shows in the monophenolase activity the equality of rates of consumption of O2 and consumption of M, however the DC formation rate is not comparative; this aspect confirms the validity of the measure measuring O2 consumption that was described previously [9]. The stoichiometry of diphenolase activity predicts that the O2 consumption rate should be equal to the formation rate of DC, as demonstrated previously [8]. In the first column (substrate + TYR, diphenolase) of Table S5 [10], the described relationship is not fulfilled; however, it is achieved in the last column of Table S5 [10] (Substrate + TYR + hydroxylamine).
- A feature of spectrofluorimetric methods that measure the disappearance of M could be the one that reaches the steady-state earlier, as D does not accumulate in the medium under these test conditions. This aspect can be corrected in spectrophotometric methods by adding a small concentration of D to the medium () (Figure 2A) to decrease the lag period. Furthermore, it is thus achieved that the substrate concentration varies very little and therefore measured initial rates will correspond to the steady-state rate.
5. Conclusions
Supplementary Materials
Author Contributions
Funding
Institutional Review Board Statement
Informed Consent Statement
Acknowledgments
Conflicts of Interest
References
- Bubacco, L.; Salgado, J.; Tepper, A.W.J.W.; Vijgenboom, E.; Canters, G.W. 1H NMR spectroscopy of the binuclear Cu(II) active site of Streptomyces antibioticus tyrosinase. FEBS Lett. 1999, 442, 215–220. [Google Scholar] [CrossRef] [Green Version]
- Kanteev, M.; Goldfeder, M.; Fishman, A. Structure–function correlations in tyrosinases. Protein Sci. 2015, 24, 1360–1369. [Google Scholar] [CrossRef]
- Solomon, E.I.; Heppner, D.E.; Johnston, E.M.; Ginsbach, J.W.; Cirera, J.; Qayyum, M.; Kieber-Emmons, M.T.; Kjaergaard, C.H.; Hadt, R.G.; Tian, L. Copper Active Sites in Biology. Chem. Rev. 2014, 114, 3659–3853. [Google Scholar] [CrossRef] [Green Version]
- Rodríguez-López, J.N.; Ros, J.R.; Varón, R.; García-Cánovas, F. Oxygen Michaelis constants for tyrosinase. Biochem. J. 1993, 293, 859–866. [Google Scholar] [CrossRef]
- Fenoll, L.G.; Rodríguez-López, J.N.; García-Sevilla, F.; García-Ruiz, P.A.; Varón, R.; García-Cánovas, F.; Tudela, J. Analysis and interpretation of the action mechanism of mushroom tyrosinase on monophenols and diphenols generating highly unstable o-quinones. Biochim. Biophys. Acta Protein Struct. Mol. Enzymol. 2001, 1548, 1–22. [Google Scholar] [CrossRef]
- Kampatsikas, I.; Rompel, A. Similar but Still Different: Which Amino Acid Residues Are Responsible for Varying Activities in Type-III Copper Enzymes? ChemBioChem 2020, 21, 1–16. [Google Scholar] [CrossRef]
- Goldfeder, M.; Kanteev, M.; Isaschar-Ovdat, S.; Adir, N.; Fishman, A. Determination of tyrosinase substrate-binding modes reveals mechanistic differences between type-3 copper proteins. Nat. Commun. 2014, 5, 4505. [Google Scholar] [CrossRef] [PubMed]
- Rodríguez-López, J.N.; Tudela, J.; Varón, R.; García-Carmona, F.; García-Cánovas, F. Analysis of a kinetic model for melanin biosynthesis pathway. J. Biol. Chem. 1992, 267, 3801–3810. [Google Scholar] [CrossRef]
- Yamazaki, S.; Itoh, S. Kinetic Evaluation of Phenolase Activity of Tyrosinase Using Simplified Catalytic Reaction System. J. Am. Chem. Soc. 2003, 125, 13034–13035. [Google Scholar] [CrossRef] [PubMed]
- Guo, N.; You, X.; Wu, Y.; Du, D.; Zhang, L.; Shang, Q.; Liu, W. Continuous Fluorometric Method for Determining the Monophenolase Activity of Tyrosinase on L-Tyrosine, through Quenching L-DOPA Fluorescence by Borate. Anal. Chem. 2020, 92, 5780–5786. [Google Scholar] [CrossRef] [PubMed]
- Du, D.; Guo, N.; Zhang, L.; Wu, Y.; Shang, Q.; Liu, W. Real-time fluorometric monitoring of monophenolase activity using a matrix-matched calibration curve. Anal. Bioanal. Chem. 2021, 413, 635–647. [Google Scholar] [CrossRef]
- Zhang, L.; Shang, Q.; Chen, C.; Tang, W.; Xu, Y.; Liu, W. Synchronous fluorometric method for continuous assay of monophenolase activity. Spectrochim. Acta Part A Mol. Biomol. Spectrosc. 2021, 252, 119486. [Google Scholar] [CrossRef]
- Winder, A.J.; Harris, H. New assays for the tyrosine hydroxylase and dopa oxidase activities of tyrosinase. Eur. J. Biochem. 1991, 198, 317–326. [Google Scholar] [CrossRef]
- Rodriguez-lopez, J.N.; Escribano, J.; Garcia-canovas, F. A Continuous Spectrophotometric Method for the Determination of Monophenolase Activity of Tyrosinase Using 3-Methyl-2-benzothiazolinone Hydrazone. Anal. Biochem. 1994, 216, 205–212. [Google Scholar] [CrossRef] [PubMed]
- Pomerantz, S.H. The Tyrosine Hydroxylase Activity of Mammalian Tyrosinase. J. Biol. Chem. 1966, 241, 161–168. [Google Scholar] [CrossRef]
- Cabanes, J.; García-Cánovas, F.; Lozano, J.; García-Carmona, F. A kinetic study of the melanization pathway between L-tyrosine and dopachrome. Biochim. Biophys. Acta–Gen. Subj. 1987, 923, 187–195. [Google Scholar] [CrossRef]
- Rzepecki, L.M.; Waite, J.H. A chromogenic assay for catecholoxidases based on the addition of l-proline to quinones. Anal. Biochem. 1989, 179, 375–381. [Google Scholar] [CrossRef]
- Espín, J.C.; Tudela, J.; García-Cánovas, F. 4-Hydroxyanisole: The Most Suitable Monophenolic Substrate for Determining Spectrophotometrically the Monophenolase Activity of Polyphenol Oxidase from Fruits and Vegetables. Anal. Biochem. 1998, 259, 118–126. [Google Scholar] [CrossRef]
- Espín, J.C.; Morales, M.; García-Ruiz, P.A.; Tudela, J.; García-Cánovas, F. Improvement of a Continuous Spectrophotometric Method for Determining the Monophenolase and Diphenolase Activities of Mushroom Polyphenol Oxidase. J. Agric. Food Chem. 1997, 45, 1084–1090. [Google Scholar] [CrossRef]
- Espín, J.C.; Varón, R.; Tudela, J.; García-Cánovas, F. Kinetic study of the oxidation of 4-hydroxyanisole catalyzed by tyrosinase. IUBMB Life 1997, 41, 1265–1276. [Google Scholar] [CrossRef]
- Espín, J.C.; Varón, R.; Fenoll, L.G.; Gilabert, M.A.; García-Ruíz, P.A.; Tudela, J.; García-Cánovas, F. Kinetic characterization of the substrate specificity and mechanism of mushroom tyrosinase. Eur. J. Biochem. 2000, 267, 1270–1279. [Google Scholar] [CrossRef] [Green Version]
- Young, K.L., II; Kassouf, C.; Dolinska, M.B.; Anderson, D.E.; Sergeev, Y.V. Human Tyrosinase: Temperature-Dependent Kinetics of Oxidase Activity. Int. J. Mol. Sci. 2020, 21, 895. [Google Scholar] [CrossRef] [Green Version]
- Ertan, H.; Siddiqui, K.S.; Muenchhoff, J.; Charlton, T.; Cavicchioli, R. Kinetic and thermodynamic characterization of the functional properties of a hybrid versatile peroxidase using isothermal titration calorimetry: Insight into manganese peroxidase activation and lignin peroxidase inhibition. Biochimie 2012, 94, 221–231. [Google Scholar] [CrossRef]
- García-Molina, F.; Muñoz, J.L.; Varón, R.; Rodríguez-López, J.N.; García-Cánovas, F.; Tudela, J. A Review on Spectrophotometric Methods for Measuring the Monophenolase and Diphenolase Activities of Tyrosinase. J. Agric. Food Chem. 2007, 55, 9739–9749. [Google Scholar] [CrossRef]
- Espin, J.C.; Morales, M.; Varon, R.; Tudela, J.; Garciacanovas, F. A Continuous Spectrophotometric Method for Determining the Monophenolase and Diphenolase Activities of Apple Polyphenol Oxidase. Anal. Biochem. 1995, 231, 237–246. [Google Scholar] [CrossRef] [PubMed]
- Rodríguez-López, J.N.; Fenoll, L.G.; García-Ruiz, P.A.; Varón, R.; Tudela, J.; Thorneley, R.N.F.; García-Cánovas, F. Stopped-Flow and Steady-State Study of the Diphenolase Activity of Mushroom Tyrosinase. Biochemistry 2000, 39, 10497–10506. [Google Scholar] [CrossRef] [PubMed]
- Bradford, M.M. A rapid and sensitive method for the quantitation of microgram quantities of protein utilizing the principle of protein-dye binding. Anal. Biochem. 1976, 72, 248–254. [Google Scholar] [CrossRef]
- FDA. Q2B Validation of Analytical Procedures: Methodology. Available online: https://www.fda.gov/regulatory-information/search-fda-guidance-documents/q2b-validation-analytical-procedures-methodology (accessed on 24 August 2018).
- Fenoll, L.G.; Rodríguez-López, J.N.; García-Molina, F.; García-Cánovas, F.; Tudela, J. Unification for the Expression of the Monophenolase and Diphenolase Activities of Tyrosinase. IUBMB Life 2002, 54, 137–141. [Google Scholar] [CrossRef]
- Systat Software, Version 9.0, Sigma Plot for Windows; Systat software: San Jose, CA, USA, 2006.
- Gerald, C.F. Applied Numerical Analysis; Addison-Wesley: Reading, UK, 1978. [Google Scholar]
- García-Sevilla, F.; Garrido-del Solo, C.; Duggleby, R.G.; García-Cánovas, F.; Peyró, R.; Varón, R. Use of a windows program for simulation of the progress curves of reactants and intermediates involved in enzyme-catalyzed reactions. Biosystems 2000, 54, 151–164. [Google Scholar] [CrossRef]
- Sánchez-Ferrer, Á.; Neptuno Rodríguez-López, J.; García-Cánovas, F.; García-Carmona, F. Tyrosinase: A comprehensive review of its mechanism. Biochim. Biophys. Acta Protein Struct. Mol. Enzymol. 1995, 1247, 1–11. [Google Scholar] [CrossRef]
- Fernandez-Julia, P.J.; Tudela-Serrano, J.; Garcia-Molina, F.; Garcia-Canovas, F.; Garcia-Jimenez, A.; Munoz-Munoz, J.L. Study of tyrosine and dopa enantiomers as tyrosinase substrates initiating l- and d-melanogenesis pathways. Biotechnol. Appl. Biochem. 2020. [Google Scholar] [CrossRef] [PubMed]
- Maria-Solano, M.A.; Ortiz-Ruiz, C.V.; Muñoz-Muñoz, J.L.; Teruel-Puche, J.A.; Berna, J.; Garcia-Ruiz, P.A.; Garcia-Canovas, F. Further insight into the pH effect on the catalysis of mushroom tyrosinase. J. Mol. Catal. B Enzym. 2016, 125, 6–15. [Google Scholar] [CrossRef]
- Ortiz-Ruiz, C.V.; Garcia-Molina, M.d.M.; Serrano, J.T.; Tomas-Martinez, V.; Garcia-Canovas, F. Discrimination between Alternative Substrates and Inhibitors of Tyrosinase. J. Agric. Food Chem. 2015, 63, 2162–2171. [Google Scholar] [CrossRef] [PubMed]
- Buitrago, E.; Faure, C.; Challali, L.; Bergantino, E.; Boumendjel, A.; Bubacco, L.; Carotti, M.; Hardré, R.; Maresca, M.; Philouze, C.; et al. Ditopic Chelators of Dicopper Centers for Enhanced Tyrosinases Inhibition. Chem. Eur. J. 2021, 27, 4384–4393. [Google Scholar] [CrossRef] [PubMed]
- Kim, J.H.; Leem, H.H.; Lee, G.Y. The Guanidine Pseudoalkaloids 10-Methoxy-Leonurine and Leonurine Act as Competitive Inhibitors of Tyrosinase. Biomolecules 2020, 10, 174. [Google Scholar] [CrossRef] [PubMed] [Green Version]


| Analysis Method | Analysis Manner | Substrate | LODM (U/mL) | SR | Reference |
|---|---|---|---|---|---|
| Fluorescence | Continuous | L-tyrosine | 0.0952 | [10] | |
| Fluorescence | Real-time | L-tyrosine | 0.0851 | [11] | |
| Fluorescence | Continuous synchronous | L-tyrosine | 0.0721 | [12] | |
| Coupled MBTH | Continuous | 4-hydroxyphenil propionic acid | 0.25 | [19] | |
| Coupled MBTH | Continuous | Tyramine | – | 0.40 | [14] |
| Coupled MBTH | Continuous | 4-hydroxyanisol | – | 2.64 | [20,21] |
| Coupled MBTH | Continuous | L-tyrosine | – | 0.13 | [21] |
Publisher’s Note: MDPI stays neutral with regard to jurisdictional claims in published maps and institutional affiliations. |
© 2021 by the authors. Licensee MDPI, Basel, Switzerland. This article is an open access article distributed under the terms and conditions of the Creative Commons Attribution (CC BY) license (https://creativecommons.org/licenses/by/4.0/).
Share and Cite
García-Molina, P.; Munoz-Munoz, J.L.; Ortuño, J.A.; Rodríguez-López, J.N.; García-Ruiz, P.A.; García-Cánovas, F.; García-Molina, F. Considerations about the Continuous Assay Methods, Spectrophotometric and Spectrofluorometric, of the Monophenolase Activity of Tyrosinase. Biomolecules 2021, 11, 1269. https://doi.org/10.3390/biom11091269
García-Molina P, Munoz-Munoz JL, Ortuño JA, Rodríguez-López JN, García-Ruiz PA, García-Cánovas F, García-Molina F. Considerations about the Continuous Assay Methods, Spectrophotometric and Spectrofluorometric, of the Monophenolase Activity of Tyrosinase. Biomolecules. 2021; 11(9):1269. https://doi.org/10.3390/biom11091269
Chicago/Turabian StyleGarcía-Molina, Pablo, José Luis Munoz-Munoz, Joaquin A. Ortuño, José Neptuno Rodríguez-López, Pedro Antonio García-Ruiz, Francisco García-Cánovas, and Francisco García-Molina. 2021. "Considerations about the Continuous Assay Methods, Spectrophotometric and Spectrofluorometric, of the Monophenolase Activity of Tyrosinase" Biomolecules 11, no. 9: 1269. https://doi.org/10.3390/biom11091269
APA StyleGarcía-Molina, P., Munoz-Munoz, J. L., Ortuño, J. A., Rodríguez-López, J. N., García-Ruiz, P. A., García-Cánovas, F., & García-Molina, F. (2021). Considerations about the Continuous Assay Methods, Spectrophotometric and Spectrofluorometric, of the Monophenolase Activity of Tyrosinase. Biomolecules, 11(9), 1269. https://doi.org/10.3390/biom11091269