
Clinical Perspectives of Single-Cell RNA Sequencing


Abstract
:1. Introduction
2. Brief Overview of Cancer Genomics in Precision Oncology
2.1. Molecular Target Discoveries and NGS Panel Sequencing
2.2. Gene-Expression-Based Patient Stratification
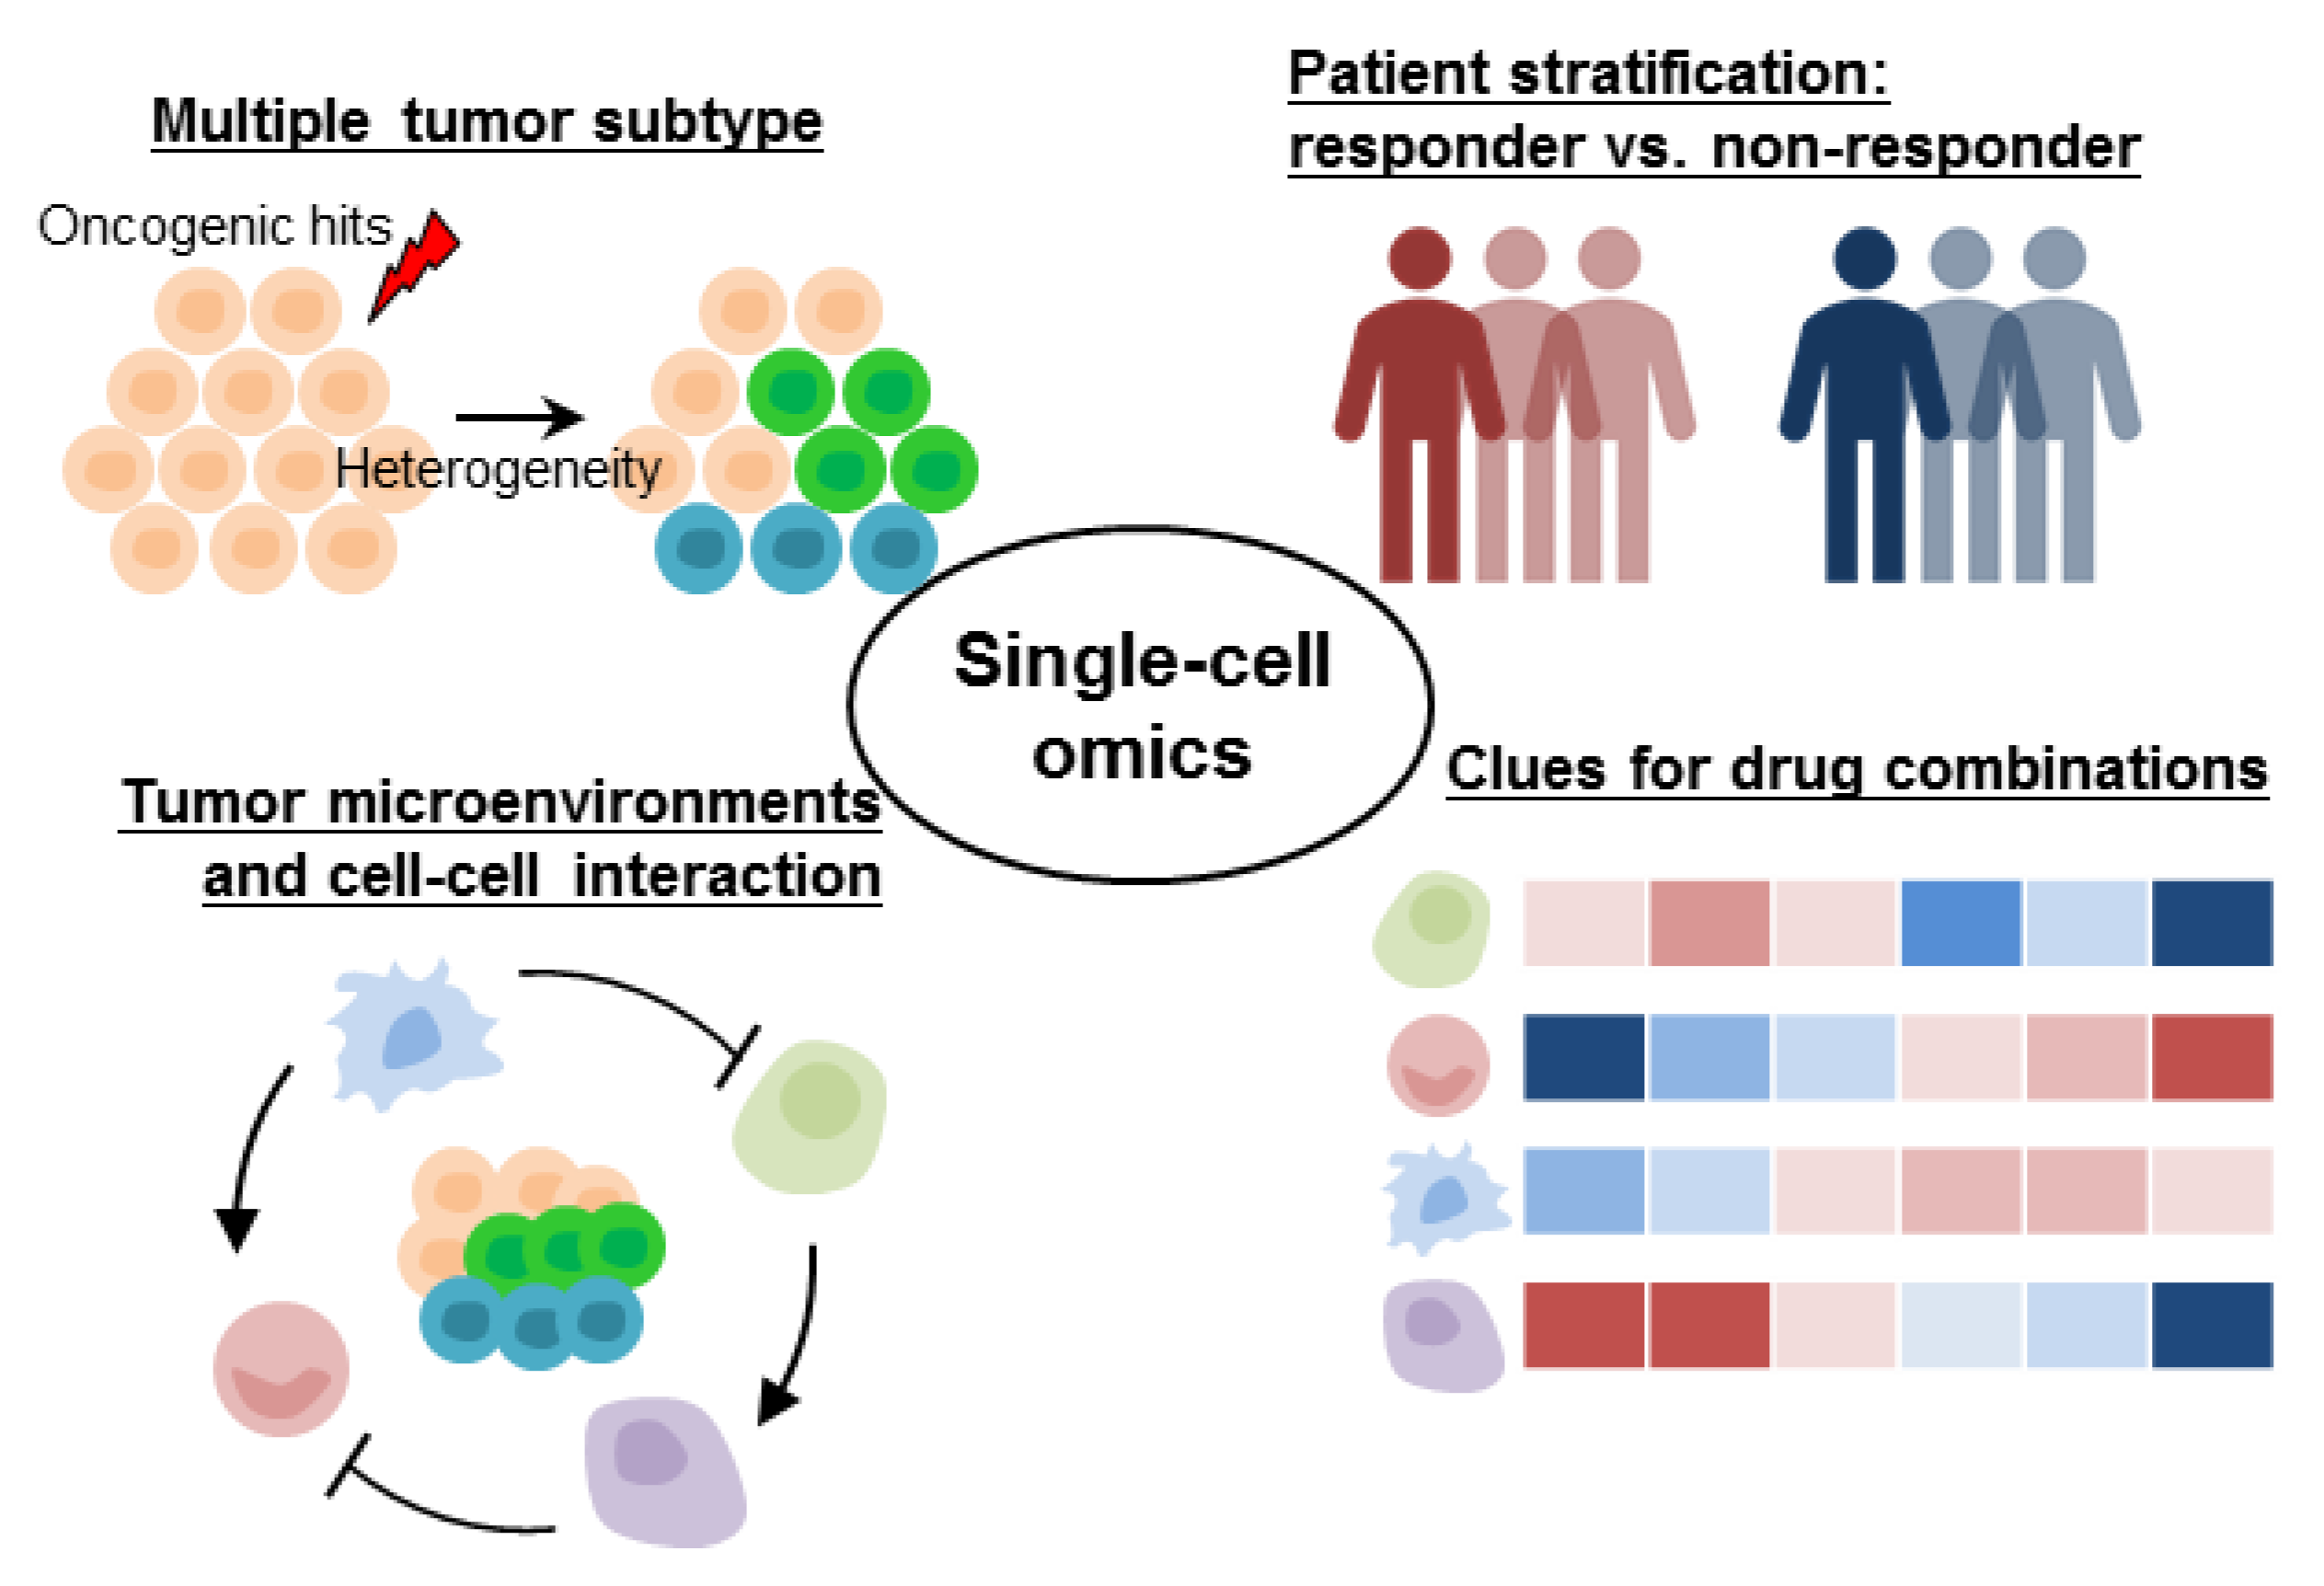
3. Tumor Heterogeneity Is Responsible for Treatment Resistance in Precision Oncology
3.1. Tumor Heterogeneity Fine-Tuning Molecular-Targeted Therapies
3.2. Gene Expression Heterogeneity Associated with Prognosis, Treatment, and Patient Stratification
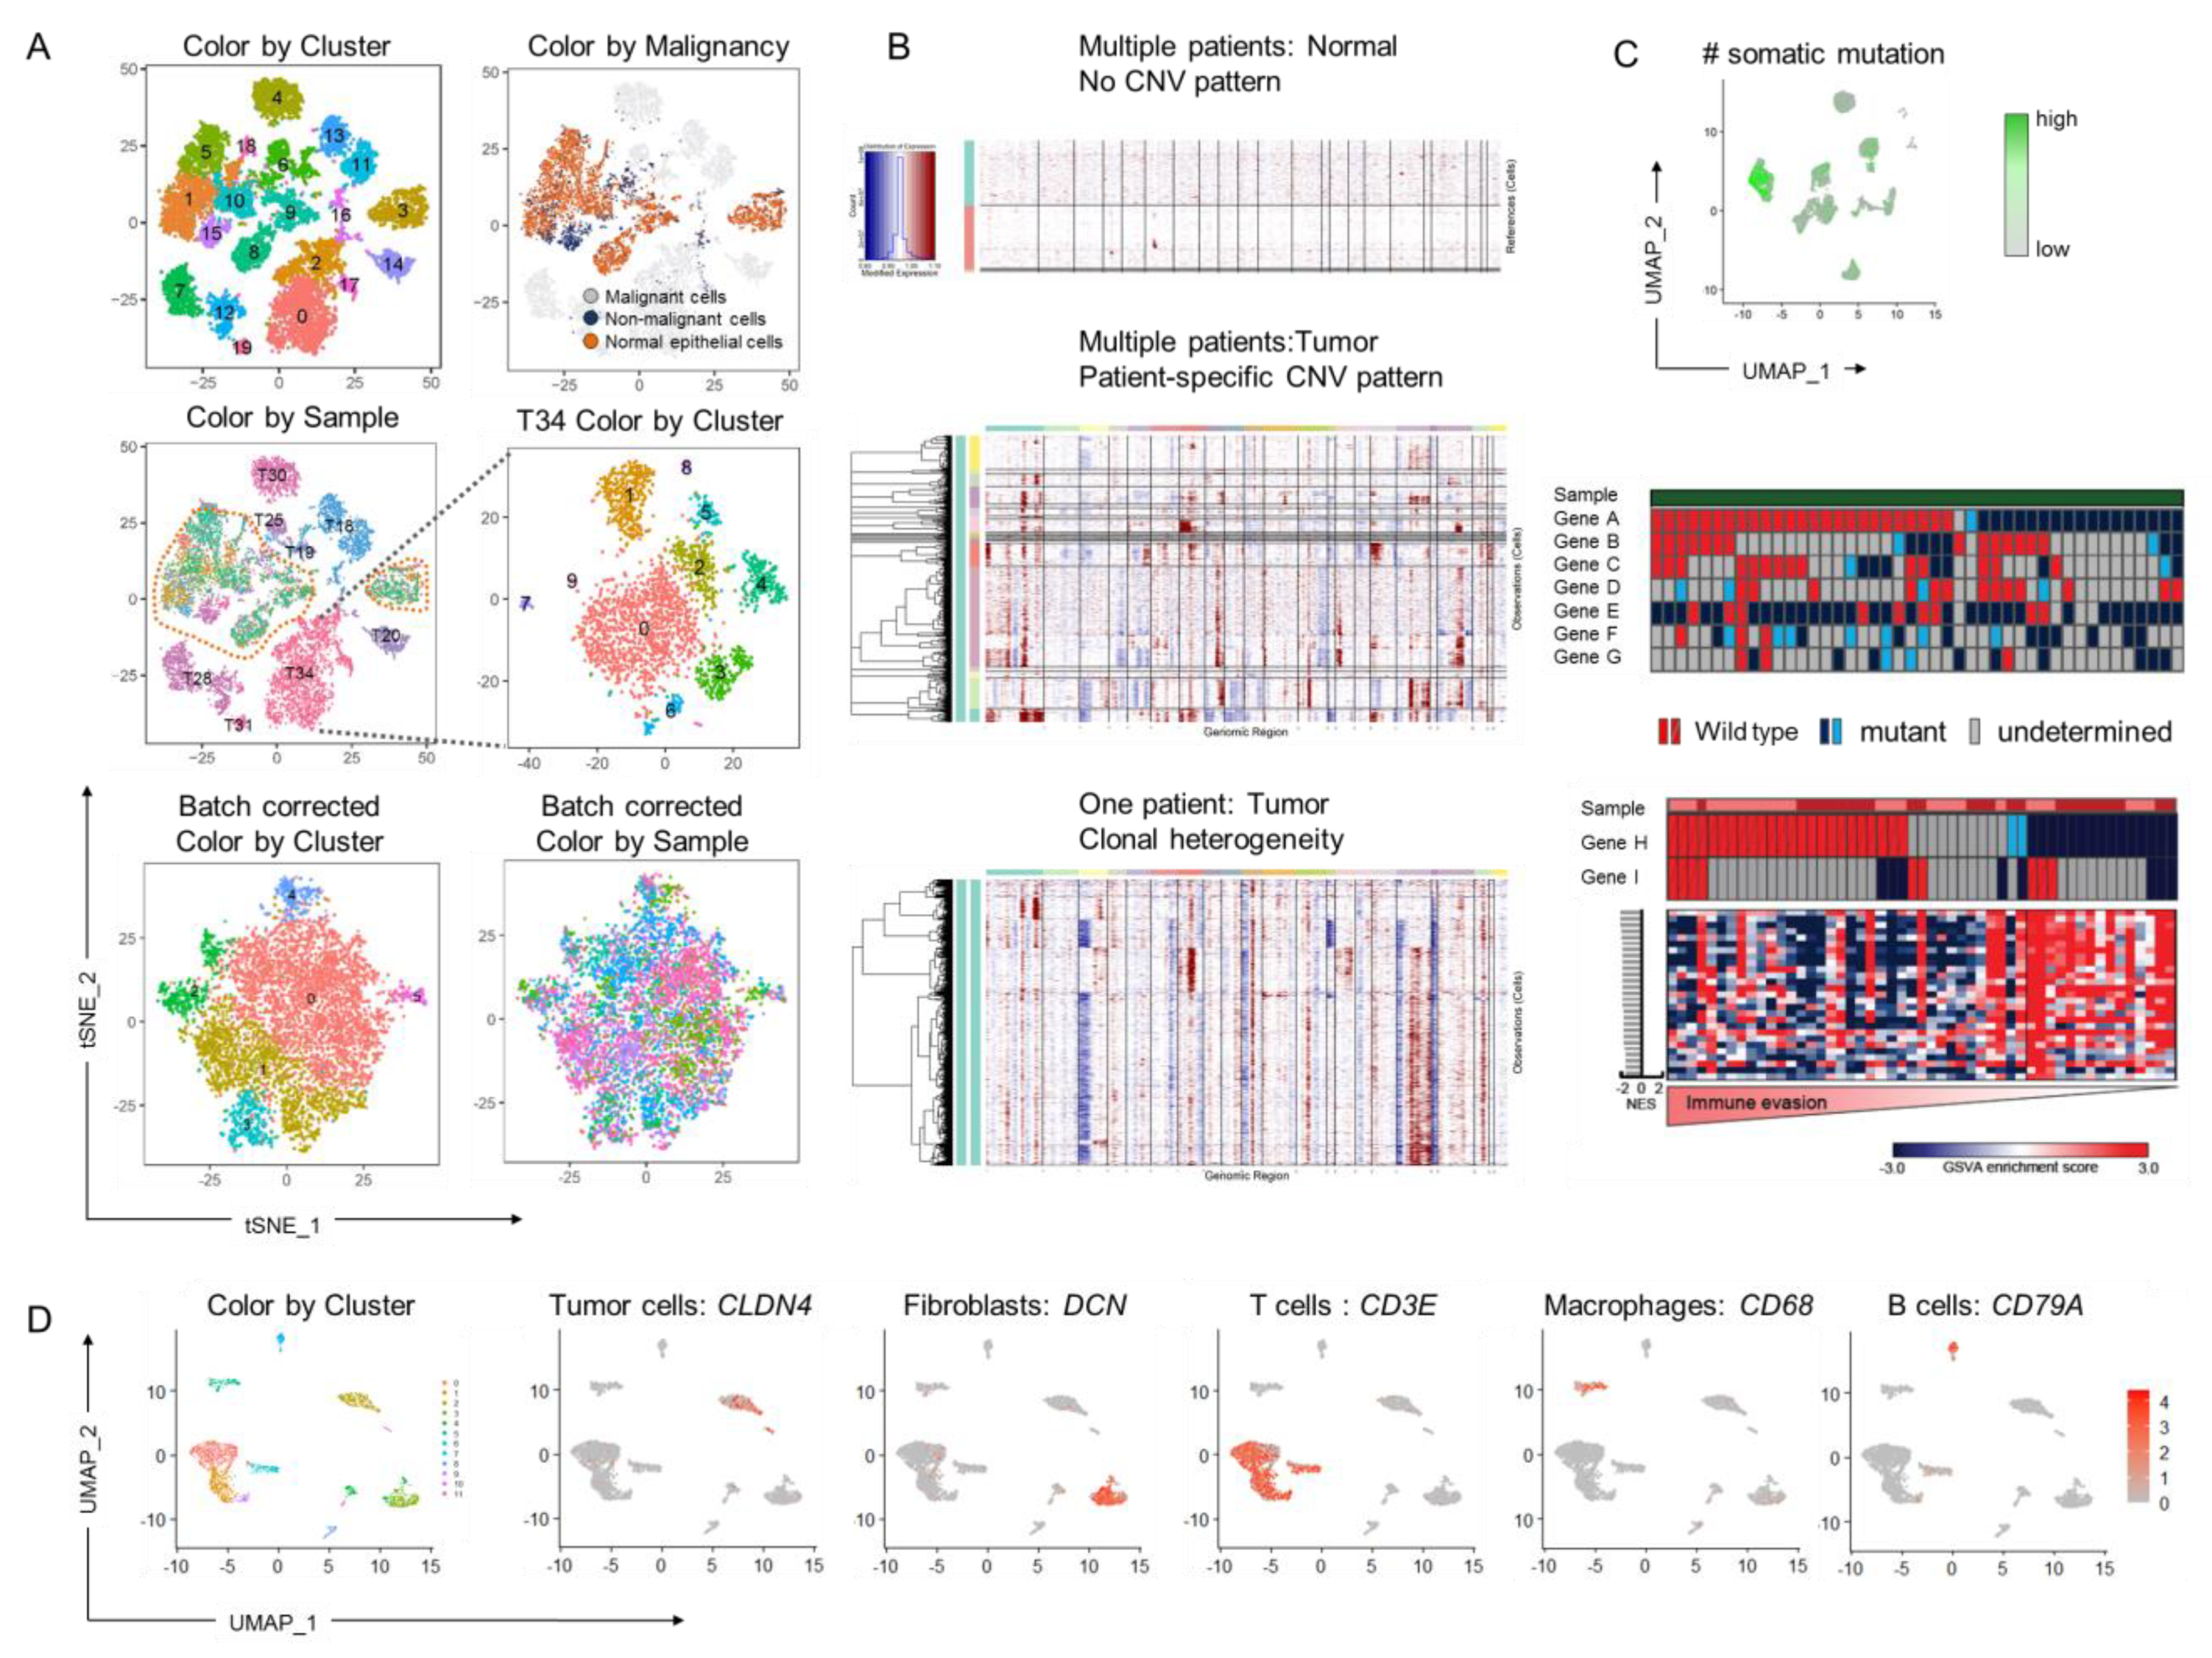
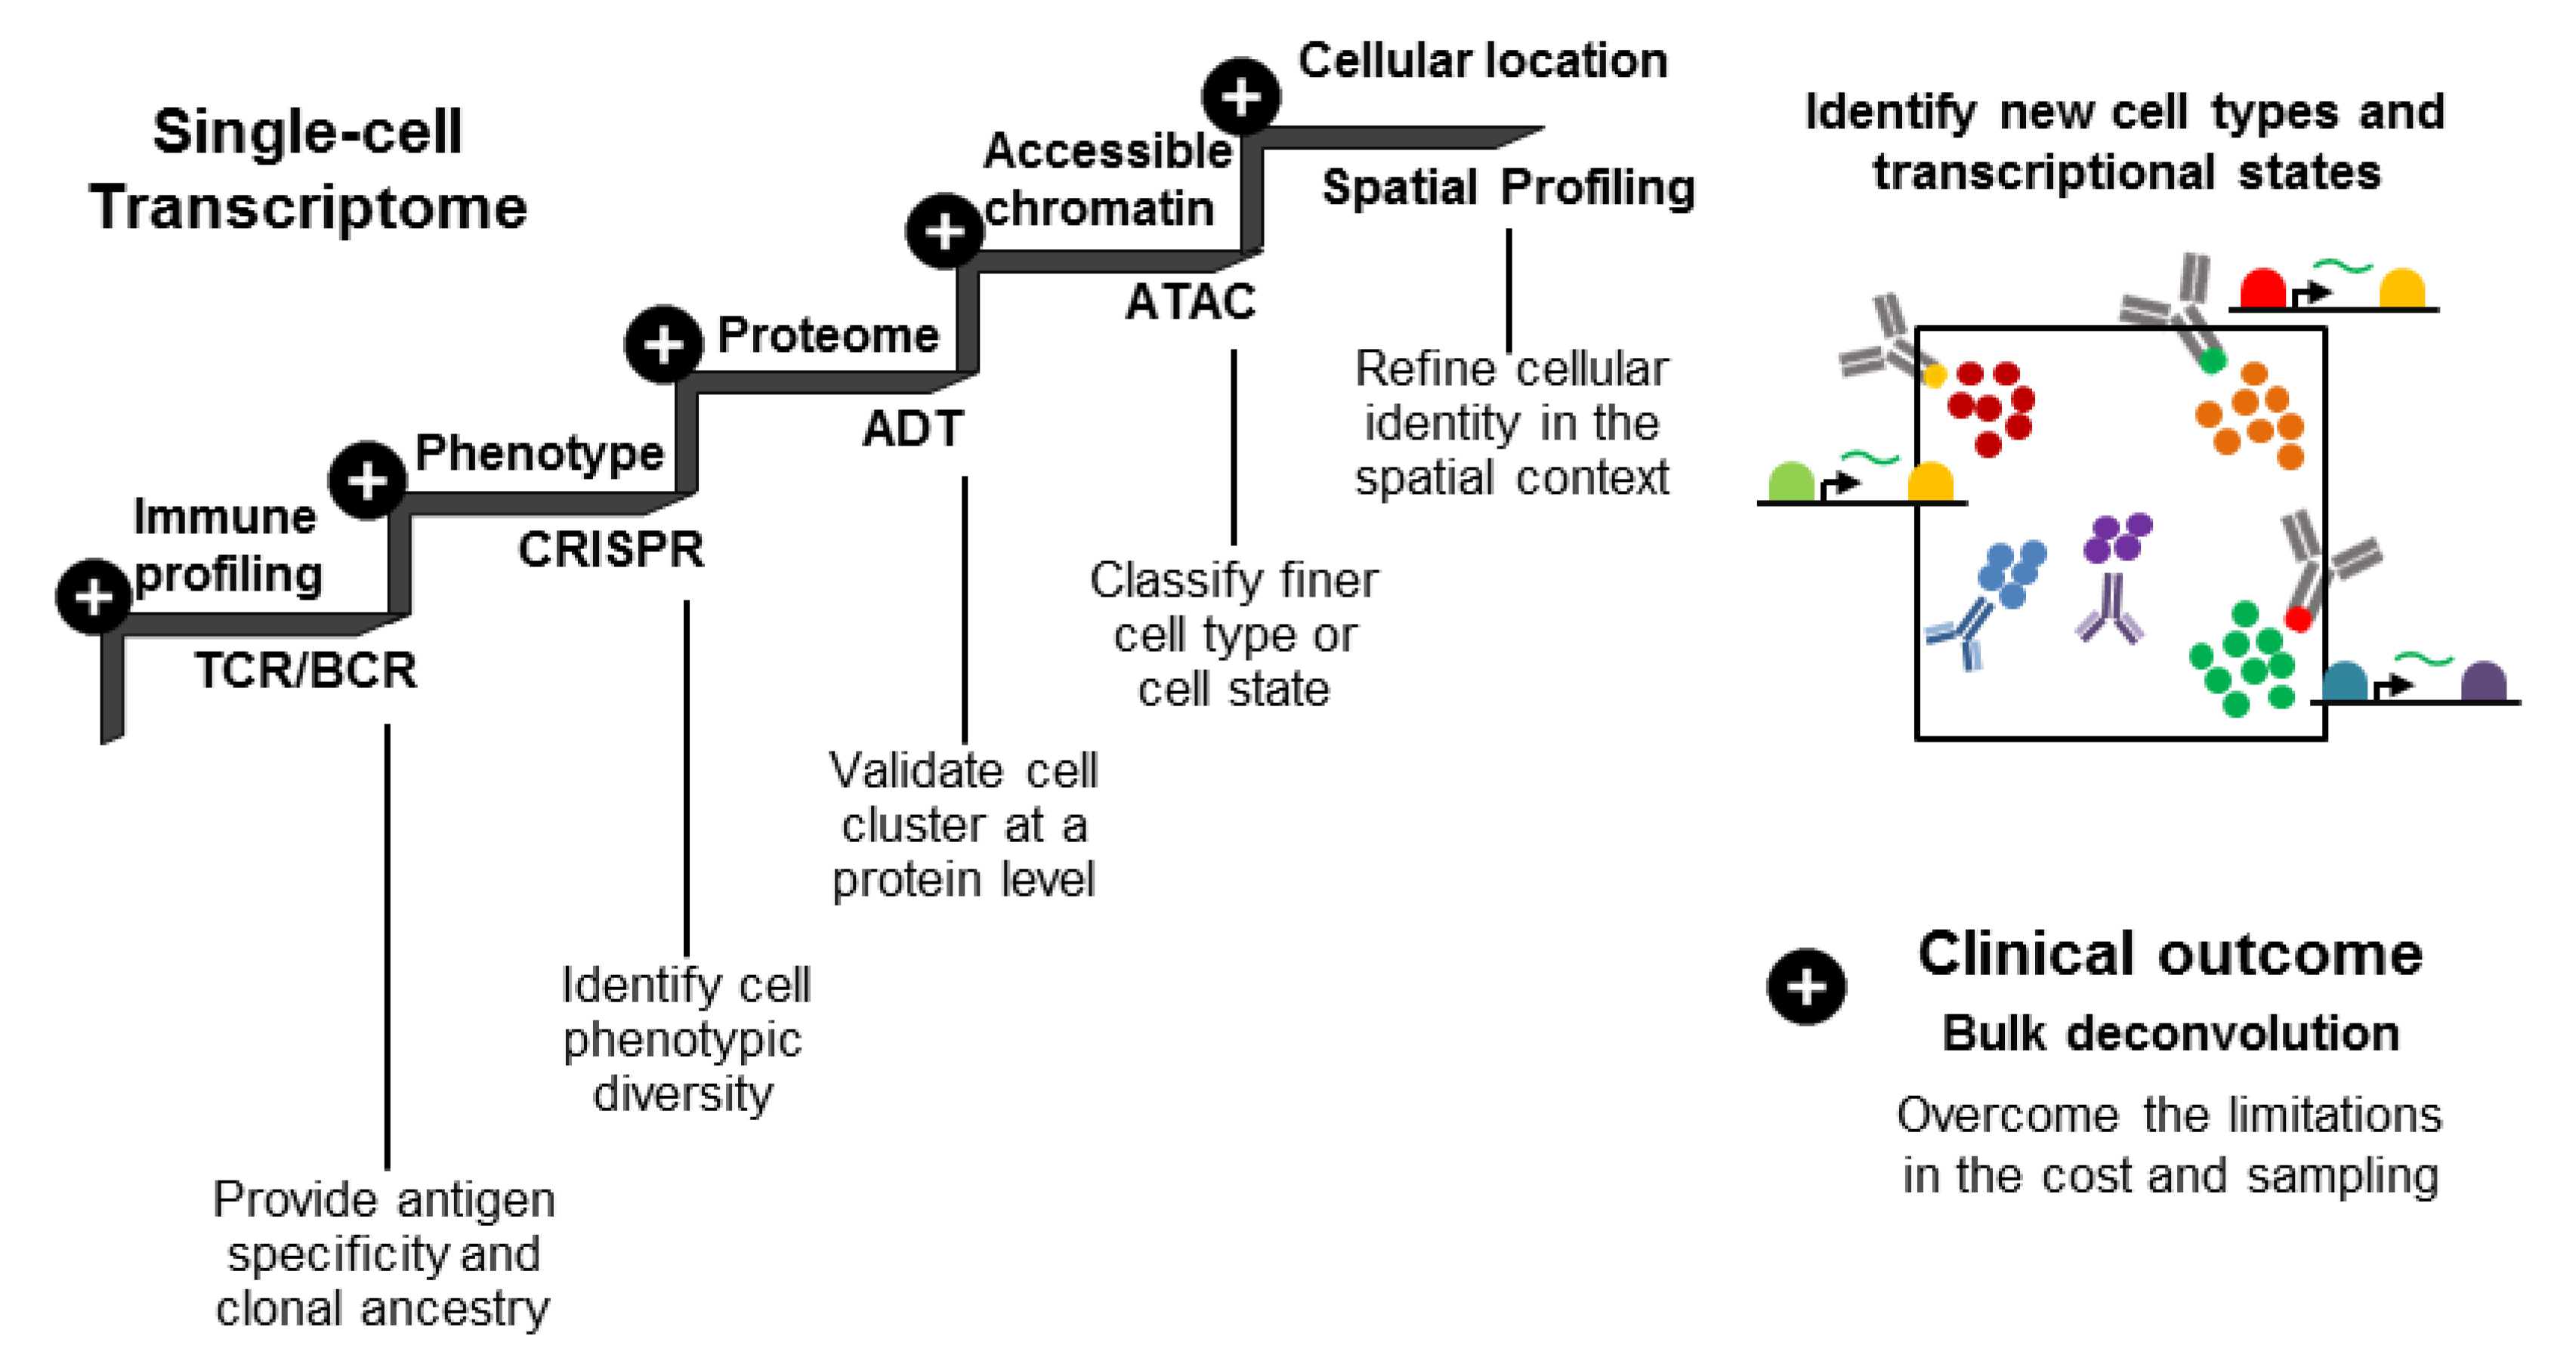
4. Multimodal and Deconvolution Approaches Facilitate the Biological Interpretations and Clinical Applications of Single-Cell Genomic Data
4.1. Linking Genetic and Gene Expression Data
4.2. Linking Protein and Gene Expression Clusters to the Functional Phenotype through Multi-Omic Analyses
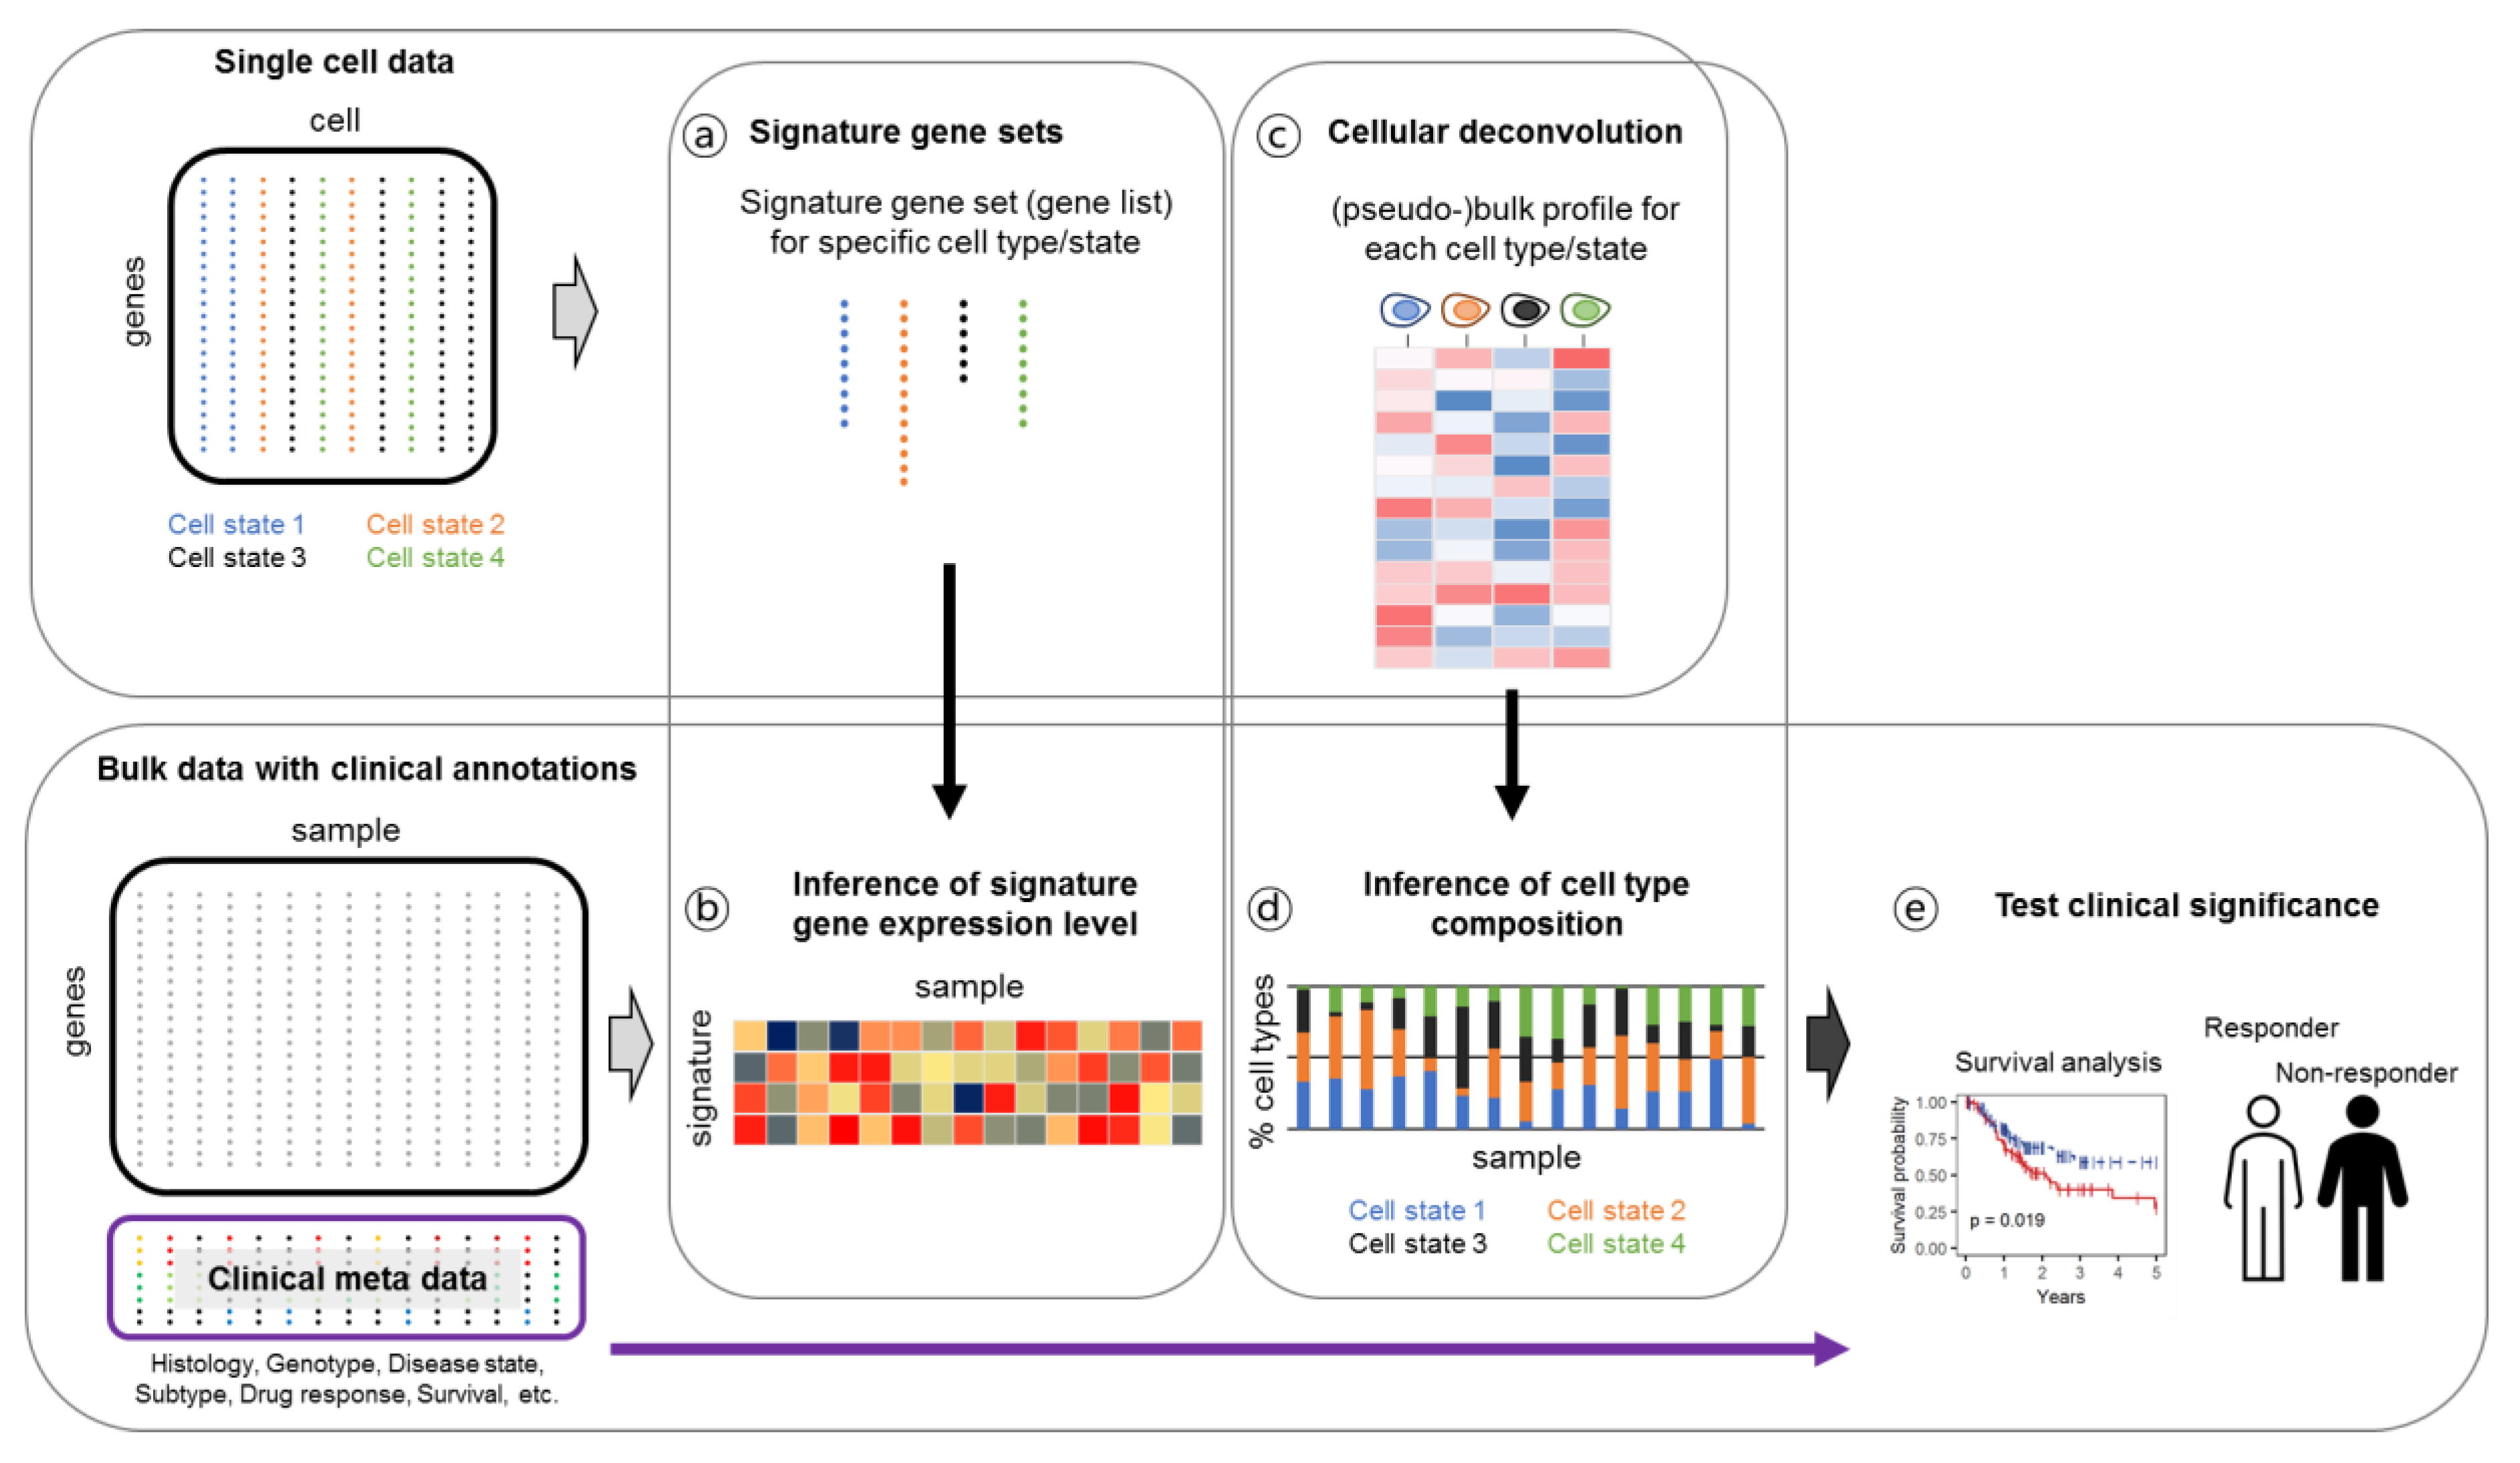
4.3. Linking Single-Cell Gene Expression Data to Clinical Output through Bulk Deconvolution
4.4. Using BCR and TCR Data for Lineage Tracing and Therapeutic Development
5. Conclusions
Author Contributions
Funding
Acknowledgments
Conflicts of Interest
References
- Patel, A.P.; Tirosh, I.; Trombetta, J.J.; Shalek, A.K.; Gillespie, S.M.; Wakimoto, H.; Cahill, D.P.; Nahed, B.V.; Curry, W.T.; Martuza, R.L.; et al. Single-cell RNA-seq highlights intratumoral heterogeneity in primary glioblastoma. Science 2014, 344, 1396–1401. [Google Scholar] [CrossRef] [PubMed] [Green Version]
- Tirosh, I.; Izar, B.; Prakadan, S.M.; Wadsworth, M.H., 2nd; Treacy, D.; Trombetta, J.J.; Rotem, A.; Rodman, C.; Lian, C.; Murphy, G.; et al. Dissecting the multicellular ecosystem of metastatic melanoma by single-cell RNA-seq. Science 2016, 352, 189–196. [Google Scholar] [CrossRef] [Green Version]
- Aissa, A.F.; Islam, A.; Ariss, M.M.; Go, C.C.; Rader, A.E.; Conrardy, R.D.; Gajda, A.M.; Rubio-Perez, C.; Valyi-Nagy, K.; Pasquinelli, M.; et al. Single-cell transcriptional changes associated with drug tolerance and response to combination therapies in cancer. Nat. Commun. 2021, 12, 1628. [Google Scholar] [CrossRef]
- Kim, K.T.; Lee, H.W.; Lee, H.O.; Kim, S.C.; Seo, Y.J.; Chung, W.; Eum, H.H.; Nam, D.H.; Kim, J.; Joo, K.M.; et al. Single-cell mRNA sequencing identifies subclonal heterogeneity in anti-cancer drug responses of lung adenocarcinoma cells. Genome Biol. 2015, 16, 127. [Google Scholar] [CrossRef] [PubMed] [Green Version]
- Kim, K.T.; Lee, H.W.; Lee, H.O.; Song, H.J.; Jeong, D.E.; Shin, S.; Kim, H.; Shin, Y.; Nam, D.H.; Jeong, B.C.; et al. Application of single-cell RNA sequencing in optimizing a combinatorial therapeutic strategy in metastatic renal cell carcinoma. Genome Biol. 2016, 17, 80. [Google Scholar] [CrossRef] [PubMed] [Green Version]
- Butler, A.; Hoffman, P.; Smibert, P.; Papalexi, E.; Satija, R. Integrating single-cell transcriptomic data across different conditions, technologies, and species. Nat. Biotechnol. 2018, 36, 411–420. [Google Scholar] [CrossRef] [PubMed]
- Braun, T.P.; Eide, C.A.; Druker, B.J. Response and Resistance to BCR-ABL1-Targeted Therapies. Cancer Cell 2020, 37, 530–542. [Google Scholar] [CrossRef] [PubMed]
- Druker, B.J.; Talpaz, M.; Resta, D.J.; Peng, B.; Buchdunger, E.; Ford, J.M.; Lydon, N.B.; Kantarjian, H.; Capdeville, R.; Ohno-Jones, S.; et al. Efficacy and safety of a specific inhibitor of the BCR-ABL tyrosine kinase in chronic myeloid leukemia. N. Engl. J. Med. 2001, 344, 1031–1037. [Google Scholar] [CrossRef] [Green Version]
- International Cancer Genome Consortium; Hudson, T.J.; Anderson, W.; Artez, A.; Barker, A.D.; Bell, C.; Bernabe, R.R.; Bhan, M.K.; Calvo, F.; Eerola, I.; et al. International network of cancer genome projects. Nature 2010, 464, 993–998. [Google Scholar] [CrossRef] [Green Version]
- Cancer Genome Atlas (TCGA) Research Network. Comprehensive genomic characterization defines human glioblastoma genes and core pathways. Nature 2008, 455, 1061–1068. [Google Scholar] [CrossRef] [PubMed]
- Gao, G.F.; Parker, J.S.; Reynolds, S.M.; Silva, T.C.; Wang, L.B.; Zhou, W.; Akbani, R.; Bailey, M.; Balu, S.; Berman, B.P.; et al. Before and After: Comparison of Legacy and Harmonized TCGA Genomic Data Commons’ Data. Cell Syst. 2019, 9, 24–34.e10. [Google Scholar] [CrossRef] [PubMed] [Green Version]
- Mosele, F.; Remon, J.; Mateo, J.; Westphalen, C.B.; Barlesi, F.; Lolkema, M.P.; Normanno, N.; Scarpa, A.; Robson, M.; Meric-Bernstam, F.; et al. Recommendations for the use of next-generation sequencing (NGS) for patients with metastatic cancers: A report from the ESMO Precision Medicine Working Group. Ann. Oncol. 2020, 31, 1491–1505. [Google Scholar] [CrossRef] [PubMed]
- Zhong, Y.; Xu, F.; Wu, J.; Schubert, J.; Li, M.M. Application of Next Generation Sequencing in Laboratory Medicine. Ann. Lab. Med. 2021, 41, 25–43. [Google Scholar] [CrossRef] [PubMed]
- Perakis, S.O.; Weber, S.; Zhou, Q.; Graf, R.; Hojas, S.; Riedl, J.M.; Gerger, A.; Dandachi, N.; Balic, M.; Hoefler, G.; et al. Comparison of three commercial decision support platforms for matching of next-generation sequencing results with therapies in patients with cancer. ESMO Open 2020, 5, e000872. [Google Scholar] [CrossRef] [PubMed]
- Tate, J.G.; Bamford, S.; Jubb, H.C.; Sondka, Z.; Beare, D.M.; Bindal, N.; Boutselakis, H.; Cole, C.G.; Creatore, C.; Dawson, E.; et al. COSMIC: The Catalogue Of Somatic Mutations In Cancer. Nucleic Acids Res. 2019, 47, D941–D947. [Google Scholar] [CrossRef] [Green Version]
- De Jesus, S.; Almeida, L.; Peng-Chen, Z.; Okun, M.S.; Hess, C.W. Novel targets and stimulation paradigms for deep brain stimulation. Expert Rev. Neurother. 2015, 15, 1067–1080. [Google Scholar] [CrossRef]
- Goldberg, K.B.; Blumenthal, G.M.; Pazdur, R. The First Year of the Food and Drug Administration Oncology Center of Excellence: Landmark Approvals in a Dynamic Regulatory Environment. Cancer J. 2018, 24, 131–135. [Google Scholar] [CrossRef] [PubMed]
- Cocco, E.; Scaltriti, M.; Drilon, A. NTRK fusion-positive cancers and TRK inhibitor therapy. Nat. Rev. Clin. Oncol. 2018, 15, 731–747. [Google Scholar] [CrossRef]
- Bartlett, J.M.; Bayani, J.; Marshall, A.; Dunn, J.A.; Campbell, A.; Cunningham, C.; Sobol, M.S.; Hall, P.S.; Poole, C.J.; Cameron, D.A.; et al. Comparing Breast Cancer Multiparameter Tests in the OPTIMA Prelim Trial: No Test Is More Equal Than the Others. J. Natl. Cancer Inst. 2016, 108. [Google Scholar] [CrossRef] [Green Version]
- Ross, J.S.; Hatzis, C.; Symmans, W.F.; Pusztai, L.; Hortobagyi, G.N. Commercialized multigene predictors of clinical outcome for breast cancer. Oncologist 2008, 13, 477–493. [Google Scholar] [CrossRef] [PubMed] [Green Version]
- Shaughnessy, J.D., Jr.; Zhan, F.; Burington, B.E.; Huang, Y.; Colla, S.; Hanamura, I.; Stewart, J.P.; Kordsmeier, B.; Randolph, C.; Williams, D.R.; et al. A validated gene expression model of high-risk multiple myeloma is defined by deregulated expression of genes mapping to chromosome 1. Blood 2007, 109, 2276–2284. [Google Scholar] [CrossRef] [PubMed] [Green Version]
- Kuiper, R.; Broyl, A.; de Knegt, Y.; van Vliet, M.H.; van Beers, E.H.; van der Holt, B.; el Jarari, L.; Mulligan, G.; Gregory, W.; Morgan, G.; et al. A gene expression signature for high-risk multiple myeloma. Leukemia 2012, 26, 2406–2413. [Google Scholar] [CrossRef] [Green Version]
- Dagogo-Jack, I.; Shaw, A.T. Tumour heterogeneity and resistance to cancer therapies. Nat. Rev. Clin. Oncol. 2018, 15, 81–94. [Google Scholar] [CrossRef] [PubMed]
- Gerlinger, M.; Rowan, A.J.; Horswell, S.; Math, M.; Larkin, J.; Endesfelder, D.; Gronroos, E.; Martinez, P.; Matthews, N.; Stewart, A.; et al. Intratumor heterogeneity and branched evolution revealed by multiregion sequencing. N. Engl. J. Med. 2012, 366, 883–892. [Google Scholar] [CrossRef] [PubMed] [Green Version]
- Jamal-Hanjani, M.; Wilson, G.A.; McGranahan, N.; Birkbak, N.J.; Watkins, T.B.K.; Veeriah, S.; Shafi, S.; Johnson, D.H.; Mitter, R.; Rosenthal, R.; et al. Tracking the Evolution of Non-Small-Cell Lung Cancer. N. Engl. J. Med. 2017, 376, 2109–2121. [Google Scholar] [CrossRef] [PubMed] [Green Version]
- Lee, J.K.; Wang, J.; Sa, J.K.; Ladewig, E.; Lee, H.O.; Lee, I.H.; Kang, H.J.; Rosenbloom, D.S.; Camara, P.G.; Liu, Z.; et al. Spatiotemporal genomic architecture informs precision oncology in glioblastoma. Nat. Genet. 2017, 49, 594–599. [Google Scholar] [CrossRef] [PubMed]
- AbdulJabbar, K.; Raza, S.E.A.; Rosenthal, R.; Jamal-Hanjani, M.; Veeriah, S.; Akarca, A.; Lund, T.; Moore, D.A.; Salgado, R.; Al Bakir, M.; et al. Geospatial immune variability illuminates differential evolution of lung adenocarcinoma. Nat. Med. 2020, 26, 1054–1062. [Google Scholar] [CrossRef] [PubMed]
- Biswas, D.; Birkbak, N.J.; Rosenthal, R.; Hiley, C.T.; Lim, E.L.; Papp, K.; Boeing, S.; Krzystanek, M.; Djureinovic, D.; La Fleur, L.; et al. A clonal expression biomarker associates with lung cancer mortality. Nat. Med. 2019, 25, 1540–1548. [Google Scholar] [CrossRef]
- Chemi, F.; Rothwell, D.G.; McGranahan, N.; Gulati, S.; Abbosh, C.; Pearce, S.P.; Zhou, C.; Wilson, G.A.; Jamal-Hanjani, M.; Birkbak, N.; et al. Pulmonary venous circulating tumor cell dissemination before tumor resection and disease relapse. Nat. Med. 2019, 25, 1534–1539. [Google Scholar] [CrossRef]
- Ghorani, E.; Reading, J.L.; Henry, J.Y.; de Massy, M.R.; Rosenthal, R.; Turati, V.; Joshi, K.; Furness, A.J.S.; Aissa, A.B.; Saini, S.K.; et al. The T cell differentiation landscape is shaped by tumour mutations in lung cancer. Nat. Cancer 2020, 1, 546–561. [Google Scholar] [CrossRef]
- Joshi, K.; de Massy, M.R.; Ismail, M.; Reading, J.L.; Uddin, I.; Woolston, A.; Hatipoglu, E.; Oakes, T.; Rosenthal, R.; Peacock, T.; et al. Spatial heterogeneity of the T cell receptor repertoire reflects the mutational landscape in lung cancer. Nat. Med. 2019, 25, 1549–1559. [Google Scholar] [CrossRef]
- Lopez, S.; Lim, E.L.; Horswell, S.; Haase, K.; Huebner, A.; Dietzen, M.; Mourikis, T.P.; Watkins, T.B.K.; Rowan, A.; Dewhurst, S.M.; et al. Interplay between whole-genome doubling and the accumulation of deleterious alterations in cancer evolution. Nat. Genet. 2020, 52, 283–293. [Google Scholar] [CrossRef] [PubMed]
- Rosenthal, R.; Cadieux, E.L.; Salgado, R.; Bakir, M.A.; Moore, D.A.; Hiley, C.T.; Lund, T.; Tanic, M.; Reading, J.L.; Joshi, K.; et al. Neoantigen-directed immune escape in lung cancer evolution. Nature 2019, 567, 479–485. [Google Scholar] [CrossRef] [PubMed]
- Tarabichi, M.; Salcedo, A.; Deshwar, A.G.; Ni Leathlobhair, M.; Wintersinger, J.; Wedge, D.C.; Van Loo, P.; Morris, Q.D.; Boutros, P.C. A practical guide to cancer subclonal reconstruction from DNA sequencing. Nat. Methods 2021, 18, 144–155. [Google Scholar] [CrossRef]
- Andor, N.; Graham, T.A.; Jansen, M.; Xia, L.C.; Aktipis, C.A.; Petritsch, C.; Ji, H.P.; Maley, C.C. Pan-cancer analysis of the extent and consequences of intratumor heterogeneity. Nat. Med. 2016, 22, 105–113. [Google Scholar] [CrossRef]
- Espiritu, S.M.G.; Liu, L.Y.; Rubanova, Y.; Bhandari, V.; Holgersen, E.M.; Szyca, L.M.; Fox, N.S.; Chua, M.L.K.; Yamaguchi, T.N.; Heisler, L.E.; et al. The Evolutionary Landscape of Localized Prostate Cancers Drives Clinical Aggression. Cell 2018, 173, 1003–1013.e1015. [Google Scholar] [CrossRef]
- Mallory, X.F.; Edrisi, M.; Navin, N.; Nakhleh, L. Methods for copy number aberration detection from single-cell DNA-sequencing data. Genome Biol. 2020, 21, 208. [Google Scholar] [CrossRef] [PubMed]
- Minussi, D.C.; Nicholson, M.D.; Ye, H.; Davis, A.; Wang, K.; Baker, T.; Tarabichi, M.; Sei, E.; Du, H.; Rabbani, M.; et al. Breast tumours maintain a reservoir of subclonal diversity during expansion. Nature 2021, 592, 302–308. [Google Scholar] [CrossRef] [PubMed]
- Pantel, K.; Alix-Panabieres, C. Liquid biopsy and minimal residual disease—Latest advances and implications for cure. Nat. Rev. Clin. Oncol. 2019, 16, 409–424. [Google Scholar] [CrossRef] [PubMed]
- Ediriwickrema, A.; Aleshin, A.; Reiter, J.G.; Corces, M.R.; Kohnke, T.; Stafford, M.; Liedtke, M.; Medeiros, B.C.; Majeti, R. Single-cell mutational profiling enhances the clinical evaluation of AML MRD. Blood Adv. 2020, 4, 943–952. [Google Scholar] [CrossRef] [PubMed] [Green Version]
- Guinney, J.; Dienstmann, R.; Wang, X.; de Reynies, A.; Schlicker, A.; Soneson, C.; Marisa, L.; Roepman, P.; Nyamundanda, G.; Angelino, P.; et al. The consensus molecular subtypes of colorectal cancer. Nat. Med. 2015, 21, 1350–1356. [Google Scholar] [CrossRef] [PubMed]
- Verhaak, R.G.; Hoadley, K.A.; Purdom, E.; Wang, V.; Qi, Y.; Wilkerson, M.D.; Miller, C.R.; Ding, L.; Golub, T.; Mesirov, J.P.; et al. Integrated genomic analysis identifies clinically relevant subtypes of glioblastoma characterized by abnormalities in PDGFRA, IDH1, EGFR, and NF1. Cancer Cell 2010, 17, 98–110. [Google Scholar] [CrossRef] [Green Version]
- Weigelt, B.; Mackay, A.; A’Hern, R.; Natrajan, R.; Tan, D.S.; Dowsett, M.; Ashworth, A.; Reis-Filho, J.S. Breast cancer molecular profiling with single sample predictors: A retrospective analysis. Lancet Oncol. 2010, 11, 339–349. [Google Scholar] [CrossRef] [Green Version]
- Gonzalez Castro, L.N.; Tirosh, I.; Suva, M.L. Decoding Cancer Biology One Cell at a Time. Cancer Discov. 2021, 11, 960–970. [Google Scholar] [CrossRef]
- Kim, N.; Kim, H.K.; Lee, K.; Hong, Y.; Cho, J.H.; Choi, J.W.; Lee, J.I.; Suh, Y.L.; Ku, B.M.; Eum, H.H.; et al. Single-cell RNA sequencing demonstrates the molecular and cellular reprogramming of metastatic lung adenocarcinoma. Nat. Commun. 2020, 11, 2285. [Google Scholar] [CrossRef]
- Wu, F.; Fan, J.; He, Y.; Xiong, A.; Yu, J.; Li, Y.; Zhang, Y.; Zhao, W.; Zhou, F.; Li, W.; et al. Single-cell profiling of tumor heterogeneity and the microenvironment in advanced non-small cell lung cancer. Nat. Commun. 2021, 12, 2540. [Google Scholar] [CrossRef]
- Wang, Y.; Waters, J.; Leung, M.L.; Unruh, A.; Roh, W.; Shi, X.; Chen, K.; Scheet, P.; Vattathil, S.; Liang, H.; et al. Clonal evolution in breast cancer revealed by single nucleus genome sequencing. Nature 2014, 512, 155–160. [Google Scholar] [CrossRef] [PubMed] [Green Version]
- Kim, C.; Gao, R.; Sei, E.; Brandt, R.; Hartman, J.; Hatschek, T.; Crosetto, N.; Foukakis, T.; Navin, N.E. Chemoresistance Evolution in Triple-Negative Breast Cancer Delineated by Single-Cell Sequencing. Cell 2018, 173, 879–893.e813. [Google Scholar] [CrossRef] [Green Version]
- Lee, H.O.; Hong, Y.; Etlioglu, H.E.; Cho, Y.B.; Pomella, V.; Van den Bosch, B.; Vanhecke, J.; Verbandt, S.; Hong, H.; Min, J.W.; et al. Lineage-dependent gene expression programs influence the immune landscape of colorectal cancer. Nat. Genet. 2020, 52, 594–603. [Google Scholar] [CrossRef]
- Izar, B.; Tirosh, I.; Stover, E.H.; Wakiro, I.; Cuoco, M.S.; Alter, I.; Rodman, C.; Leeson, R.; Su, M.J.; Shah, P.; et al. A single-cell landscape of high-grade serous ovarian cancer. Nat. Med. 2020, 26, 1271–1279. [Google Scholar] [CrossRef] [PubMed]
- Neftel, C.; Laffy, J.; Filbin, M.G.; Hara, T.; Shore, M.E.; Rahme, G.J.; Richman, A.R.; Silverbush, D.; Shaw, M.L.; Hebert, C.M.; et al. An Integrative Model of Cellular States, Plasticity, and Genetics for Glioblastoma. Cell 2019, 178, 835–849.e821. [Google Scholar] [CrossRef]
- Puram, S.V.; Tirosh, I.; Parikh, A.S.; Patel, A.P.; Yizhak, K.; Gillespie, S.; Rodman, C.; Luo, C.L.; Mroz, E.A.; Emerick, K.S.; et al. Single-Cell Transcriptomic Analysis of Primary and Metastatic Tumor Ecosystems in Head and Neck Cancer. Cell 2017, 171, 1611–1624.e1624. [Google Scholar] [CrossRef] [PubMed] [Green Version]
- Chung, W.; Eum, H.H.; Lee, H.O.; Lee, K.M.; Lee, H.B.; Kim, K.T.; Ryu, H.S.; Kim, S.; Lee, J.E.; Park, Y.H.; et al. Single-cell RNA-seq enables comprehensive tumour and immune cell profiling in primary breast cancer. Nat. Commun. 2017, 8, 15081. [Google Scholar] [CrossRef] [PubMed] [Green Version]
- Li, H.; Courtois, E.T.; Sengupta, D.; Tan, Y.; Chen, K.H.; Goh, J.J.L.; Kong, S.L.; Chua, C.; Hon, L.K.; Tan, W.S.; et al. Reference component analysis of single-cell transcriptomes elucidates cellular heterogeneity in human colorectal tumors. Nat. Genet. 2017, 49, 708–718. [Google Scholar] [CrossRef] [PubMed]
- Lee, H.W.; Chung, W.; Lee, H.O.; Jeong, D.E.; Jo, A.; Lim, J.E.; Hong, J.H.; Nam, D.H.; Jeong, B.C.; Park, S.H.; et al. Single-cell RNA sequencing reveals the tumor microenvironment and facilitates strategic choices to circumvent treatment failure in a chemorefractory bladder cancer patient. Genome Med. 2020, 12, 47. [Google Scholar] [CrossRef]
- Yarchoan, M.; Albacker, L.A.; Hopkins, A.C.; Montesion, M.; Murugesan, K.; Vithayathil, T.T.; Zaidi, N.; Azad, N.S.; Laheru, D.A.; Frampton, G.M.; et al. PD-L1 expression and tumor mutational burden are independent biomarkers in most cancers. JCI Insight 2019, 4. [Google Scholar] [CrossRef] [Green Version]
- Darvin, P.; Toor, S.M.; Sasidharan Nair, V.; Elkord, E. Immune checkpoint inhibitors: Recent progress and potential biomarkers. Exp. Mol. Med. 2018, 50, 1–11. [Google Scholar] [CrossRef] [PubMed] [Green Version]
- Daud, A.I.; Loo, K.; Pauli, M.L.; Sanchez-Rodriguez, R.; Sandoval, P.M.; Taravati, K.; Tsai, K.; Nosrati, A.; Nardo, L.; Alvarado, M.D.; et al. Tumor immune profiling predicts response to anti-PD-1 therapy in human melanoma. J. Clin. Investig. 2016, 126, 3447–3452. [Google Scholar] [CrossRef] [PubMed]
- Huang, A.C.; Postow, M.A.; Orlowski, R.J.; Mick, R.; Bengsch, B.; Manne, S.; Xu, W.; Harmon, S.; Giles, J.R.; Wenz, B.; et al. T-cell invigoration to tumour burden ratio associated with anti-PD-1 response. Nature 2017, 545, 60–65. [Google Scholar] [CrossRef] [PubMed] [Green Version]
- Kamphorst, A.O.; Pillai, R.N.; Yang, S.; Nasti, T.H.; Akondy, R.S.; Wieland, A.; Sica, G.L.; Yu, K.; Koenig, L.; Patel, N.T.; et al. Proliferation of PD-1+ CD8 T cells in peripheral blood after PD-1-targeted therapy in lung cancer patients. Proc. Natl. Acad. Sci. USA 2017, 114, 4993–4998. [Google Scholar] [CrossRef] [PubMed] [Green Version]
- Wei, S.C.; Levine, J.H.; Cogdill, A.P.; Zhao, Y.; Anang, N.A.S.; Andrews, M.C.; Sharma, P.; Wang, J.; Wargo, J.A.; Pe’er, D.; et al. Distinct Cellular Mechanisms Underlie Anti-CTLA-4 and Anti-PD-1 Checkpoint Blockade. Cell 2017, 170, 1120–1133.e1117. [Google Scholar] [CrossRef] [PubMed] [Green Version]
- Thommen, D.S.; Koelzer, V.H.; Herzig, P.; Roller, A.; Trefny, M.; Dimeloe, S.; Kiialainen, A.; Hanhart, J.; Schill, C.; Hess, C.; et al. A transcriptionally and functionally distinct PD-1(+) CD8(+) T cell pool with predictive potential in non-small-cell lung cancer treated with PD-1 blockade. Nat. Med. 2018, 24, 994–1004. [Google Scholar] [CrossRef] [Green Version]
- Sade-Feldman, M.; Yizhak, K.; Bjorgaard, S.L.; Ray, J.P.; de Boer, C.G.; Jenkins, R.W.; Lieb, D.J.; Chen, J.H.; Frederick, D.T.; Barzily-Rokni, M.; et al. Defining T Cell States Associated with Response to Checkpoint Immunotherapy in Melanoma. Cell 2019, 176, 404. [Google Scholar] [CrossRef] [PubMed] [Green Version]
- Gide, T.N.; Quek, C.; Menzies, A.M.; Tasker, A.T.; Shang, P.; Holst, J.; Madore, J.; Lim, S.Y.; Velickovic, R.; Wongchenko, M.; et al. Distinct Immune Cell Populations Define Response to Anti-PD-1 Monotherapy and Anti-PD-1/Anti-CTLA-4 Combined Therapy. Cancer Cell 2019, 35, 238–255.e236. [Google Scholar] [CrossRef] [Green Version]
- Huang, A.C.; Orlowski, R.J.; Xu, X.; Mick, R.; George, S.M.; Yan, P.K.; Manne, S.; Kraya, A.A.; Wubbenhorst, B.; Dorfman, L.; et al. A single dose of neoadjuvant PD-1 blockade predicts clinical outcomes in resectable melanoma. Nat. Med. 2019, 25, 454–461. [Google Scholar] [CrossRef]
- Litchfield, K.; Reading, J.L.; Puttick, C.; Thakkar, K.; Abbosh, C.; Bentham, R.; Watkins, T.B.K.; Rosenthal, R.; Biswas, D.; Rowan, A.; et al. Meta-analysis of tumor- and T cell-intrinsic mechanisms of sensitization to checkpoint inhibition. Cell 2021, 184, 596–614.e514. [Google Scholar] [CrossRef]
- Krishna, C.; DiNatale, R.G.; Kuo, F.; Srivastava, R.M.; Vuong, L.; Chowell, D.; Gupta, S.; Vanderbilt, C.; Purohit, T.A.; Liu, M.; et al. Single-cell sequencing links multiregional immune landscapes and tissue-resident T cells in ccRCC to tumor topology and therapy efficacy. Cancer Cell 2021, 39, 662–677.e666. [Google Scholar] [CrossRef] [PubMed]
- Kwon, M.; An, M.; Klempner, S.J.; Lee, H.; Kim, K.M.; Sa, J.K.; Cho, H.J.; Hong, J.Y.; Lee, T.; Min, Y.W.; et al. Determinants of Response and Intrinsic Resistance to PD-1 Blockade in Microsatellite Instability-High Gastric Cancer. Cancer Discov. 2021. [Google Scholar] [CrossRef] [PubMed]
- Sade-Feldman, M.; Yizhak, K.; Bjorgaard, S.L.; Ray, J.P.; de Boer, C.G.; Jenkins, R.W.; Lieb, D.J.; Chen, J.H.; Frederick, D.T.; Barzily-Rokni, M.; et al. Defining T Cell States Associated with Response to Checkpoint Immunotherapy in Melanoma. Cell 2018, 175, 998–1013.e1020. [Google Scholar] [CrossRef] [Green Version]
- Jerby-Arnon, L.; Shah, P.; Cuoco, M.S.; Rodman, C.; Su, M.J.; Melms, J.C.; Leeson, R.; Kanodia, A.; Mei, S.; Lin, J.R.; et al. A Cancer Cell Program Promotes T Cell Exclusion and Resistance to Checkpoint Blockade. Cell 2018, 175, 984–997.e924. [Google Scholar] [CrossRef] [PubMed] [Green Version]
- Satpathy, A.T.; Granja, J.M.; Yost, K.E.; Qi, Y.; Meschi, F.; McDermott, G.P.; Olsen, B.N.; Mumbach, M.R.; Pierce, S.E.; Corces, M.R.; et al. Massively parallel single-cell chromatin landscapes of human immune cell development and intratumoral T cell exhaustion. Nat. Biotechnol. 2019, 37, 925–936. [Google Scholar] [CrossRef]
- Yost, K.E.; Satpathy, A.T.; Wells, D.K.; Qi, Y.; Wang, C.; Kageyama, R.; McNamara, K.L.; Granja, J.M.; Sarin, K.Y.; Brown, R.A.; et al. Clonal replacement of tumor-specific T cells following PD-1 blockade. Nat. Med. 2019, 25, 1251–1259. [Google Scholar] [CrossRef]
- Lee, J.; Hyeon, D.Y.; Hwang, D. Single-cell multiomics: Technologies and data analysis methods. Exp. Mol. Med. 2020, 52, 1428–1442. [Google Scholar] [CrossRef] [PubMed]
- Macaulay, I.C.; Haerty, W.; Kumar, P.; Li, Y.I.; Hu, T.X.; Teng, M.J.; Goolam, M.; Saurat, N.; Coupland, P.; Shirley, L.M.; et al. G&T-seq: Parallel sequencing of single-cell genomes and transcriptomes. Nat. Methods 2015, 12, 519–522. [Google Scholar] [CrossRef] [PubMed]
- Bian, S.; Hou, Y.; Zhou, X.; Li, X.; Yong, J.; Wang, Y.; Wang, W.; Yan, J.; Hu, B.; Guo, H.; et al. Single-cell multiomics sequencing and analyses of human colorectal cancer. Science 2018, 362, 1060–1063. [Google Scholar] [CrossRef] [Green Version]
- Gao, R.; Bai, S.; Henderson, Y.C.; Lin, Y.; Schalck, A.; Yan, Y.; Kumar, T.; Hu, M.; Sei, E.; Davis, A.; et al. Delineating copy number and clonal substructure in human tumors from single-cell transcriptomes. Nat. Biotechnol. 2021, 39, 599–608. [Google Scholar] [CrossRef] [PubMed]
- Serin Harmanci, A.; Harmanci, A.O.; Zhou, X. CaSpER identifies and visualizes CNV events by integrative analysis of single-cell or bulk RNA-sequencing data. Nat. Commun. 2020, 11, 89. [Google Scholar] [CrossRef] [PubMed] [Green Version]
- Fan, J.; Lee, H.O.; Lee, S.; Ryu, D.E.; Lee, S.; Xue, C.; Kim, S.J.; Kim, K.; Barkas, N.; Park, P.J.; et al. Linking transcriptional and genetic tumor heterogeneity through allele analysis of single-cell RNA-seq data. Genome Res. 2018, 28, 1217–1227. [Google Scholar] [CrossRef] [PubMed]
- Couturier, C.P.; Ayyadhury, S.; Le, P.U.; Nadaf, J.; Monlong, J.; Riva, G.; Allache, R.; Baig, S.; Yan, X.; Bourgey, M.; et al. Single-cell RNA-seq reveals that glioblastoma recapitulates a normal neurodevelopmental hierarchy. Nat. Commun. 2020, 11, 3406. [Google Scholar] [CrossRef]
- Muller, S.; Cho, A.; Liu, S.J.; Lim, D.A.; Diaz, A. CONICS integrates scRNA-seq with DNA sequencing to map gene expression to tumor sub-clones. Bioinformatics 2018, 34, 3217–3219. [Google Scholar] [CrossRef] [Green Version]
- Nam, A.S.; Kim, K.T.; Chaligne, R.; Izzo, F.; Ang, C.; Taylor, J.; Myers, R.M.; Abu-Zeinah, G.; Brand, R.; Omans, N.D.; et al. Somatic mutations and cell identity linked by Genotyping of Transcriptomes. Nature 2019, 571, 355–360. [Google Scholar] [CrossRef] [PubMed]
- Vu, T.N.; Nguyen, H.N.; Calza, S.; Kalari, K.R.; Wang, L.; Pawitan, Y. Cell-level somatic mutation detection from single-cell RNA sequencing. Bioinformatics 2019, 35, 4679–4687. [Google Scholar] [CrossRef]
- Zhou, Z.; Xu, B.; Minn, A.; Zhang, N.R. DENDRO: Genetic heterogeneity profiling and subclone detection by single-cell RNA sequencing. Genome Biol. 2020, 21, 10. [Google Scholar] [CrossRef]
- Peterson, V.M.; Zhang, K.X.; Kumar, N.; Wong, J.; Li, L.; Wilson, D.C.; Moore, R.; McClanahan, T.K.; Sadekova, S.; Klappenbach, J.A. Multiplexed quantification of proteins and transcripts in single cells. Nat. Biotechnol. 2017, 35, 936–939. [Google Scholar] [CrossRef] [PubMed]
- Stoeckius, M.; Hafemeister, C.; Stephenson, W.; Houck-Loomis, B.; Chattopadhyay, P.K.; Swerdlow, H.; Satija, R.; Smibert, P. Simultaneous epitope and transcriptome measurement in single cells. Nat. Methods 2017, 14, 865–868. [Google Scholar] [CrossRef] [PubMed] [Green Version]
- Hao, Y.; Hao, S.; Andersen-Nissen, E.; Mauck, W.M., 3rd; Zheng, S.; Butler, A.; Lee, M.J.; Wilk, A.J.; Darby, C.; Zager, M.; et al. Integrated analysis of multimodal single-cell data. Cell 2021, 184, 3573–3587.e3529. [Google Scholar] [CrossRef] [PubMed]
- Mimitou, E.P.; Lareau, C.A.; Chen, K.Y.; Zorzetto-Fernandes, A.L.; Hao, Y.; Takeshima, Y.; Luo, W.; Huang, T.S.; Yeung, B.Z.; Papalexi, E.; et al. Scalable, multimodal profiling of chromatin accessibility, gene expression and protein levels in single cells. Nat. Biotechnol. 2021. [Google Scholar] [CrossRef] [PubMed]
- Dixit, A.; Parnas, O.; Li, B.; Chen, J.; Fulco, C.P.; Jerby-Arnon, L.; Marjanovic, N.D.; Dionne, D.; Burks, T.; Raychowdhury, R.; et al. Perturb-Seq: Dissecting Molecular Circuits with Scalable Single-Cell RNA Profiling of Pooled Genetic Screens. Cell 2016, 167, 1853–1866.e1817. [Google Scholar] [CrossRef] [PubMed] [Green Version]
- Papalexi, E.; Mimitou, E.P.; Butler, A.W.; Foster, S.; Bracken, B.; Mauck, W.M., 3rd; Wessels, H.H.; Hao, Y.; Yeung, B.Z.; Smibert, P.; et al. Characterizing the molecular regulation of inhibitory immune checkpoints with multimodal single-cell screens. Nat. Genet. 2021, 53, 322–331. [Google Scholar] [CrossRef] [PubMed]
- Nagle, M.P.; Tam, G.S.; Maltz, E.; Hemminger, Z.; Wollman, R. Bridging scales: From cell biology to physiology using in situ single-cell technologies. Cell Syst. 2021, 12, 388–400. [Google Scholar] [CrossRef] [PubMed]
- Rozenblatt-Rosen, O.; Shin, J.W.; Rood, J.E.; Hupalowska, A.; Human Cell Atlas Standards and Technology Working Group; Regev, A.; Heyn, H. Building a high-quality Human Cell Atlas. Nat. Biotechnol. 2021, 39, 149–153. [Google Scholar] [CrossRef] [PubMed]
- Savas, P.; Virassamy, B.; Ye, C.; Salim, A.; Mintoff, C.P.; Caramia, F.; Salgado, R.; Byrne, D.J.; Teo, Z.L.; Dushyanthen, S.; et al. Single-cell profiling of breast cancer T cells reveals a tissue-resident memory subset associated with improved prognosis. Nat. Med. 2018, 24, 986–993. [Google Scholar] [CrossRef] [PubMed]
- Chen, Y.P.; Yin, J.H.; Li, W.F.; Li, H.J.; Chen, D.P.; Zhang, C.J.; Lv, J.W.; Wang, Y.Q.; Li, X.M.; Li, J.Y.; et al. Single-cell transcriptomics reveals regulators underlying immune cell diversity and immune subtypes associated with prognosis in nasopharyngeal carcinoma. Cell Res. 2020, 30, 1024–1042. [Google Scholar] [CrossRef]
- Eum, H.H.; Kwon, M.; Ryu, D.; Jo, A.; Chung, W.; Kim, N.; Hong, Y.; Son, D.S.; Kim, S.T.; Lee, J.; et al. Tumor-promoting macrophages prevail in malignant ascites of advanced gastric cancer. Exp. Mol. Med. 2020, 52, 1976–1988. [Google Scholar] [CrossRef] [PubMed]
- Newman, A.M.; Steen, C.B.; Liu, C.L.; Gentles, A.J.; Chaudhuri, A.A.; Scherer, F.; Khodadoust, M.S.; Esfahani, M.S.; Luca, B.A.; Steiner, D.; et al. Determining cell type abundance and expression from bulk tissues with digital cytometry. Nat. Biotechnol. 2019, 37, 773–782. [Google Scholar] [CrossRef] [PubMed]
- Dong, R.; Yang, R.; Zhan, Y.; Lai, H.D.; Ye, C.J.; Yao, X.Y.; Luo, W.Q.; Cheng, X.M.; Miao, J.J.; Wang, J.F.; et al. Single-Cell Characterization of Malignant Phenotypes and Developmental Trajectories of Adrenal Neuroblastoma. Cancer Cell 2020, 38, 716–733.e716. [Google Scholar] [CrossRef]
- Chen, Z.; Zhou, L.; Liu, L.; Hou, Y.; Xiong, M.; Yang, Y.; Hu, J.; Chen, K. Single-cell RNA sequencing highlights the role of inflammatory cancer-associated fibroblasts in bladder urothelial carcinoma. Nat. Commun. 2020, 11, 5077. [Google Scholar] [CrossRef] [PubMed]
- Qi, Z.; Liu, Y.; Mints, M.; Mullins, R.; Sample, R.; Law, T.; Barrett, T.; Mazul, A.L.; Jackson, R.S.; Kang, S.Y.; et al. Single-Cell Deconvolution of Head and Neck Squamous Cell Carcinoma. Cancers 2021, 13, 1230. [Google Scholar] [CrossRef] [PubMed]
- Bi, K.; He, M.X.; Bakouny, Z.; Kanodia, A.; Napolitano, S.; Wu, J.; Grimaldi, G.; Braun, D.A.; Cuoco, M.S.; Mayorga, A.; et al. Tumor and immune reprogramming during immunotherapy in advanced renal cell carcinoma. Cancer Cell 2021, 39, 649–661.e645. [Google Scholar] [CrossRef] [PubMed]
- Avila Cobos, F.; Alquicira-Hernandez, J.; Powell, J.E.; Mestdagh, P.; De Preter, K. Benchmarking of cell type deconvolution pipelines for transcriptomics data. Nat. Commun. 2020, 11, 5650. [Google Scholar] [CrossRef] [PubMed]
- Li, H.; van der Leun, A.M.; Yofe, I.; Lubling, Y.; Gelbard-Solodkin, D.; van Akkooi, A.C.J.; van den Braber, M.; Rozeman, E.A.; Haanen, J.; Blank, C.U.; et al. Dysfunctional CD8 T Cells Form a Proliferative, Dynamically Regulated Compartment within Human Melanoma. Cell 2020, 181, 747. [Google Scholar] [CrossRef]
- Nirschl, C.J.; Suarez-Farinas, M.; Izar, B.; Prakadan, S.; Dannenfelser, R.; Tirosh, I.; Liu, Y.; Zhu, Q.; Devi, K.S.P.; Carroll, S.L.; et al. IFNgamma-Dependent Tissue-Immune Homeostasis Is Co-opted in the Tumor Microenvironment. Cell 2017, 170, 127–141.e115. [Google Scholar] [CrossRef] [Green Version]
- Li, H.; van der Leun, A.M.; Yofe, I.; Lubling, Y.; Gelbard-Solodkin, D.; van Akkooi, A.C.J.; van den Braber, M.; Rozeman, E.A.; Haanen, J.; Blank, C.U.; et al. Dysfunctional CD8 T Cells Form a Proliferative, Dynamically Regulated Compartment within Human Melanoma. Cell 2019, 176, 775–789.e718. [Google Scholar] [CrossRef]
- Zhang, L.; Yu, X.; Zheng, L.; Zhang, Y.; Li, Y.; Fang, Q.; Gao, R.; Kang, B.; Zhang, Q.; Huang, J.Y.; et al. Lineage tracking reveals dynamic relationships of T cells in colorectal cancer. Nature 2018, 564, 268–272. [Google Scholar] [CrossRef]
- Goldstein, L.D.; Chen, Y.J.; Wu, J.; Chaudhuri, S.; Hsiao, Y.C.; Schneider, K.; Hoi, K.H.; Lin, Z.; Guerrero, S.; Jaiswal, B.S.; et al. Massively parallel single-cell B-cell receptor sequencing enables rapid discovery of diverse antigen-reactive antibodies. Commun. Biol. 2019, 2, 304. [Google Scholar] [CrossRef] [PubMed] [Green Version]
- Li, F.; Luo, M.; Zhou, W.; Li, J.; Jin, X.; Xu, Z.; Juan, L.; Zhang, Z.; Li, Y.; Liu, R.; et al. Single cell RNA and immune repertoire profiling of COVID-19 patients reveal novel neutralizing antibody. Protein Cell 2020. [Google Scholar] [CrossRef] [PubMed]
- Browaeys, R.; Saelens, W.; Saeys, Y. NicheNet: Modeling intercellular communication by linking ligands to target genes. Nat. Methods 2020, 17, 159–162. [Google Scholar] [CrossRef] [PubMed]
- Efremova, M.; Vento-Tormo, M.; Teichmann, S.A.; Vento-Tormo, R. CellPhoneDB: Inferring cell-cell communication from combined expression of multi-subunit ligand-receptor complexes. Nat. Protoc. 2020, 15, 1484–1506. [Google Scholar] [CrossRef] [PubMed]

| Genomic Features Purpose | Representative Test Target Tumor | Test Platform Coverage | Diagnostic Use |
|---|---|---|---|
| Genomic DNA (+RNA in Oncomine Dx): DNA point mutations, gene amplification, translocation, TMB, HRD Molecular targeted therapy Response prediction | FoundationOne CDx Solid tumors | NGS panel 324 genes | FDA approved 16 CDx indications |
| Oncomine Dx NSCLC | NGS panel 23 genes from DNA and fusions in ROS1 and RET from RNA | FDA approved 4 genes CDx in NSCLC | |
| MSK-IMPACT Solid tumors | NGS panel 468 genes | FDA approved No indication | |
| RNA Gene expression Prognostic Predictive | Mammaprint Breast cancer | Microarray 70 genes | FDA approved NCCN guidelines |
| Prosigna (Pam50) Breast cancer | NanoString nCounter 58 genes | FDA approved NCCN guidelines | |
| Oncotype Dx Breast cancer | RT-PCR 21 genes | NCCN guidelines | |
| Breast Cancer Index Breast cancer | RT-PCR 7 genes | NCCN guidelines | |
| EndoPredict test Breast cancer | RT-PCR 12 genes | NCCN guidelines |
| Tumor Type | Technology | Main Findings | References |
|---|---|---|---|
| NSCLC | scRNA-seq | A cancer cell subtype deviating from the normal differentiation trajectory is associated with poor survival in lung adenocarcinoma. Metastatic lung cancer reveals pro-tumoral and immunosuppressive microenvironment along with expansion of monocyte-derived macrophages and dendritic cells, and exhausted T-cells. | [45] |
| NSCLC | scRNA-seq | Heterogenous epithelial cell types spread along cancer developmental trajectories. Rare cell types such as follicular dendritic cells and T helper 17 cells are identified in the advanced NSCLC. cDC2 displayed Langerin (CD207) is associated with clinical outcomes in lung adenocarcinoma. | [46] |
| Breast cancer | snDNA-seq | Aneuploid rearrangements burst early in tumor evolution. Point mutations evolve gradually to produce extensive clonal diversity. | [47] |
| Breast cancer | scDNA-seq; scRNA-seq | Subclones associated with chemoresistance are pre-existing in the tumor. | [48] |
| Colon cancer | scRNA-seq | The classification according to consensus molecular subtypes reflects both the tumor and its associated microenvironment. | [49] |
| Ovarian cancer | scRNA-seq | Heterogeneous copy number alterations explain intra- and inter-patient variation of malignant cells. Diverse subsets of cancer-associated fibroblasts and macrophages show inter-patient variability. | [50] |
| Glioblastoma | scRNA-seq | Four cellular states of malignant cells are identified in glioblastoma, which are influenced by their associated microenvironment and exhibit plasticity. | [51] |
| Glioblastoma | scRNA-seq | Glioblastoma subtypes which have variable expression in diverse transcriptional programs and prognostic implications are identified. | [1] |
| Head and neck cancer | scRNA-seq | Head and neck squamous cell carcinoma (HNSCC) subtype vary in cell cycle, stress, hypoxia, and epithelial differentiation. A partial epithelial-to-mesenchymal transition (p-EMT), one of HNSCC subtypes, is a predictor of metastasis and progression. | [52] |
| Melanoma | scRNA-seq | Diverse transcriptional heterogeneity across malignant cells within a tumor is related to the cell cycle, spatial context, and a drug-resistance program. Malignant cells with elevated levels of AXL and MITF coexist in melanoma. | [2] |
| Tumor Type | Sample Source | Technology | Cell Subset | Association | References |
|---|---|---|---|---|---|
| Melanoma | TILs | Flow cytometry | PD-1 hi CTLA-4 hi CD8+ T cell | Relative abundance of PD-1hiCTLA-4hi cells within the tumor-infiltrating CD8+ T cell subset correlates with response to checkpoint inhibitors and survival. | [58] |
| Melanoma | PBMCs TILs | Flow cytometry | Tex cell | The invigoration of circulating exhausted-phenotype CD8+ T (Tex) cells in relation to tumor burden correlates with clinical response to PD-1 blockade. | [59] |
| NSCLC | PBMCs | Flow cytometry | PD-1+ CD8+ T cell | PD-1+ CD8+ T cell in peripheral blood correlates with clinical benefit after receiving PD-1-targeted therapies. | [60] |
| Melanoma | TILs | Mass cytometry; RNA-seq | Tex cell; ICOS+ Th1-like CD4 effector cell | Anti-PD-1 induces the expansion of tumor-infiltrating exhausted-like CD8+ T cells (Tex), but anti-CTLA-4 induces the expansion of the ICOS+ Th1-like CD4 effector cells in addition to Tex cells. | [61] |
| NSCLC | TILs | Flow cytometry; RNA-seq | PD-1+ CD8+ T cell | The presence of CD8+ T lymphocyte with high PD-1 expression is strongly predictive for response to PD-1 blockade and better survival. | [62] |
| Melanoma | tumor | scRNA-seq; ATAC-seq | TCF7+ CD8+ T cell | The presence of TCF7+ CD8+ T cells predicts response to checkpoint inhibitors and positive clinical outcome. | [63] |
| Melanoma | tumor | RNA-seq; Multiplex IHC; CyTOF | EOMES+ CD69+ CD45RO+ effector memory T cell | EOMES+CD69+CD45RO+ effector memory T cell phenotype is associated with response to checkpoint inhibitors and longer survival. | [64] |
| Melanoma | TILs PBMCs | Flow cytometry; RNA-seq | Tex cell | The accumulation of exhausted CD8 T (Tex) cells in the tumor was associated with clinical benefit and response to anti-PD-1. | [65] |
| Melanoma; Head&Neck; Breast; Urothelial; Renal; Lung; Colorectal cancer | tumor TILs | RNA-seq; scRNA-seq | CXCL9/CXCL13 CD8+ T cell | Clonal TMB and CXCL9/CXCL10 expression in tumor-infiltrating CD8+ T cells predicts response to checkpoint blockade. | [66] |
| Renal cell carcinoma | tumor lymph node PBMCs | scRNA-seq | CD8A+ tissue-resident T cell | The abundance of CD8A+ tissue-resident T cells is associated with response to immune checkpoint blockade and improved survival. | [67] |
| Gastric cancer | tumor | scRNA-seq | PD-1+ CD8+ T cell | The abundance of PD-1+ CD8+ T cells correlate with response and longer survival to PD-1 blockade. | [68] |
| Genetic Feature | Method | Tool Name | References |
|---|---|---|---|
| CNA | chromosomal gene expression pattern | inferCNV | https://github.com/broadinstitute/inferCNV, accessed on 15 July 2021 |
| CopyKAT | [76] | ||
| CaSpER | [77] | ||
| HoneyBADGER | [78] | ||
| scCNAutils | [79] | ||
| CONICS | [80] | ||
| Mutation | targeted genotyping of cDNA | GoT | [81] |
| statistical method | SCMut | [82] | |
| DENDRO | [83] |
| Tumor Type | Deconvolution Approaches | Main Findings | References |
|---|---|---|---|
| Signature gene sets | |||
| Triple negative breast cancer | Inference of tissue-resident memory T (Trm) gene signature expression level | Association with improved patient survival rate in early-stage TNBC | [92] |
| Melanoma | Inference of T cell infiltration levels and malignant genes correlated with T cell infiltration | Genes associated with T cell exclusion program | [70] |
| Nasopharyngeal carcinoma | Correlations of 17 immune subtype signatures with clinicopathological features | Immune subsets significantly associated with better survival outcomes | [93] |
| Gastric cancer | Inference of M2-like TAM level | Improved prediction of poor survival by high M2 signature | [94] |
| Cellular deconvolution | |||
| Melanoma | (CIBERSORTx) Deconvolution into major cell types | (1) Cellular signatures within malignant cells and CAFs according to BRAF or NRAS mutation status (2) CD8 T cell signatures associated with anti-PD1 or anti-CTLA4 therapy response | [95] |
| Adrenal Neuroblastoma | (MuSiC) Deconvolution into developing cell populations | (1) Three tumor groups; Undifferentiated chromaffin cell (UCHC)-like, Differentiated chromaffin cell (DCHC)-like, and EMT NCC-like (2) EMT NCC-like tumors had the worst survival rate, while DCHC-like tumors had the better survival rate | [96] |
| Bladder cancer | (CIBERSORTx) Deconvolution into fine subsets of cell types | Accumulation of a CAF subtype associated with poor overall survival | [97] |
| Head and Neck Squamous Cell Carcinoma | (CIBERSORTx & MuSiC) Deconvolution into T cell subpopulations | High proportions of regulatory T cells as the major contributor of improved survival rate | [98] |
| Renal cell carcinoma | (CIBERSORTx) Infererence of CXCL10-Hi TAM and CD8+ T cell fraction wthin on-ICB T cells | Positive correlation between CXCL10-Hi TAM fraction and the amount of interferon gamma expressed by CD8 | [99] |
Publisher’s Note: MDPI stays neutral with regard to jurisdictional claims in published maps and institutional affiliations. |
© 2021 by the authors. Licensee MDPI, Basel, Switzerland. This article is an open access article distributed under the terms and conditions of the Creative Commons Attribution (CC BY) license (https://creativecommons.org/licenses/by/4.0/).
Share and Cite
Kim, N.; Eum, H.H.; Lee, H.-O. Clinical Perspectives of Single-Cell RNA Sequencing. Biomolecules 2021, 11, 1161. https://doi.org/10.3390/biom11081161
Kim N, Eum HH, Lee H-O. Clinical Perspectives of Single-Cell RNA Sequencing. Biomolecules. 2021; 11(8):1161. https://doi.org/10.3390/biom11081161
Chicago/Turabian StyleKim, Nayoung, Hye Hyeon Eum, and Hae-Ock Lee. 2021. "Clinical Perspectives of Single-Cell RNA Sequencing" Biomolecules 11, no. 8: 1161. https://doi.org/10.3390/biom11081161
APA StyleKim, N., Eum, H. H., & Lee, H.-O. (2021). Clinical Perspectives of Single-Cell RNA Sequencing. Biomolecules, 11(8), 1161. https://doi.org/10.3390/biom11081161