Article

Chemical Fractionation Joint to In-Mixture NMR Analysis for Avoiding the Hepatotoxicity of Teucrium chamaedrys L. subsp. chamaedrys

by
Simona Piccolella
,
Monica Scognamiglio
,
Brigida D’Abrosca
,
Assunta Esposito
,
Antonio Fiorentino
* and
Severina Pacifico
*
Dipartimento di Scienze e Tecnologie Ambientali, Biologiche e Farmaceutiche, Università degli Studi della Campania “Luigi Vanvitelli”, Via Vivaldi 43, 81100 Caserta, Italy
*
Authors to whom correspondence should be addressed.
These authors contributed equally to this paper.
Biomolecules 2021, 11(5), 690; https://doi.org/10.3390/biom11050690
Submission received: 20 April 2021 / Revised: 30 April 2021 / Accepted: 2 May 2021 / Published: 5 May 2021

Abstract

:
Dietary supplements based on Teucrium chamaedrys L. subsp. chamaedrys aerial parts were banned, due to the hepatotoxicity of furan-containing neo-clerodane constituents. Indeed, the plant leaf content in phenolic compounds could be further exploited for their antioxidant capability. Accordingly, bio-guided fractionation strategies have been applied, obtaining seven partially purified extracts. These latter were chemically investigated through 1D and 2D NMR techniques and tested for their antiradical, reducing and cytotoxic capability. Data acquired highlighted that, through a simple phytochemical approach, a progressive neo-clerodane depletion occurred, while maximizing phenylethanoid glycosides in alcoholic fractions. Thus, although the plant cannot be used as a botanical remedy as such, it is suggested as a source of healthy compounds, pure or in mixture, to be handled in pharmaceutical, nutraceutical and/or cosmeceutical sectors.

1. Introduction

Botanical medicine continues to grow as plant-based preparations are commonly perceived as natural sources of chemicals with healthy benefits. Indeed, the specious awareness “natural is safe” might hide adverse effects, related to chemical compounds potentially harmful to human health [1,2]. This is mainly true for furan-containing neo-clerodane diterpenoids [3], such as teucrin A and teuchamaedryn A, which are causes of liver failure, so much so that Teucrium spp., especially Teucrium chamaedrys, are prohibited to be used [4].
Teucrium chamaedrys, also known as wall germander, is an evergreen small shrub, native to the Mediterranean region, whose employment for curative purposes is traced back to ancient times. The leaves are reported to exhibit antioxidant, anti-inflammatory, antirheumatic, carminative, diaphoretic, astringent, digestive, stimulant, laxative, aromatic, diuretic and tonic activity [5,6]. Based on its properties, wall germander was used as spice, for imparting the aromatic flavor to base wine for vermouth or other liqueurs production [7], and to prepare, starting from the mid-1980s of the last century, herbal tea bags, or germander-containing capsules for weight loss [8]. Unfortunately, more than fifty hepatotoxicity reports (mainly hepatitis and liver cirrhosis), including a sudden death case, were recorded following wall germander-based supplementation [9,10]. For this reason, French Pharmacovigilance Authorities in 1992 forced its withdrawal from the market, and some years later the Italian Ministry of Health considered wall germander flowering tops as poison, as well as all the preparations obtained from it (powder, extract, tincture, etc.).
The heterocyclic aromatic moiety of the furan-containing neo-clerodane diterpenoids undergoes oxidation by CYP3A4 to achieve reactive epoxides [11]. These latter were observed to cause cell disruption in animal models, through covalent binding to cell proteins, hepatic glutathione depletion, mitochondrial permeability transitions, and cytoskeleton membrane injury. Cell culture studies highlighted the hepatocyte apoptosis-inducing effect of the reactive epoxide. Furthermore, epoxide hydrolase on plasma membranes was found as a target of antibodies in the sera of patients who drank germander teas for 2–3 months [12].
However, the use of alcoholic extracts of the plant is still allowed as minor constituent in stomachic liqueur preparations for their flavoring and bittering features, also based on the opinion of the Scientific Committee on Food, establishing that teucrin A content in alcoholic beverages is almost 6 times lower than that present in the hepatotoxic germander capsules [13].
Indeed, other secondary metabolites, mainly iridoids and phenylethanoid glycosides [14,15], are also abundant in T. chamaedrys aerial parts, and their recovery needs to be pursued, while avoiding neo-clerodane toxicity. Hepatoprotective, antioxidant activity, anti-inflammatory and α-glucosidase inhibitory activities are ascribed to phenylethanoid glycosides, which also appeared to positively prevent dopaminergic neuronal damage, β-amyloid induced neurotoxicity, and to slow down the secretion of proinflammatory cytokines in autoimmune hepatitis animal models [16]. Thus, in order to enhance the exploitation of antioxidant compounds from wall germander, a fractionation strategy was suggested in a bio-guided scenario. Antiradical and reducing tests were applied to the alcoholic extract, as well as to the fractions derived, which were metabolically profiled by 1D and 2D NMR techniques. Cytotoxic effects were also assessed towards human hepatoblastoma HepG2 cells. Furthermore, as anticancer effects of Teucrium species were observed in lung carcinoma COR-L23, non-small-cell lung cancer H322 and A549 [17,18], and against breast adenocarcinoma MDA-MB-361 cells [19], the cytotoxicity evaluation of the constituted fractions was carried out on two other cancer cells, including A549 cells and, according to ethnobotanical use of Teucrium chamaedrys L. for the treatment of uterus infections [20], human cervix adenocarcinoma HeLa cells.

2. Materials and Methods

2.1. Materials

All of the solvents and reagents used for assessing antioxidant screening were purchased from Sigma-Aldrich Chemie (Buchs, Switzerland) except ABTS, which was bought from Roche Diagnostics (Roche Diagnostics, Mannheim, Germany). Cell culture medium and reagents for cytotoxicity testing were purchased from Invitrogen (Paisley, UK); MTT [3-(4,5-dimethyl-2-thiazolyl)-2,5-diphenyl-2H-tetrazolium bromide] was bought from Sigma-Aldrich Chemie. Deuterated solvents and internal standard for NMR-based metabolic profiling analyses were purchased from Sigma-Aldrich Chemie.
Leaves belonging to the species T. chamaedrys L. subsp. chamaedrys, a small eurimediterranean shrub characteristic of the coastal macchia vegetation [21], were collected at the “Castel Volturno” Nature Reserve (Caserta, Italy). Voucher specimens (CE0037) have been deposited at the Herbarium of the Department of Environmental, Biological and Pharmaceutical Sciences and Technologies, University of Campania “Luigi Vanvitelli”.

2.2. Extraction and Fractionation Procedures

Leaves were dried in a hot-air convection oven at 45 °C for 5 days and then extracted by ultrasound-assisted maceration (UAM) (Branson UltrasonicsTM, Danbury, CT, USA) for 2 h, using MeOH as extracting solvent. The obtained crude extract (6.0 g, TchM1), solubilized in water, underwent liquid–liquid extraction using ethyl acetate as extracting solvent. Thus, an aqueous (TchW1) and an organic fraction (TchE1) were obtained. The first one (5.0 g) was chromatographed using XAD-4 resin and H2O and MeOH as eluting solvents, yielding fractions TchW2 (2.12 g) and TchM2 (2.43 g). Instead, the organic fraction (TchE1; 926.1 mg) was chromatographed by CC-SiO2, using, as eluents, three solvents with increasing polarity (CHCl3, EtOAc and MeOH), yielding three fractions: TchC1 (333.4 mg), TchE2 (161.0 mg) and TchM3 (191.0 mg). The fractionation scheme is depicted in Figure 1.

2.3. NMR-Based Metabolic Profiling

Water and methanol fractions (40.0 mg each) were dissolved in 1.0 mL of a solvent system made up of K2HPO4 buffer (pH 6.0, 90 mM) in D2O (containing the internal standard) and CD3OD (1:1 v/v). Trimethylsilylpropionic-2,2,3,3-d4 acid sodium salt (TSP-d4, 0.1%, w/v) was used as internal standard. EtOAc fractions (40.0 mg) were dissolved in 1 mL of CD3OD, containing 0.1% of hexamethyldisilane as internal standard. The CHCl3 fraction (40.0 mg) was dissolved in 1 mL of CDCl3, containing 0.1% of hexamethyldisilane as internal standard, and 600 μL of each solution were analyzed by NMR.
NMR spectra were recorded at 25 °C on a Varian Mercury Plus 300 Fourier transform NMR at 300.03 MHz for 1H and at 75.45 MHz for 13C. Spectra were calibrated by setting the TSP-d4 peak at 0.00 ppm. Data acquisition parameters, for the 1H NMR spectrum, were as follows: 0.16 Hz/point, acquisition time (AQ) = 1.3 s, number of scans (NS) = 256, relaxation delay (RD) = 1.5 s, 90 pulse width (PW) = 6.6 μs, receiver gain = 22, number of data points (NP) = 4096, spectral width = 3065 Hz. A presaturation sequence was used to suppress the residual H2O signal. Line broadening of 0.3 Hz and zero-filling to 64 K were applied prior to Fourier transform. FIDs were Fourier-transformed, and the resulting spectra were manually phased and baseline-corrected using an 1H NMR processor (ACDLABS 12.0).
Heteronuclear single-quantum coherence (HSQC), and heteronuclear multiple-bond correlation (HMBC) spectra were recorded. They were performed with a 1.0 s relaxation delay and 3065 Hz spectral width in F2 and 18,116 Hz in F1. Qsine (SSB = 2.0) was used for the HMBC window function. The optimized coupling constants were 1JHC = 140 Hz for HSQC and nJHC = 8 Hz for HMBC. COSY spectra were acquired with a 1.0 s relaxation delay and 2514 Hz spectral width in both dimensions. The window function for COSY spectra was sine-bell (SSB = 0).
Compound identity was confirmed by extensive 2D NMR analysis. When possible, data were compared with spectra of pure compounds, and/or with data available in literature. The confidence level for the identification of each metabolite is indicated by the superscript numbers (1–4) reported in Table 1 after the name of each compound, in accordance with the indication for the minimum reporting standards in metabolomics [22]. Briefly, four confidence levels were considered, as follows: 1. unequivocally identified compound (i.e., complete characterization through 1 and 2D NMR analyses and comparison with the spectrum of pure standards); 2. putatively identified compound (i.e., diagnostic signals or correlations detected in the extracts); 3. putatively identified compound class (i.e., either a portion of the molecule was not identified or some crucial correlations were missing to unequivocally identify the compound); 4. unknown compound (i.e., it was not possible to propose a structure for the detected signals). All of the identified compounds were previously reported from the plant species in object.

2.4. Antioxidant Efficacy Assessment

2.4.1. DPPH Scavenging Capacity

DPPH scavenging capacity was evaluated by dissolving the crude extract/fractions under study in a DPPH methanol solution (9.4 × 10⁻⁵ M), in order to test different final concentration levels (5.0, 10.0, 25.0 and 50.0 μg mL−1). After stirring the reaction mixtures at room temperature for 30 min, 300 µL of each sample were transferred into a 96-well plate, and the absorbance was read at 520 nm using a Wallac Victor3 multilabel plate reader (PerkinElmer Inc., Waltham, MA). The results were expressed as previously reported [23].

2.4.2. ABTS•+ Scavenging Capacity

ABTS•+ assay was performed according to [23]. All the investigated samples (5.0, 10.0, 25.0 and 50.0 μg mL−1, final concentration levels) were dissolved in 1.0 mL of the radical diluted solution. After 10 min, the absorbance was read at 734 nm using a Wallac Victor3 multilabel plate reader. The results were expressed as previously reported [23].

2.4.3. Determination of oxygen radical absorbance capacity (ORAC)

In the ORAC assay, the investigated crude extract/fractions (20 µL; 5.0, 10.0, 25.0 and 50.0 μg mL−1, final concentrations) and fluorescein (120 µL; 70.0 nM, final concentration) solutions were preincubated for 15 min at 37 °C in 75.0 mM phosphate buffer (pH 7.4). Then, 2,20-azobis-(2-amidinopropane)-dihydrochloride (AAPH) solution (60.0 μL, 12.0 mM, final concentration) was rapidly added. In parallel with the samples, a blank (FL + AAPH) and solutions of the standard antioxidant Trolox® (1–8 μM, final concentrations) were properly prepared in PBS. The fluorescence (λex = 485 nm, λem = 525 nm) was recorded every 15 min for 120 min using a Wallac Victor3 (PerkinElmer, Waltham, MA, USA). Antioxidant curves (fluorescence versus time) were first normalized to the curve of the blank by multiplying original data by the factor fluorescence blank, t = 0/fluorescence sample, t = 0. From the normalized curves, the area under the fluorescence decay curve (AUC) was calculated as previously reported [24]. Linear regression equations between net AUC (AUCantioxidant − AUCblank) and antioxidant concentration were calculated for all the samples. Antioxidant activity (ORAC value) was calculated using the Trolox® calibration curve. The ORAC values are expressed as μmol Trolox® equivalents.

2.4.4. Determination of Mo(VI) Reducing Power

In order to carry out the quantitative determination of antioxidant capacity, investigated crude extract/fractions were dissolved in 1.0 mL of a reagent solution containing sulfuric acid (0.6 M), sodium phosphate (28.0 mM) and ammonium molybdate (4.0 mM). The samples were incubated at 95 °C for 90 min, and subsequently cooled down to r.t., and their absorption was measured at 675 nm by a Shimadzu UV-1700 spectrophotometer against the blank. The increase in absorption in reference to the blank estimates the reducing power [25].

2.5. Cell Culture and Cytotoxicity Evaluation

The human hepatoblastoma cell line (HepG2), lung epithelial cell line (A549) and cervical carcinoma cell line (HeLa) were purchased from ICLC (Interlab Cell Line Collection) at Istituto Nazionale per la Ricerca sul Cancro, Genoa (Genoa, Italy). HepG2 and HeLa cell lines were grown in RPMI (Invitrogen, Paisley, UK) containing 10% fetal bovine serum (Invitrogen, Paisley, UK), 50.0 U/mL of penicillin, and 100.0 μg/mL of streptomycin (Invitrogen, Paisley, UK), at 37 °C in a humidified atmosphere containing 5% CO2. The A549 cell line was plated and grown under the same conditions, except that DMEM high glucose (Invitrogen, Paisley, UK) was used instead of RPMI.
The cells were seeded in 96-multiwell plates at a density of 2.0 × 10⁴ cells/well. The day after, cells were treated with T. chamaedrys crude extract and fractions therefrom at three doses (25.0, 50.0, and 100.0 μg mL−1). After 24 and 48 h exposure times, MTT assay was performed, as previously described [26], and vinblastine (0.01 μM) served as a positive control [24].

2.6. Statistical Analysis

Antioxidant activity tests were carried out performing three replicate measurements for three samples (n = 3) of the crude extract and fractions therefrom (in total, 3 × 3 measurements). MTT assay was carried out performing twelve replicate (n = 12) measurements for three samples of the crude extract and fractions therefrom (in total: 12 × 3 measurements). All data were expressed as mean values ± standard deviation (SD). Student’s t-test was applied in order to determine statistical significance (significance level was set at p-value < 0.05). Pearson’s correlation coefficient was used to determine the relation between the variables. Antioxidant capacity and cell viability inhibition results were analyzed by principal component analysis (PCA). Before transforming the original measure variables into new variables (F), the variables were standardized to a mean of 0 and variance of 1. All analyses were performed with the GraphPad Prism 9.1.0 software package.

3. Results

3.1. NMR Metabolic Profile of Teucrium Chamaedrys L. subsp. Chamaedrys Leaf MeOH Extract and Fractions Therefrom

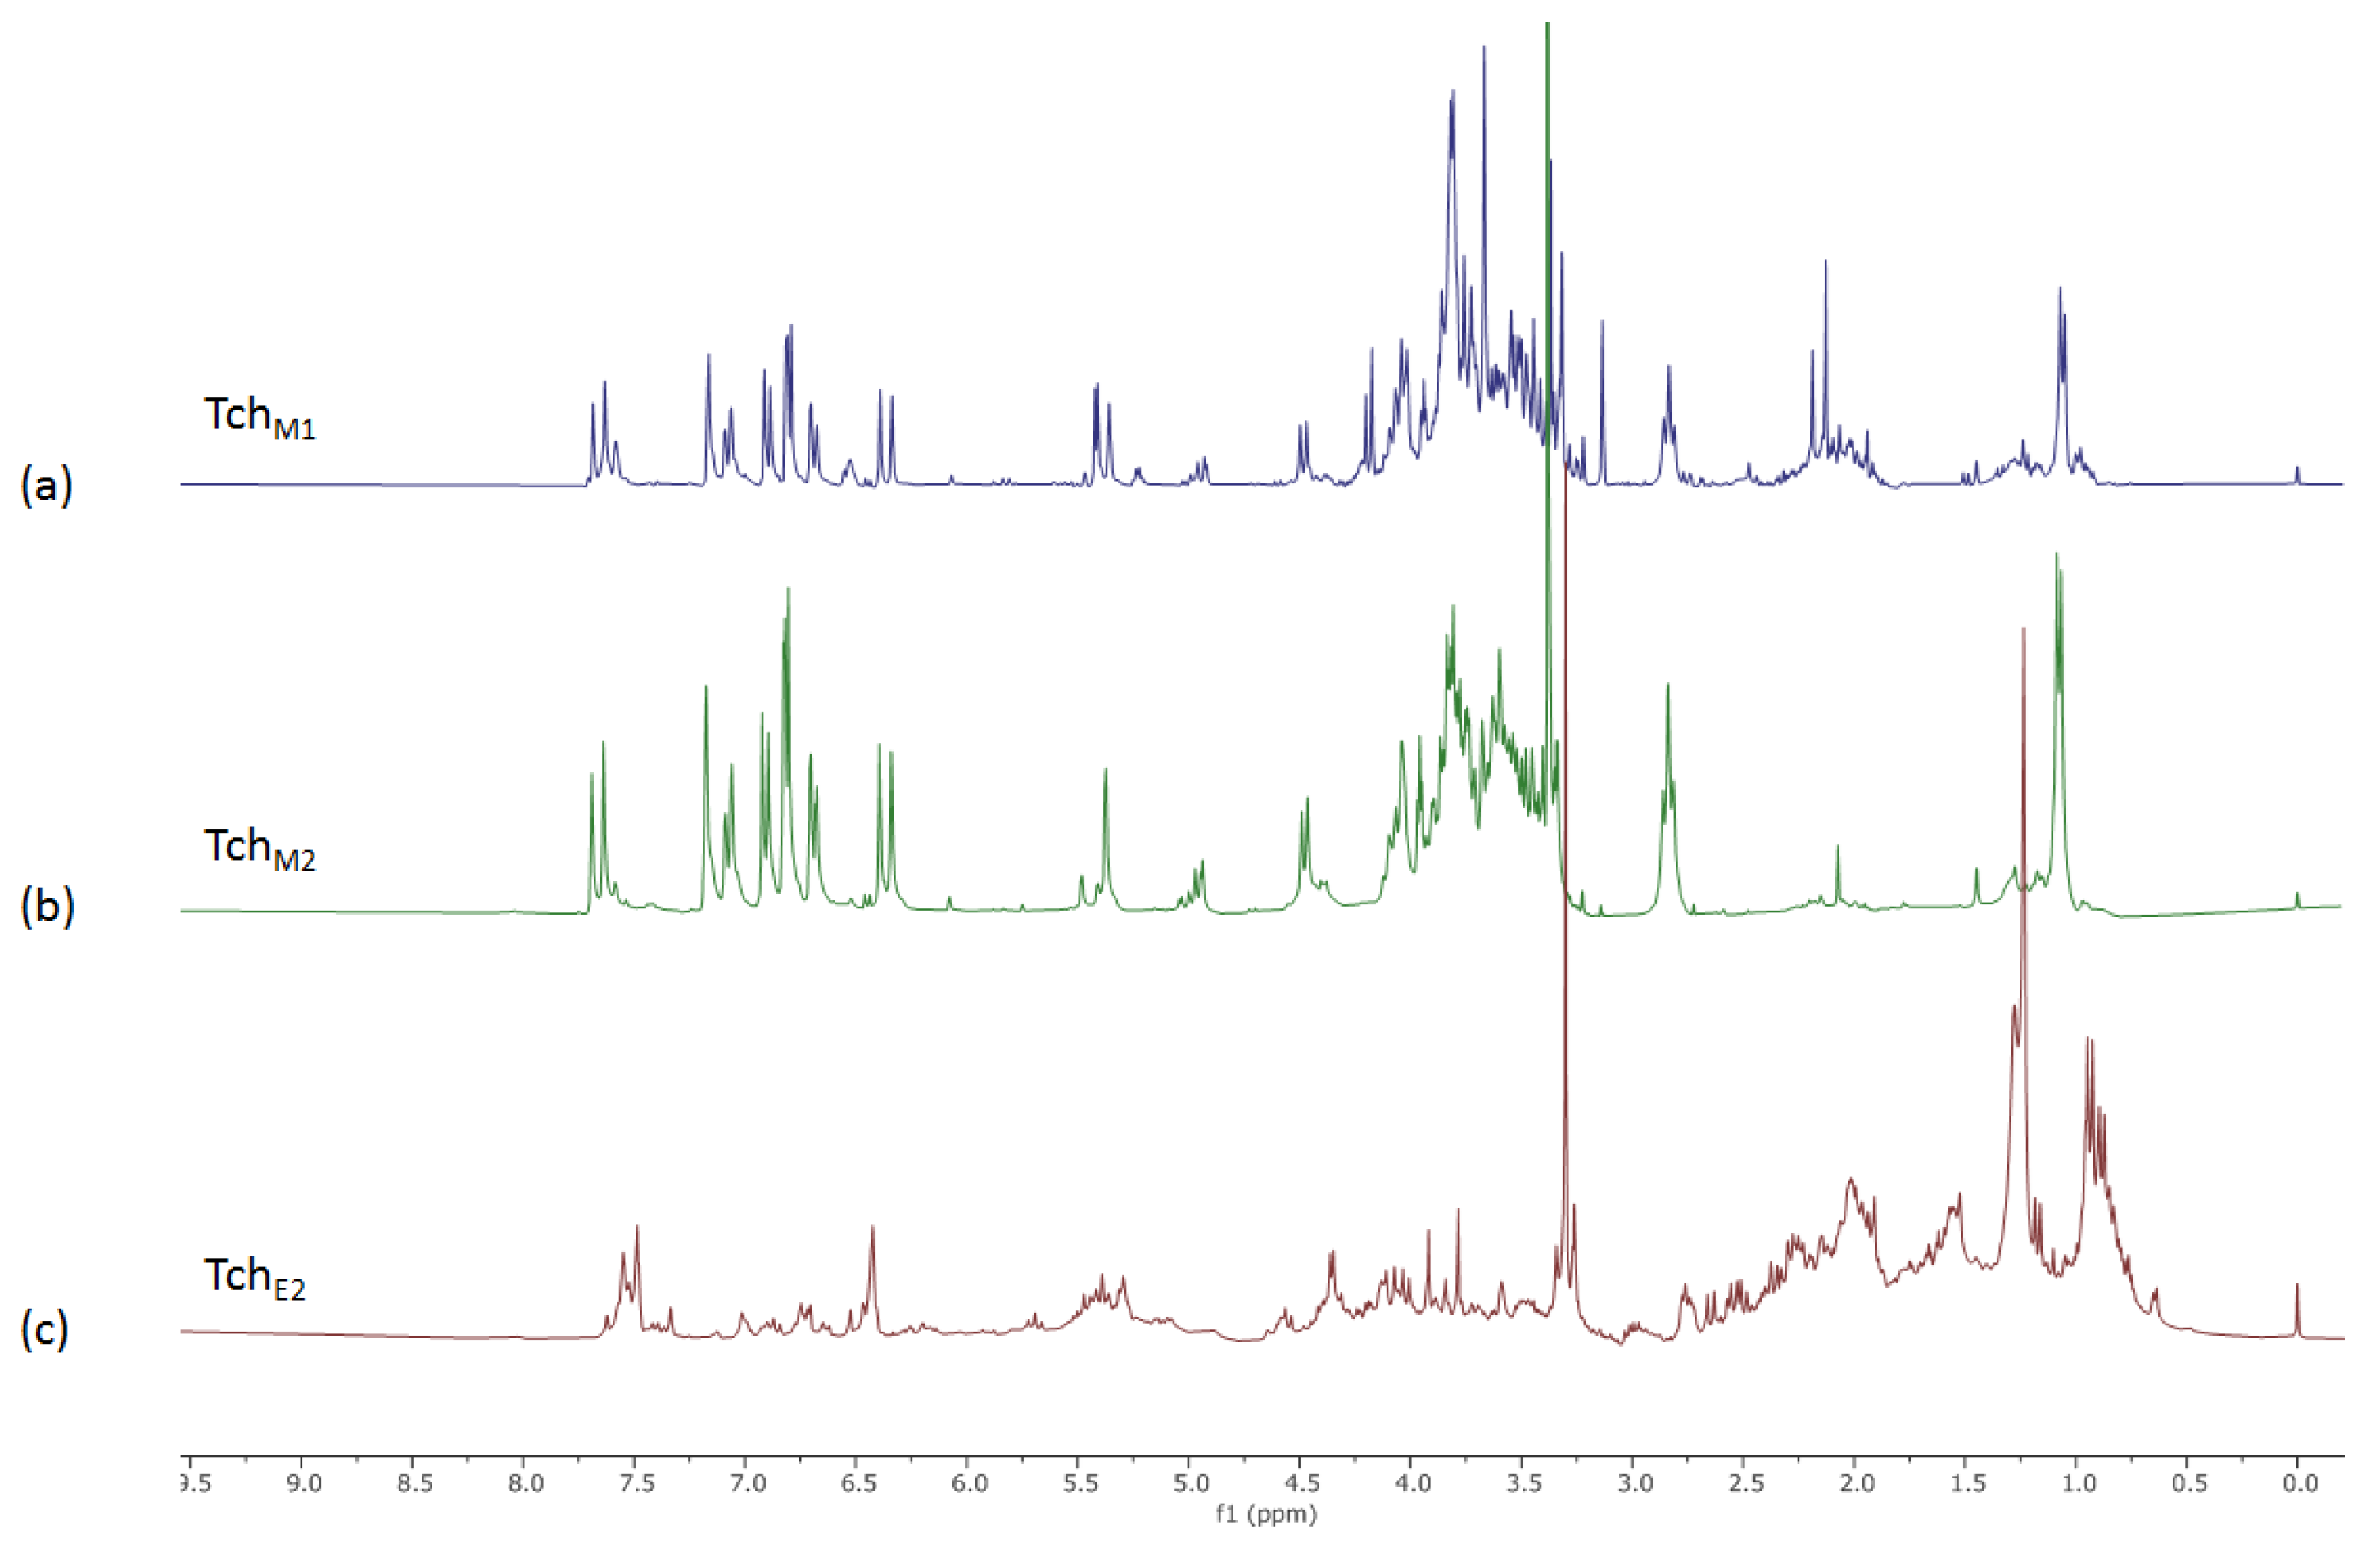
The NMR profile of the TchM1 extract, obtained by UAM in MeOH of T. chamaedrys leaves, is shown in Figure 2.
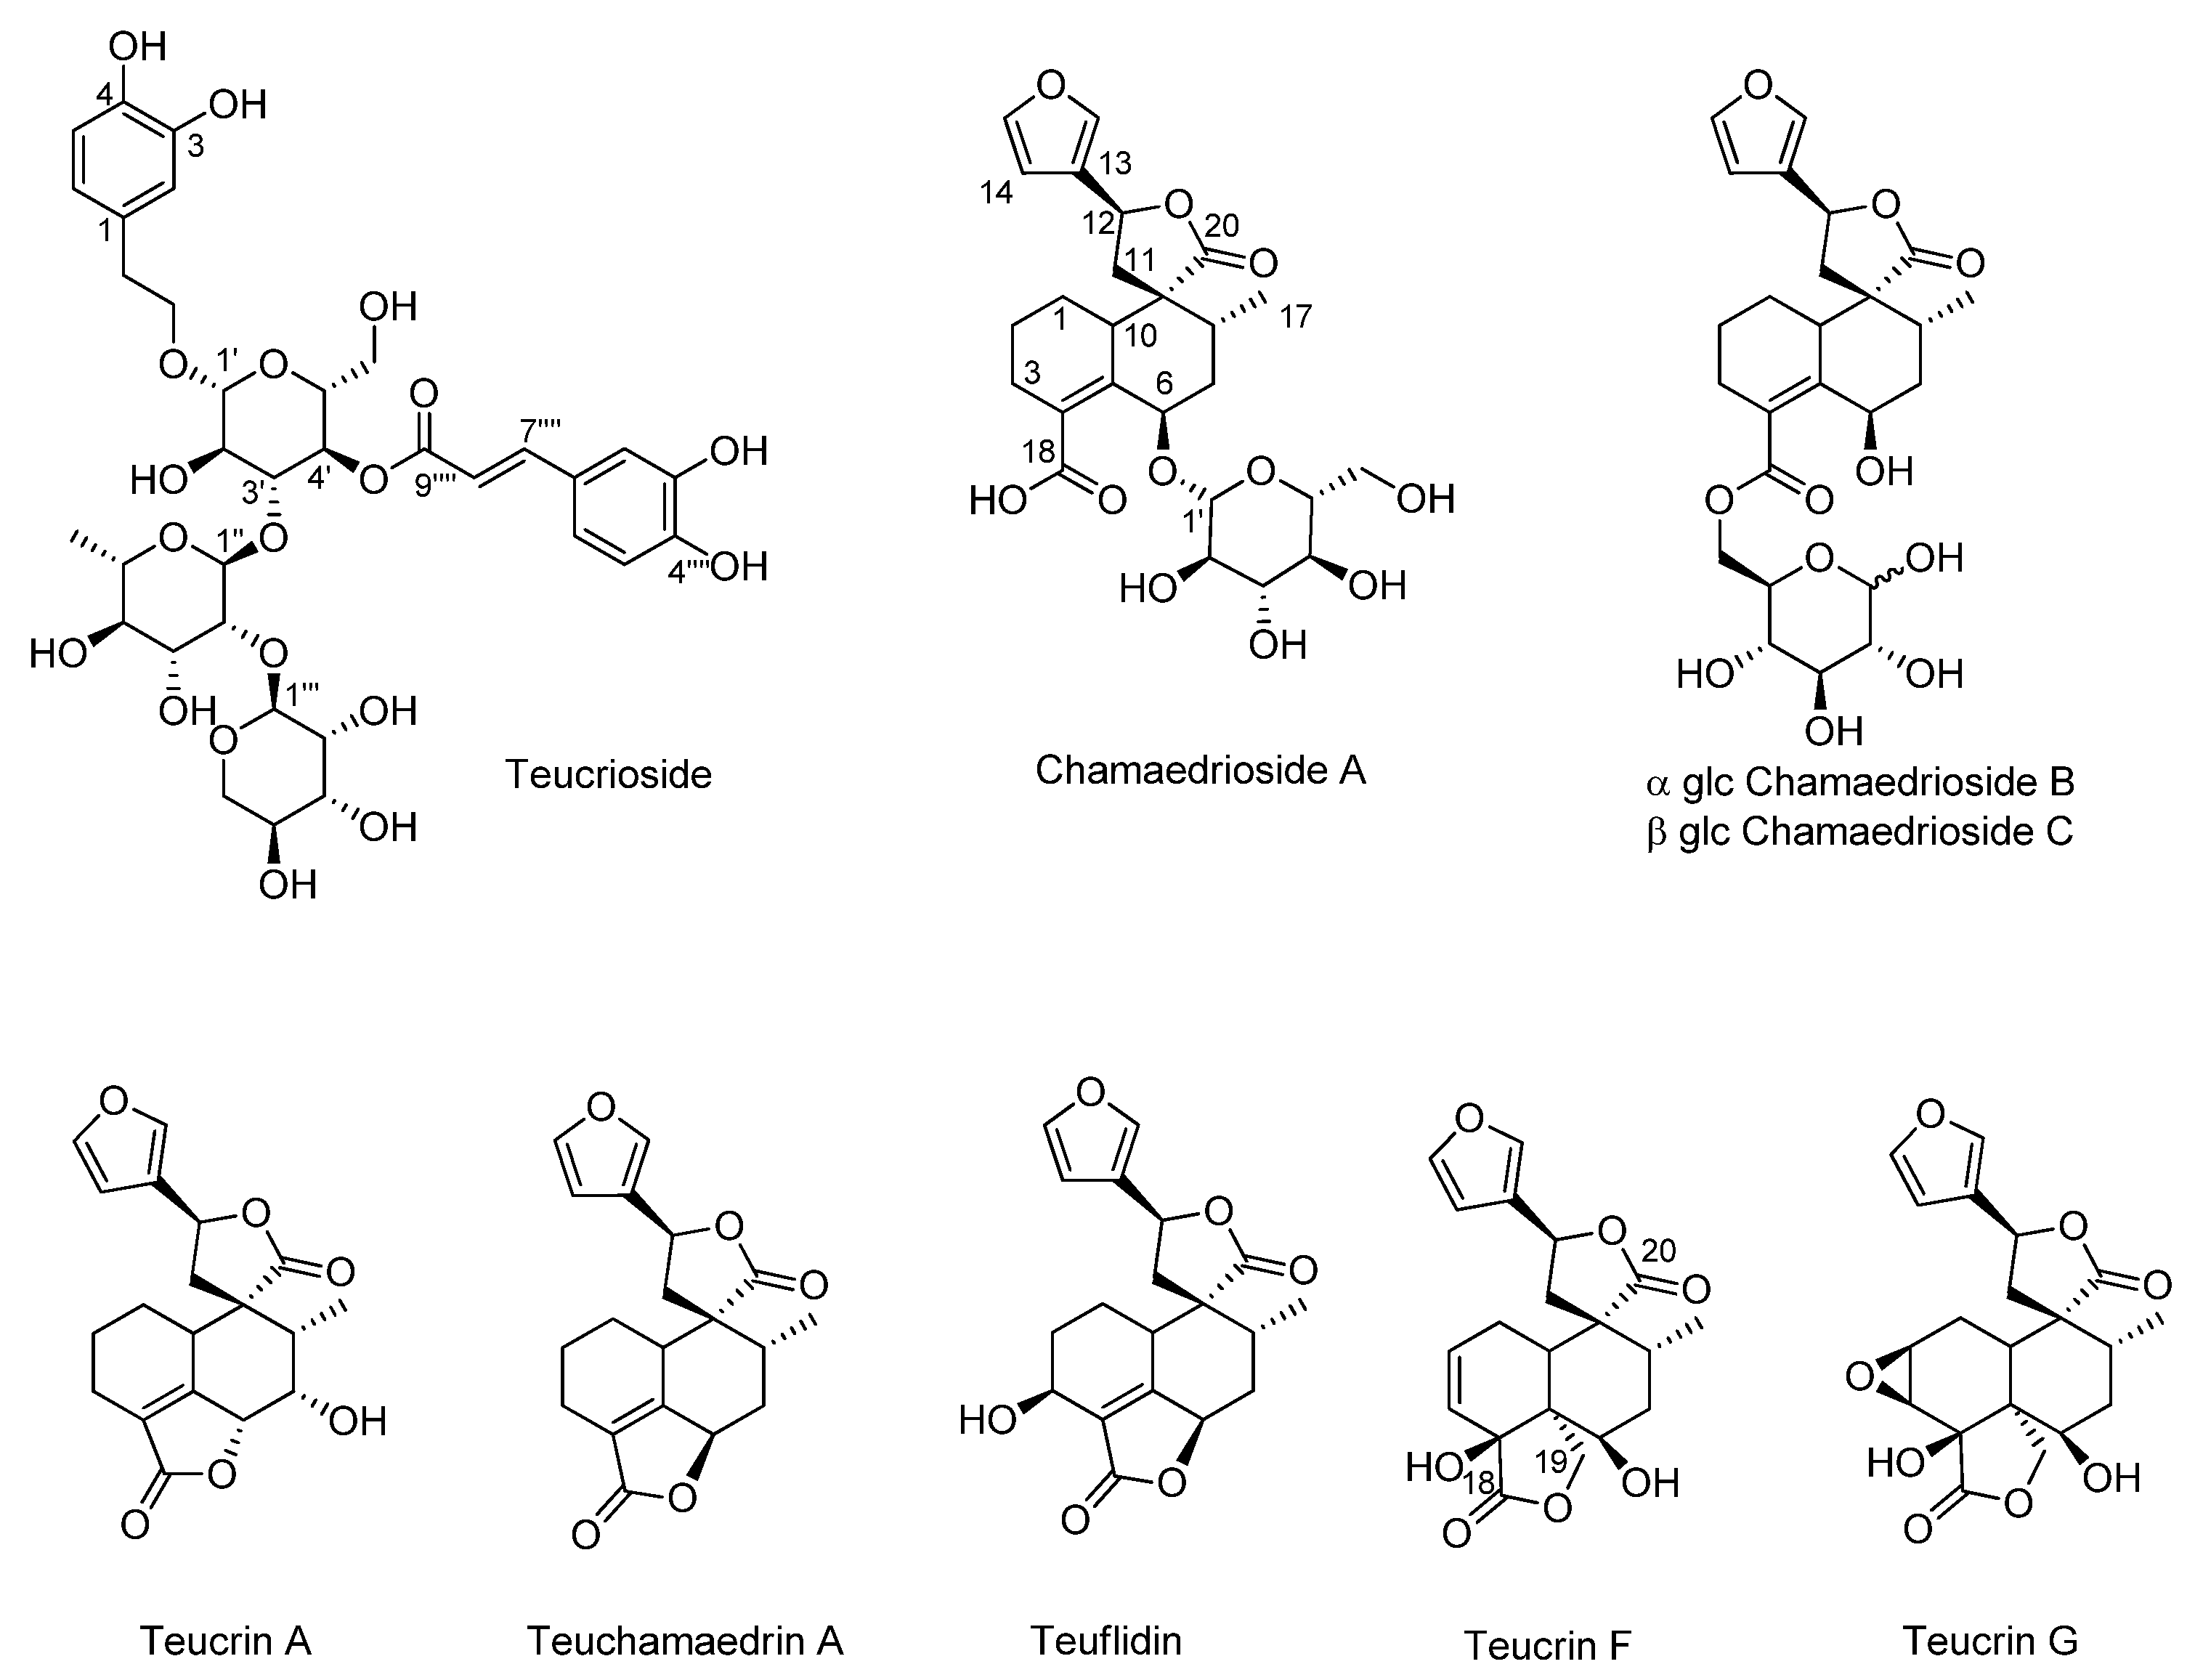
Literature data along with 2D-NMR experiments allowed the identification of the main constituents of the TchM1 extract (Figure 3). The 1H NMR spectrum showed characteristic signals of teucrioside (Figure 2a) and neo-clerodanes diterpenes, previously reported from this species and as main components of the leaf extract [27]. Indeed, the spectrum showed signals consistent with a trans-caffeoyl moiety, with the catechol ring protons resonating as a meta coupled doublet at δ 7.14 (J = 1.8 Hz, H-2), a double doublet at δ 7.06 (J = 1.8 and 8.1 Hz, H-6) and an ortho coupled doublet at δ 6.88 (J = 8.1 Hz, H-5). Furthermore, the AB system for two olefinic protons at δ 7.65 (J = 15.9 Hz, H-7) and δ 6.34 (J = 15.9 Hz, H-8) was distinguishable. In the same region, signals of the catechol unit of the 3,4-dihydroxyphenyethanoylic moiety were evident as a meta coupled doublet at δ 6.79 (J = 2.1 Hz, H-2′), a double doublet at δ 6.67 (J = 2.1 and 7.8 Hz, H-6′) and an ortho coupled doublet at δ 6.78 (J = 7.8 Hz, H-5′). In the upfield region of the spectrum, the proton H-7′ of the ethanoyl chain at δ 2.83 was detected as triplet. The resonances attributable to the anomeric protons of two saccharide units were clear at δ 5.34 and 4.40 (J = 8.1 Hz), corresponding to an α-rhamnose and a β-glucose, respectively. The rhamnose presence was supported also by a doublet at δ 1.03 (J = 6.3 Hz). The anomeric signal of the third sugar unit, lyxose [28], was not detected because the resonance was too close to that of water and was therefore affected by the presaturation. However, its presence was confirmed by 2D-NMR analysis of the fractions obtained by the partial purification of the TchM1 extract, which was subjected to liquid/liquid extraction (to give TchW1 and TchE1 fractions).
The TchW1 fraction was further purified on Amberlite® XAD-4 eluting first with water (TchW2) and then with methanol (TchM2). The signals belonging to the putative teucrioside were detected in the TchW1 and TchM2 fractions. The identity of the compound was proven thanks to 2D NMR analysis of the latest fraction. Indeed, all the HSQC, COSY and HMBC correlations were in accordance with the structure of the trans-caffeoyl and hydroxytyrosol moieties. Furthermore, also the presence of three sugar units was confirmed and the diagnostic correlations were evidenced.
In particular, the long-range correlation between the anomeric proton of glucose at δ 4.40 with the C-7 carbon of the hydroxytyrosol moiety, the correlation between the proton H-4′ of glucose (δ 4.94) and the C-9⁗ carbon on the caffeoyl moiety at δ 167.0, the correlation of the anomeric proton of rhamnose with the C-3 of glucose at δ 80.5, and finally the correlation of the anomeric proton of lyxose with the C-2″ carbon of rhamnose allowed to identify the linkage sites. While teucrioside was the main component of the TchM2 fraction (Figure 2b), the parent fraction also contained signals belonging to primary metabolites (Table 1), all finally detected in the TchW2 fraction and identified based on the comparison of NMR data to those reported in the literature [29]. The other main constituents of the extract were the neo-clerodane diterpenes. Hints for their presence in the TchM1 extract were obtained by the characteristic signals of a β-substituted furan ring as a signal at δ 7.63 (H-16) and two multiplets at δ 7.57 (H-15) and 6.52 (H-14). These signals, along with minor signals still belonging to phenylethanoid glycosides, were detected in the TchE1 fraction, which was further purified on silica gel to obtain three fractions: TchC1, TchE2, TchM3. While the methanol fraction (TchM3) showed mainly the signals for teucrioside, both TchC1 and TchE2 contained signals attributable to clerodane diterpenes.
The aliphatic region of the spectrum of the TchC1 fraction allowed us to assume the presence of terpene molecules and fatty acids. The multiplet at δ 2.20, attributable to the methylene group in α to the carboxyl carbon, the signal at δ 2.03, characteristic of the allyl protons in all unsaturated fatty acids, and the signal at δ 1.66 due to the β-methylene to carboxyl group were all diagnostic of fatty acids. The signal at δ 5.15 suggested the presence of olefinic protons of unsaturated acyl chains. The intense signal at δ 1.29 was related to all the saturated methylene groups. The aromatic region of the 1H NMR spectrum of the TchC1 fraction showed signals due to the furan ring protons of neo-clerodanes. In the region of the protons geminal to oxygen functions, signals at δ 5.40 were attributable to the proton H-12 of neo-clerodanes with a five-membered spiro-lactone ring. Due to their relatively low abundance compared to the other components of the spectrum, it was not possible to definitively identify these compounds.
The 1H NMR spectrum of the TchE2 extract highlighted the massive presence of neo-clerodanes (Figure 2c). In fact, once again, in the downfield spectral region the furan ring protons belonging to these compounds were evident. The identities were confirmed by 2D NMR analysis of this fraction. In particular, signals belonging to the β-substituted furan ring as at δ 7.57 (H-16), 7.46 (H-15) and 7.43 (H-14) showed HSQC correlations with the carbons at δ 140.6 (C-16), 144.1 (C-15) and 107.7 (C-14), respectively. Long-range correlations with the C-14 and C-16 carbon, as well as with the C-13 (δ 125.2), were also shown by the H-12 proton resonating either at δ 5.44 or at δ 5.69, depending on the substitution pattern of the neo-clerodane diterpenes generating the signal
The H-12 resonating at δ 5.44 showed HSQC correlations with the carbon at δ 72.1, in turn correlated in the HMBC to the protons at δ 2.32 and 2.61 (H-11). These protons showed further long-range correlations with the carbons at δ 51.0 (C-9), 42.2 (C-10) and 36.3 (C-8). A methyl signal at δ 1.17 (H-17), correlating in the HMBC with the C-9, also showed a COSY correlation with the proton at δ 1.89, which in turn correlated in the same experiment with the proton at δ 5.62 (H-7) bound to the carbon at δ 71.4 (C-7). These correlations therefore suggested the presence of teucrin A, reported as one of the main neo-clerodane diterpenoid compounds in T. chamaedrys [30].
The H-12 resonating at δ 5.69 showed HSQC correlations with the carbon at δ 74.9 (C-12) and COSY correlations to the protons at δ 2.65 and δ 2.34. These protons, bound to a carbon at δ 39.5, showed long-range correlations with the carbons at δ 181.9 (C-20), 56.1 (C-9), 41.5 (C10), 38.1 (C-8), and finally with the C-12. A methyl signal at δ 0.93 (H-17) showed long-range correlation with the C-8 and C-9 and a further correlation with a carbon at δ 71.9, which was bound to a proton at δ 5.18. However, this carbinol was not located at C-7 as in the case of teucrin A. Indeed, the H-17 proton was correlated in a COSY experiment with the proton at 2.16 (H-8), in turn correlating to the protons at δ 1.21 and 1.64 (H-7). Therefore, the carbon at δ 71.9 could be located at the C6. The H-7 protons showed HMBC correlations with the carbons at δ 139.8 (C-4), 142.2 (C-5), and 185.0 (C-18). This compound was hence putatively identified as teuchamaedrin A, reported together with the previously identified teucrin A, as the main responsible for the toxicity of the T. chamaedrys drug [30].
The methyl region showed many other signals putatively belonging to neo-clerodane diterpenes. A previous phytochemical study of T. chamaedrys L. subsp. chamaedrys leaf collected in the same study area also led to the isolation and identification of teucrin G and F, chamaedroxide, teuflidin and chamaedryosides A-C [31,32]. While it was not possible to definitively elucidate these compounds in the extracts, the H-17 methyl signals chemical shifts and the long-range correlations detected could suggest their presence.

3.2. Bioactivity of Teucrium chamaedrys L. subsp. Chamaedrys leaf MeOH Extract and Fractions Therefrom

3.2.1. Antioxidant Capacity

The evaluation of the antioxidant capacity has been carried out using separate methods, due to the absence of a single valid method for the determination of the total antioxidant capacity of a system at present.
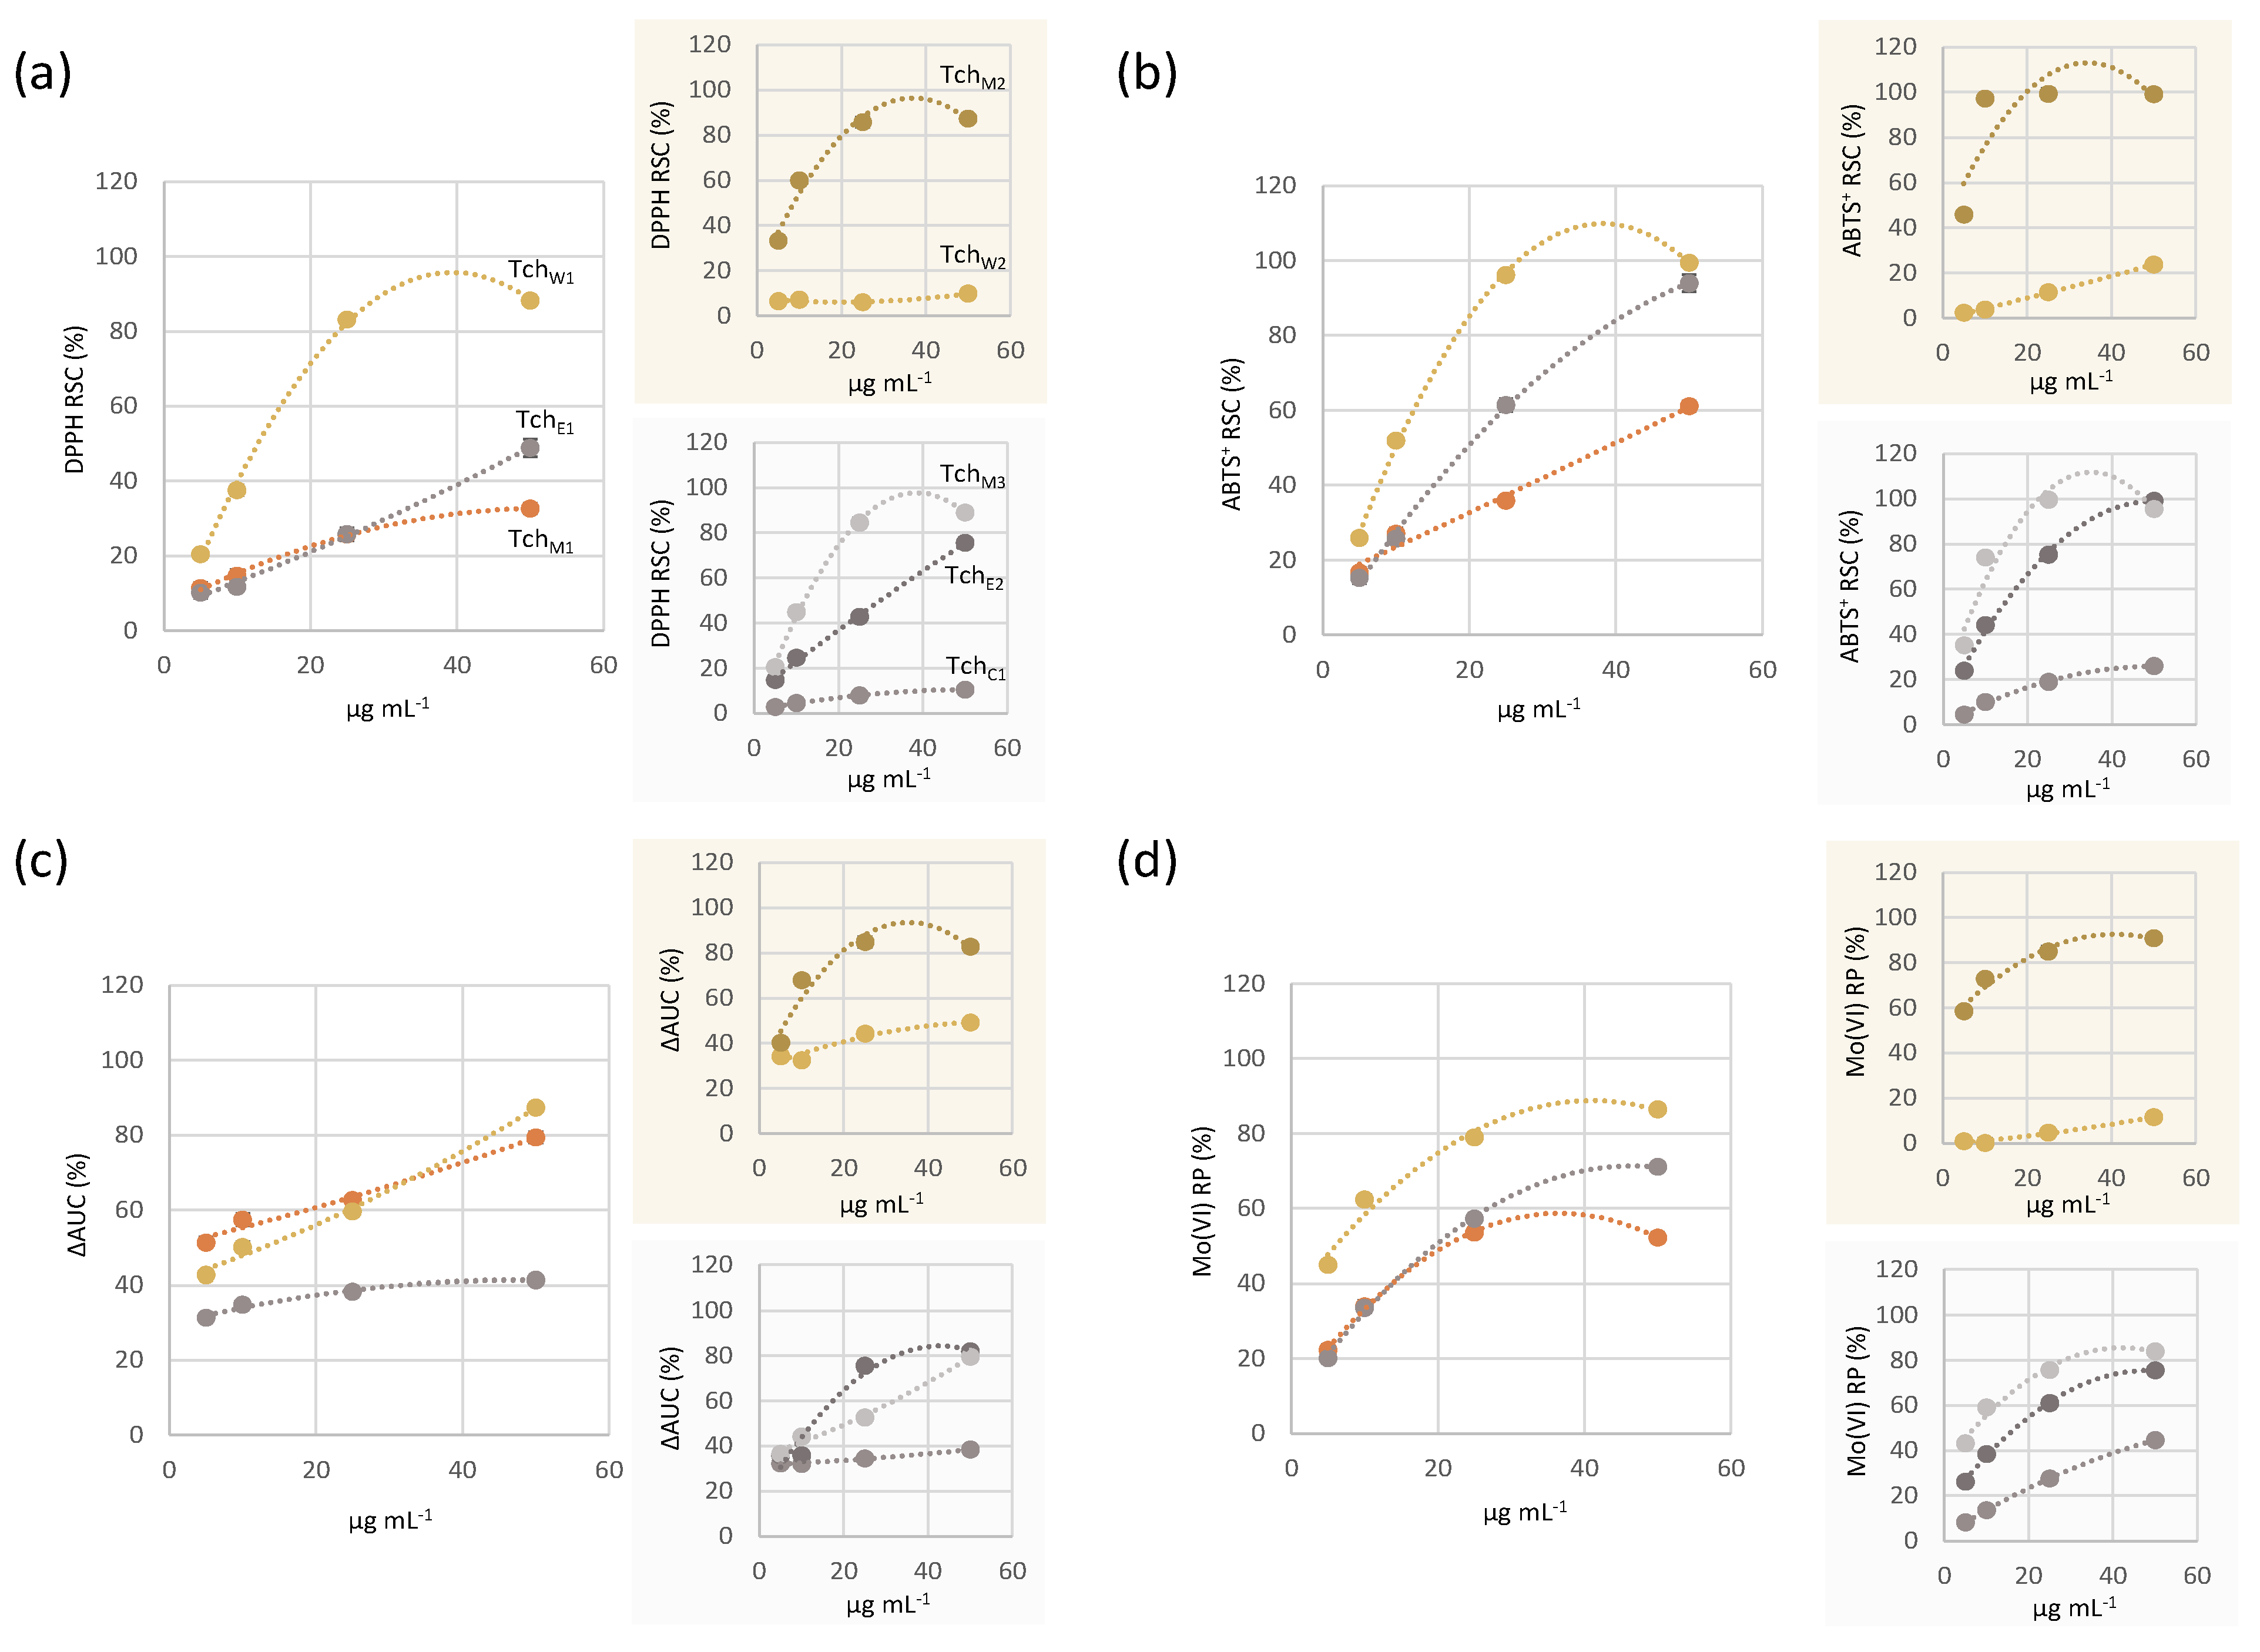
As depicted in Figure 4, the crude methanolic extract (TchM1) showed a similar dose-response trend in the evaluation of radical scavenging capacity towards DPPH and ABTS•+. Indeed, the effectiveness appeared strongly dependent on the tested dose, where the latter probe was more responsible. In fact, TchM1 determined an absorbance decrease in ABTS test, in which a 50% reduction of the radical oxidized form occurred as early as at 29.1 ± 0.7 µg mL−1 tested dose.
The ORAC assay measures the antioxidant inhibition of the peroxyl radical, induced by oxidation, reflecting the classic radical chain-breaking antioxidant activity by transfer of a hydrogen atom [33]. Briefly, the peroxyl radical reacts with fluorescein (FL, marker) to form a non-fluorescent product, which can be easily quantified by spectrofluorimetric measurements. The antioxidant capacity was determined by the decreasing rate and the loss of fluorescence, due to the oxidation of the marker over time [34]. ΔAUC values (AUC = Area Under Curve) could be calculated as the difference of areas below the decay curve of fluorescein in the tested sample and the blank (Figure 4). Moreover, their interpolation on the calibration curve of Trolox provided the concentration of Trolox having the same activity of the sample. Therefore, it has been estimated that in one gram of TchM1 there are 1232,41 µmol equivalent of Trolox (ORAC Units).
The use of a molybdenum transition metal salt is a valid method in estimating the antioxidant capacity of the studied matrices. In fact, transition metals are particularly important catalysts of reactive oxygen species (ROS) production. The data obtained from the analysis of the Mo(VI) reducing power showed that TchM1 was characterized by a good reducing power, strongly dependent also in this case by the sample tested dose, with an ID50 value estimated equal to 10.04 ± 0.9 µg mL−1.
When TchM1 was fractionated, the further seven partially purified extracts obtained not only differed for polarity and solubility of their constituents but also in bioactivity. In particular, discontinuous liquid–liquid extraction provided the aqueous TchW1, which exhibited a marked antiradical and reducing capacity, higher than the parental extract. In fact, it was able to reduce DPPH by 50% at a dose equal to 11.8 ± 0.5 µg mL−1, and the radical cation ABTS•+ at 9.5 ± 0.3 µg mL−1. This behavior was confirmed also in evaluating Mo(VI) reducing power, whose results showed a similar dose-response curve, but shifted at about 2-fold higher values for each tested concentration. This massive antioxidant activity could be explained considering that this fraction was enriched in phenylethanoid glycosides and traces of iridoid compounds, whereas neo-clerodanes were the main constituents of the organic counterpart TchE1.
The further fractionation of TchW1 by Amberlite® XAD-4 resin column chromatography gave rise to the methanol TchM2 fraction, whose constitution in active phenolic substances made it the most interesting antioxidant sample, as highlighted in all the performed tests (Figure 4).

3.2.2. Cytotoxicity

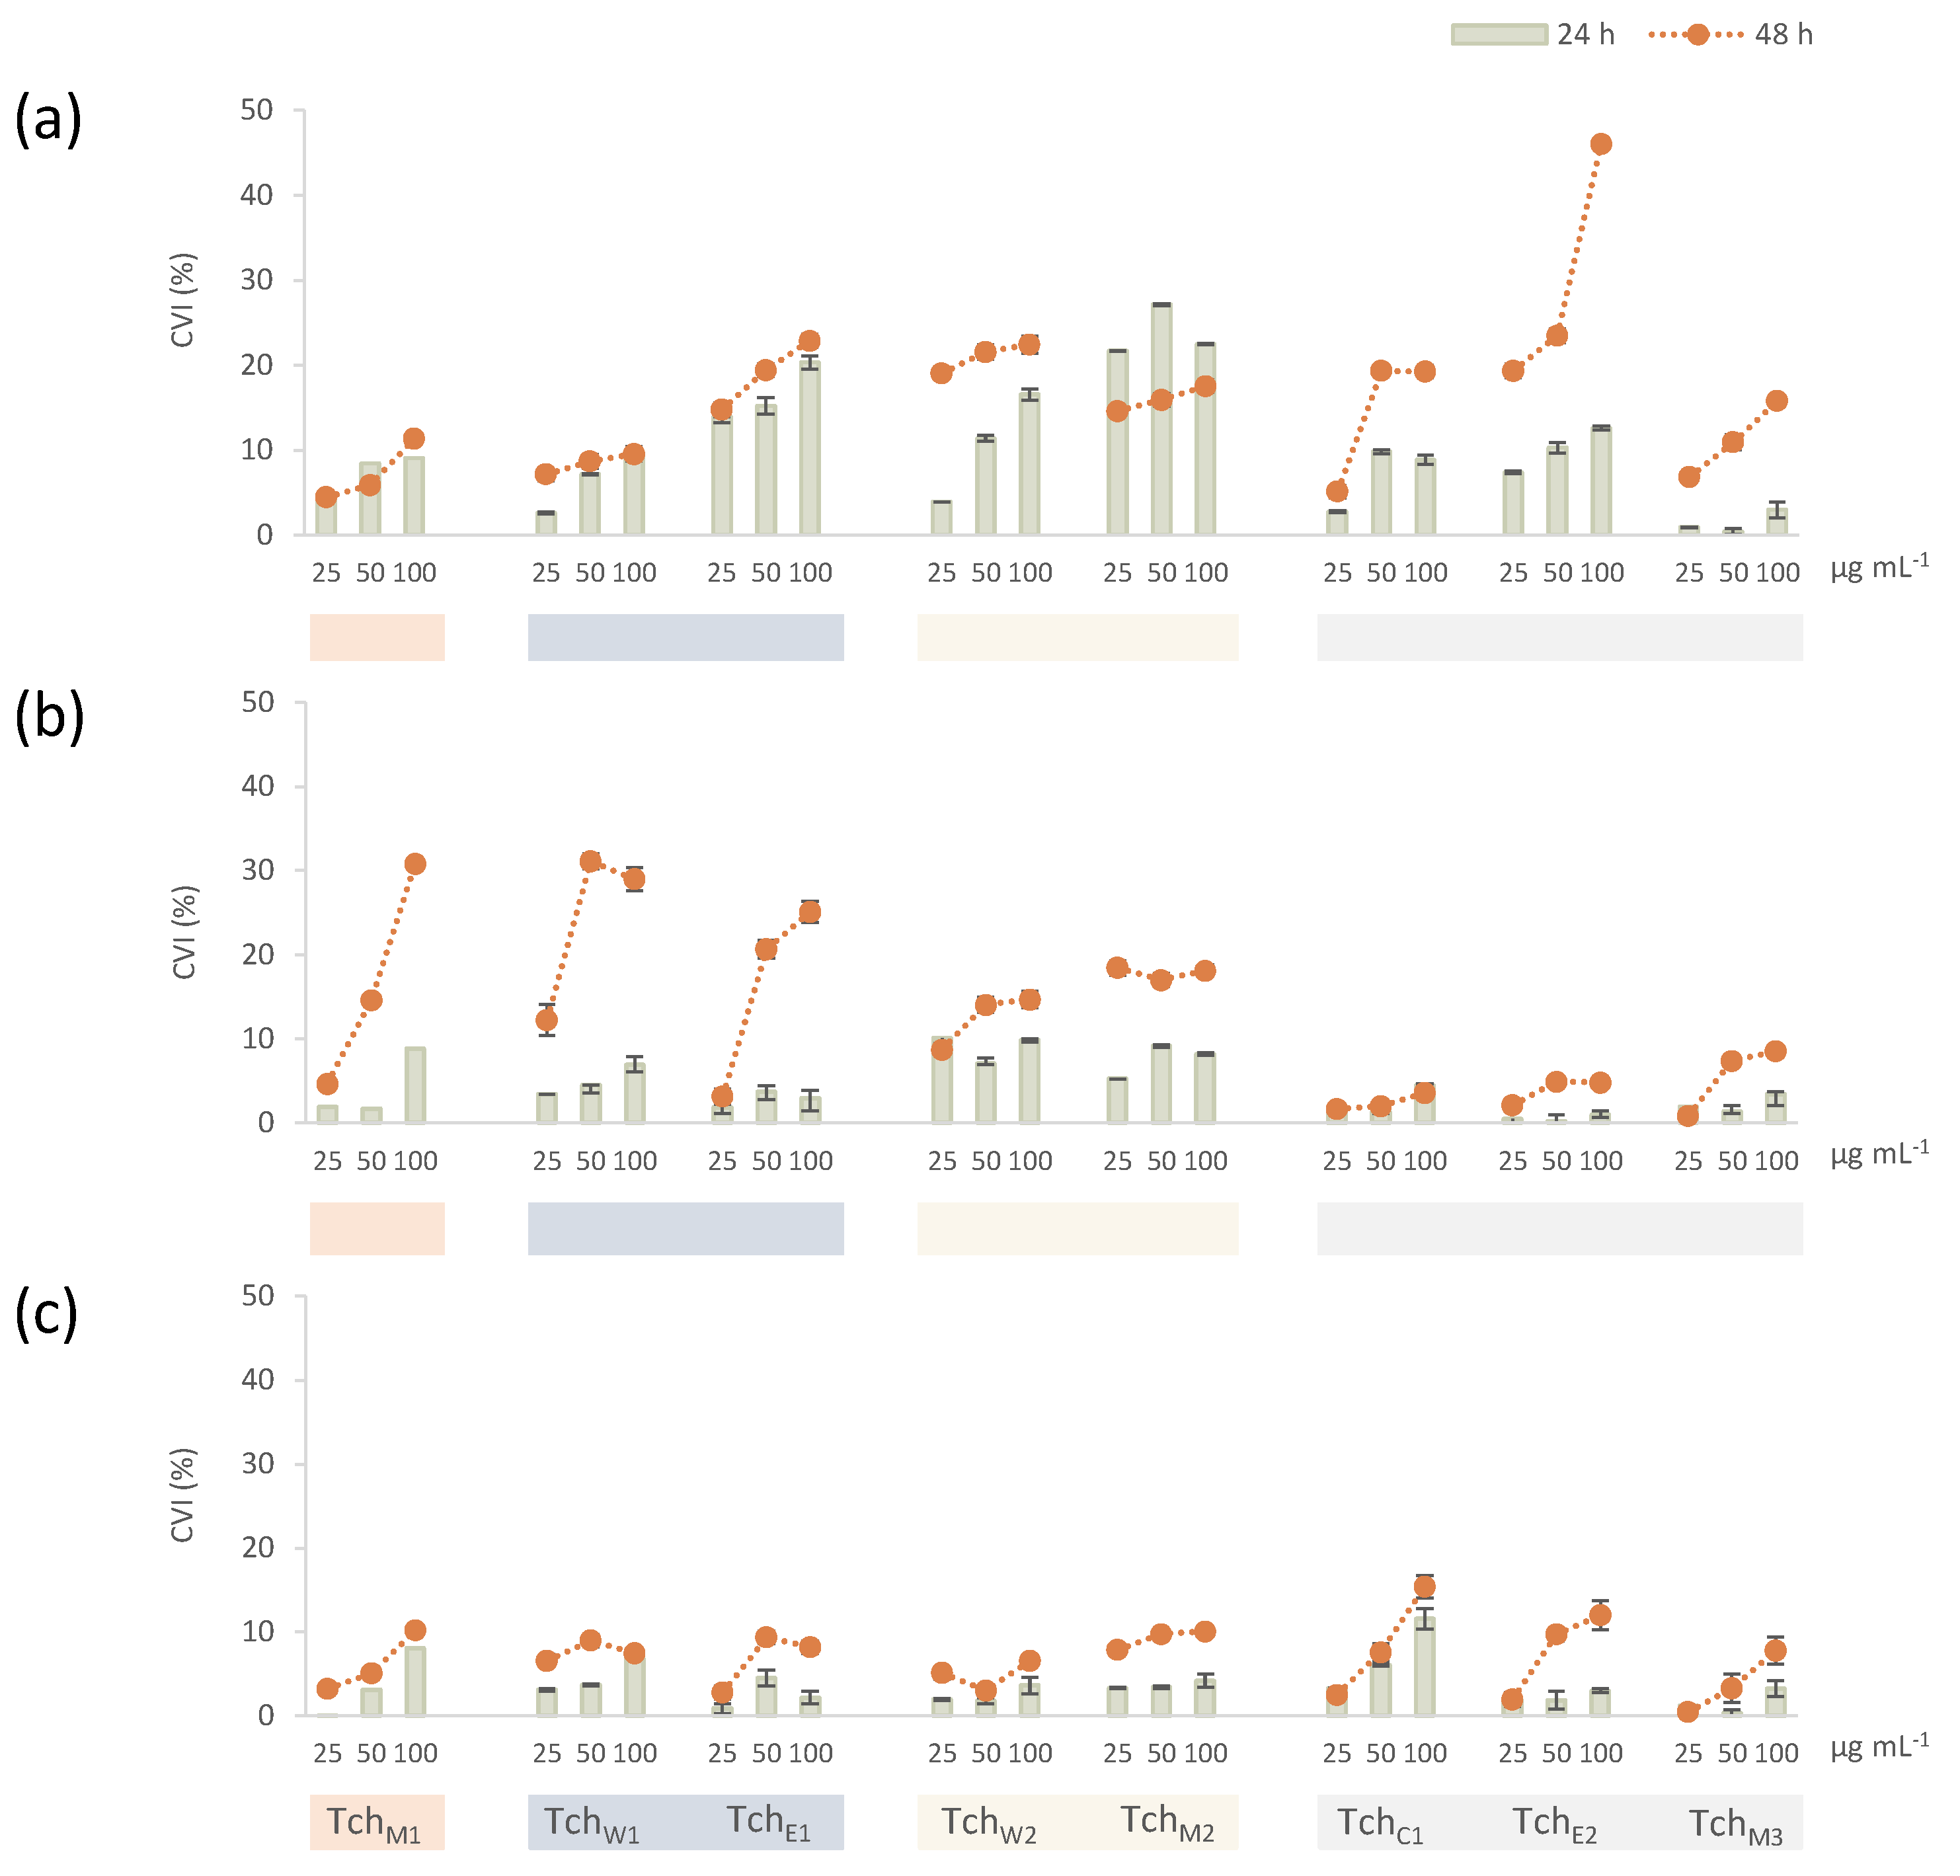
The evaluation of cytotoxicity is a fundamental step in the definition of the potential harm that plant natural products could induce in the cells. The controversial hepatotoxicity of plants belonging to the Teucrium genus has long been attributed to neo-clerodane constituents. In this context, potential cytotoxic effects have been investigated towards human hepatocellular carcinoma cells HepG2, treated with increasing doses of leaf extract (25.0, 50.0 and 100.0 μg mL−1) and for two different exposure times (24 and 48 h). They represent a useful model for studying the function of CYP3A4, the enzyme responsible for the oxidation of the furan ring in highly toxic epoxy derivatives [35]. In order to highlight the potentially induced damage in other cell lines, the screening was extended to HeLa cervical cancer cells and A549 epithelial lung cancer cells. Cytotoxicity was estimated by MTT cell viability test, based on the intracellular reduction of tetrazolium salts in formazan crystals by mitochondrial dehydrogenases. Data acquired showed that the cytotoxic potential exerted by TchM1 was different in the considered cell lines (Figure 5). In fact, although cell viability impairment appeared to be time-dependent and after 48 h also dose-dependent, HeLa cells proved to be the most sensitive to the treatment, in that their viability was inhibited by 30.8 ± 1.2% at the highest tested dose. HepG2 and A549 cell lines seemed to be not affected.
The cytotoxicity evaluation of fractions directly derived from the alcoholic parental extract showed that TchW1 fraction did not contain any metabolites able to modify the cell viability rate. The absence of cytotoxic effects (CVI ≤ 10 %) also in this case was particularly evident in A549 and HepG2 cell lines, whereas HeLa viability decreased by about 30% after 48 h exposure time to the highest dose level. The lack of toxic effects on lung cancer cells was observed also in the treatment with TchE1, whereas human cervix adenocarcinoma and hepatoblastoma cell growth was mildly influenced, probably due to the presence of neo-clerodane diterpenes. Indeed, HepG2 viability decreased by about 22.8 ± 0.7% after 48 h of treatment with the 100.0 µg mL−1 dose level (Figure 5). Accordingly, the enhanced amount of these metabolites in TchE2 was responsible for a greater ability to inhibit cell viability in HepG2 cells. The cytotoxic effect, not detected in the other two cell lines, appeared to be strongly time- and dose-dependent. In fact, the highest cell viability inhibition, induced by the 100.0 µg mL−1 dose after 48 h exposure time, was 46.0 ± 0.5%. Moreover, it seems reasonable to assume that the additive effects of the polyphenolic components, constituting the TchM2 and TchM3 fractions, provided the detected beneficial effect.

3.3. Principal Component Analysis (PCA)

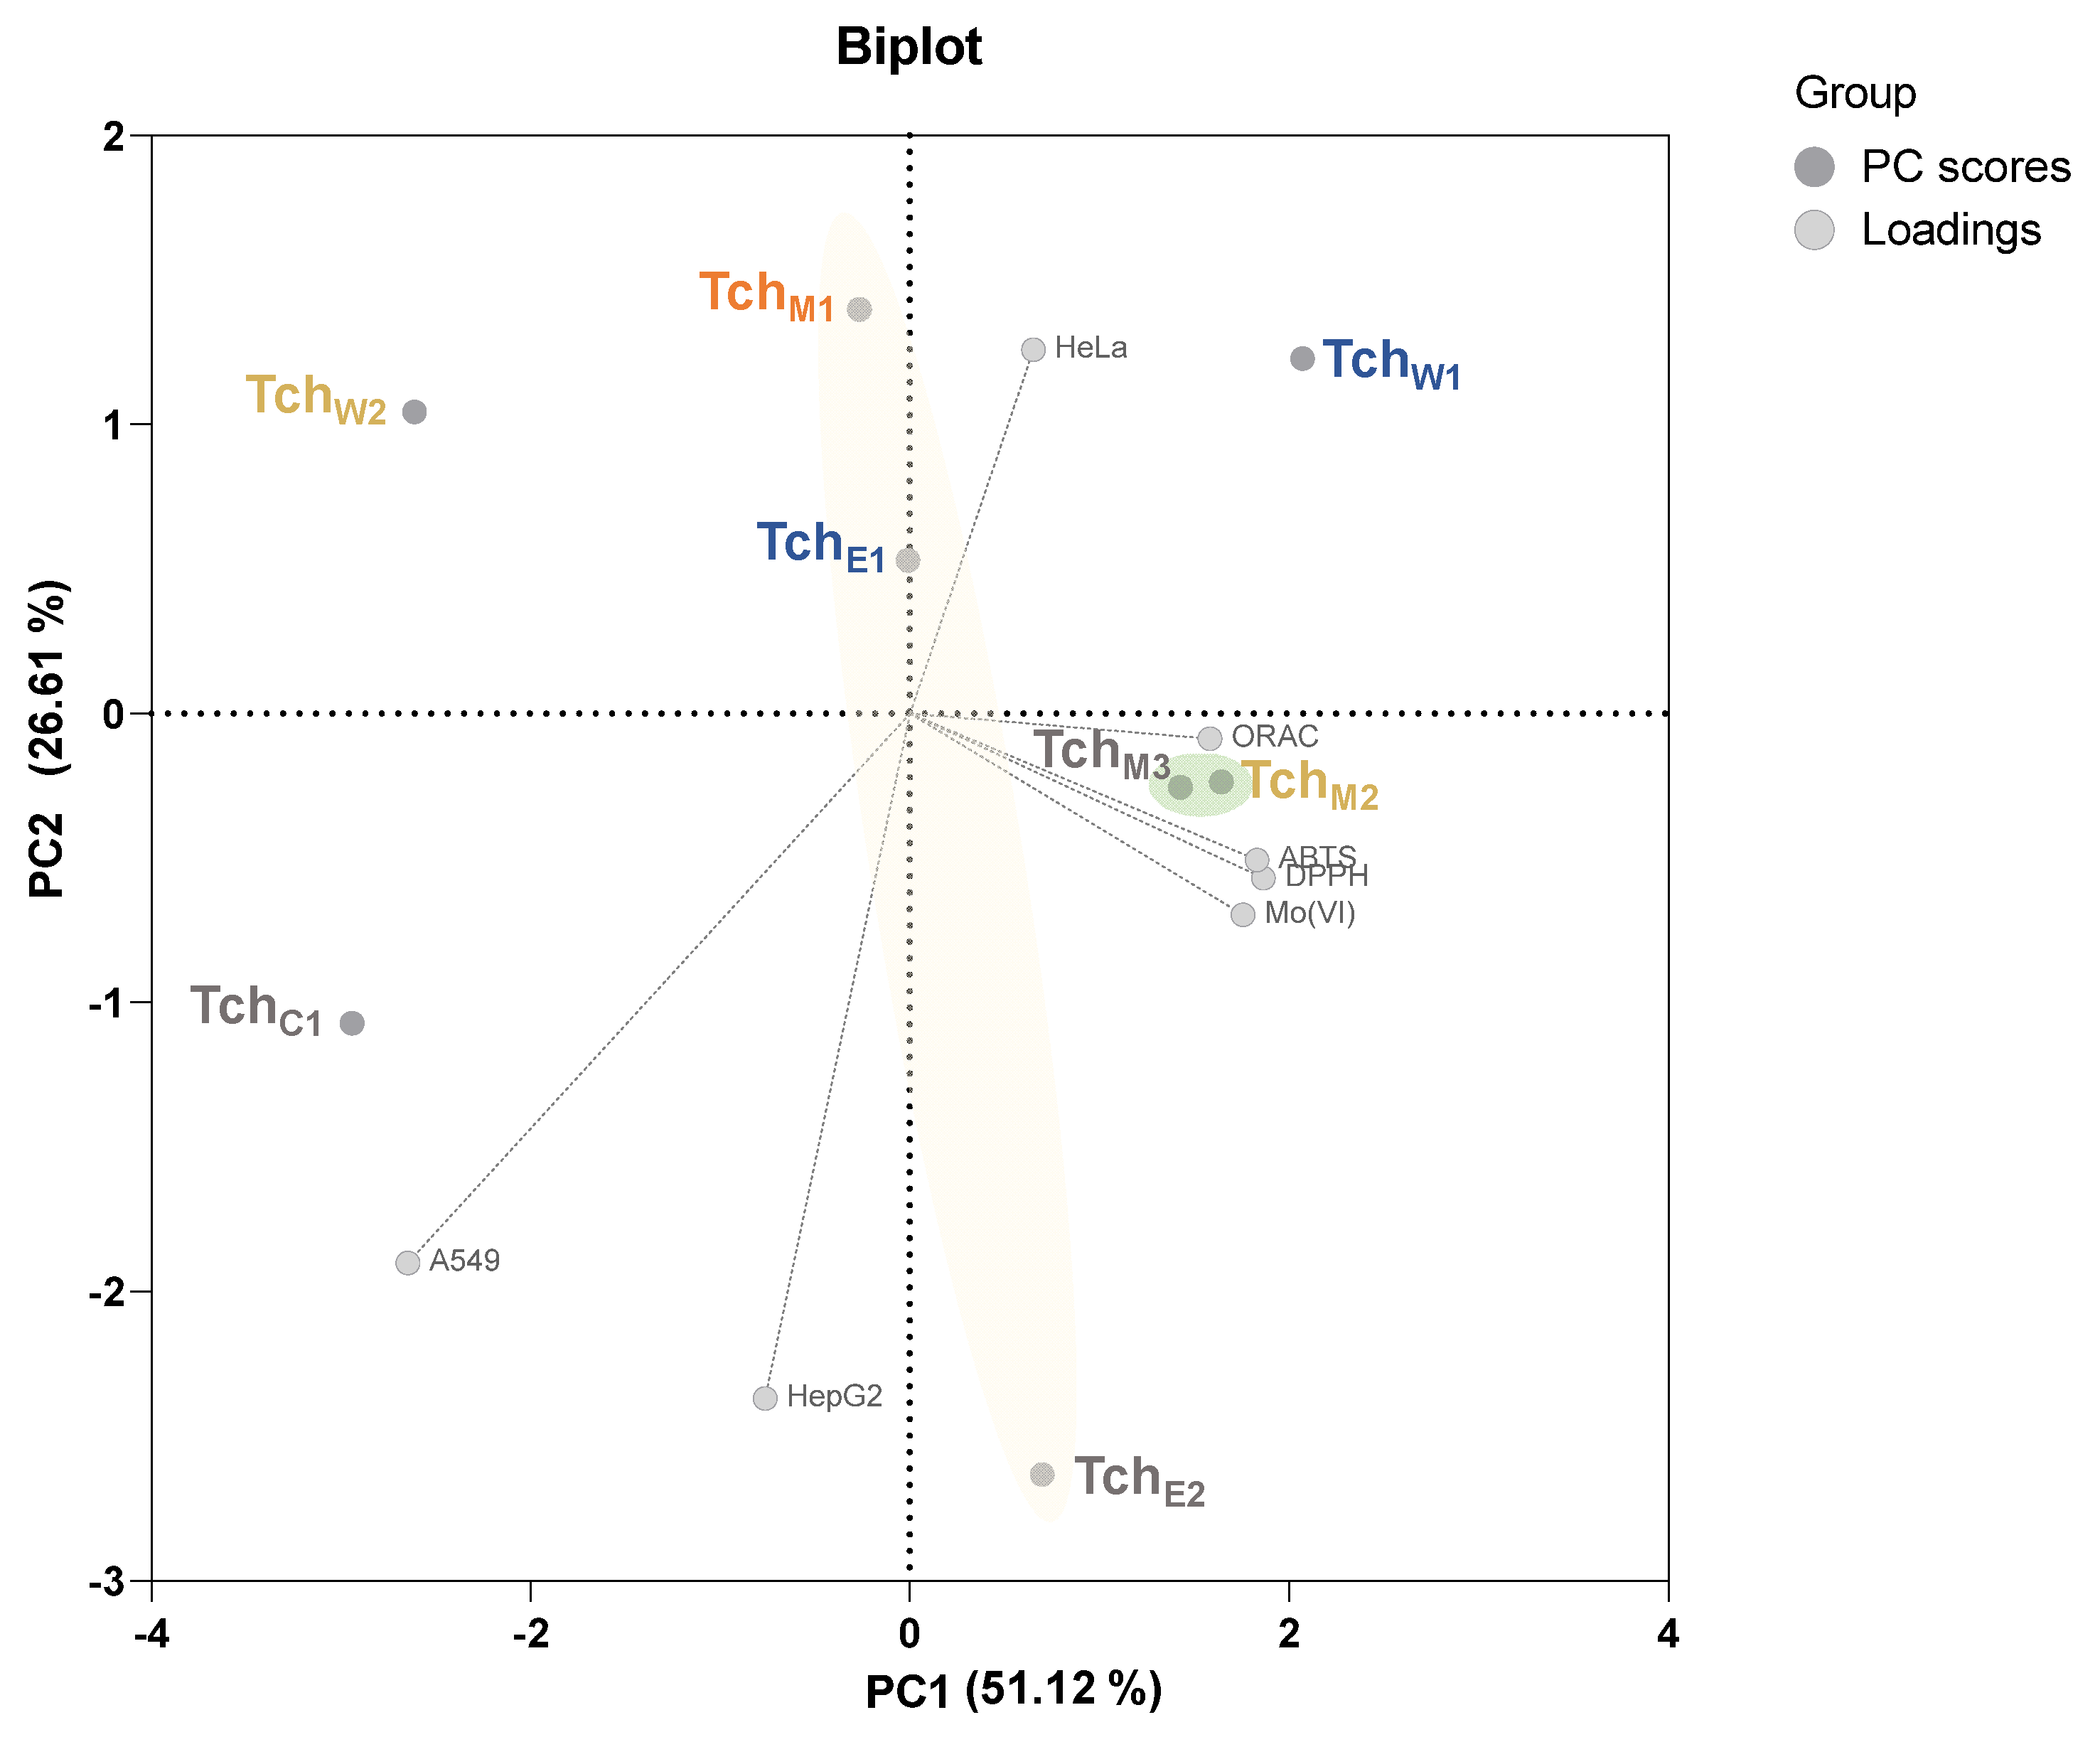
Data obtained by principal component analysis (PCA) correlation biplot of investigated fractions, reported in Figure 6, summarize the main patterns of variation within the data sets from antioxidant capability tests (DPPH, ABTS, ORAC and Mo(VI)RP) and CVI% towards HepG2, HeLa and A549 cell lines. The different behavior of the studied fractions as antioxidant and/or cytotoxic samples were clearly highlighted, and it could be explained taking into account their peculiar enrichment in certain compound classes, due to polarity and solubility characteristics. In particular, the analyzed fractions are oriented along the first principal component (PC1), which attained 51.12% of variance, with an evident gradient produced by antioxidant data, whereas the second principal component (PC2) explained 26.61% of the total variation and was mainly related to cytotoxicity data. Thus, the two-dimensional graph was able to describe 77.73% of the variability in the experimental data. It is reasonable to assume that the depletion in the phenolic constituents from TchM1 extract to the partially purified TchE2 fraction is responsible for the enhanced CVI% observed, whereas the phenylethanoid glycosides-rich fractions (TchM2 and TchM3) are characterized by a marked scavenging and/or reducing capability. Finally, the TchW1 sample, located in the upper right-hand side of the graph, was directly correlated with a good antioxidant activity and very low cytotoxic effects, which were mainly for HeLa cells. Furthermore, TchW2 appeared inversely correlated to both biological activities. TchC1, which was mainly constituted by diterpenes and unsaturated fatty acids, differed from all the other samples, in that its effectiveness was negatively correlated with antioxidant tests and exerted only poor effects on cell viability.

4. Conclusions

The metabolic complexity of T. chamaedrys subsp. chamaedrys leaf crude alcoholic extract was simplified through a bio-guided fractionation strategy. Fractions obtained were analyzed for their antioxidant capability, through four different assays, and cytotoxicity was evaluated towards three different cell lines. They mostly differed for their antioxidant capacity, and applying PCA, a better visualization of all results was attained. In fact, based on the PCA data, fractionation could play a stronger role in preserving the antioxidant activities of the wall germander leaves. The availability of fractions constituted by phenolic compounds as the main actors could give a renewed interest in wall germander.
Aerial parts of the plants could be used as a source of healthy compounds, pure or in mixture, to be handled in pharmaceutical, nutraceutical and/or cosmeceutical sectors.

Author Contributions

Conceptualization, A.F. and S.P. (Severina Pacifico); methodology, A.F., B.D., S.P. (Severina Pacifico); formal analysis, B.D., M.S., S.P. (Severina Pacifico), S.P. (Simona Piccolella), A.E.; investigation, B.D., M.S., S.P. (Severina Pacifico), S.P. (Simona Piccolella), A.E.; resources, A.F.; data curation, M.S., S.P. (Severina Pacifico), S.P. (Simona Piccolella); writing—original draft preparation, M.S., S.P. (Severina Pacifico), S.P. (Simona Piccolella); writing—review and editing, A.F., A.E., S.P. (Severina Pacifico); visualization, A.F., B.D., A.E.; supervision, A.F.; project administration, A.F. All authors have read and agreed to the published version of the manuscript.

Funding

This research received no external funding.

Institutional Review Board Statement

Not applicable.

Informed Consent Statement

Not applicable.

Acknowledgments

This research was funded by the project PhytoCrop VALERE Program 2020 of the University of Campania “Luigi Vanvitelli”.

Conflicts of Interest

The authors declare no conflict of interest.

References

  1. Haslan, H.; Suhaimi, F.H.; Das, S. Herbal supplements and hepatotoxicity: A short review. Nat. Prod. Commun. 2015, 10, 1779–1784. [Google Scholar] [CrossRef] [PubMed] [Green Version]
  2. de Boer, Y.S.; Sherker, A.H. Herbal and dietary supplement-induced liver Injury. Clin. Liver Dis. 2017, 21, 135–149. [Google Scholar] [CrossRef] [PubMed] [Green Version]
  3. Cachet, X.; Langrand, J.; Riffault-Valois, L.; Bouzidi, C.; Colas, C.; Dugay, A.; Michel, S.; Boucaud-Maitre, D. Clerodane furanoditerpenoids as the probable cause of toxic hepatitis induced by Tinospora crispa. Sci. Rep. 2018, 8, 13520. [Google Scholar] [CrossRef] [PubMed]
  4. Piozzi, F.; Bruno, M.; Ciriminna, R.; Fazio, C.; Vassallo, N.; Arnold, N.A.; de la Torre, M.C.; Rodriguez, B. Putative hepatotoxic neoclerodane diterpenoids from Teucrium species. Planta Med. 1997, 63, 483–484. [Google Scholar] [CrossRef] [PubMed]
  5. Gursoy, N.; Tepe, B. Determination of the antimicrobial and antioxidative properties and total phenolics of two “endemic” Lamiaceae species from Turkey: Ballota rotundifolia L. and Teucrium chamaedrys C. Koch. Plant Foods Hum. Nutr. 2009, 64, 135–140. [Google Scholar] [CrossRef]
  6. Vladimir-Knežević, S.; Blažeković, B.; Kindl, M.; Vladić, J.; Lower-Nedza, A.D.; Brantner, A.H. Acetylcholinesterase inhibitory, antioxidant and phytochemical properties of selected medicinal plants of the Lamiaceae family. Molecules 2014, 19, 767–782. [Google Scholar] [CrossRef] [PubMed] [Green Version]
  7. Panesar, P.S.; Kumar, N.; Marwaha, S.S.; Joshi, V.K. Vermouth production technology–an overview. Nat. Prod. Radiance 2009, 8, 334–344. [Google Scholar]
  8. Herrera, S.; Bruguera, M. Hepatotoxicidad inducida por el uso de hierbas y medicamentos para perder peso [Hepatotoxicity induced by herbs and medicines used to induce weight loss]. Gastroenterol. Hepatol. 2008, 31, 447–453. [Google Scholar] [CrossRef] [Green Version]
  9. Gori, L.; Galluzzi, P.; Mascherini, V.; Gallo, E.; Lapi, F.; Menniti-Ippolito, F.; Raschetti, R.; Mugelli, A.; Vannacci, A.; Firenzuoli, F. Two contemporary cases of hepatitis associated with Teucrium chamaedrys L. decoction use: Case reports and review of literature. Basic Clin. Pharmacol. Toxicol. 2011, 109, 521–526. [Google Scholar] [CrossRef]
  10. Nencini, C.; Galluzzi, P.; Pippi, F.; Menchiari, A.; Micheli, L. Hepatotoxicity of Teucrium chamaedrys L. decoction: Role of difference in the harvesting area and preparation method. Indian J. Pharmacol. 2014, 46, 181–184. [Google Scholar]
  11. Lekehal, M.; Pessayre, D.; Lereau, J.M.; Moulis, C.; Fouraste, I.; Fau, D. Hepatotoxicity of the herbal medicine germander: Metabolic activation of its furano diterpenoids by cytochrome P450 3A Depletes cytoskeleton-associated protein thiols and forms plasma membrane blebs in rat hepatocytes. Hepatology 1996, 24, 212–218. [Google Scholar] [CrossRef] [PubMed]
  12. De Berardinis, V.; Moulis, C.; Maurice, M.; Beaune, P.; Pessayre, D.; Pompon, D.; Loeper, J. Human microsomal epoxide hydrolase is the target of germander-induced autoantibodies on the surface of human hepatocytes. Mol. Pharmacol. 2000, 58, 542–551. [Google Scholar] [CrossRef] [Green Version]
  13. European Commission Health & Consumer Protection Directorate General. Opinion of the Scientific Committee on Food on Teucrin A, Major Component of Hydroalcoholic Extracts of Teucrium Chamaedrys (Wild Germander); European Commission Health & Consumer Protection Directorate General: Ispra, Italy, 2003. [Google Scholar]
  14. Pacifico, S.; D’Abrosca, B.; Pascarella, M.T.; Letizia, M.; Uzzo, P.; Piscopo, V.; Fiorentino, A. Antioxidant efficacy of iridoid and phenylethanoid glycosides from the medicinal plant Teucrium chamaedrys in cell-free systems. Bioorg. Med. Chem. 2009, 17, 6173–6179. [Google Scholar] [CrossRef]
  15. Frezza, C.; Venditti, A.; Matrone, G.; Serafini, I.; Foddai, S.; Bianco, A.; Serafini, M. Iridoid glycosides and polyphenolic compounds from Teucrium chamaedrys L. Nat. Prod. Res. 2018, 32, 1583–1589. [Google Scholar] [CrossRef] [PubMed]
  16. Xue, Z.; Yang, B. Phenylethanoid glycosides: Research advances in their phytochemistry, pharmacological activity and pharmacokinetics. Molecules 2016, 21, 991. [Google Scholar] [CrossRef] [PubMed]
  17. Haïdara, K.; Alachkar, A.; Moustafa, A. Teucrium polium plant extract provokes significant cell death in human lung cancer cells. Health 2011, 3, 366–369. [Google Scholar] [CrossRef] [Green Version]
  18. Pacifico, S.; D’Abrosca, B.; Scognamiglio, M.; D’Angelo, G.; Gallicchio, M.; Galasso, S.; Monaco, P.; Fiorentino, A. NMR-based metabolic profiling and in vitro antioxidant and hepatotoxic assessment of partially purified fractions from Golden germander (Teucrium polium L.) methanolic extract. Food Chem. 2012, 135, 1957–1967. [Google Scholar] [CrossRef]
  19. Stanković, M.S.; Mitrović, T.L.; Matić, I.Z.; Topuzović, M.D.; Stamenković, S.M. New values of Teucrium species: In vitro study of cytotoxic activities of secondary metabolites. Not. Bot. Horti Agrobot. Cluj Napoca 2015, 43, 41–46. [Google Scholar] [CrossRef] [Green Version]
  20. Özel, Ş.; Süntar, İ.; Ercan Gökay, N.; Taşkın Türkmenoğlu, T.; Demırel, M.A. The effectiveness of Teucrium chamaedrys L. extracts on endometriotic implant regression in rat endometriosis model. Vet. Res. Forum 2020, 11, 305–309. [Google Scholar]
  21. Croce, A.; Stinca, A.; Santangelo, A.; Esposito, A. Exploring vascular flora diversity of two protected sandy coastal areas in southern Italy. Rend. Lincei. Sci. Fis. Naturali. 2019, 30, 323–336 doiorg/101007/s122110. [Google Scholar] [CrossRef]
  22. Sumner, L.W.; Amberg, A.; Barrett, D.; Beale, M.H.; Beger, R.; Daykin, C.A.; Fan, T.W.; Fiehn, O.; Goodacre, R.; Griffin, J.L.; et al. Proposed minimum reporting standards for chemical analysis Chemical Analysis Working Group (CAWG) Metabolomics Standards Initiative (MSI). Metabolomics 2007, 3, 211–221. [Google Scholar] [CrossRef] [PubMed] [Green Version]
  23. Pacifico, S.; Piccolella, S.; Marciano, S.; Galasso, S.; Nocera, P.; Piscopo, V.; Fiorentino, A.; Monaco, P. LC-MS/MS profiling of a mastic leaf phenol enriched extract and its effects on H2O2 and Aβ(25–35) oxidative injury in SK-B-NE(C)-2 cells. J. Agric. Food Chem. 2014, 62, 11957–11966. [Google Scholar] [CrossRef]
  24. Pacifico, S.; Piccolella, S.; Galasso, S.; Fiorentino, A.; Kretschmer, N.; Pan, S.P.; Bauer, R.; Monaco, P. Influence of harvest season on chemical composition and bioactivity of wild rue plant hydroalcoholic extracts. Food Chem. Toxicol. 2016, 90, 102–111. [Google Scholar] [CrossRef]
  25. Fiorentino, A.; D’Abrosca, B.; Pacifico, S.; Mastellone, S.; Piccolella, S.; Monaco, P. Isolation, structure elucidation, and antioxidant evaluation of Cydonioside A, an unusual terpenoid from the fruits of Cydonia vulgaris. Chem. Biodivers. 2007, 4, 973–979. [Google Scholar] [CrossRef] [PubMed]
  26. Pacifico, S.; Piccolella, S.; Lettieri, A.; Nocera, P.; Bollino, F.; Catauro, M. A metabolic profiling approach to an Italian sage leaf extract (SoA541) defines its antioxidant and anti-acetylcholinesterase properties. J. Funct. Foods 2017, 29, 1–9. [Google Scholar] [CrossRef]
  27. Antognoni, F.; Iannello, C.; Mandrone, M.; Scognamiglio, M.; Fiorentino, A.; Giovannini, P.P.; Poli, F. Elicited Teucrium chamaedrys cell cultures produce high amounts of teucrioside, but not the hepatotoxic neo-clerodane diterpenoids. Phytochemistry 2012, 81, 50–59. [Google Scholar] [CrossRef] [PubMed]
  28. Gross, G.-A.; Lahloub, M.F.; Anklin, C.; Schulten, H.-R.; Sticher, O. Teucrioside, a phenylpropanoid glycoside from Teucrium chamaedrys. Phytochemistry 1988, 27, 1459–1463. [Google Scholar] [CrossRef]
  29. Scognamiglio, M.; Fiumano, V.; D’Abrosca, B.; Esposito, A.; Choi, Y.H.; Verpoorte, R.; Fiorentino, A. Chemical interactions between plants in Mediterranean vegetation: The influence of selected plant extracts on Aegilops geniculata metabolome. Phytochemistry 2014, 106, 69–85. [Google Scholar] [CrossRef]
  30. Li, R.; Morris-Natschke, S.L.; Lee, K.H. Clerodane diterpenes: Sources, structures, and biological activities. Nat. Prod. Rep. 2016, 33, 1166–1226. [Google Scholar] [CrossRef] [Green Version]
  31. Fiorentino, A.; D’Abrosca, B.; Esposito, A.; Izzo, A.; Pascarella, M.T.; D’Angelo, G.; Monaco, P. Potential allelopathic effect of neo-clerodane diterpenes from Teucrium chamaedrys (L.) on stenomediterranean and weed cosmopolitan species. Biochem. Syst. Ecol. 2009, 37, 349–353. [Google Scholar] [CrossRef]
  32. Fiorentino, A.; D’Abrosca, B.; Ricci, A.; Pacifico, S.; Piccolella, S.; Monaco, P. Structure determination of chamaedryosides A—C, three novel nor-neo-clerodane glucosides from Teucrium chamaedrys by NMR spectroscopy. Magn. Reson. Chem. 2009, 47, 1007–1012. [Google Scholar] [CrossRef] [PubMed]
  33. Prior, R.L.; Hoang, H.; Gu, L.; Wu, X.; Bacchiocca, M.; Howard, L.; Hampsch-Woodill, M.; Huang, D.; Ou, B.; Jacob, R. Assays for hydrophilic and lipophilic antioxidant capacity (Oxygen Radical Absorbance Capacity (ORACFL)) of plasma and other biological and food samples. J. Agric. Food Chem. 2003, 51, 3273–3279. [Google Scholar] [CrossRef] [PubMed]
  34. Candela, L.; Formato, M.; Crescente, G.; Piccolella, S.; Pacifico, S. Coumaroyl flavonol glycosides and more in marketed green teas: An intrinsic value beyond much-lauded catechins. Molecules 2020, 25, 1765. [Google Scholar] [CrossRef] [PubMed] [Green Version]
  35. Elizondo, G.; Medina-Diaz, L.M. Induction of CYP3A4 by 1α,25-dyhydroxyvitamin D3 in HepG2 cells. Life Sci. 2003, 73, 141–149. [Google Scholar] [CrossRef]
Figure 1. Fractionation scheme of T. chamaedrys leaf methanolic parental extract (TchM1).
Biomolecules 11 00690 g001
Figure 2. NMR profile of: (a) TchM1 extract; (b) TchM2 and (c) TchE2 fractions.
Biomolecules 11 00690 g002
Figure 3. Chemical structures of the main constituents in TchM1 extract, and fractions therefrom.
Biomolecules 11 00690 g003
Figure 4. Antioxidant capacity (AC %) of •TchM1 and of all the extracts deriving from its phytochemical fractionation: •TchW1 (TchW2, TchM2) and •TchE1 (TchC1, TchE2, TchM3), estimated as (a) DPPH RSC; (b) ABTS+ RSC; (c) ΔAUC; (d) Mo(VI) RP. Values are expressed as % (mean ± SD). (RSC = Radical Scavenging Capacity; AUC = Area Under Curve; RP = Reducing Power).
Biomolecules 11 00690 g004
Figure 5. Cell viability inhibition (CVI%) of (a) HepG2, (b) HeLa and (c) A549 cell lines, treated with increasing doses of TchM1 and of all the extracts deriving from its phytochemical fractionation: TchW1 (TchW2, TchM2) and TchE1 (TchC1, TchE2, TchM3), estimated after 24 and 48 h exposure times. Values are expressed as % (mean ± SD).
Biomolecules 11 00690 g005
Figure 6. Principal component analysis (PCA) correlation biplot of investigated fractions, obtained using the data sets from antioxidant capability tests (DPPH, ABTS, ORAC and Mo(VI)RP) and CVI% on HepG2, HeLa and A549 cell lines.
Biomolecules 11 00690 g006
Table 1. Metabolites identified in T. chamaedrys L. subsp. chamaedrys fractions. The confidence level for the identification of each metabolite is indicated by the superscript numbers after the name of each compound (1–4, in accordance with the rules reported in the experimental section).
CompoundsTchW1TchE1
TchW2TchM2TchC1TchE2TchM3
Teucrioside 1 Biomolecules 11 00690 i001 Biomolecules 11 00690 i002
Other phenolic compounds 4 Biomolecules 11 00690 i002
Teucrin A 2 Biomolecules 11 00690 i002
Teuchamaedrin A 2 Biomolecules 11 00690 i002
Teucrin G 3 Biomolecules 11 00690 i002
Teucrin F 3 Biomolecules 11 00690 i002
Chamaedroxide 3 Biomolecules 11 00690 i002
Teuflidin 3 Biomolecules 11 00690 i002
Chamaedryosides A-C 3 Biomolecules 11 00690 i002
Other neo-clerodane diterpenes 4 Biomolecules 11 00690 i002 Biomolecules 11 00690 i002
Fatty acids 3 Biomolecules 11 00690 i002
Alanine 2 Biomolecules 11 00690 i001
Isoleucine 2 Biomolecules 11 00690 i001
Threonine 2 Biomolecules 11 00690 i001
Valine 2 Biomolecules 11 00690 i001
Glucose 2 Biomolecules 11 00690 i001
Sucrose 2 Biomolecules 11 00690 i001
Acetic acid 2 Biomolecules 11 00690 i001
Other organic acids 4 Biomolecules 11 00690 i001
Publisher’s Note: MDPI stays neutral with regard to jurisdictional claims in published maps and institutional affiliations.