
Bone Health in Aging Men: Does Zinc and Cuprum Level Matter?

 , , ,
, , ,
Abstract
1. Introduction
2. Materials and Methods
2.1. Study Participants
2.2. Determination of Sex Hormones and Bone Remodeling Markers
2.3. Determination of Serum and Bone Zn and Cu
2.4. Densitometry
2.5. Statistical Analysis
3. Results
3.1. Characteristics of Study Participants
3.2. Associations of Zn and Cu with Study Variables
4. Discussion
Author Contributions
Funding
Institutional Review Board Statement
Informed Consent Statement
Conflicts of Interest
References
- Carnevale, V.; Romagnoli, E.; Cipriani, C.; Del Fiacco, R.; Piemonte, S.; Pepe, J.; Scillitani, A.; Minisola, S. Sex hormones and bone health in males. Arch. Biochem. Biophys. 2010, 503, 110–117. [Google Scholar] [CrossRef]
- Decaroli, M.C.; Rochira, V. Aging and sex hormones in males. Virulence 2017, 8, 545–570. [Google Scholar] [CrossRef]
- Hejazi, J.; Davoodi, A.; Khosravi, M.; Sedaghat, M.; Abedi, V.; Hosseinverdi, S.; Ehrampoush, E.; Homayounfar, R.; Shojaie, L. Nutrition and osteoporosis prevention and treatment. BMRAT 2020, 7, 3709–3720. [Google Scholar]
- Pepa, G.D.; Brandi, M.L. Microelements for bone boost: The last but not the least. Clin. Cases Miner. Bone Metab. 2016, 13, 181–185. [Google Scholar]
- O’Connor, J.P.; Kanjilal, D.; Teitelbaum, M.; Lin, S.S.; Cottrell, J.A. Zinc as a therapeutic agent in bone regeneration. Materials 2020, 13, 2211. [Google Scholar] [CrossRef]
- Alghadir, A.H.; Gabr, S.A.; Al-Eisa, E.S.; Alghadir, M.H. Correlation between bone mineral density and serum trace elements in response to supervised aerobic training in older adults. Clin. Interv. Aging 2016, 11, 265–273. [Google Scholar]
- Gür, A.; Colpan, L.; Nas, K.; Cevik, R.; Saraç, J.; Erdoğan, F.; Düz, M.Z. The role of trace minerals in the pathogenesis of postmenopausal osteoporosis and a new effect of calcitonin. J. Bone Miner. Metab. 2002, 20, 39–43. [Google Scholar] [CrossRef]
- Ciancaglini, P.; Pizauro, J.M.; Grecchi, M.J.; Curti, C.; Leone, F.A. Effect of Zn(II) and Mg(II) on phosphohydrolytic activity of rat matrix-induced alkaline phosphatase. Cell. Mol. Biol. 1989, 35, 503–510. [Google Scholar] [PubMed]
- Liang, D.; Yang, M.; Guo, B.; Cao, J.; Yang, L.; Guo, X. Zinc up regulates the expression of osteoprotegerin in mouse osteoblasts MC3T3E1 through PKC/MAPK pathways. Biol. Trace Elem. Res. 2012, 146, 340–348. [Google Scholar] [CrossRef] [PubMed]
- Gaier, E.D.; Kleppinger, A.; Ralle, M.; Mains, R.E.; Kenny, A.M.; Eipper, B.A. High serum Cu and Cu/Zn ratios correlate with impairments in bone density, physical performance and overall health in a population of elderly men with frailty characteristics. Exp. Gerontol. 2012, 47, 491–496. [Google Scholar] [CrossRef]
- Malavolta, M.; Piacenza, F.; Basso, A.; Giacconi, R.; Costarelli, L.; Mocchegiani, E. Serum copper to zinc ratio: Relationship with aging and health status. Mech. Ageing Dev. 2015, 151, 93–100. [Google Scholar] [CrossRef] [PubMed]
- Kim, J.H.; Jeon, J.; Shin, M.; Won, Y.; Lee, M.; Kwak, J.S.; Lee, G.; Rhee, J.; Ryu, J.H.; Chun, C.H.; et al. Regulation of the catabolic cascade in osteoarthritis by the zinc-ZIP8-MTF1 axis. Cell 2014, 156, 730–743. [Google Scholar] [CrossRef]
- Frangos, T.; Maret, W. Zinc and cadmium in the aetiology and pathogenesis of osteoarthritis and rheumatoid arthritis. Nutrients 2020, 13, 53. [Google Scholar] [CrossRef] [PubMed]
- Vermeulen, A.; Verdonck, L.; Kaufman, J.M. A critical evaluation of simple methods for the estimation of free testosterone in serum. J. Clin. Endocrinol. Metab. 1999, 84, 3666–3672. [Google Scholar] [CrossRef]
- Morris, P.D.; Malkin, C.J.; Channer, K.S.; Jones, T.H. A mathematical comparison of techniques to predict biologically available testosterone in a cohort of 1072 men. Eur. J. Endocrinol. 2004, 151, 241–249. [Google Scholar] [CrossRef][Green Version]
- Kalisinska, E.; Lanocha-Arendarczyk, N.; Kosik-Bogacka, D.; Budis, H.; Pilarczyk, B.; Tomza-Marciniak, A.; Podlasinska, J.; Cieslik, L.; Popiolek, M.; Pirog, A.; et al. Muscle mercury and selenium in fishes and semiaquatic mammals from a selenium-deficient area. Ecotoxicol. Environ. Saf. 2017, 136, 24–30. [Google Scholar] [CrossRef]
- Kim, K.M.; Jang, H.C.; Lim, S. Differences among skeletal muscle mass indices derived from height-, weight-, and body mass index-adjusted models in assessing sarcopenia. Korean J. Intern. Med. 2016, 31, 643–650. [Google Scholar] [CrossRef]
- Park, B.S.; Yoon, J.S. Relative skeletal muscle mass is associated with development of metabolic syndrome. Diabetes Metab. J. 2013, 37, 458–464. [Google Scholar] [CrossRef]
- Cruz-Jentoft, A.J.; Baeyens, J.P.; Bauer, J.M.; Boirie, Y.; Cederholm, T.; Landi, F.; Martin, F.C.; Michel, J.P.; Rolland, Y.; Schneider, S.M.; et al. Sarcopenia: European consensus on definition and diagnosis: Report of the European Working Group on Sarcopenia in Older People. Age Ageing 2010, 39, 412–423. [Google Scholar] [CrossRef]
- Fang, M.; Noiseux, N.; Linson, E.; Cram, P. The effect of advancing age on total joint replacement outcomes. Geriatr. Orthop. Surg. Rehabil. 2015, 6, 173–179. [Google Scholar] [CrossRef] [PubMed]
- Cnudde, P.; Rolfson, O.; Timperley, A.J.; Garland, A.; Karrholm, J.; Garellick, G.; Nemes, S. Do patients live longer after THA and is the relative survival diagnosis-specific? Clin. Orthop. Relat. Res. 2018, 476, 1166–1175. [Google Scholar] [CrossRef]
- Malavolta, M.; Giacconi, R.; Piacenza, F.; Santarelli, L.; Cipriano, C.; Costarelli, L.; Tesei, S.; Pierpaoli, S.; Basso, A.; Galeazzi, R.; et al. Plasma copper/zinc ratio: An inflammatory/nutritional biomarker as predictor of all-cause mortality in elderly population. Biogerontology 2010, 11, 309–319. [Google Scholar] [CrossRef]
- Leone, N.; Courbon, D.; Ducimetiere, P.; Zureik, M. Zinc, copper, and magnesium and risks for all-cause, cancer, and cardiovascular mortality. Epidemiology 2006, 17, 308–314. [Google Scholar] [CrossRef]
- Cunzhi, H.; Jiexian, J.; Xianwen, Z.; Jingang, G.; Shumin, Z.; Lili, D. Serum and tissue levels of six trace elements and copper/zinc ratio in patients with cervical cancer and uterine myoma. Biol. Trace Elem. Res. 2003, 94, 113–122. [Google Scholar] [CrossRef]
- Lowe, N.M.; Medina, M.W.; Stammers, A.L.; Patel, S.; Souverein, O.W.; Dullemeijer, C.; Serra-Majem, L.; Nissensohn, M.; Hall Moran, V. The relationship between zinc intake and serum/plasma zinc concentration in adults: A systematic review and dose-response meta-analysis by the EURRECA Network. Br. J. Nutr. 2012, 108, 1962–1971. [Google Scholar] [CrossRef]
- Araya, M.; Olivares, M.; Pizarro, F.; González, M.; Speisky, H.; Uauy, R. Copper exposure and potential biomarkers of copper metabolism. Biometals 2003, 16, 199–204. [Google Scholar] [CrossRef]
- Milanino, R.; Marrella, M.; Gasperini, R.; Pasqualicchio, M.; Velo, G. Copper and zinc body levels in inflammation: An overview of the data obtained from animal and human studies. Agents Actions 1993, 39, 195–209. [Google Scholar] [CrossRef]
- Chaudhri, M.A.; Kemmler, W.; Harsch, I.; Watling, R.J. Plasma copper and bone mineral density in osteopenia: An indicator of bone mineral density in osteopenic females. Biol. Trace Elem. Res. 2009, 129, 94–98. [Google Scholar] [CrossRef]
- Qu, X.; He, Z.; Qiao, H.; Zhai, Z.; Mao, Z.; Yu, Z.; Dai, K. Serum copper levels are associated with bone mineral density and total fracture. J. Orthop. Transl. 2018, 14, 34–44. [Google Scholar] [CrossRef] [PubMed]
- Sadeghi, N.; Oveisi, M.R.; Jannat, B.; Hajimahmoodi, M.; Behzad, M.; Behfar, A.; Sadeghi, F.; Saadatmand, S. The relationship between bone health and plasma zinc, copper lead and cadmium concentration in osteoporotic women. J. Environ. Health Sci. Eng. 2014, 12, 125. [Google Scholar] [CrossRef] [PubMed]
- Mutlu, M.; Argun, M.; Kilic, E.; Saraymen, R.; Yazar, S. Magnesium, zinc and copper status in osteoporotic, osteopenic and normal post-menopausal women. J. Int. Med. Res. 2007, 35, 692–695. [Google Scholar] [CrossRef]
- Mahdavi-Roshan, M.; Ebrahimi, M.; Ebrahimi, A. Copper, magnesium, zinc and calcium status in osteopenic and osteoporotic post-menopausal women. Clin. Cases Miner. Bone Metab. 2015, 12, 18–21. [Google Scholar] [CrossRef] [PubMed]
- Razmandeh, R.; Nasli-Esfahani, E.; Heydarpour, R.; Faridbod, F.; Ganjali, M.R.; Norouzi, P.; Larijani, B.; Khoda-Amorzideh, D. Association of zinc, copper and magnesium with bone mineral density in Iranian postmenopausal women—A case control study. J. Diabetes Metab. Dis. 2014, 13, 1–6. [Google Scholar] [CrossRef]
- Qu, X.; Yang, H.; Yu, Z.; Jia, B.; Qiao, H.; Zheng, Y.; Dai, K. Serum zinc levels and multiple health outcomes: Implications for zinc-based biomaterials. Bioact. Mater. 2020, 5, 410–422. [Google Scholar] [CrossRef]
- Arikan, D.C.; Coskun, A.; Ozer, A.; Kilinc, M.; Atalay, F.; Arikan, T. Plasma selenium, zinc, copper and lipid levels in postmenopausal Turkish women and their relation with osteoporosis. Biol. Trace Elem. Res. 2011, 144, 407–417. [Google Scholar] [CrossRef]
- Siddapur, P.R.; Patil, A.B.; Borde, V.S. Comparison of bone mineral density, t-scores and serum zinc between diabetic and non diabetic postmenopausal women with osteoporosis. J. Lab. Phys. 2015, 7, 43–48. [Google Scholar] [CrossRef]
- Ceylan, M.N.; Akdas, S.; Yazihan, N. Is zinc an important trace element on bone-related diseases and complications? A meta-analysis and systematic review from serum level, dietary intake, and supplementation aspects. Biol. Trace Elem. Res. 2021, 199, 535–549. [Google Scholar] [CrossRef] [PubMed]
- Rył, A.; Rotter, I.; Szylińska, A.; Jurewicz, A.; Bohatyrewicz, A.; Miazgowski, T. Complex interplay among fat, lean tissue, bone mineral density and bone turnover markers in older men. Aging (Albany NY) 2020, 12, 19539–19545. [Google Scholar] [CrossRef] [PubMed]
- Zhu, K.; Hunter, M.; James, A.; Lim, E.M.; Cooke, B.R.; Walsh, J.P. Relationship between visceral adipose tissue and bone mineral density in Australian baby boomers. Osteoporos. Int. 2020, 31, 2439–2448. [Google Scholar] [CrossRef]
- Choi, H.S.; Kim, K.J.; Kim, K.M.; Hur, N.W.; Rhee, Y.; Han, D.S.; Lee, E.J.; Lim, S.K. Relationship between visceral adiposity and bone mineral density in Korean adults. Calcif. Tissue Int. 2010, 87, 218–225. [Google Scholar] [CrossRef]
- Liu, C.T.; Broe, K.E.; Zhou, Y.; Boyd, S.K.; Cupples, L.A.; Hannan, M.T.; Lim, E.; McLean, R.R.; Samelson, E.J.; Bouxsein, M.L.; et al. Visceral adipose tissue is associated with bone microarchitecture in the Framingham Osteoporosis Study. J. Bone Miner. Res. 2017, 32, 143–150. [Google Scholar] [CrossRef]
- Patel, H.P.; Dawson, A.; Westbury, L.D.; Hasnaoui, G.; Syddall, H.E.; Shaw, S.; Sayer, A.A.; Cooper, C.; Dennison, E.M. Muscle mass, muscle morphology and bone health among community-dwelling older men: Findings from the Hertfordshire Sarcopenia Study (HSS). Calcif. Tissue Int. 2018, 103, 35–43. [Google Scholar] [CrossRef] [PubMed]
- Kawao, N.; Kaji, H. Interactions between muscle tissues and bone metabolism. J. Cell. Biochem. 2015, 116, 687–695. [Google Scholar] [CrossRef] [PubMed]
- Rochira, V.; Kara, E.; Carani, C. The endocrine role of estrogens on human male skeleton. Int. J. Endocrinol. 2015, 2015, 165215. [Google Scholar] [CrossRef]
- Khosla, S.; Melton, L.J., III; Riggs, B.L. The unitary model for estrogen deficiency and the pathogenesis of osteoporosis: Is a revision needed? J. Bone Miner. Res. 2011, 26, 441–451. [Google Scholar] [CrossRef] [PubMed]


| Mean | SD | Range | |
|---|---|---|---|
| Anthropometric parameters | |||
| Age (years) | 67.05 | 4.35 | 60.00–75.0 |
| Weight (kg) | 90.63 | 15.17 | 51.00–130.0 |
| BMI (kg/m2) | 29.61 | 3.13 | 20.42–42.91 |
| Sex hormones | |||
| Total testosterone (ng/mL) | 4.76 | 2.12 | 0.52–12.9 |
| Free testosterone (pg/mL) | 9.19 | 3.34 | 1.61–23.45 |
| Bioavailable testosterone (ng/dL) | 1.94 | 0.92 | 0.13–5.06 |
| Estradiol (pg/mL) | 82.65 | 41.0 | 20.9–236.0 |
| SHBG (nmol/L) | 52.49 | 41.6 | 4.06–215.5 |
| DHEAS (µg/dL) | 81.03 | 66.32 | 9.45–407.4 |
| Markers of bone turnover | |||
| CTX-I (ng/mL) | 0.44 | 0.21 | 0.06–1.80 |
| PTH (pg/mL) | 36.49 | 22.32 | 2.70–161.3 |
| Osteocalcin (ng/mL) | 6.33 | 4.11 | 0.20–29.94 |
| PINP (ng/mL) | 938.1 | 917.7 | 5.82–3689 |
| Serum Zn and Cu | |||
| Zn (µmol/L) | 21.71 | 6.07 | 3.5–46.55 |
| Cu (µmol/L) | 15.66 | 3.32 | 3.81–30.51 |
| Zn/Cu ratio | 1.42 | 0.46 | 0.49–3.90 |
| Bone Zn and Cu | |||
| Zn (µmol/kg) | 2908.7 | 841.63 | 1041–5301 |
| Cu (µmol/kg) | 23.48 | 16.01 | 2.64–117.2 |
| Zn/Cu ratio | 171.72 | 115.41 | 29.53–611.9 |
| Densitometry | |||
| Total body BMD (g/cm2) | 1.25 | 0.15 | 0.99–1.56 |
| Total body BMD (z-score) | 0.44 | 1.25 | −2.2–2.1 |
| BMC (g) | 3051.2 | 395.65 | 2086–4012 |
| Fat (kg) | 31.57 | 6.986 | 13.89–47.27 |
| Fat (%) | 35.58 | 5.72 | 10.02–44.71 |
| Visceral fat (kg) | 2.65 | 0.92 | 0.42–4.80 |
| Lean mass (kg) | 55.04 | 6.76 | 39.94–74.59 |
| ASMI (kg/m2) | 8.08 | 1.0 | 6.32–11.8 |
| Normal | Low | High | |
|---|---|---|---|
| Sex hormones | |||
| Total testosterone | 132 (92%) | 12 (8%) | |
| Free testosterone | 140 (97%) | 4 (3%) | |
| Bioavailable testosterone | 139 (96.5%) | 5 (3.5%) | |
| Estradiol | 73 (51%) | 71 (49%) | |
| SHGB | 111 (77%) | 18 (12.5%) | 15 (10.5%) |
| Markers of bone turnover | |||
| Osteocalcin | 85 (59%) | 59 (41%) | |
| Parathyroid hormone | 130 (90%) | 14 (10%) | |
| CTX-I | 126 (87.5%) | 18 (12.5%) | |
| PINP | 119 (82.5%) | 7 (5%) | 18 (12.5%) |
| Serum | Bone | |||||
|---|---|---|---|---|---|---|
| Zn/Cu Ratio | Zn | Cu | Zn/Cu Ratio | Zn | Cu | |
| Age | −0.223 | −0.087 | 0.502 | −0.153 | −0.101 | 0.231 |
| p = 0.253 | p = 0.659 | p = 0.006 | p = 0.435 | p = 0.607 | p = 0.834 | |
| BMI | 0.006 | −0.086 | −0.295 | 0.070 | 0.142 | 0.0041 |
| p = 0.976 | p = 0.662 | p = 0.127 | p = 0.720 | p = 0.468 | p = 0.834 | |
| TT | 0.268 | 0.175 | −0.189 | 0.237 | −0.009 | −0.275 |
| p = 0.168 | p = 0.373 | 0.333 | p = 0.224 | p = 0.961 | p = 0.157 | |
| FT | 0.730 | 0.543 | −0.527 | 0.117 | 0.161 | −0.178 |
| p < 0.001 | p = 0.002 | p = 0.004 | p = 0.552 | 0.411 | p = 0.365 | |
| bioT | 0.666 | 0.548 | −0.445 | 0.179 | 0.185 | −0.255 |
| p < 0.001 | p = 0.003 | p = 0.018 | p = 0.360 | p = 0.345 | p = 0.189 | |
| E2 | 0.204 | 0.245 | −0.044 | 0.096 | 0.009 | −0.305 |
| p = 0.296 | p = 0.208 | p = 0.822 | p = 0.626 | p = 0.961 | p = 0.114 | |
| PINP | 0.294 | 0.265 | −0.192 | 0.171 | 0.127 | −0.216 |
| p = 0.128 | p = 0.172 | p = 0.327 | p = 0.382 | p = 0.517 | p = 0.811 | |
| SHGB | −0.189 | −0.172 | 0.172 | 0.081 | −0.165 | −0.047 |
| p = 0.333 | p = 0.382 | p = 0.380 | p = 0.681 | p = 0.401 | p = 0.811 | |
| DHEAS | 0.348 | 0.343 | −0.114 | 0.227 | 0.122 | −0.233 |
| p = 0.069 | p = 0.074 | p = 0.563 | p = 0.244 | p = 0.534 | p = 0.231 | |
| CTX-I | −0.307 | −0.300 | 0.140 | −0.099 | 0.050 | 0.039 |
| p = 0.111 | p = 0.120 | p = 0.477 | p = 0.614 | p = 0.800 | p = 0.843 | |
| PTH | −0.041 | −0.030 | −0.013 | 0.017 | 0.368 | −0.142 |
| p = 0.832 | p = 0.877 | p = 0.945 | p = 0.930 | p = 0.054 | p = 0.471 | |
| OC | −0.169 | −0.145 | 0.137 | 0.013 | 0.310 | −0.040 |
| p = 0.389 | p = 0.460 | p = 0.486 | p = 0.947 | p = 0.108 | p = 0.840 | |
| BMD | 0.339 | 0.225 | −0.365 | 0.299 | 0.400 | −0.240 |
| p = 0.078 | p = 0.249 | p = 0.055 | p = 0.122 | p = 0.035 | p = 0.219 | |
| BMC | 0.475 | 0.319 | −0.413 | 0.375 | 0.470 | −0.244 |
| p = 0.011 | p = 0.098 | p = 0.029 | p = 0.049 | p = 0.012 | p = 0.211 | |
| ASMI | 0.205 | 0.002 | −0.535 | 0.293 | 0.339 | −0.205 |
| p = 0.293 | p = 989 | p = 0.003 | p = 0.130 | 0.077 | p = 0.295 | |
| Bone Mineral Density | Bone Mineral Content | |||
|---|---|---|---|---|
| R | p-Value | R | p-Value | |
| Age | −0.294 | 0.077 | −0.090 | 0.595 |
| BMI | 0.531 | 0.001 | 0.477 | 0.003 |
| Total testosterone | 0.061 | 0.718 | 0.196 | 0.243 |
| Free testosterone | 0.152 | 0.367 | 0.179 | 0.287 |
| Bioavailable testosterone | 0.181 | 0.283 | 0.220 | 0.190 |
| Estradiol | −0.085 | 0.614 | −0.186 | 0.270 |
| SHBG | −0.140 | 0.407 | 0.008 | 0.960 |
| DHEAS | 0.146 | 0.389 | 0.105 | 0.536 |
| Total fat | 0.397 | 0.015 | 0.403 | 0.013 |
| Visceral fat | 0.335 | 0.015 | 0.356 | 0.030 |
| ASMI | 0.504 | 0.001 | 0.473 | 0.003 |
| Total Bone Mineral Density | Bone Mineral Content | |||||||
|---|---|---|---|---|---|---|---|---|
| Beta | p-Value | 95% CI | Beta | p-Value | 95% CI | |||
| Low | High | Low | High | |||||
| Sex hormones | ||||||||
| FT | 0.150 | 0.364 | −0.182 | 0.484 | 0.268 | 0.122 | −0.075 | 0.613 |
| bioT | 0.156 | 0.334 | −0.159 | 0.168 | 0.280 | 0.097 | −0.053 | 0.614 |
| E2 | −0.115 | 0.436 | −0.410 | 0.180 | −0.183 | 0.212 | −0.475 | 0.108 |
| Serum Zn and Cu | ||||||||
| Zn | 0.108 | 0.443 | −0.172 | 0.387 | 0.115 | 0.414 | −0.165 | 0.394 |
| Cu | −0.324 | 0.018 | −0.590 | −0.058 | −0.349 | 0.010 | −0.612 | −0.085 |
| Zn/Cu ratio | 0.286 | 0.023 | 0.041 | 0.532 | 0.299 | 0.030 | 0.031 | 0.567 |
| Bone Zn and Cu | ||||||||
| Zn | 0.286 | 0.070 | −0.024 | 0.597 | 0.207 | 0.195 | −0.110 | 0.523 |
| Cu | −0.253 | 0.111 | −0.566 | 0.061 | −0.255 | 0.108 | −0.568 | 0.058 |
| Zn/Cu ratio | 0.330 | 0.035 | 0.024 | 0.636 | 0.346 | 0.027 | 0.042 | 0.650 |
| Densitometric parameters | ||||||||
| Total fat | 0.011 | 0.955 | −0.386 | 0.408 | 0.148 | 0.472 | −0.265 | 0.562 |
| Visceral fat | 0.041 | 0.786 | −0.262 | 0.344 | 0.106 | 0.501 | −0.210 | 0.423 |
| ASMI | 0.334 | 0.035 | 0.024 | 0.644 | 0.352 | 0.034 | 0.027 | 0.676 |
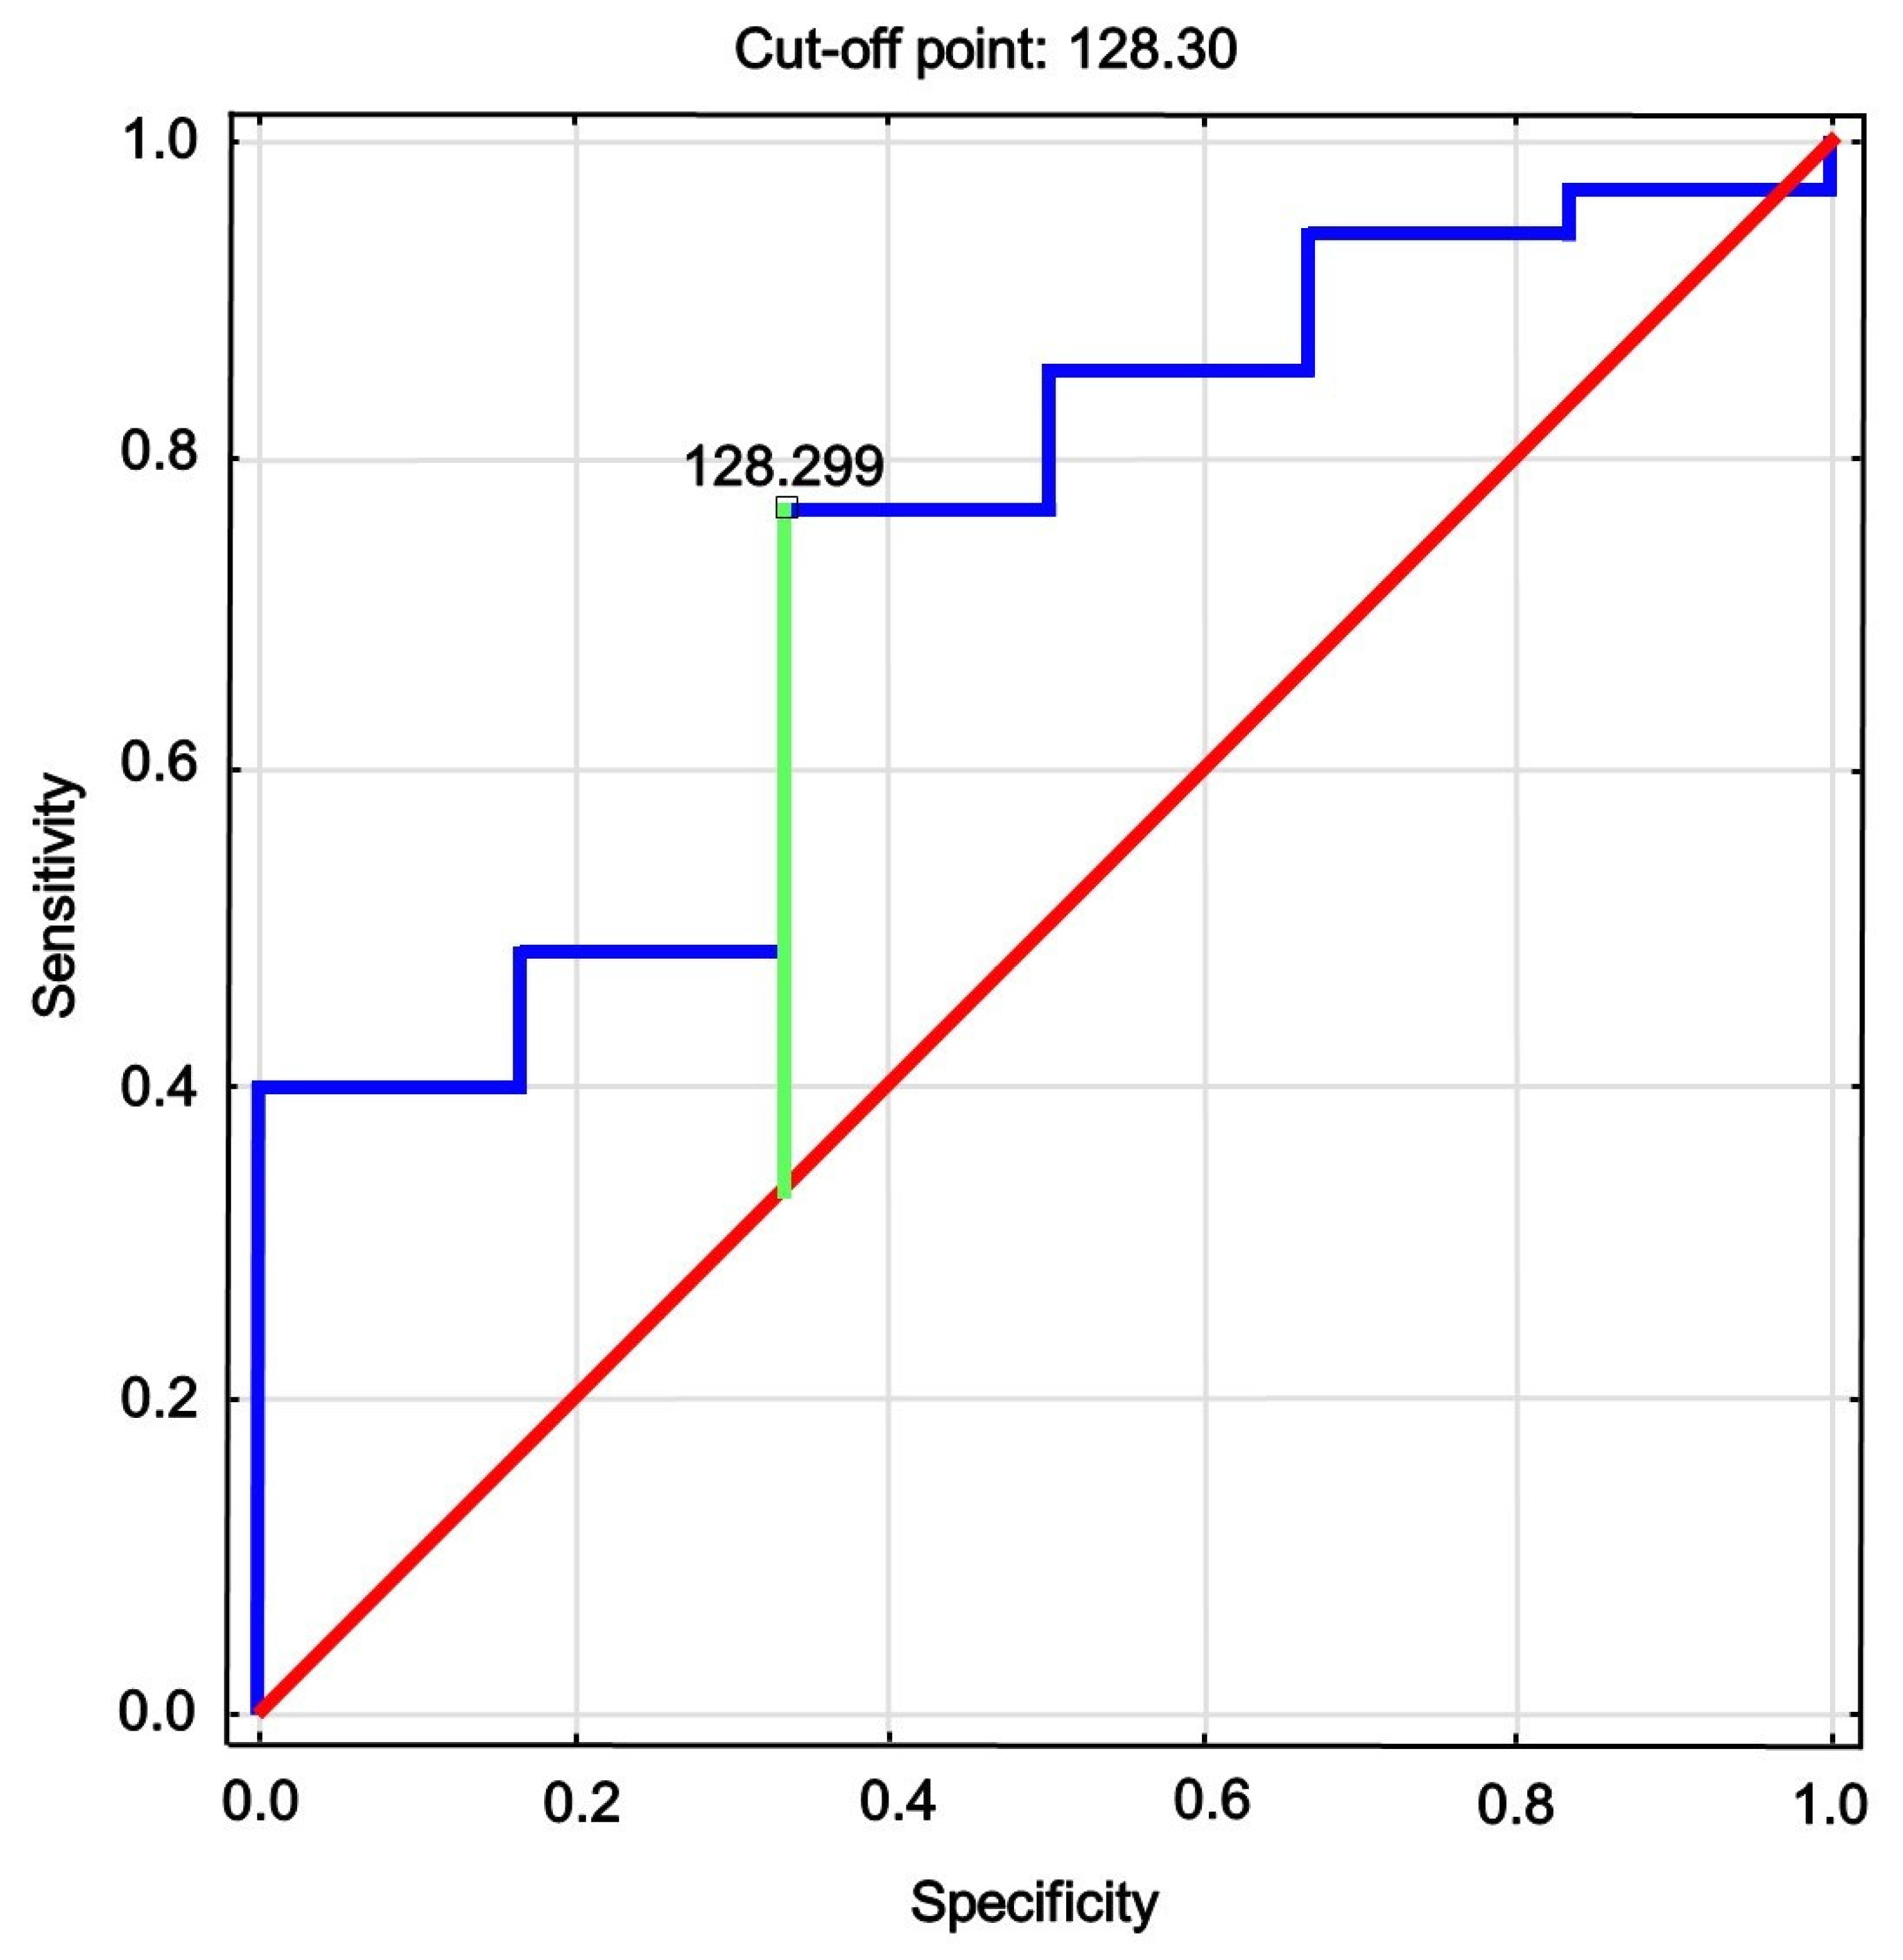
| AUC | 95% CI | p-Value | Cutoff | Sensitivity | Specificity | Youden’s Index |
|---|---|---|---|---|---|---|
| 0.738 | 0.537; 0.939 | 0.020 | 128.3 | 0.78 | 0.34 | 0.44 |
Publisher’s Note: MDPI stays neutral with regard to jurisdictional claims in published maps and institutional affiliations. |
© 2021 by the authors. Licensee MDPI, Basel, Switzerland. This article is an open access article distributed under the terms and conditions of the Creative Commons Attribution (CC BY) license (http://creativecommons.org/licenses/by/4.0/).
Share and Cite
Rył, A.; Miazgowski, T.; Szylińska, A.; Turoń-Skrzypińska, A.; Jurewicz, A.; Bohatyrewicz, A.; Rotter, I. Bone Health in Aging Men: Does Zinc and Cuprum Level Matter? Biomolecules 2021, 11, 237. https://doi.org/10.3390/biom11020237
Rył A, Miazgowski T, Szylińska A, Turoń-Skrzypińska A, Jurewicz A, Bohatyrewicz A, Rotter I. Bone Health in Aging Men: Does Zinc and Cuprum Level Matter? Biomolecules. 2021; 11(2):237. https://doi.org/10.3390/biom11020237
Chicago/Turabian StyleRył, Aleksandra, Tomasz Miazgowski, Aleksandra Szylińska, Agnieszka Turoń-Skrzypińska, Alina Jurewicz, Andrzej Bohatyrewicz, and Iwona Rotter. 2021. "Bone Health in Aging Men: Does Zinc and Cuprum Level Matter?" Biomolecules 11, no. 2: 237. https://doi.org/10.3390/biom11020237
APA StyleRył, A., Miazgowski, T., Szylińska, A., Turoń-Skrzypińska, A., Jurewicz, A., Bohatyrewicz, A., & Rotter, I. (2021). Bone Health in Aging Men: Does Zinc and Cuprum Level Matter? Biomolecules, 11(2), 237. https://doi.org/10.3390/biom11020237