Abstract
Several pathogens continuously threaten viticulture worldwide. Until now, the investigation on resistance loci has been the main trend to understand the interaction between grapevine and the mildew causal agents. Dominantly inherited gene-based resistance has shown to be race-specific in some cases, to confer partial immunity, and to be potentially overcome within a few years since its introgression. Recently, on the footprint of research conducted in Arabidopsis, putative genes associated with downy mildew susceptibility have been discovered also in the grapevine genome. In this work, we deep-sequenced four putative susceptibility genes—namely VvDMR6.1, VvDMR6.2, VvDLO1, VvDLO2—in 190 genetically diverse grapevine genotypes to discover new sources of broad-spectrum and recessively inherited resistance. Identified Single Nucleotide Polymorphisms were screened in a bottleneck analysis from the genetic sequence to their impact on protein structure. Fifty-five genotypes showed at least one impacting mutation in one or more of the scouted genes. Haplotypes were inferred for each gene and two of them at the VvDMR6.2 gene were found significantly more represented in downy mildew resistant genotypes. The current results provide a resource for grapevine and plant genetics and could corroborate genomic-assisted breeding programs as well as tailored gene editing approaches for resistance to biotic stresses.
Keywords:
disease resistance; DLO; DMR; next-gen amplicon sequencing; SNP; susceptibility genes; Vitis spp. 1. Introduction
The development of disease-resistant varieties is a convenient alternative to chemical control methods to protect crops from diseases. When it recognizes and invades plant tissues and a plant-pathogen interaction is established, the pathogen is faced with the host response, which involves the activation of signals that translate into a rapid defense response. This immune response helps the host plant to avoid further infection of the pathogen [1]. To suppress this immunity, pathogens produce effector molecules to alter host responses and support compatibility. In turn, plants evolved the ability to recognize these effectors by resistance (R) genes. The majority of R genes encode nucleotide-binding leucine-rich-repeat (NBS-LRR) proteins. Since R genes are specifically directed towards highly polymorphic effector molecules or their derivatives, this kind of immunity is dominantly inherited, mostly race-specific, and rapidly overcome by the capacity of the pathogen to mutate [2]. Analyses of whole-genome sequences have provided and will continue to provide new insights into the dynamics of R gene evolution [3].
Besides the established R gene model, the susceptibility (S) gene model was more recently defined. All plant genes that facilitate infection and support compatibility can be considered S genes [4]. They can be classified into the following three groups based on the point at which they act during infection: those involved in early pathogen establishment, those involved in modulation of host defenses, and those involved in pathogen sustenance [5]. The concept of susceptibility genes was first explored in barley by Jorgensen (1992) [6] with the MLO (Mildew resistance Locus O) gene involved in susceptibility to powdery mildew. Later, mlo mutants were identified also in cucumber, melon, pea, tomato, and tobacco [7]. Other analyzed susceptibility genes are the so called DMR (Downy Mildew Resistant) genes firstly characterized in Arabidopsis by Van Damme et al. (2005; 2008) [8,9], and DLO (DMR-like Oxygenases) [10]. DMR6 and DLO are paralogs, their separation occurred prior to the appearance of flowering plants [11]. Both genes encode a 2-oxoglutarate (2OG)-Fe(II) oxygenase [9,10]. The putative functions of DMR6 and DLO were defined by Zhang et al. (2013) and Zhang et al. (2017) [10,12]. DMR6 and DLO are involved in salicylic acid (SA) catabolism. More specifically, DMR6 functions as a SA-5-hydroxylase (S5H) whereas DLO functions as a S3H, converting the active molecule of SA into 2,5-DHBA (dihydrobenzenic acid), and 2,3-DHBA inactive forms, respectively [10,12]. Being involved in SA catabolism, DMR6 and DLOs fall into the category of S genes acting in the negative regulation of immune signaling. Their inactivation could improve plant resistance. Initially the Arabidopsis thaliana dmr6 mutant was isolated from a chemically mutagenized population for its resistance to Hyaloperonospora arabidopsidis, the downy mildew (DM) causal agent in this species [8]. Orthologues were readily identified in tomato [13] as well as many other crops [14,15] and fruit trees [11,16]. Mutations in DMR6 confer broad-spectrum resistance; Sldmr6-1 tomato mutant plants show resistance against Phytophthora capsici, Pseudomonas siringae, and Xanthomonas spp. [13].
In order to identify mutations and to deepen their impact on plant performance, studies of genetic diversity are essential and have been extensively performed in the plant kingdom, although compared to animals and humans their sequel is still in its infancy. A SNP (Single Nucleotide Polymorphism) provides the ultimate form of molecular marker, based on differences of individual nucleotide bases between DNA sequences [17]. SNPs are more abundant in the genome and more stably inherited than other genetic markers [18] and they can be classified into random, gene targeted, or functional markers according to their localization [19]. The discovery of functional SNPs—that cause phenotype variations—is challenging and scarcely described in the literature. In particular, functional SNPs were used to target flowering time and seed size in lentil [20], midrib color in sorghum [21], leaf hair number in turnip [16], grain length [22], and blast resistance in rice [23].
A variety of approaches have been adopted to identify novel SNPs [24]. In the last decade, computational approaches have dominated SNP discovery methods due to the advent of next-generation sequencing (NGS) [25], followed by third-generation sequencing platforms (TGS) [26], and the consequent ever-increasing sequence information in public databases. Since the first whole plant genome to be sequenced [27], de novo and reference-based SNP discovery and application are now feasible for numerous plant species. Large-scale SNP discovery was performed in almost all sequenced plant genomes such as maize [28], Arabidopsis [29], rice [30], rapeseed [31], potato [32], and pepper [33]. On the method side, Genotyping-By-Sequencing (GBS) has recently emerged as a promising genomic approach to explore plant genetic diversity on a genome-wide scale [34], followed by the more cost-effective Genotyping-in-Thousands by sequencing (GT-seq) [35]. Genetic applications such as linkage mapping, phylogenetics, population structure, association studies, map-based cloning, marker-assisted plant breeding, and functional genomics continue to be enabled by access to large collections of SNPs [36]. In parallel to SNP discovery based on whole genome sequencing, amplicon sequencing has also been successfully applied in plants [37,38,39,40] although less frequently than in bacteria [41] or viruses [42].
Recently, as advocated by Gupta et al. (2001) [43], progress has also been made in the development and use of SNPs in woody plants, including some crop and tree species as apple [44], walnut [45], sweet cherry [46], pear [47], coffee [48], and grapevine [49,50]. This phenomenon is due to the boost in the sequencing of cultivated plant genomes to provide high-density molecular markers for breeding programs aimed to crop improvement as well as to elucidate evolutionary mechanisms through comparative genomics [51,52]. In grapevine a great deal of progress has been made from the first SNP identification in the pre-genomic-era [53] to the sequencing of the whole genome of several Vitis vinifera cultivars [54,55,56,57,58,59], to the very recent report of the genome sequence of Vitis riparia [60] and the diploid chromosome-scale assembly of Muscadinia rotundifolia [61]. The last two studies represent a turning point on the scavenging of genomes that are donors of disease resistance traits. This issue in Vitis spp. is tackled by identifying R loci, underlying R genes, through quantitative trait loci (QTL) analysis in different genetic backgrounds. Nowadays, 13 R loci against powdery mildew and 31 to DM have been identified with different origins, mainly from American and Asian wild species [62,63].
A promising approach to cope with disease resistance is represented by the study of S loci. Based on a high-resolution map, Barba et al. (2014) [64] identified on chromosome 9 a locus (Sen1) for powdery mildew susceptibility from ‘Chardonnay’, finding evidence for quantitative variation. Moreover, on the footprint of research conducted on model plants, genes associated with mildew susceptibility have been discovered and dissected also in the grapevine genome. 17 VvMLO genes, orthologues of the Arabidopsis MLOs, were identified and a few members showed transcriptional induction upon fungal inoculation [65,66]. Lately, more insights in terms of powdery mildew resistance has been achieved by silencing of four VvMLO genes through RNAi in grapevine [67].
In this research, we aim to investigate the diversity of the DMR6 and DLO genes in a wide set of Vitis spp. to broaden our knowledge about the genetic variation present and about the impact on the protein structure and function. This information will represent a resource to enhance our knowledge of possible alternative or integrative solutions, as compared to the use of R loci to be applied in plant molecular breeding strategies.
2. Materials and Methods
2.1. Genetic Material and Target Genes
In the current study, the four VvDMR6.1, VvDMR6.2, VvDLO1, and VvDLO2 genes were scouted in 190 grapevine genotypes (Table 1, Table S1).

Table 1.
Investigated genes with Illumina amplicon primers and position.
Out of these, 139 (73%) are Vitis hybrids, 28 (15%) are V. vinifera varieties, 12 (6%) belong to wild Vitis species and additional 11 (6%) are ascribed as hybrids/wild species. Phenotypic data about DM resistance degrees were retrieved from literature, public databases, and unpublished information. Pairwise alignment [68] was performed in order to define nucleotide identity between investigated genes.
2.2. Amplicon Sequencing and Read Processing
Genomic DNA was extracted from young grapevine leaves using DNeasy Plant Mini Kit (QIAGEN, Hilden, Germany), according to the manufacturer’s protocol, and then used to produce amplicons for deep sequencing. PCR on the templates was performed using Phusion High-Fidelity Polymerase (NEB, Ipswich, MA, USA) according to the manufacturer’s protocol. Primers were specifically designed to amplify 250 bp of the coding regions of target genes and barcoded followed by in-house sequencing using the Illumina MiSeq platform (Table 1). A total of 19 amplicons was sequenced including six amplicons for VvDMR6.1, seven amplicons for VvDMR6.2, four amplicons for VvDLO1, and two amplicons for VvDLO2. Obtained amplicons were then mapped on the PN40024 12X reference genome [54] considering the latest V2 gene prediction [69,70] through Burrows–Wheeler alignment (BWA) [71] with no filter on mapping quality.
2.3. Sanger Sequencing
Thirteen impacting mutations (six in VvDMR6.1, two in VvDMR6.2, two in VvDLO1, three in VvDLO2) in 17 genotypes (12 hybrids, one V. vinifera, two wild species, two hybrids/wild species) in 25 combinations (Table S2) were chosen according to their representativeness of the overall results and to the availability of plants in situ. Previously extracted DNA was used to produce 12 targeted Sanger amplicons (six in VvDMR6.1, two in VvDMR6.2, two in VvDLO1, two in VvDLO2) by PCR using Phusion High-Fidelity DNA Polymerase (Thermo scientific) according to the manufacturer’s protocol. Purification was made enzymatically with ExoSAP-IT PCR Product Cleanup Reagent (Applied Biosystems Inc., Foster City, CA, USA) according to the manufacturer’s instructions. 3.2 μM of forward or reverse primer were then added to the sample and sequencing was performed using the BigDye Terminator Cycle Sequencing Ready Reaction Kit v3.1 (Applied Biosystems Inc.) in ten μL final volume. Sequencing reactions were performed using a 2 min initial denaturation step, followed by 25 cycles at 96 °C for 10 s, 50 °C for 5 s, and 60 °C for 4 min and then purified from unincorporated primer and BigDye excess through Multiscreen384SEQ Sequencing reaction Cleanup Plate (Millipore, Carrigtwohill, Co. Cork, Ireland). Capillary electrophoresis of the purified products was performed on a 3730 × l DNA Analyzer (Applied Biosystems Inc.). Pregap4/Gap4 from Staden Package software package [72] were used to align DNA sequence electropherograms and scan all polymorphic sites.
2.4. Data Mining and Protein Model
Variant calling was performed by BCFtools [73] using the following settings: minimum mapping quality 20; minimum genotype quality 20; minimum base quality 20; maximum per sample depth of coverage 1000; minimum depth of coverage per site 10; keep read pairs with unexpected insert sizes (for amplicon sequencing). Filtering of results was done with VCFtools [74] to exclude all genotypes with quality below 20 and include only genotypes with read depth ≥10.
SnpEff toolbox was used to further discriminate variants according to their impact (MODIFIER, LOW, MODERATE or HIGH accordingly to the user’s manual) on gene sequence [75]. Elected-impacting variants were then subject to SIFT (sorting intolerant from tolerant) [76] analysis to assess the tolerance of amino acid variants on the protein primary structure, based on the alignment with sequences in SWISS-PROT/TrEMBL database. Only not tolerated mutations were considered for a last impact evaluation based on variants chemical-physical properties according to Betts and Russel (2003) [77]. Both SnpEff and SIFT algorithms were used with default parameters settings.
Data obtained from mapping and variant calling were dissected to extrapolate overall genetic information on the studied genotypes. Amplicons were classified according to their level of polymorphism. All the other parameters were calculated considering all genotypes and the various taxon. For each gene, frequencies of occurring mutation arrangement were calculated along with mutation frequency, triallelic variants occurrence, and MAF. PHASE v2.1 software [78] was used for haplotype reconstruction and frequency calculation using PN40024 as the reference genome [54]. The genotypes belonging to specific classes (carried haplotypes) were linked in contingency tables to the phenotypic trait according to OIV 452(-1) [79]. Pearson’s Chi-squared Tests for Count Data were performed on each locus separately.
Sequences of bonafide (*) and putative DMR6 and DLO orthologues were collected from literature [11,13,14,80] and available databases (Plaza 3.0) [81] and aligned using ClustalW (https://www.ebi.ac.uk/Tools/msa/clustalo/).
Genes carrying mutations confirmed by Sanger sequencing were subjected to a homology detection and three-dimensional structure prediction using the HHpred tool of MPI Bioinformatic Tools [82] available at https://toolkit.tuebingen.mpg.de/#/tools/hhpred. The algorithm found a Thebaine 6-O-demethylase [83] as the protein sequence with three-dimensional structure available (PDB coordinates: 509W) and highest homology to VvDMR6 and VvDLO and it produced a three-dimensional model carrying the mutations using the MODELLER software [82]. The three-dimensional structure was visualized to better understand the impact of the mutations on the wild type protein structure.
3. Results
3.1. Sequencing and Mapping
VvDMR6.1 and VvDMR6.2 shared 46.7% nucleotide identity, VvDMR6.1 and VvDLO1 44.8%, VvDLO1 and VvDLO2 38.9%, all other comparisons resulted in a nucleotide identity lower than 40%. In order to identify potentially disrupting mutations, coding sequences of the VvDMR6.1, VvDMR6.2, VvDLO1, and VvDLO2 genes (Table 1) from 190 genotypes (Table S1) were deep-sequenced and mapped on the reference genome PN40024 12X V2 (see Section 2). In total, 12,476,502 reads were produced. VvDMR6.1 was covered by 5,450,614 reads (44%), VvDMR6.2 by 3,476,587 (28%), VvDLO1 by 3,270,318 (26%), and VvDLO2 by 278,983 (2%). The highest coverage was detected in hybrids with a total of 9,357,649 reads (75%), followed by vinifera with 1,333,887 (11%), hybrids/wild species with 964,847 (8%) and wild species with 814,225 (6%).
A total of 738 mutations were detected by comparing the aligned reads to the Pinot Noir reference genome; 17 (~2%) short In/Dels and 721 point mutations, including heterozygous (56%) and homozygous (44%) SNPs (Figure 1).

Figure 1.
Flow chart of the analysis—tools and criteria—of sequencing data and results obtained downstream of each step.
3.2. Genetic Diversity Assessment
Amplicons were classified according to their rate of polymorphism: from the most polymorphic VvDLO2_1 (~13% of the total mutations); to the ones carrying ~8% of mutations VvDMR6.1_3, VvDMR6.1_2, VvDMR6.2_3 gradually decreasing to the lowest rate of polymorphism (less than 3%) in VvDMR6.2_7 and VvDLO1_4. Moreover, out of a total 738 mutations, 25 (~3.4%) triallelic variants were detected of which 13 in hybrids, eight in wild species, nine in vinifera varieties and eight in hybrid/wild species. Triallelic mutations were mainly found in VvDLO2 (~1.6%) followed by VvDMR6.1 (~1%), VvDMR6.2 (~0.4%), and VvDLO1.
Considering the 696 biallelic mutations in all genotypes, 75% were transitions (A↔G, C↔T) and 25% were transversions (A↔C, A↔T, C↔G, G↔T) with a transition/transversion ratio of three. Both vinifera varieties and hybrids show the same assortment with 77% transitions and 23% transversions. In wild species the percentages were 73% and 27% respectively, while 71% and 29% were the values observed in hybrid/wild species.
SNP frequency was calculated both as average across all genes as well as per gene for every taxon. Vinifera varieties showed the lowest average frequency (~15 SNPs per Kb) with high differences between the target genes: ~33 SNPs per Kb in VvDMR6.1, ~22 SNPs per Kb in VvDMR6.2, ~18 SNPs per Kb in VvDLO1, and ~7 per Kb in VvDLO2. Moreover, the detected average frequency was ~18 SNPs per Kb in both wild species and hybrid/wild species, while they showed respectively ~23 per Kb and ~39 per Kb in VvDMR6.1 ~20 and ~17.8 SNPs per Kb in VvDMR6.2, ~13 and 11 SNPs per Kb in VvDLO1 and, ~22 and 20 SNPs per Kb in VvDLO2. Hybrids showed a higher average frequency (~28 per Kb) due to the dramatically high frequency values in VvDMR6.1 (~75 per Kb) and in VvDMR6.2 (~50 per Kb), ~38 SNPs per Kb in VvDLO1 and 11 per Kb in VvDLO2.
In the current work, minor allele frequency (MAF) was calculated for each biallelic mutation. MAF values 0.01 ≤ x ≤ 0.05 were represented by the 29% of mutations detected in all genotypes, in particular the 23%, 0%, 2%, and 3% in hybrids, wild species, vinifera varieties and hybrids/wild species, respectively. MAF values 0.05 < x ≤ 0.1 were represented by 3% of the mutations in all genotypes as well as in wild species and by 2% in hybrids, vinifera varieties and hybrid/wild species. 0.1 < x ≤ 0.3 MAF values were represented by the 5% of mutations in all genotypes as in hybrids; wild species and vinifera varieties represented them by the 4% of their mutations and hybrid/wild species by the 2%. A very low percentage of mutations showed MAF 0.3 < x ≤ 0.5: 3% for all genotypes, hybrids and vinifera; 2% for wild species and hybrid/wild species.
3.3. Mutation Impact Evaluation
In the current study, upon the variant discrimination performed according to their impact on codon sequence, 27% of total mutations (in particular, 27% in VvDMR6.1, 25% in VvDMR6.2, 30% in VvDLO1 and 25% in VvDLO2) were classified as “MODIFIER”: falling into intronic regions or upstream/downstream the gene. “LOW” impact variants, responsible for synonymous mutations or falling into splice regions, represented the 32% of the total mutations: 36% in VvDMR6.1, 32% in VvDMR6.2, 32% in VvDLO1, and 28% in VvDLO2. Of the total mutations, 38% (in particular, 35% in VvDMR6.1, 40% in VvDMR6.2, 35% in VvDLO1 and 43% in VvDLO2) were non-synonymous variants and therefore classified with “MODERATE” impact. These percentages are partially confirmed in vinifera by Amrine et al. (2015) [84], with ~90% of MODIFIER and LOW mutations and ~8% non-synonymous variants in gene sequence. The lowest number of variants (in average 3%: 2% in VvDMR6.1, 2% in VvDMR6.2, 3% in VvDLO1 and 4% in VvDLO2) was classified with “HIGH” impact as being responsible for sequence frameshifts or premature stop codons. Following the filtering of mutations classified as “MODERATE” and “HIGH” (41%) in order to discriminate amino acid variants according to their conservation, these variants were further checked and mutants carrying different chemical/physical properties from the reference were chosen. Finally, results from both analyses on amino acid sequence were cross-referenced and 20 mutations were elected as potentially affecting the protein structure: 6 in VvDMR6.1, 4 in VvDMR6.2, 4 in VvDLO1, and 6 in VvDLO2 (Table S3, Figure 1).
Twenty-five genotype-SNP combinations were selected for confirmation via Sanger sequencing. 44% of the mutations were confirmed by Sanger sequencing, while 56% were not, indicating a certain discrepancy from Illumina sequencing results. In VvDMR6.1, two mutations out of six polymorphisms were validated in one genotype each. The same variant in VvDMR6.2 was confirmed in three individuals. In VvDLO1 the confirmed variants were two, both in two different genotypes. Two individuals shared only one mutation in VvDLO2. Validated variants spanned among all the scouted genes, and the distribution of genotypes carrying confirmed mutations fairly represented the starting taxon assortment (six hybrids, one wild species, two hybrid/wild species individuals). For each gene, there were mutations that were both confirmed and unconfirmed depending on the genotype, and some individuals carried both confirmed and unconfirmed variants in the same gene. We classified Sanger-investigated variants according to their read coverage (DP) and to their genotype quality (GQ). Out of the total 25 variants taken into account, 15 showed DP < 100 and 10 mutations with DP > 100 of which only one with DP close to 1000. While within 15 mutations with 10 < DP < 73 only four NGS results (27%) were confirmed, 7 out of the 10 variants (70%) with DP > 100 could be confirmed via Sanger sequencing. Furthermore, seven variants out of 25 (28%) showed a GQ lower than 99, of these only two were confirmed by Sanger sequencing. The remaining 18 mutations (72%) had GQ = 99 and half (nine) of them were confirmed. Considering both DP and GQ values together, six out of the seven variants with GQ < 99 showed DP < 100 but still two of them were Sanger sequencing confirmed. While five out of the nine remaining confirmed mutations showed GQ > 99 and DP > 100, two variants were with 50 < DP < 100. Of all the 20 impacting mutations considered (Table S3), only five were located at less than 60 nucleotides from amplicon or contig edge, and only one at less than 10 nucleotides. All the variants located on boundaries showed DP < 100; 50% of these edge mutations showed GQ < 99 and the other half GQ > 99. All the Sanger-confirmed variants were located far from amplicon ends, while only one was located on a reverse primer.
In order to provide robust results, only the validated mutations, corresponding to 11 genotype-SNP combinations, were selected for haplotype reconstruction and following analyses (Figure 1).
3.4. Mutated DMR and DLO Gene Combinations
Of the 190 studied genotypes, 55 showed at least one of the elected mutations: 37 hybrids, three vinifera varieties, six wild species and nine hybrid/wild species. 73% of individuals showed mutations only in one gene: 13% in VvDMR6.1, 29% in VvDMR6.2, 7% in VvDLO1 and 24% in VvDLO2, while 26% were double mutants within six gene combinations and one genotype was mutant in three genes (Table S4). Haplotypes and their frequencies were determined for VvDMR6.1, VvDMR6.2, VvDLO1, and VvDLO2 genes. Individuals carrying one impacting mutation per each gene were selected and the gene haplotypes were inferred taking into account all the flanking mutations showing at least MODERATE impact on the gene sequence (Table 2, Table S5). For VvDMR6.1, based on 14 SNPs, 17 haplotypes were calculated in 11 genotypes. The reference haplotype was the prominent (18.2% of frequency), all the others were unique, except for two haplotypes respectively shared by two individuals. No particular association between taxon and haplotype occurrence was observed. Regarding VvDMR6.2, 14 haplotypes were reconstructed based on 14 SNPs in 27 genotypes. The most shared haplotype (40.7%), showing two impacting mutations, was present in 12 individuals belonging to hybrids and, mainly in homozygous state, to Vitis spp./hybrid individuals. The reference haplotype was the second one mostly represented, and then the third one showed 13% of frequency being shared by six hybrid genotypes. VvDLO1 showed nine haplotypes based on 11 SNPs in 10 individuals. Besides the most recurrent reference haplotype (30%), the one with 20% of frequency encompassed two impacting mutations in one hybrid and two wild species. Sixteen SNPs in 25 genotypes were taken into account for VvDLO2, resulting in 19 haplotypes. Most haplotypes were unique or slightly shared, except for the reference one (34% of frequency) and two other main haplotypes (12% each) respectively shared by only and both hybrids and wild species (Table S5).
Table 2.
Example of the haplotypic structure for each analyzed genotype.
Integrating genotypic (haplotypic) data and available phenotypic OIV 452(-1) scores (Table 2), a chi-squared test was performed in order to check that genotypes belonging to specific classes (carried haplotypes) significantly led to the DM resistance trait. Interestingly, in VvDMR6.2, significance levels p = 0.0025 and p = 0.018 were respectively observed for haplotype number 10 and 8.
3.5. Mutation Mapping on Amino Acid Sequences and Protein Structural Model
The amino acid variants corresponding to the mutations confirmed by Sanger sequencing were further investigated: (i) to estimate their conservation at the primary sequence level both within Vitis as well as in a larger group comprising other plant species (Figure 2A,B, Figure S1), and (ii) to evaluate their impact on the protein tertiary structure model (Figure 3).
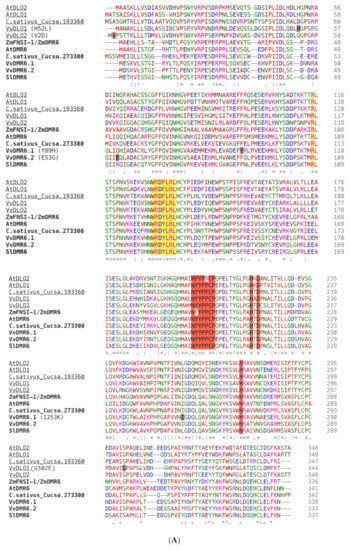


Figure 2.
Amino acid sequence alignments. Amino acids important for the 2-DOG oxidase function (e.g., the NYYPPCP stretch responsible for binding the 2-oxoglutarate substrate and the iron-binding HDH triplet) are highlighted in red. The DLO-DMR6 characterizing motif WRDY/FLRL is highlighted in yellow; R124 within the WRDY/FLRL motif, and R108 of the Arabidopsis thaliana DMR6-1 sequence were shown to be essential for the function and are as well highlighted in yellow [80]. Amino acids that are changing in the different grapevine variants are indicated within parenthesis and their position is highlighted in grey on the sequence. (A) CLUSTALW alignment of bonafide DMR6 (in bold) and DLO (underlined) proteins from different species. C.sativus_Cucsa.193360 and C.sativus_Cucsa.273300 were identified as AtDMR6 orthologues in Cucumis sativus by Schouten at al. (2014) [14], although no experimental proof is provided. Bonafide DMR and DLO proteins are: Zea mays ZmFNSI-1/ZmDMR6, A. thaliana AtDMR6, AtDLO1, and AtDLO2; Solanum lycopersicon SlDMR6. The grapevine DMR6 and DLO proteins (VvDMR6.1, VvDMR6.2, VvDLO1, and VvDLO2) are those of the PN40024 reference genome. (B) CLUSTALW alignment of translated grapevine sequences. Abbreviations: Rupestris: V. rupestris du Lot, PN40024: Pinot noir-derived near-homozygous line, NY84: NY84.0100.05, F560BB: F560 Big Brown, G.Muscat: Golden Muscat. * (asterisk) indicates positions which have a single, fully conserved residue. : (colon) indicates conservation between groups of strongly similar properties - scoring > 0.5 in the Gonnet PAM 250 matrix. . (period) indicates conservation between groups of weakly similar properties - scoring =< 0.5 in the Gonnet PAM 250 matrix.

Figure 3.
Protein structure model with detected impacting variants. In blue are residues located inside the protein while in red are those more exposed on the surface.
Due the high sequence identity among them, the same protein three-dimensional model was used for mapping the mutations of all four proteins. Of the six amino acid substitutions two were found in VvDMR6.1 and VvDLO1 respectively, and one in VvDMR6.2 and VvDLO2 (Figure 3). All these mutations were non-conservative and therefore could potentially determine deep structural changes affecting also on the protein function. As depicted in Figure 3, four mutations appeared to be more exposed to the solvent, while the other two were buried inside the hydrophobic core of the proteins. Changes in the exposed amino acids are often less detrimental on the protein structure/function and this is the case of the V2D and H52L mutations. Although these mutations replaced a hydrophobic residue with a negatively charged one (V > D) and vice versa (H > L), being solvent exposed they do not seem of high impact on the protein structure. G302E and E53G mutations affect both steric hindrance and charge of the amino acid: glycine bearing the smallest side chain and glutamic acid bearing a bulky and negatively charged side chain. Also, for these two mutations, the location at the protein surface suggests that they may be tolerated and likely do not affect heavily protein function. The remaining mutations Y89H and I253K might instead have a much greater impact on the structure and function of VvDMR6.1, the sequence where they have been found. In this case, amino acids with hydrophobic character (Y and I) and positioned within the hydrophobic core of the globular protein are changed into positively charged amino acids (H and K).
4. Discussion
4.1. Wealth of Genetic Variability
The current survey revealed a high representation of triallelic mutations within our genotype panel, due to the great genetic variability considered. Analogously, the occurrence of triallelism is consistent with previous work in grapevine [86,87,88]. However, as reported by Bianco et al. (2016) [44] and Marrano et al. (2019) [45], triallelic variants are usually discarded in large scale SNP-based analyses for cost reasons (i.e., they require multiple probes in SNP arrays) and not necessarily because they are less accurate. The obtained results in terms of transitions/transversions slightly diverge from the usual ratio found in grapevine (~1.5 in Salmaso et al., 2004; Lijavetzky et al., 2007; Vezzulli et al., 2008; Vezzulli et al., 2008; ~2 Marrano et al., 2017) [86,87,88,89,90] as well as in beetroot [91], potato [92] and cotton [93], while they are much higher than in soybean [94] and almond [95].
Regarding the detected average of ~15 SNPs per Kb in vinifera genotypes, a comparable polymorphism rate (~14.5 SNPs per Kb in coding regions) was found in both cultivated (spp. sativa) and non-cultivated (spp. sylvestris) vinifera species by Lijavetzky et al. (2007) [86]. In contrast, Vezzulli et al. (2008) [87], estimated ~8.5 SNPs per Kb in cultivated vinifera and ~6 per Kb in wild vinifera individuals coding sequence. Moreover, studying different Vitis spp. genotypes, Salmaso et al. (2004) [89] observed an average of ~12 SNPs per Kb in the coding sequence of a set of genes encoding proteins related to sugar metabolism, cell signaling, anthocyanin metabolism, and defense. Based on the first Pinot noir consensus genome sequence, the average SNP frequency was estimated at four SNPs every Kb [55], compatible with the use of such molecular markers for the construction of genetic maps in grapevine [96]. Different polymorphism rates were found in other highly heterozygous tree species as peach (less than two SNPs per Kb) [97], black cottonwood (~3 per Kb) [98], almond (~9 per Kb) [95], and Tasmanian blue gum tree (~22 per Kb) [99], but all these results have to be carefully taken into account since different SNP calling methods can distort the comparison.
SNP informativeness depends on their reliability among individuals and species and their high transferability rates probably are not consistent with a direct impact on the genetic sequence (when in coding regions). Considering previous studies in grapevine, a larger representativeness of MAF values <0.1 was found in non-vinifera genotypes and rootstocks, non-cultivated vinifera showed a MAF 0.05 < x < 0.3 while MAF > 0.1 were severely represented by vinifera sativa [86,87,90,100]. As explained by Jones et al. (2007) [101] and Grattapaglia et al. (2011) [102], genotyping studies take advantage of different molecular markers, mostly relying on their informativeness. In this framework, SNPs are informative markers, and this peculiarity is calculated as MAF. SNPs are considered interesting for many goals when MAF values are >0.05 [103,104], but their main usefulness is due to the transferability across genotypes (>0.1) [86]. In the current study, the aim to focus on impacting mutations was achieved, since MAF ≤ 0.05 is a distinguishing mark for rare SNPs which affect the gene sequence and most likely the protein activity.
4.2. Relevance of Mutation Impact
In crops like tomato [105] and Cucurbita spp. [106], coding regions and whole genome sequence were scouted to find impacting mutations. A non-synonymous/synonymous mutation ratio of ~1.5 was found in tomato cultivars. In Cucurbita spp., the ratio was ~0.8 but only 9% of genetic variants showed HIGH or MODERATE impact in full genomic sequence, suggesting a great presence of intergenic mutations. In the walnut tree genomic sequence, Marrano et al. (2019) [45] identified 2.8% potentially impacting variants, while in the pear genome 55% of mutations were classified as missense and 1% with HIGH impact [107]. In grapevine, a significantly lower presence (0.7%) of HIGH impacting variants was observed in Thompson Seedless cultivar [108] compared to average percentages we observed in all taxa. The present aim to detect potentially disrupting mutations finds support in the great frequency of HIGH- and MODERATE-impact variants compared to the aforementioned research works on grapevine. Particular interest in the current results is given by the occurrence of impacting elected mutations in each one of the four scouted genes. Given the predicted compensative functional role of AtDMR6 and AtDLO in SA catabolism [10,12], obtained data may allow the use of VvDMR6 and VvDLO genes in different combinations to enhance the impact of such homozygous mutations and likely avoid complementary effects.
Regarding the confirmation via Sanger sequencing, a borrowed attempt from clinical studies was tried herein on the overall grapevine Illumina sequencing results. In clinical research, reliability of variant calls is a fundamental precondition that requires the use of Sanger sequencing as gold standard to confirm NGS results and avoid false positives [109,110,111]. Incidentally, in order to avoid expensive and time-consuming extra analysis, some studies tried to set conditions according to which NGS-based variant calls can be considered definitive [112,113]. Although given the low number of tested samples we cannot draw a definitive conclusion that there is a direct correlation between these conditions and the reliability of Illumina sequencing-based calls, we observed that the most Sanger-confirmed variants (64%) showed DP > 100 and GQ = 99, while all ones were located away from the edges of the amplicons. The latter is in accord to Satya & DiCarlo (2014) [114], who report that variant calling accuracy decreases when SNPs are next to amplicon boundaries.
At this point, it is important to highlight the genetic complexity (high heterozygosity) of the studied genotype panel, which can unpredictably affect the Illumina probe as well as the Sanger sequencing primer annealing. Therefore, in order to provide reliable results, only validated mutations were selected for haplotype reconstruction and subsequent analyzes.
4.3. The Value of Haplotype Consideration
The reported broad genetic survey went back to the haplotype level. In three scouted genes out of four, the prominent haplotype belongs to the reference genotype (PN40024) which is a near-homozygous line [54] derived from the founder vinifera variety Pinot (noir) [115]. It is believed that the ancestral haplotype of a gene is the one showing the highest frequency while the rarest ones are the ones showing the most recent mutations occurring on the most shared haplotype [116], this hypothesis is supported by the fact that haplotype frequency is directly related to its age [117,118]. As advocated by Riahi et al. (2013) [119], domestication, hybridization with wild relatives and somatic mutations induced by vegetative propagation are the main reasons for the onset of genetic diversity between and among grapevine taxons.
Considering haplotypic data and available phenotypic OIV 452(-1) scores, two VvDMR6.2 mutant haplotypes (number 10 and 8) were found more represented in DM resistant genotypes. It is relevant to highlight that none of the scouted target genes are underlying known resistance QTLs and no R loci discovered in grapevine so far were detected in the eight genotypes carrying these two haplotypes, except for the partial resistant Rpv3-3 in three genotypes (Vezzulli S., personal communication). These observations suggest a potential effect of the mutant haplotypes in the defense response to DM. In grapevine, in addition to pursue association studies in large sample panels [120,121], some research works have lately been focusing on the haplotype investigation to dissect the relation between genetic diversity and cis-regulated gene expression in disease-related genes [122,123].
4.4. Scouting of Amino Acid Changes
DMR6 was identified as a putative 2-oxoglutarate (2OG)-Fe(II) oxygenase [9] and it revealed to share the WRD(F/Y)LR motif with DLO in flowering plant species [80]. Interestingly, Zeilmaker et al. (2015) [11] observed that non-conservative mutations in the catalytic sites (H212, H269, D214) of this protein were not able to restore susceptibility in an Atdmr6.1 mutant background, in a complementation experiment. Unfortunately, no impacting mutation has been observed in any of these positions, but others have been identified that could potentially alter the structure of the protein. In particular, six mutations classified as impacting ones and confirmed by Sanger sequencing were further investigated by mapping on a three-dimensional model of the proteins and by analyzing the amino acid degree of conservation in a sequence alignment.
Drawing conclusions on the actual disrupting impact of the detected mutations will only be possible upon enzymatic assays of wild type and mutant proteins or by indirect functional assays such as the confirmation of the response to DM of the genotypes carrying the different variants. Nevertheless, the in silico analysis on the three-dimensional model of DMR6 and DLO proteins can already provide some insights and guide further investigations. Of the six mutations, two (Y89H and I253K) appeared to have a larger impact than the other four on the protein structure and consequently on the enzymatic activity. These changes occurred in amino acids positioned in the hydrophobic core of the protein. They imply the switch from a hydrophobic character to a hydrophilic character of the side chains, which carry a positive charge in the mutated amino acids. The use of a three-dimensional model to map the impacting mutations helped in inferring with a good approximation the position of the amino acids within the structure, in particular whether they are on the protein surface or buried inside the core of the proteins, and whether they are part of beta-structures or alfa-helices. An additional hint of the importance of the Y89 and I253 residues came from the analysis of DMR6 and DLO sequence alignments both within the Vitis species, results from this study, as well on a larger set of species. Y89 corresponds to an extremely conserved phenylalanine in other DMR6 and DLO sequences and this is an indication of the importance of an aromatic residue in that position. Interestingly, the amino acid following phenylalanine in several DLO sequences is a histidine. I253 is even more conserved in the sequence alignments and it is only in a few cases substituted by a leucine or a valine, which bear the same chemical properties. This suggests a structural and functional role of this amino acid in that specific position, which would be likely disturbed by the mutation into a lysine, as it was observed in one of the studied genotypes.
4.5. Ultimate Application of S Genes
The genetic and protein data observed together with the phenotypic data (Table 2, Figure 2A,B, Figure 3) provide a well-rounded view of the role of the genes scouted here. The VvDMR6.2 gene arouses a particular interest. The broader genetic analysis allowed us to observe that this gene shows two haplotypes (number 10 and 8) which are more frequently represented in DM resistant genotypes. Through the more focused analysis on the impact of Sanger-confirmed mutations, both haplotypes were found to share the genetic mutation responsible for the amino acid variant E53G. This finding suggests a decisive role of VvDMR6.2 as S gene to grapevine DM and confirms the reliability of the bottleneck analysis here carried out (Figure 1).
Induction of plant defense signaling involves the recognition of specific pathogen effectors by the products of specialized host R genes. Numerous plant R genes have already been identified and characterized and they are being efficiently used in crop improvement research programs [1]. However, especially in tree species, selection of desirable resistant mutants comes with a cost of lengthy and laborious breeding programs. The effort required to produce resistant plants is often baffled within a few years from the selection because the pathogen evolves mechanisms to circumvent the R gene mediated immunity [124,125]. Exploitation of inactive alleles of susceptibility genes seems to be a promising path to introduce effective and durable disease resistance. Since S genes’ first discovery [6], converting susceptibility genes in resistance factors has become an increasingly complementary strategy to that of breeding for R loci [4], and the advent of new reliable genome editing tools has enhanced this trend. The use of genome editing technologies such as CRISPR-Cas9 allow to specifically and rapidly target susceptibility genes to indirectly obtain resistance in a chosen genetic background, which is highly desired in crops like grapevine where the genetic identity is economically important. Recently, the S gene MdDIPM4 was targeted in apple for a genome editing-driven knock out, resulting in edited plants showing reduced susceptibility to the bacterial pathogen Erwinia amylovora [126]. A similar approach was carried out by Low et al. (2020) [127] on Hv2OGO gene in barley conferring resistance to Fusarium graminearum. However, generation of edited plants and testing of their phenotype still requires years [128,129]. S genes may play different functions in the plant, thus pleiotropic effects associated with their knockout may entail a certain fitness cost for the plant. Recently, quantitative regulation of gene expression has been achieved with genome editing on cis-regulatory elements [125,130,131] and this might be a strategy to limit negative drawbacks associated with a reduced S gene function.
5. Conclusions
In this framework, the broad investigation of genetic diversity (until the haplotype level) related to a disease resistance trait presented here has the potential to become a resource in different contexts of plant science, both through the future integration of transcriptomics, proteomics and metabolomics data and as such. The identification of specific homozygous variants in the natural pool can in fact guide genome editing projects in targeting mutations that occur ‘naturally’. This “tailored gene editing” that mimics natural polymorphisms has recently been demonstrated by Bastet et al. (2017, 2019) [132,133]. Finally, breeding programs could benefit from information on selected homozygous and heterozygous S gene mutations by implementing a next-generation marker-assisted strategy.
Supplementary Materials
The following are available online at https://www.mdpi.com/2218-273X/11/2/181/s1: Figure S1. CLUSTALW alignment of bonafide and putative DMR6 and DLO proteins from different species, Table S1. List of studied grapevine genotypes, Table S2. Selected genotypes for Sanger sequencing of each gene, investigated variants with their physical position, and sequencing primers, Table S3. List of impacting mutations with positions and data in VCF (Variant Call Format), Table S4. List of genotypes showing impacting mutations—heterozygous (He) or homozygous (Ho) status—in at least one gene, Table S5. Haplotype identification and frequencies determined for the VvDMR6.1, VvDMR6.2, VvDLO1, VvDLO2 genes.
Author Contributions
Conceptualization, S.V.; Methodology, C.P., S.V, and T.Z.; Software, C.P., L.B., and T.Z.; Validation, C.P. and C.M.; Formal analysis, C.P., T.Z., and L.B.; Investigation, C.P., S.V., L.G., and C.M.; Resources, S.V., C.P., and L.G.; Data curation, C.P. and T.Z.; Writing—original draft preparation, C.P. and S.V.; Writing—review and editing, C.M., L.G., and L.B.; Visualization, C.P. and L.G.; Supervision, S.V.; Project administration, C.M.; Funding acquisition, C.M. All authors have read and agreed to the published version of the manuscript.
Funding
C.P. is recipient of a PhD fellowship provided by Fondazione Edmund Mach (FEM) and SciENZA Biotechnologies. She is enrolled at the University of Udine PhD school. The Autonomous Province of Trento (PAT) partially funded this research work.
Institutional Review Board Statement
Not applicable.
Informed Consent Statement
Not applicable.
Data Availability Statement
The data presented in this study are available in Supplementary Materials.
Acknowledgments
The authors are grateful to Andrew Walker and Summaira Riaz (UC Davis), Bruce Reisch (Cornell CALS) and Lorenzo Coia (OCPVA) for grapevine genotype recovery and collection. The authors also thank Bruce Reisch (Cornell CALS) and Luca Zulini (FEM) for providing some unpublished phenotypic data. Moreover, the authors appreciate Guido Van den Ackerveken and Adrien Melquiond (Utrecht University) for providing a PDB model of the DMR6/DLO1 protein, along with Andrea Mattevi (UniPv) for protein modelling and discussion on the impact of the aminoacid variants on the structure. Finally, the authors are thankful to Richard Feron and Quy Dung Peter Dinh (ENZA ZADEN) for Illumina sequencing data analysis, and Luca Cappellin (UniPd) for support on statistical analysis.
Conflicts of Interest
The authors declare no conflict of interest.
References
- Gururani, M.A.; Venkatesh, J.; Upadhyaya, C.P.; Nookaraju, A.; Pandey, S.K.; Park, S.W. Plant disease resistance genes: Current status and future directions. Physiol. Mol. Plant Pathol. 2012, 78, 51–65. [Google Scholar] [CrossRef]
- Jones, J.D.G.; Dangl, J.L. The plant immune system. Nature 2006, 444, 323–329. [Google Scholar] [CrossRef] [PubMed]
- Meyers, B.C.; Kaushik, S.; Nandety, R.S. Evolving disease resistance genes. Curr. Opin. Plant Biol. 2005, 8, 129–134. [Google Scholar] [CrossRef] [PubMed]
- Van Schie, C.C.N.; Takken, F.L.W. Susceptibility genes 101: How to be a good host. Annu. Rev. Phytopathol. 2014, 52, 551–581. [Google Scholar] [CrossRef]
- Fawke, S.; Doumane, M.; Schornack, S. Oomycete Interactions with Plants: Infection Strategies and Resistance Principles. Microbiol. Mol. Biol. Rev. 2015, 79, 263–280. [Google Scholar] [CrossRef]
- Jorgensen, J.H. Discovery, characterization and exploitation of Mlo powdery mildew. Euphytica 1992, 66, 141–152. [Google Scholar] [CrossRef]
- Kusch, S.; Panstruga, R. mlo-Based Resistance: An Apparently Universal “Weapon” to Defeat Powdery Mildew Disease. Mol. Plant Microbe Interact. 2017, 30, 179–189. [Google Scholar] [CrossRef]
- Van Damme, M.; Andel, A.; Huibers, R.P.; Panstruga, R.; Weisbeek, P.J.; Van Den Ackerveken, G. Identification of Arabidopsis loci required for susceptibility to the downy mildew pathogen Hyaloperonospora parasitica. Mol. Plant Microbe Interact. 2005, 18, 583–592. [Google Scholar] [CrossRef] [PubMed]
- Van Damme, M.; Huibers, R.P.; Elberse, J.; Van Den Ackerveken, G. Arabidopsis DMR6 encodes a putative 2OG-Fe(II) oxygenase that is defense-associated but required for susceptibility to downy mildew. Plant J. 2008, 54, 785–793. [Google Scholar] [CrossRef] [PubMed]
- Zhang, K.; Halitschke, R.; Yin, C.; Liu, C.-J.; Gan, S.-S. Salicylic acid 3-hydroxylase regulates Arabidopsis leaf longevity by mediating salicylic acid catabolism. Proc. Natl. Acad. Sci. USA 2013, 110, 14807–14812. [Google Scholar] [CrossRef]
- Zeilmaker, T.; Ludwig, N.R.; Elberse, J.; Seidl, M.F.; Berke, L.; Van Doorn, A.; Schuurink, R.C.; Snel, B.; Van Den Ackerveken, G. Downy mildew resistant 6 and DMR6-like oxygenase 1 are partially redundant but distinct suppressors of immunity in Arabidopsis. Plant J. 2015, 81, 210–222. [Google Scholar] [CrossRef] [PubMed]
- Zhang, Y.J.; Zhao, L.; Zhao, J.Z.; Li, Y.J.; Wang, J.B.; Guo, R.; Gan, S.S.; Liu, C.J.; Zhanga, K.W. S5H/DMR6 encodes a salicylic acid 5-hydroxylase that fine-tunes salicylic acid homeostasis. Plant Physiol. 2017, 175, 1082–1093. [Google Scholar] [CrossRef] [PubMed]
- De Toledo Thomazella, D.P.; Brail, Q.; Dahlbeck, D.; Staskawicz, B.J. CRISPR-Cas9 mediated mutagenesis of a DMR6 ortholog in tomato confers broad-spectrum disease resistance. bioRxiv 2016, 064824. [Google Scholar] [CrossRef]
- Schouten, H.J.; Krauskopf, J.; Visser, R.G.F.; Bai, Y. Identification of candidate genes required for susceptibility to powdery or downy mildew in cucumber. Euphytica 2014, 200, 475–486. [Google Scholar] [CrossRef]
- Sun, K.; van Tuinen, A.; van Kan, J.A.L.; Wolters, A.M.A.; Jacobsen, E.; Visser, R.G.F.; Bai, Y. Silencing of DND1 in potato and tomato impedes conidial germination, attachment and hyphal growth of Botrytis cinerea. BMC Plant Biol. 2017, 17, 235. [Google Scholar] [CrossRef]
- Zhang, W.; Mirlohi, S.; Li, X.; He, Y. Identification of functional single-nucleotide polymorphisms affecting leaf hair number in Brassica rapa. Plant Physiol. 2018, 177, 490–503. [Google Scholar] [CrossRef]
- Ganal, M.W.; Altmann, T.; Röder, M.S. SNP identification in crop plants. Curr. Opin. Plant Biol. 2009, 12, 211–217. [Google Scholar] [CrossRef]
- Brookes, A.J. The essence of SNPs [Review]. Gene 1999, 234, 177–186. [Google Scholar] [CrossRef]
- Andersen, J.R.; Lübberstedt, T. Functional markers in plants. Trends Plant Sci. 2003, 8, 554–560. [Google Scholar] [CrossRef]
- Polanco, C.; Sáenz de Miera, L.E.; González, A.I.; García, P.; Fratini, R.; Vaquero, F.; Javier Vences, F.; De La Vega, M.P. Construction of a high-density interspecific (Lens culinaris × L. Odemensis) genetic map based on functional markers for mapping morphological and agronomical traits, and QTLs affecting resistance to Ascochyta in lentil. PLoS ONE 2019, 14, e0214409. [Google Scholar] [CrossRef]
- Burow, G.; Chopra, R.; Sattler, S.; Burke, J.; Acosta-Martinez, V.; Xin, Z. Deployment of SNP (CAPS and KASP) markers for allelic discrimination and easy access to functional variants for brown midrib genes bmr6 and bmr12 in Sorghum bicolor. Mol. Breed. 2019, 39. [Google Scholar] [CrossRef]
- Fan, C.; Yu, S.; Wang, C.; Xing, Y. A causal C-A mutation in the second exon of GS3 highly associated with rice grain length and validated as a functional marker. Theor. Appl. Genet. 2009, 118, 465–472. [Google Scholar] [CrossRef] [PubMed]
- Yang, Y.; Zhang, H.; Xuan, N.; Chen, G.; Liu, X.; Yao, F.; Ding, H. Identification of blast resistance genes in 358 rice germplasms (Oryza sativa L.) using functional molecular markers. Eur. J. Plant Pathol. 2017, 148, 567–576. [Google Scholar] [CrossRef]
- Edwards, D.; Forster, J.W.; Cogan, N.O.; Batley, J.; Chagné, D. Single nucleotide polymorphism discovery. In Association Mapping in Plants; Springer: New York, NY, USA, 2007. [Google Scholar]
- Varshney, R.K.; Nayak, S.N.; May, G.D.; Jackson, S.A. Next-generation sequencing technologies and their implications for crop genetics and breeding. Trends Biotechnol. 2009, 27, 522–530. [Google Scholar] [CrossRef] [PubMed]
- Schadt, E.E.; Turner, S.; Kasarskis, A. A window into third-generation sequencing. Hum. Mol. Genet. 2010, 19, 227–240. [Google Scholar] [CrossRef]
- Arabidopsis Genome Initiative. Analysis of the genome sequence of the flowering plant Arabidopsis thaliana. Nature 2000, 408, 796–815. [Google Scholar] [CrossRef] [PubMed]
- Ching, A.; Caldwell, K.S.; Jung, M.; Dolan, M.; Smith, O.S.H.; Tingey, S.; Morgante, M.; Rafalski, A.J. SNP frequency, haplotype structure and linkage disequilibrium in elite maize inbred lines. BMC Genet. 2002, 3, 1–14. [Google Scholar] [CrossRef]
- Atwell, S.; Huang, Y.S.; Vilhjálmsson, B.J.; Willems, G.; Horton, M.; Li, Y.; Meng, D.; Platt, A.; Tarone, A.M.; Hu, T.T.; et al. Genome-wide association study of 107 phenotypes in Arabidopsis thaliana inbred lines. Nature 2010, 465, 627–631. [Google Scholar] [CrossRef]
- Xu, X.; Liu, X.; Ge, S.; Jensen, J.D.; Hu, F.; Li, X.; Dong, Y.; Gutenkunst, R.N.; Fang, L.; Huang, L.; et al. Resequencing 50 accessions of cultivated and wild rice yields markers for identifying agronomically important genes. Nat. Biotechnol. 2012, 30, 105–111. [Google Scholar] [CrossRef]
- Raman, H.; Dalton-Morgan, J.; Diffey, S.; Raman, R.; Alamery, S.; Edwards, D.; Batley, J. SNP markers-based map construction and genome-wide linkage analysis in Brassica napus. Plant Biotechnol. J. 2014, 12, 851–860. [Google Scholar] [CrossRef]
- Vos, P.G.; Uitdewilligen, J.G.A.M.L.; Voorrips, R.E.; Visser, R.G.F.; van Eck, H.J. Development and analysis of a 20K SNP array for potato (Solanum tuberosum): An insight into the breeding history. Theor. Appl. Genet. 2015, 128, 2387–2401. [Google Scholar] [CrossRef] [PubMed]
- Hulse-Kemp, A.M.; Ashrafi, H.; Plieske, J.; Lemm, J.; Stoffel, K.; Hill, T.; Luerssen, H.; Pethiyagoda, C.L.; Lawley, C.T.; Ganal, M.W.; et al. A HapMap leads to a Capsicum annuum SNP infinium array: A new tool for pepper breeding. Hortic. Res. 2016, 3, 1–10. [Google Scholar] [CrossRef] [PubMed]
- Peterson, G.W.; Dong, Y.; Horbach, C.; Fu, Y.B. Genotyping-by-sequencing for plant genetic diversity analysis: A lab guide for SNP genotyping. Diversity 2014, 6, 665–680. [Google Scholar] [CrossRef]
- Campbell, N.R.; Harmon, S.A.; Narum, S.R. Genotyping-in-Thousands by sequencing (GT-seq): A cost effective SNP genotyping method based on custom amplicon sequencing. Mol. Ecol. Resour. 2015, 15, 855–867. [Google Scholar] [CrossRef] [PubMed]
- Kumar, S.; Banks, T.W.; Cloutier, S. SNP discovery through next-generation sequencing and its applications. Int. J. Plant Genomics 2012, 2012. [Google Scholar] [CrossRef] [PubMed]
- Durstewitz, G.; Polley, A.; Plieske, J.; Luerssen, H.; Graner, E.M.; Wieseke, R.; Ganal, M.W. SNP discovery by amplicon sequencing and multiplex SNP genotyping in the allopolyploid species Brassica napus. Genome 2010, 53, 948–956. [Google Scholar] [CrossRef]
- Yang, S.; Fresnedo-Ramírez, J.; Wang, M.; Cote, L.; Schweitzer, P.; Barba, P.; Takacs, E.M.; Clark, M.; Luby, J.; Manns, D.C.; et al. A next-generation marker genotyping platform (AmpSeq) in heterozygous crops: A case study for marker-assisted selection in grapevine. Hortic. Res. 2016, 3. [Google Scholar] [CrossRef]
- Cho, Y.B.; Jones, S.I.; Vodkin, L.O. Mutations in Argonaute5 illuminate epistatic interactions of the K1 and I loci leading to saddle seed color patterns in glycine max. Plant Cell 2017, 29, 708–725. [Google Scholar] [CrossRef]
- Shimray, P.W.; Bajaj, D.; Srivastava, R.; Daware, A.; Upadhyaya, H.D.; Kumar, R.; Bharadwaj, C.; Tyagi, A.K.; Parida, S.K. Identifying Transcription Factor Genes Associated with Yield Traits in Chickpea. Plant Mol. Biol. Report. 2017, 35, 562–574. [Google Scholar] [CrossRef]
- Hong, Y.; Liao, D.; Hu, A.; Wang, H.; Chen, J.; Khan, S.; Su, J.; Li, H. Diversity of endophytic and rhizoplane bacterial communities associated with exotic Spartina alterniflora and native mangrove using Illumina amplicon sequencing. Can. J. Microbiol. 2015, 61, 723–733. [Google Scholar] [CrossRef]
- Kinoti, W.M.; Constable, F.E.; Nancarrow, N.; Plummer, K.M.; Rodoni, B. Analysis of intra-host genetic diversity of Prunus necrotic ringspot virus (PNRSV) using amplicon next generation sequencing. PLoS ONE 2017, 12, e0179284. [Google Scholar] [CrossRef] [PubMed]
- Gupta, P.K.; Roy, J.K.; Prasad, M. Single nucleotide polymorphisms: A new paradigm for molecular marker technology and DNA polymorphism detection with emphasis on their use in plants. Curr. Sci. 2001, 80, 524–535. [Google Scholar]
- Bianco, L.; Cestaro, A.; Linsmith, G.; Muranty, H.; Denancé, C.; Théron, A.; Poncet, C.; Micheletti, D.; Kerschbamer, E.; Di Pierro, E.A.; et al. Development and validation of the Axiom®Apple480K SNP genotyping array. Plant J. 2016, 86, 62–74. [Google Scholar] [CrossRef] [PubMed]
- Marrano, A.; Martínez-García, P.J.; Bianco, L.; Sideli, G.M.; Di Pierro, E.A.; Leslie, C.A.; Stevens, K.A.; Crepeau, M.W.; Troggio, M.; Langley, C.H.; et al. A new genomic tool for walnut (Juglans regia L.): Development and validation of the high-density AxiomTM J. regia 700K SNP genotyping array. Plant Biotechnol. J. 2019, 17, 1027–1036. [Google Scholar] [CrossRef] [PubMed]
- Hardner, C.M.; Hayes, B.J.; Kumar, S.; Vanderzande, S.; Cai, L.; Piaskowski, J.; Quero-Garcia, J.; Campoy, J.A.; Barreneche, T.; Giovannini, D.; et al. Prediction of genetic value for sweet cherry fruit maturity among environments using a 6K SNP array. Hortic. Res. 2019, 6. [Google Scholar] [CrossRef] [PubMed]
- Li, X.; Singh, J.; Qin, M.; Li, S.; Zhang, X.; Zhang, M.; Khan, A.; Zhang, S.; Wu, J. Development of an integrated 200K SNP genotyping array and application for genetic mapping, genome assembly improvement and genome wide association studies in pear (Pyrus). Plant Biotechnol. J. 2019, 17, 1582–1594. [Google Scholar] [CrossRef] [PubMed]
- Merot-L’anthoene, V.; Tournebize, R.; Darracq, O.; Rattina, V.; Lepelley, M.; Bellanger, L.; Tranchant-Dubreuil, C.; Coulée, M.; Pégard, M.; Metairon, S.; et al. Development and evaluation of a genome-wide Coffee 8.5K SNP array and its application for high-density genetic mapping and for investigating the origin of Coffea arabica L. Plant Biotechnol. J. 2019, 17, 1418–1430. [Google Scholar] [CrossRef]
- Mercati, F.; De Lorenzis, G.; Brancadoro, L.; Lupini, A.; Abenavoli, M.R.; Barbagallo, M.G.; Di Lorenzo, R.; Scienza, A.; Sunseri, F. High-throughput 18K SNP array to assess genetic variability of the main grapevine cultivars from Sicily. Tree Genet. Genomes 2016, 12. [Google Scholar] [CrossRef]
- Laucou, V.; Launay, A.; Bacilieri, R.; Lacombe, T.; Adam-Blondon, A.F.; Bérard, A.; Chauveau, A.; De Andrés, M.T.; Hausmann, L.; Ibáñez, J.; et al. Extended diversity analysis of cultivated grapevine Vitis vinifera with 10K genome-wide SNPs. PLoS ONE 2018, 13, e0192540. [Google Scholar] [CrossRef]
- Feuillet, C.; Leach, J.E.; Rogers, J.; Schnable, P.S.; Eversole, K. Crop genome sequencing: Lessons and rationales. Trends Plant Sci. 2011, 16, 77–88. [Google Scholar] [CrossRef]
- Bolger, M.E.; Weisshaar, B.; Scholz, U.; Stein, N.; Usadel, B.; Mayer, K.F.X. Plant genome sequencing—Applications for crop improvement. Curr. Opin. Biotechnol. 2014, 26, 31–37. [Google Scholar] [CrossRef] [PubMed]
- Owens, C.L. SNP detection and genotyping in Vitis. Acta Hortic. 2003, 603, 139–140. [Google Scholar] [CrossRef]
- Jaillon, O. The grapevine genome sequence suggests ancestral hexaploidization in major angiosperm phyla. Nature 2007. [Google Scholar] [CrossRef]
- Velasco, R.; Zharkikh, A.; Troggio, M.; Cartwright, D.A.; Cestaro, A.; Pruss, D.; Pindo, M.; FitzGerald, L.M.; Vezzulli, S.; Reid, J.; et al. A High Quality Draft Consensus Sequence of the Genome of a Heterozygous Grapevine Variety. PLoS ONE 2007, 2, e1326. [Google Scholar] [CrossRef]
- Carrier, G.; Le Cunff, L.; Dereeper, A.; Legrand, D.; Sabot, F.; Bouchez, O.; Audeguin, L.; Boursiquot, J.M.; This, P. Transposable elements are a major cause of somatic polymorphism in Vitis vinifera L. PLoS ONE 2012, 7, e32973. [Google Scholar] [CrossRef]
- Gambino, G.; Dal Molin, A.; Boccacci, P.; Minio, A.; Chitarra, W.; Avanzato, C.G.; Tononi, P.; Perrone, I.; Raimondi, S.; Schneider, A.; et al. Whole-genome sequencing and SNV genotyping of “Nebbiolo” (Vitis vinifera L.) clones. Sci. Rep. 2017, 7, 1–15. [Google Scholar] [CrossRef]
- Roach, M.J.; Johnson, D.L.; Bohlmann, J.; van Vuuren, H.J.J.; Jones, S.J.M.; Pretorius, I.S.; Schmidt, S.A.; Borneman, A.R. Population sequencing reveals clonal diversity and ancestral inbreeding in the grapevine cultivar Chardonnay. PLoS Genet. 2018, 14. [Google Scholar] [CrossRef]
- Minio, A.; Massonnet, M.; Figueroa-Balderas, R.; Castro, A.; Cantu, D. Diploid genome assembly of the wine grape carménère. Genes Genomes Genet. 2019, 9, 1331–1337. [Google Scholar] [CrossRef]
- Girollet, N.; Rubio, B.; Bert, P.-F. De novo phased assembly of the Vitis riparia grape genome. Sci. Data 2019, 6, 1–8. [Google Scholar] [CrossRef]
- Cochetel, N.; Minio, A.; Vondras, A.M.; Figueroa-Balderas, R.; Cantu, D. Diploid chromosome-scale assembly of the Muscadinia rotundifolia genome supports chromosome fusion and disease resistance gene expansion during Vitis and Muscadinia divergence. bioRxiv 2020. [Google Scholar] [CrossRef]
- Topfer, R.; Hausmann, L. Table of Loci for Traits in Grapevine Relevant for Breeding and Genetics. VIVC Vitis Int. Var. Cat. 2010, 40024, 2–5. [Google Scholar]
- Sargolzaei, M.; Maddalena, G.; Bitsadze, N.; Maghradze, D.; Bianco, P.A.; Failla, O.; Toffolatti, S.L.; Lorenzis, G. De Rpv29, Rpv30 and Rpv31: Three Novel Genomic Loci Associated With Resistance to Plasmopara viticola in Vitis vinifera. Front. Plant Sci. 2020, 11, 1–16. [Google Scholar] [CrossRef] [PubMed]
- Barba, P.; Cadle-Davidson, L.; Harriman, J.; Glaubitz, J.C.; Brooks, S.; Hyma, K.; Reisch, B. Grapevine powdery mildew resistance and susceptibility loci identified on a high-resolution SNP map. Theor. Appl. Genet. 2014, 127, 73–84. [Google Scholar] [CrossRef] [PubMed]
- Winterhagen, P.; Howard, S.F.; Qiu, W.; Kovács, L.G. Transcriptional up-regulation of grapevine MLO genes in response to powdery mildew infection. Am. J. Enol. Vitic. 2008, 59, 159–168. [Google Scholar]
- Feechan, A.; Jermakow, A.M.; Dry, I.B. Grapevine MLO candidates required for powdery mildew pathogenicity? Plant Signal. Behav. 2009, 4, 522–523. [Google Scholar] [CrossRef]
- Pessina, S.; Lenzi, L.; Perazzolli, M.; Campa, M.; Dalla Costa, L.; Urso, S.; Valè, G.; Salamini, F.; Velasco, R.; Malnoy, M. Knockdown of MLO genes reduces susceptibility to powdery mildew in grapevine. Hortic. Res. 2016, 3. [Google Scholar] [CrossRef]
- Madeira, F.; Park, Y.M.; Lee, J.; Buso, N.; Gur, T.; Madhusoodanan, N.; Basutkar, P.; Tivey, A.R.N.; Potter, S.C.; Finn, R.D.; et al. The EMBL-EBI search and sequence analysis tools APIs in 2019. Nucleic Acids Res. 2019, 47, W636–W641. [Google Scholar] [CrossRef]
- Vitulo, N.; Forcato, C.; Carpinelli, E.; Telatin, A.; Campagna, D.; D’Angelo, M.; Zimbello, R.; Corso, M.; Vannozzi, A.; Bonghi, C.; et al. A deep survey of alternative splicing in grape reveals changes in the splicing machinery related to tissue, stress condition and genotype. BMC Plant Biol. 2014, 14, 99. [Google Scholar] [CrossRef]
- Canaguier, A.; Grimplet, J.; Di Gaspero, G.; Scalabrin, S.; Duchêne, E.; Choisne, N.; Mohellibi, N.; Guichard, C.; Rombauts, S.; Le Clainche, I.; et al. A new version of the grapevine reference genome assembly (12X.v2) and of its annotation (VCost.v3). Genomics Data 2017, 14, 56–62. [Google Scholar] [CrossRef]
- Li, H.; Durbin, R. Fast and accurate long-read alignment with Burrows–Wheeler transform. Bioinformatics 2010, 26, 589–595. [Google Scholar] [CrossRef]
- Staden, R.; Beal, K.F.; Bonfield, J.K. The staden package, 1998. In Bioinformatics Methods and Protocols; Humana Press: Totowa, NJ, USA, 2000; pp. 115–130. [Google Scholar] [CrossRef]
- Li, H.; Handsaker, B.; Wysoker, A.; Fennell, T.; Ruan, J.; Homer, N.; Marth, G.; Abecasis, G.; Durbin, R. The Sequence Alignment/Map format and SAMtools. Bioinformatics 2009, 25, 2078–2079. [Google Scholar] [CrossRef] [PubMed]
- Danecek, P.; Auton, A.; Abecasis, G.; Albers, C.A.; Banks, E.; DePristo, M.A.; Handsaker, R.E.; Lunter, G.; Marth, G.T.; Sherry, S.T.; et al. The variant call format and VCFtools. Bioinformatics 2011, 27, 2156–2158. [Google Scholar] [CrossRef] [PubMed]
- Cingolani, P.; Platts, A.; Wang, L.L.; Coon, M.; Nguyen, T.; Wang, L.; Land, S.J.; Lu, X.; Ruden, D.M. A program for annotating and predicting the effects of single nucleotide polymorphisms, SnpEff. Fly 2012, 6, 80–92. [Google Scholar] [CrossRef] [PubMed]
- Kumar, P.; Henikoff, S.; Ng, P.C. Predicting the effects of coding non-synonymous variants on protein function using the SIFT algorithm. Nat. Protoc. 2009, 4, 1073–1082. [Google Scholar] [CrossRef] [PubMed]
- Betts, M.J.; Russel, R.B. Amino acid properties and consequences of substitutions. In Bioinformatics for Geneticists; John Wiley & Sons, Ltd.: Hoboken, NJ, USA, 2003; pp. 289–316. ISBN 0-470-84393-4. [Google Scholar]
- Stephens, M.; Smith, N.J.; Donnelly, P. A new statistical method for haplotype reconstruction from population data. Am. J. Hum. Genet. 2001, 68, 978–989. [Google Scholar] [CrossRef]
- OIV (International Organisation of Vine and Wine). OIV Descriptor List for Grape Varieties and Vitis Species; OIV: Paris, France, 2009. [Google Scholar]
- Zeilmaker, T. Functional and Applied Aspects of the DOWNY MILDEW RESISTANT 1 and 6 Genes in Arabidopsis. Ph.D. Thesis, Utrecht University, Utrecht, The Netherlands, 2012. [Google Scholar]
- Proost, S.; Van Bel, M.; Vaneechoutte, D.; Van De Peer, Y.; Inzé, D.; Mueller-Roeber, B.; Vandepoele, K. PLAZA 3.0: An access point for plant comparative genomics. Nucleic Acids Res. 2015, 43, D974–D981. [Google Scholar] [CrossRef]
- Zimmermann, L.; Stephens, A.; Nam, S.Z.; Rau, D.; Kübler, J.; Lozajic, M.; Gabler, F.; Söding, J.; Lupas, A.N.; Alva, V. A Completely Reimplemented MPI Bioinformatics Toolkit with a New HHpred Server at its Core. J. Mol. Biol. 2018, 430, 2237–2243. [Google Scholar] [CrossRef]
- Kluza, A.; Niedzialkowska, E.; Kurpiewska, K.; Wojdyla, Z.; Quesne, M.; Kot, E.; Porebski, P.J.; Borowski, T. Crystal structure of thebaine 6-O-demethylase from the morphine biosynthesis pathway. J. Struct. Biol. 2018, 202, 229–235. [Google Scholar] [CrossRef]
- Amrine, K.C.H.; Blanco-Ulate, B.; Riaz, S.; Pap, D.; Jones, L.; Figueroa-Balderas, R.; Walker, M.A.; Cantu, D. Comparative transcriptomics of Central Asian Vitis vinifera accessions reveals distinct defense strategies against powdery mildew. Hortic. Res. 2015, 2. [Google Scholar] [CrossRef]
- Cadle-Davidson, L. Variation within and between Vitis spp. for foliar resistance to the downy mildew pathogen Plasmopara viticola. Plant Dis. 2008, 92, 1577–1584. [Google Scholar] [CrossRef]
- Lijavetzky, D.; Cabezas, J.; Ibáñez, A.; Rodríguez, V.; Martínez-Zapater, J.M. High throughput SNP discovery and genotyping in grapevine (Vitis vinifera L.) by combining a re-sequencing approach and SNPlex technology. BMC Genomics 2007, 8, 1–11. [Google Scholar] [CrossRef] [PubMed]
- Vezzulli, S.; Micheletti, D.; Riaz, S.; Pindo, M.; Viola, R.; This, P.; Walker, M.A.; Troggio, M.; Velasco, R. A SNP transferability survey within the genus Vitis. BMC Plant Biol. 2008, 8, 1–10. [Google Scholar] [CrossRef] [PubMed]
- Vezzulli, S.; Troggio, M.; Coppola, G.; Jermakow, A.; Cartwright, D.; Zharkikh, A.; Stefanini, M.; Grando, M.S.; Viola, R.; Adam-Blondon, A.F.; et al. A reference integrated map for cultivated grapevine (Vitis vinifera L.) from three crosses, based on 283 SSR and 501 SNP-based markers. Theor. Appl. Genet. 2008, 117, 499–511. [Google Scholar] [CrossRef]
- Salmaso, M.; Faes, G.; Segala, C.; Stefanini, M.; Salakhutdinov, I.; Zyprian, E.; Toepfer, R.; Grando, M.S.; Velasco, R. Genome diversity and gene haplotypes in the grapevine (Vitis. Mol. Breed. 2004, 385–395. [Google Scholar] [CrossRef]
- Marrano, A.; Birolo, G.; Prazzoli, M.L.; Lorenzi, S.; Valle, G.; Grando, M.S. SNP-discovery by RAD-sequencing in a germplasm collection of wild and cultivated grapevines (V. vinifera L.). PLoS ONE 2017, 12, e170655. [Google Scholar] [CrossRef]
- Schneider, K.; Weisshaar, B.; Borchardt, D.C.; Salamini, F. SNP frequency and allelic haplotype structure of Beta vulgaris expressed genes. Mol. Breed. 2001, 8, 63–74. [Google Scholar] [CrossRef]
- Simko, I.; Haynes, K.G.; Jones, R.W. Assessment of linkage disequilibrium in potato genome with single nucleotide polymorphism markers. Genetics 2006, 173, 2237–2245. [Google Scholar] [CrossRef]
- Byers, R.L.; Harker, D.B.; Yourstone, S.M.; Maughan, P.J.; Udall, J.A. Development and mapping of SNP assays in allotetraploid cotton. Theor. Appl. Genet. 2012, 124, 1201–1214. [Google Scholar] [CrossRef]
- Zhu, Y.L.; Song, Q.J.; Hyten, D.L.; Van Tassell, C.P.; Matukumalli, L.K.; Grimm, D.R.; Hyatt, S.M.; Fickus, E.W.; Young, N.D.; Cregan, P.B. Single-nucleotide polymorphisms in soybean. Genetics 2003, 163, 1123–1134. [Google Scholar] [PubMed]
- Wu, S.B.; Wirthensohn, M.G.; Hunt, P.; Gibson, J.P.; Sedgley, M. High resolution melting analysis of almond SNPs derived from ESTs. Theor. Appl. Genet. 2008, 118, 1–14. [Google Scholar] [CrossRef]
- Salmaso, M.; Malacarne, G.; Troggio, M.; Faes, G.; Stefanini, M.; Grando, M.S.; Velasco, R. A grapevine (Vitis vinifera L.) genetic map integrating the position of 139 expressed genes. Theor. Appl. Genet. 2008, 116, 1129–1143. [Google Scholar] [CrossRef] [PubMed]
- Aranzana, M.J.; Illa, E.; Howad, W.; Arús, P. A first insight into peach [Prunus persica (L.) Batsch] SNP variability. Tree Genet. Genomes 2012, 8, 1359–1369. [Google Scholar] [CrossRef]
- Tuskan, G.A.; Difazio, S.; Jansson, S.; Bohlmann, J.; Grigoriev, I.; Hellsten, U.; Putnam, N.; Ralph, S.; Rombauts, S.; Salamov, A.; et al. The Genome of Black Cottonwood Populus trichocarpa (Torr. & Gray). Science 2006, 313, 1596–1604. [Google Scholar] [CrossRef] [PubMed]
- Thavamanikumar, S.; McManus, L.J.; Tibbits, J.F.G.; Bossinger, G. The significance of single nucleotide polymorphisms (SNPs) in Eucalyptus globulus breeding programs. Aust. For. 2011, 74, 23–29. [Google Scholar] [CrossRef]
- Emanuelli, F.; Lorenzi, S.; Grzeskowiak, L.; Catalano, V.; Stefanini, M.; Troggio, M.; Myles, S.; Martinez-Zapater, J.M.; Zyprian, E.; Moreira, F.M.; et al. Genetic diversity and population structure assessed by SSR and SNP markers in a large germplasm collection of grape. BMC Plant Biol. 2013, 13, 1–17. [Google Scholar] [CrossRef]
- Jones, E.S.; Sullivan, H.; Bhattramakki, D.; Smith, J.S.C. A comparison of simple sequence repeat and single nucleotide polymorphism marker technologies for the genotypic analysis of maize (Zea mays L.). Theor. Appl. Genet. 2007, 115, 361–371. [Google Scholar] [CrossRef]
- Grattapaglia, D.; Silva-Junior, O.B.; Kirst, M.; de Lima, B.M.; Faria, D.A.; Pappas, G.J. High-throughput SNP genotyping in the highly heterozygous genome of Eucalyptus: Assay success, polymorphism and transferability across species. BMC Plant Biol. 2011, 11, 65. [Google Scholar] [CrossRef]
- Biswas, C.; Dey, P.; Karmakar, P.G.; Satpathy, S. Discovery of large-scale SNP markers and construction of linkage map in a RIL population of jute (Corchorus capsularis). Mol. Breed. 2015, 35, 1–10. [Google Scholar] [CrossRef]
- Cheng, L.; Chen, X.; Jiang, C.; Ma, B.; Ren, M.; Cheng, Y.; Liu, D.; Geng, R.; Yang, A. High-density SNP genetic linkage map construction and quantitative trait locus mapping for resistance to cucumber mosaic virus in tobacco (Nicotiana tabacum L.). Crop J. 2019, 7, 539–547. [Google Scholar] [CrossRef]
- Aflitos, S.; Schijlen, E.; De Jong, H.; De Ridder, D.; Smit, S.; Finkers, R.; Wang, J.; Zhang, G.; Li, N.; Mao, L.; et al. Exploring genetic variation in the tomato (Solanum section Lycopersicon) clade by whole-genome sequencing. Plant J. 2014, 80, 136–148. [Google Scholar] [CrossRef]
- Xanthopoulou, A.; Montero-Pau, J.; Mellidou, I.; Kissoudis, C.; Blanca, J.; Picó, B.; Tsaballa, A.; Tsaliki, E.; Dalakouras, A.; Paris, H.S.; et al. Whole-genome resequencing of Cucurbita pepo morphotypes to discover genomic variants associated with morphology and horticulturally valuable traits. Hortic. Res. 2019, 6. [Google Scholar] [CrossRef] [PubMed]
- Dong, X.; Wang, Z.; Tian, L.; Zhang, Y.; Qi, D.; Huo, H.; Xu, J.; Li, Z.; Liao, R.; Shi, M.; et al. De novo assembly of a wild pear (Pyrus betuleafolia) genome. Plant Biotechnol. J. 2019, 1–15. [Google Scholar] [CrossRef] [PubMed]
- Cardone, M.F.; D’Addabbo, P.; Alkan, C.; Bergamini, C.; Catacchio, C.R.; Anaclerio, F.; Chiatante, G.; Marra, A.; Giannuzzi, G.; Perniola, R.; et al. Inter-varietal structural variation in grapevine genomes. Plant J. 2016, 88, 648–661. [Google Scholar] [CrossRef] [PubMed]
- Baudhuin, L.M.; Lagerstedt, S.A.; Klee, E.W.; Fadra, N.; Oglesbee, D.; Ferber, M.J. Confirming variants in next-generation sequencing panel testing by sanger sequencing. J. Mol. Diagnostics 2015, 17, 456–461. [Google Scholar] [CrossRef]
- Mu, W.; Lu, H.M.; Chen, J.; Li, S.; Elliott, A.M. Sanger Confirmation Is Required to Achieve Optimal Sensitivity and Specificity in Next-Generation Sequencing Panel Testing. J. Mol. Diagnostics 2016, 18, 923–932. [Google Scholar] [CrossRef] [PubMed]
- Quaynor, S.D.; Bosley, M.E.; Duckworth, C.G.; Porter, K.R.; Kim, S.H.; Kim, H.G.; Chorich, L.P.; Sullivan, M.E.; Choi, J.H.; Cameron, R.S.; et al. Targeted next generation sequencing approach identifies eighteen new candidate genes in normosmic hypogonadotropic hypogonadism and Kallmann syndrome. Mol. Cell. Endocrinol. 2016, 437, 86–96. [Google Scholar] [CrossRef] [PubMed]
- Strom, S.P.; Lee, H.; Das, K.; Vilain, E.; Nelson, S.F.; Grody, W.W.; Deignan, J.L. Assessing the necessity of confirmatory testing for exome-sequencing results in a clinical molecular diagnostic laboratory. Genet. Med. 2014, 16, 510–515. [Google Scholar] [CrossRef]
- Zheng, J.; Zhang, H.; Banerjee, S.; Li, Y.; Zhou, J.; Yang, Q.; Tan, X.; Han, P.; Fu, Q.; Cui, X.; et al. A comprehensive assessment of Next-Generation Sequencing variants validation using a secondary technology. Mol. Genet. Genomic Med. 2019, 7, 1–7. [Google Scholar] [CrossRef]
- Satya, R.V.; DiCarlo, J. Edge effects in calling variants from targeted amplicon sequencing. BMC Genomics 2014, 15, 1–7. [Google Scholar] [CrossRef][Green Version]
- Lacombe, T.; Audeguin, L.; Boselli, M.; Bucchetti, B.; Cabello, F.; Chatelet, P.; Crespan, M.; D’Onofrio, C.; Eiras Dias, J.; Ercisli, S.; et al. Grapevine European Catalogue: Towards a comprehensive list. Vitis 2011, 50, 65–68. [Google Scholar]
- Excoffier, L.; Langaney, A. Origin and Differentiation of Human Mitochondrial DNA. J. Hum. Genet. 1989, 44, 73. [Google Scholar] [PubMed]
- Watterson, G.A.; Guess, H.A. Is the most frequent allele the oldest? Theor. Popul. Biol. 1977, 11, 141–160. [Google Scholar] [CrossRef]
- Donnelly, P.; Tavaré, S. The ages of alleles and a coalescent. Adv. Appl. Probab. 1986, 18, 1–19. [Google Scholar] [CrossRef]
- Riahi, L.; Zoghlami, N.; Dereeper, A.; Laucou, V.; Mliki, A.; This, P. Single nucleotide polymorphism and haplotype diversity of the gene NAC4 in grapevine. Ind. Crops Prod. 2013, 43, 718–724. [Google Scholar] [CrossRef]
- Fernandez, L.; Le Cunff, L.; Tello, J.; Lacombe, T.; Boursiquot, J.M.; Fournier-Level, A.; Bravo, G.; Lalet, S.; Torregrosa, L.; This, P.; et al. Haplotype diversity of VvTFL1A gene and association with cluster traits in grapevine (V. vinifera). BMC Plant Biol. 2014, 14, 1–14. [Google Scholar] [CrossRef]
- Nicolas, S.D.; Péros, J.P.; Lacombe, T.; Launay, A.; Le Paslier, M.C.; Bérard, A.; Mangin, B.; Valière, S.; Martins, F.; Le Cunff, L.; et al. Genetic diversity, linkage disequilibrium and power of a large grapevine (Vitis vinifera L) diversity panel newly designed for association studies. BMC Plant Biol. 2016, 16, 1–19. [Google Scholar] [CrossRef]
- Magris, G.; Di Gaspero, G.; Marroni, F.; Zenoni, S.; Tornielli, G.B.; Celii, M.; De Paoli, E.; Pezzotti, M.; Conte, F.; Paci, P.; et al. Genetic, epigenetic and genomic effects on variation of gene expression among grape varieties. Plant J. 2019, 99, 895–909. [Google Scholar] [CrossRef]
- Foria, S.; Copetti, D.; Eisenmann, B.; Magris, G.; Vidotto, M.; Scalabrin, S.; Testolin, R.; Cipriani, G.; Wiedemann-Merdinoglu, S.; Bogs, J.; et al. Gene duplication and transposition of mobile elements drive evolution of the Rpv3 resistance locus in grapevine. Plant J. 2020, 101, 529–542. [Google Scholar] [CrossRef]
- Schaart, J.G.; van de Wiel, C.C.M.; Lotz, L.A.P.; Smulders, M.J.M. Opportunities for Products of New Plant Breeding Techniques. Trends Plant Sci. 2016, 21, 438–449. [Google Scholar] [CrossRef]
- Bisht, D.S.; Bhatia, V.; Bhattacharya, R. Improving plant-resistance to insect-pests and pathogens: The new opportunities through targeted genome editing. Semin. Cell Dev. Biol. 2019, 1–12. [Google Scholar] [CrossRef]
- Pompili, V.; Dalla Costa, L.; Piazza, S.; Pindo, M.; Malnoy, M. Reduced fire blight susceptibility in apple cultivars using a high-efficiency CRISPR/Cas9-FLP/FRT-based gene editing system. Plant Biotechnol. J. 2020, 18, 845–858. [Google Scholar] [CrossRef] [PubMed]
- Low, Y.C.; Lawton, M.A.; Di, R. Validation of barley 2OGO gene as a functional orthologue of Arabidopsis DMR6 gene in Fusarium head blight susceptibility. Sci. Rep. 2020, 1–13. [Google Scholar] [CrossRef] [PubMed]
- Ffrench-Constant, R.H.; Bass, C. Does resistance really carry a fitness cost? Curr. Opin. Insect Sci. 2017, 21, 39–46. [Google Scholar] [CrossRef]
- Zaidi, S.S.E.A.; Mukhtar, M.S.; Mansoor, S. Genome Editing: Targeting Susceptibility Genes for Plant Disease Resistance. Trends Biotechnol. 2018, 36, 898–906. [Google Scholar] [CrossRef] [PubMed]
- Rodríguez-Leal, D.; Lemmon, Z.H.; Man, J.; Bartlett, M.E.; Lippman, Z.B. Engineering Quantitative Trait Variation for Crop Improvement by Genome Editing. Cell 2017, 171, 470–480.e8. [Google Scholar] [CrossRef]
- Wolter, F.; Puchta, H. Application of CRISPR/Cas to Understand Cis- and Trans-Regulatory Elements in Plants. In Methods in Molecular Biology; Humana Press: Totowa, NJ, USA, 2018; pp. 23–40. [Google Scholar]
- Bastet, A.; Robaglia, C.; Gallois, J.L. eIF4E Resistance: Natural Variation Should Guide Gene Editing. Trends Plant Sci. 2017, 22, 411–419. [Google Scholar] [CrossRef]
- Bastet, A.; Zafirov, D.; Giovinazzo, N.; Guyon-Debast, A.; Nogué, F.; Robaglia, C.; Gallois, J.-L. Mimicking natural polymorphism in eIF4E by CRISPR-Cas9 base editing is associated with resistance to potyviruses. Plant Biotechnol. J. 2019, 17, 1736–1750. [Google Scholar] [CrossRef]
Publisher’s Note: MDPI stays neutral with regard to jurisdictional claims in published maps and institutional affiliations. |
© 2021 by the authors. Licensee MDPI, Basel, Switzerland. This article is an open access article distributed under the terms and conditions of the Creative Commons Attribution (CC BY) license (http://creativecommons.org/licenses/by/4.0/).