Article

Exploring the Value of BRD9 as a Biomarker, Therapeutic Target and Co-Target in Prostate Cancer

by
Nafisa Barma
1,
Timothy C. Stone
1,
Lina Maria Carmona Echeverria
1,2 and
Susan Heavey
1,*
1
Division of Surgery and Interventional Sciences, University College London, London WC1E 6BT, UK
2
Department of Urology, University College London Hospitals NHS Foundation Trust, London WC1H 8NJ, UK
*
Author to whom correspondence should be addressed.
Biomolecules 2021, 11(12), 1794; https://doi.org/10.3390/biom11121794
Submission received: 3 September 2021 / Revised: 18 November 2021 / Accepted: 22 November 2021 / Published: 30 November 2021

Abstract

:
Background and aims: Despite recent advances in advanced prostate cancer treatments, clinical biomarkers or treatments for men with such cancers are imperfect. Targeted therapies have shown promise, but there remain fewer actionable targets in prostate cancer than in other cancers. This work aims to characterise BRD9, currently understudied in prostate cancer, and investigate its co-expression with other genes to assess its potential as a biomarker and therapeutic target in human prostate cancer. Materials and methods: Omics data from a total of 2053 prostate cancer patients across 11 independent datasets were accessed via Cancertool and cBioPortal. mRNA M.expression and co-expression, mutations, amplifications, and deletions were assessed with respect to key clinical parameters including survival, Gleason grade, stage, progression, and treatment. Network and pathway analysis was carried out using Genemania, and heatmaps were constructed using Morpheus. Results: BRD9 is overexpressed in prostate cancer patients, especially those with metastatic disease. BRD9 expression did not differ in patients treated with second generation antiandrogens versus those who were not. BRD9 is co-expressed with many genes in the SWI/SNF and BET complexes, as well as those in common signalling pathways in prostate cancer. Summary and conclusions: BRD9 has potential as a diagnostic and prognostic biomarker in prostate cancer. BRD9 also shows promise as a therapeutic target, particularly in advanced prostate cancer, and as a co-target alongside other genes in the SWI/SNF and BET complexes, and those in common prostate cancer signalling pathways. These promising results highlight the need for wider experimental inhibition and co-targeted inhibition of BRD9 in vitro and in vivo, to build on the limited inhibition data available.

1. Introduction

1.1. Prostate Cancer and Its Biomarkers

Prostate cancer (PCa) is the second most common cancer in men and the most commonly diagnosed in the UK, representing 7.1% of new cancers and 3.8% of cancer deaths worldwide [1,2,3,4].
Prostate-specific antigen (PSA) is a protein typically produced in the prostate and used as a biomarker to prompt further investigation (e.g., biopsy) for PCa and its recurrence) [5]. PSA does not provide any information about the aggressivity and stage of any potential cancer, and testing is often associated with overdiagnosis and overtreatment, with a recent meta-analysis finding that screening did not impact overall mortality, despite men who were screened having a higher incidence of PCa [6]. There are efforts to improve the diagnosis and discovery of dx biomarkers, including the United States Food and Drug Administration (FDA)-approved Progensa assay (PCA3 (PCa gene 3) and PSA) and STHLM3 (Stockholm-3), which is currently being validated [7,8,9]. However, these are imperfect, and more sensitive and specific biomarkers are needed both for detecting PCa and driving treatment [10].

1.2. Current Therapies for PCa

Though PCa survival is relatively high (85% five-year survival), this is much reduced (50%) for stage four PCa [11]. Treatments are often invasive with side effects for radical prostatectomy (surgical removal of the prostate) and radiotherapy, including urinary incontinence and erectile dysfunction [12,13]. Therapies for PCa range from hormonal therapies (including androgen deprivation therapy (ADT)) to chemotherapy and recently approved targeted therapies. Targeted therapies aim to inhibit specific proteins and are have shown huge promise as a future area of therapeutics for PCa, with the recent FDA approval of the poly-ADP ribose polymerase inhibitors (PARPi) olaparib and rucaparib for metastatic castration-resistant prostate cancer (mCRPC) [14].
With poor outcomes for patients with advanced stage cancer and the development of resistance to existing therapies, BRD9 may have utility along the PCa clinical pathway as a biomarker and a therapeutic target. New targeted therapies, such as those targeting BRD9, with less toxic and life-altering effects would be of great benefit in treating patients with PCa.

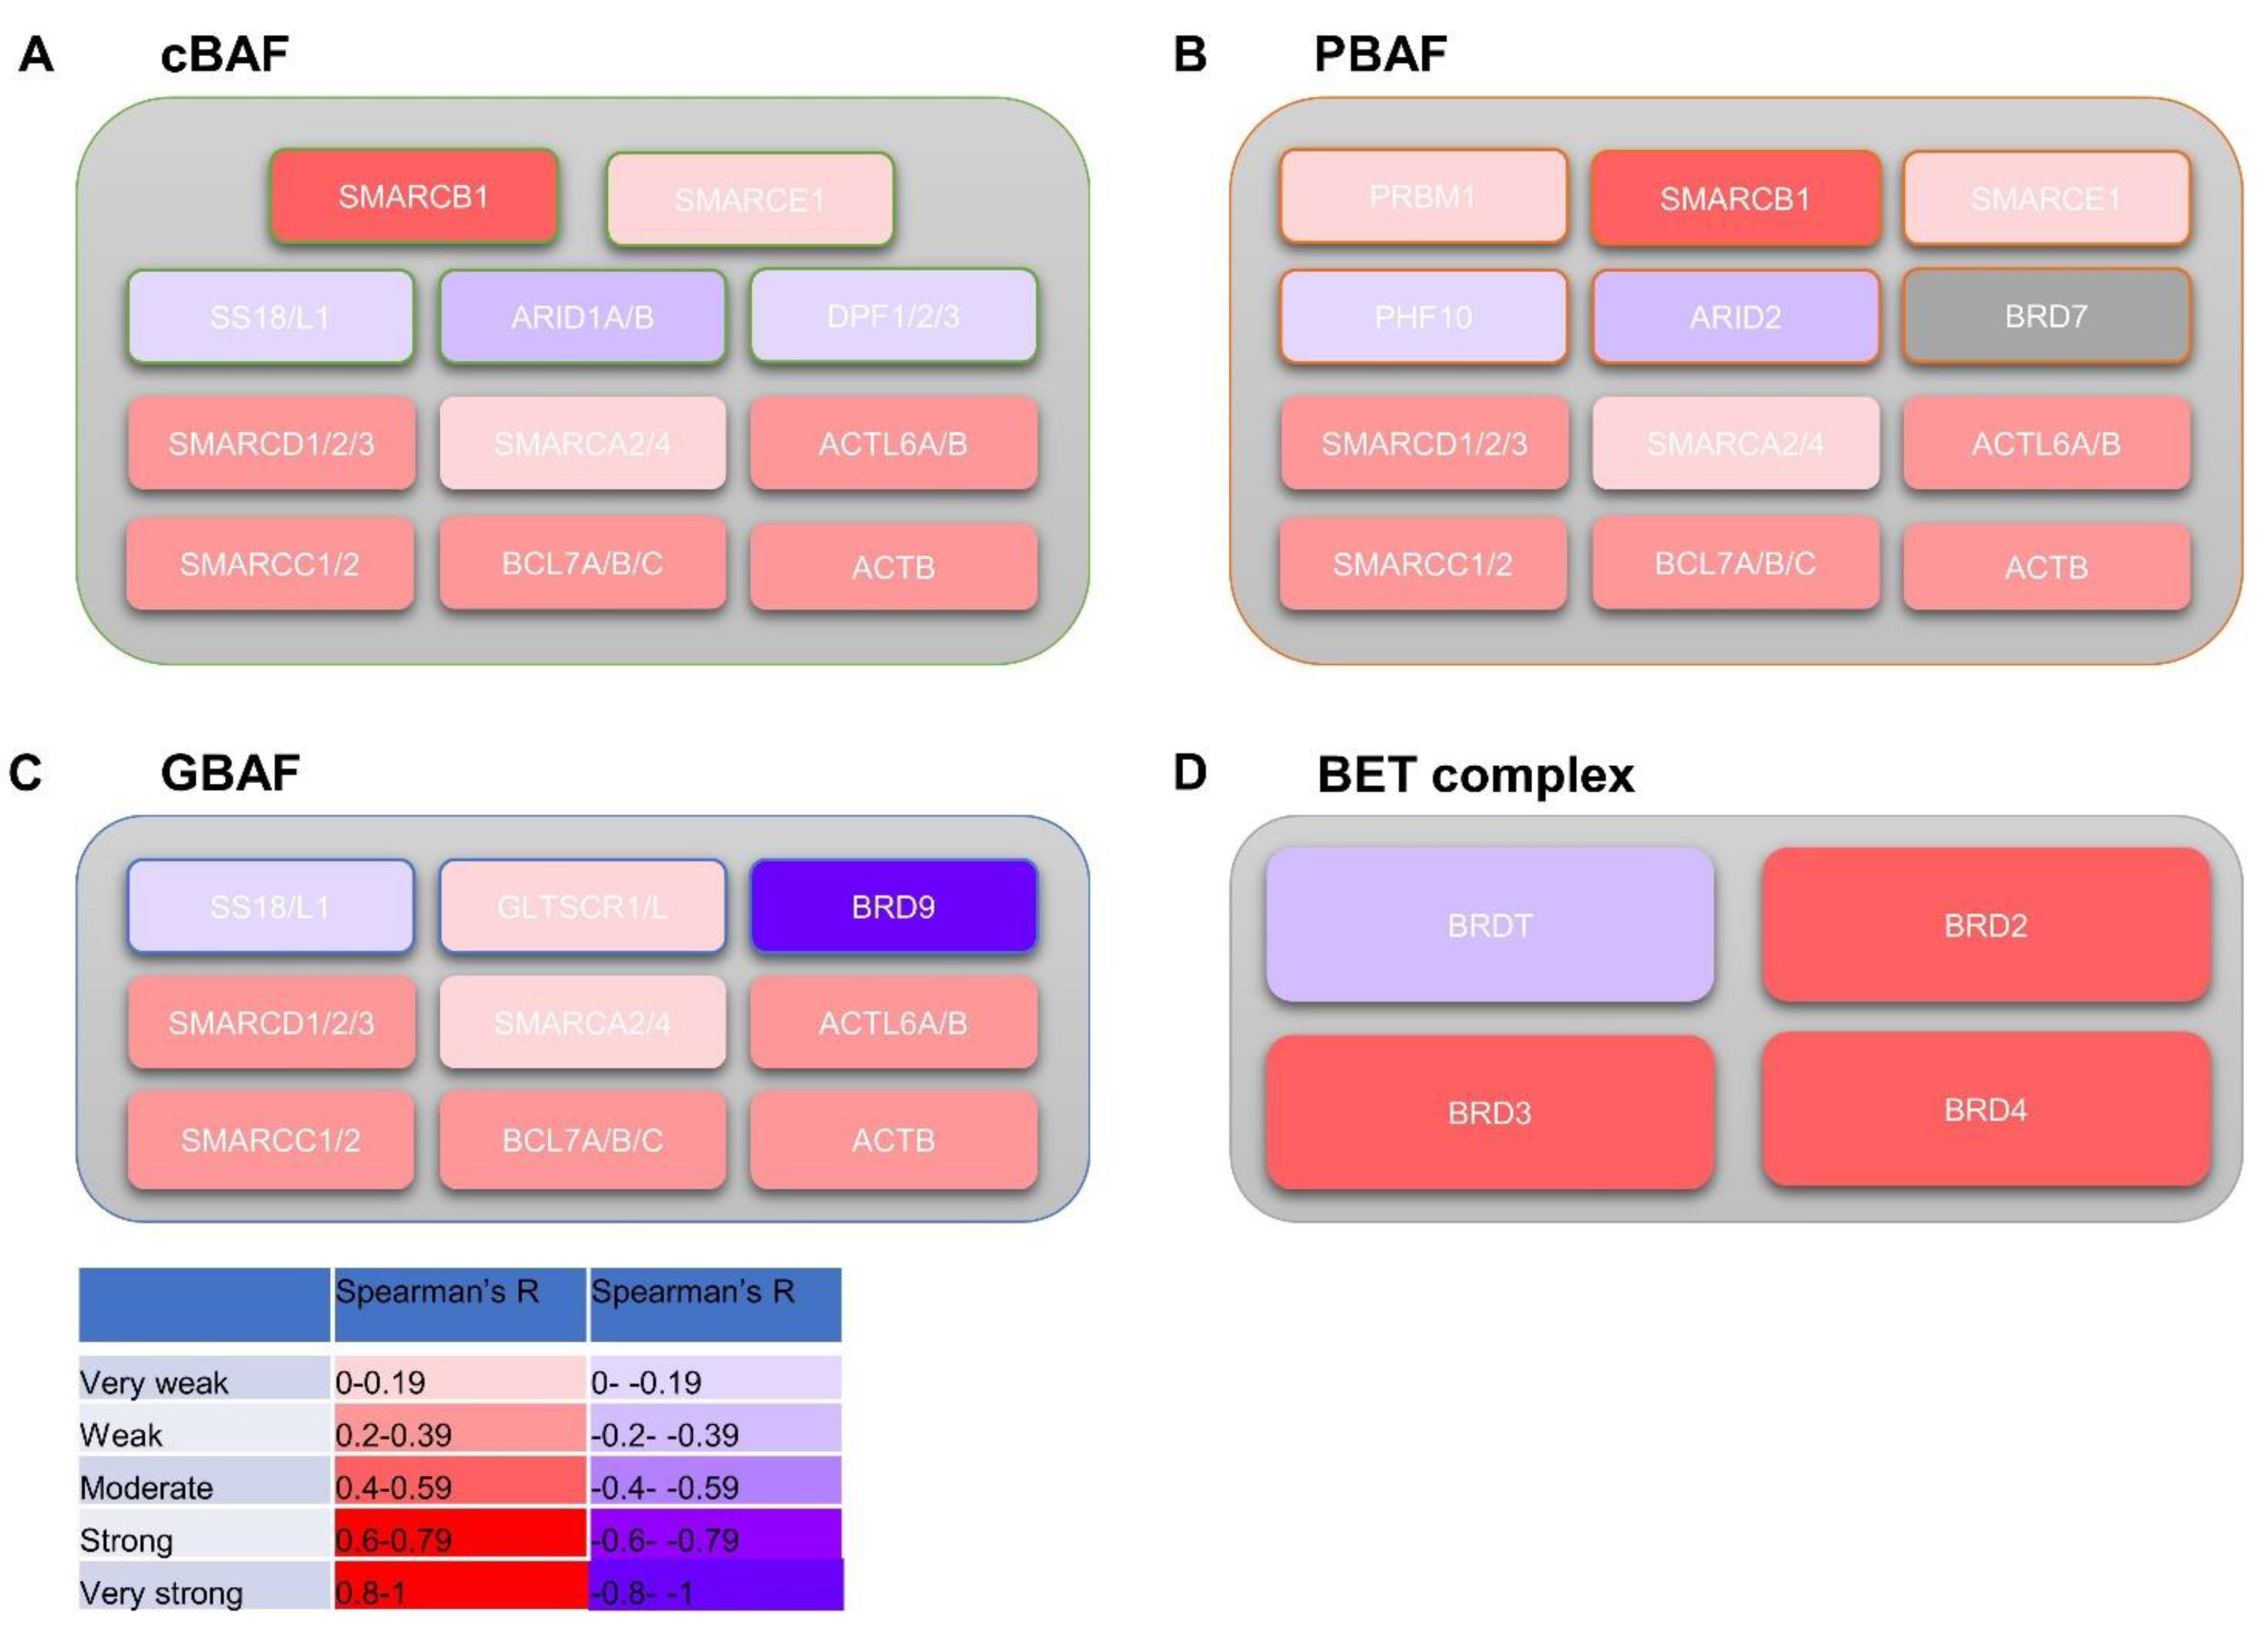
1.3. The Relationship between BRD9 and SWI/SNF and BET Complexes

BRD9 is a genetic subunit of the non-canonical barrier-to-autointegration factor (ncBAF), also termed GBAF. This is one of the subunits composing the switch/sucrose non-fermentable (SWI/SNF) complex along with canonical barrier-to-autointegration factor (cBAF) and Polybromo-barrier-to-autointegration factor (PBAF). These complexes are involved in chromatin remodelling and cancer, containing both oncogenes and tumour suppressor genes [15]. Similarly, the Bromodomain and extra-terminal domain (BET) complex is involved in regulating transcription by RNA polymerase II [16]. This represents a possible therapeutic target in PCa with the selective small-molecule BET inhibitors JQ1 and I-BET preventing growth of androgen receptor (AR) positive castrate-resistant prostate cancer (CRPC) cell lines [17]. Both BET complex and BRD9 inhibition have also been shown to have similar effects on gene expression [18]. BRD9 has been shown to associate with BRD2 and BRD4 proteins in the BET complex; Alpsoy et al. showed BRD9 immunoprecipitated BRD2 and BRD4, and when either BRD9 or BET complex proteins were inhibited, their interaction was reduced [19].

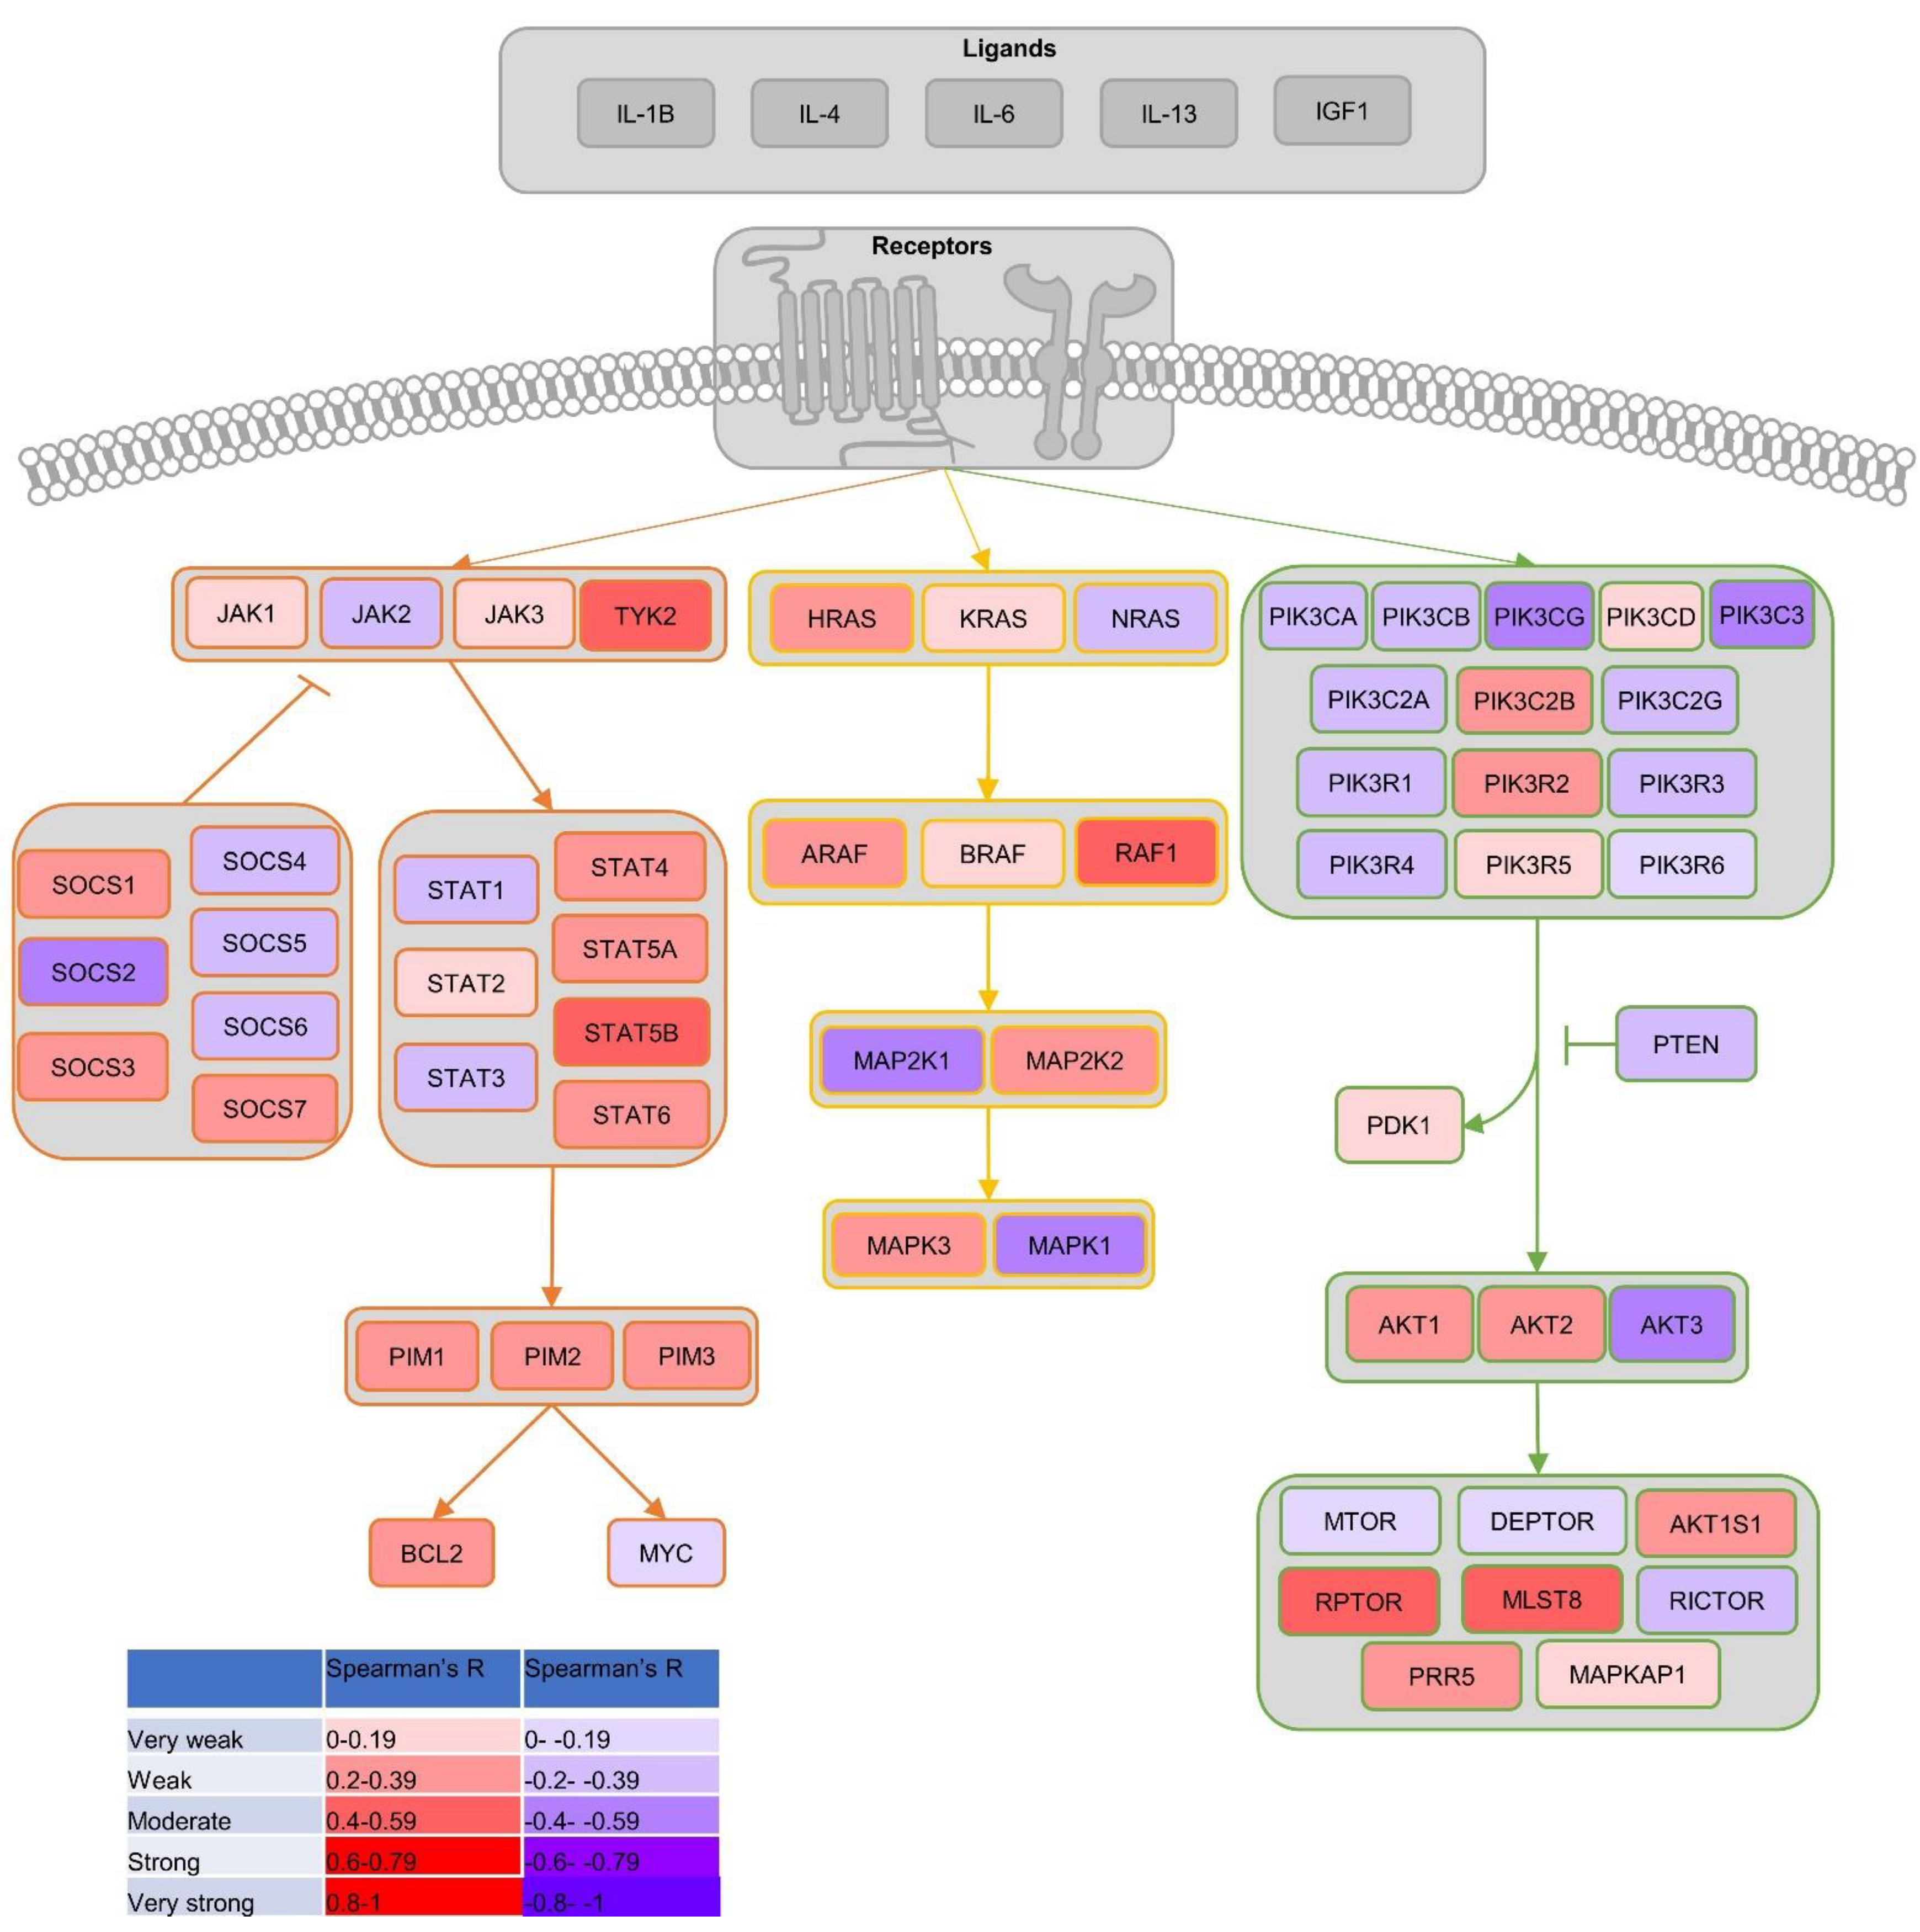
1.4. Common Signalling Pathways in PCa

Pathways involved in driving PCa proliferation involve the JAK-STAT (janus kinase; signal transducer and activator of transcription), MAPK (mitogen-activated protein kinase), and PI3K-AKT-mTOR (phosphoinositide 3-kinase; Protein Kinase B; mammalian target of rapamycin) pathways.
The JAK-STAT pathway is regulated by SOCS (suppressor of cytokine signalling) genes and is involved in regulation of “cell growth, differentiation, proliferation, invasion, survival, and inflammation” [20]. Its persistent activation in PCa can result in progression, rendering it a worthwhile therapeutic target, with one study finding STAT5A/B gene amplification and increased protein expression in PCa, and to a greater extent, in higher grade, castration-resistant and metastatic disease [20,21]. The MAPK pathway is also involved in cell regulation and represents a possible therapeutic target in PCa, with one study finding patients with increased nuclear MAPK protein expression more likely to develop CRPC, earlier biochemical relapse, and reduced survival [22,23]. Another study found that 32% of patients with mCRPC have frequent amplifications in MAPK pathway-involved genes, and that this pathway is a promising target for mCRPC, with extracellular receptor kinase 1 (ERK1) inhibitor trametinib (currently approved for melanoma) being investigated for mCRPC in a phase II trial [24]. PI3K-AKT-mTOR is another often-dysregulated signalling pathway, especially in CRPC [25]. Though no drugs targeting this pathway have been approved in PCa, the AKT-inhibitor ipatasertib performed well in combination with abiraterone in a phase Ib/II study, and the IPATential150 phase III trial is underway [26,27]. Initial data shows a higher radiographic progression-free survival in the ipatasertib compared to the control group (18.5 months vs. 16.5 months), though it is too early for overall survival (OS) data and conclusions to be drawn [28]. Transmembrane protease, serine 2-erythroblast transformation-specific (TMPRSS2-ETS) genetic fusion, is a molecular subtype (ETS-related gene (ERG) positive) of PCa associated with cancer invasiveness found in 50% of PCa tumours [29,30]. Agents such as the small-molecule selective ERG inhibitor ERGi-USU (1-[2-Thiazolylazo]-2-naphthol) are being developed to target this fusion [31].
These pathways may represent opportunities for co-targeting with BRD9 as well as being targets themselves.

1.5. BRD9 and PCa

BRD9 has been generating interest in the cancer research community in recent years, with data emerging in cancers such as squamous cell lung cancer, synovial sarcoma, and malignant rhabdoid tumours, where it has been shown to induce cancer hallmarks, correlate with aggression, and crucially, inhibition has led to anti-cancer effects [32,33,34,35]. However, despite this work in other cancers, BRD9 has not been well studied in PCa to date, with only one paper published in December 2020, which directly focused on BRD9 expression and inhibition in the disease [19,32,33,36]. This paper showed that BRD9 inhibition and knockdown have overlapping effects, reducing AR-positive cell line growth both in vivo and in vitro. The authors also found that BRD9 interacts with the AR in PCa cell lines, even those resistant to androgen deprivation and inhibition. They also provided cell-line evidence that BRD9 and the BET complex associate with each other and interact given they have overlapping transcriptional targets. The authors previously investigated the SWI/SNF complex and how its components GLTSCR1 and GLTSCR1-L are involved in chromatin remodelling and along with BRD9 form a unique subcomplex however they did not focus on BRD9 and PCa here [37].
Despite publishing the first paper on BRD9 in PCa, the authors did not begin with an unbiased characterisation of this gene in human PCa using extensive existing publicly available data. Instead, they focussed almost exclusively on CRPC (developed by 10–20% PCa patients within 5 years) and worked with cell lines [38]; much remains to be answered regarding BRD9’s behaviour across the clinical pathway. However, the authors’ findings were encouraging, warranting further investigation, which could lead to clinical trials if future results continue to have promise.
Here, we set out to determine whether BRD9 represents a potential biomarker, monotherapeutic target, and co-target alongside other targeted therapies in PCa.

2. Materials and Methods

2.1. Cancertool, cBioPortal and Genemania

We used publicly available data to investigate BRD9 as a biomarker and therapeutic target and co-target in PCa. With regard to BRD9 as a biomarker, we compared BRD9 mRNA expression in samples from patients with and without PCa, those with different grades and stages of PCa, and patients who received and responded to treatment. When investigating BRD9 as a therapeutic target and co-target in PCa, we looked at how BRD9 mRNA expression was correlated with AR messenger ribonucleic acid (mRNA) expression and other genes involved in common PCa signalling pathways as well as the BET complex, as well as interactions between BRD9 and some of these genes. We then graphed and analysed these data.
Cancertool was used to access BRD9 mRNA expression in PCa cohorts as well as gene mRNA correlations in PCa. It is a publicly available interface that generates graphical visualisations of data, performs some statistical analyses, and allows users to download raw data for processing and analysis [39].
The cBioPortal for Cancer Genomics was also used to access PCa cohort data. This platform integrates various genomic data, allowing users to investigate, view, and download data relating to gene expression, mutation data (for some cohorts), and clinical attributes [40,41].
Genemania performs network analyses between inputted genes and presents relationships as a colour-coded network [42].
The following cohorts (cancer omics datasets) were accessed via Cancertool and cBioPortal (Table 1).

2.2. Gene Correlations and Co-Expression Analysis

Gene correlations were investigated by downloading raw data from Cancertool and cBioPortal and processing the data using Microsoft Excel. Datasets accessed are summarised above in Table 1. Following this, data were graphed, and statistical analyses carried out using GraphPad Prism version 9.1.0.
Co-expression between BRD9 and genes involved in signalling pathways and complexes of interest were investigated using Genemania and Cancertool. Spearman’s rank-order correlation coefficient (R) and its statistical significance were calculated in Cancertool. Correlation coefficient data was then processed using Microsoft Excel, and heatmaps were created using Morpheus to visually represent the correlation between BRD9 expression and expression of other related genes of interest [54]. Once generated, the heatmaps were examined and p values were manually indicated by adding ‘*’ to any pixel whose correlation was significant, with significance determined at α = 0.05.

2.3. Comparing Continuous Data

Before comparisons were performed, data were graphed and tested for normality using Shapiro–Wilk and Kolmogorov–Smirnov tests. All data were unpaired. When comparing two groups, normally distributed data were analysed using Welch’s t-test, as group standard deviations differed. Non-normally distributed data were analysed using a Mann–Whitney U test. Where more than two groups were to be compared, normally distributed data were analysed using the Brown–Forsythe and Welch’s analysis of variance (ANOVA) test as group standard deviations differed. Dunnett’s T3 test was then performed as a post hoc multiple comparisons test. Non-normally distributed data were analysed using the Kruskal–Wallis test. Dunn’s test was then performed as a post hoc multiple comparisons test.
Following statistical analysis, data were graphed using violin plots, as these better illustrate data distribution and density than bar graphs and box and whisker plots [55].

2.4. Correlations

Spearman’s R correlations could be classified as very weak, weak, moderate, strong or very strong (Table 2) [56].

2.5. Survival Analysis

Disease-free survival (DFS) was illustrated using Kaplan–Meier survival curves. Patients were grouped by quartile expression of BRD9. A Mantel–Cox test was performed to compare the differences between curves and a cox regression model was used to calculate hazard ratio (HR) between the first and fourth quartiles.

2.6. Comparing Mutation Distribution

Where somatic mutation data (amplification, gain of function, missense, shallow deletion, and deep deletions) was available, this was summarised and graphed using stacked bar charts. As categorical variables investigated had small sample sizes and expected frequencies < 1 for some cells, Fisher’s exact test was required to analyse mutation distribution. This test was implemented in R. In some instances, modified estimates of the p-value were necessary, as certain tables were too computationally intensive to calculate. The approximation was calculated via a Monte Carlo simulation (number of samples = 1,000,000). In every instance, the p-values indicated that the data were considerably below the threshold for significance (p < 10−5).

3. Results

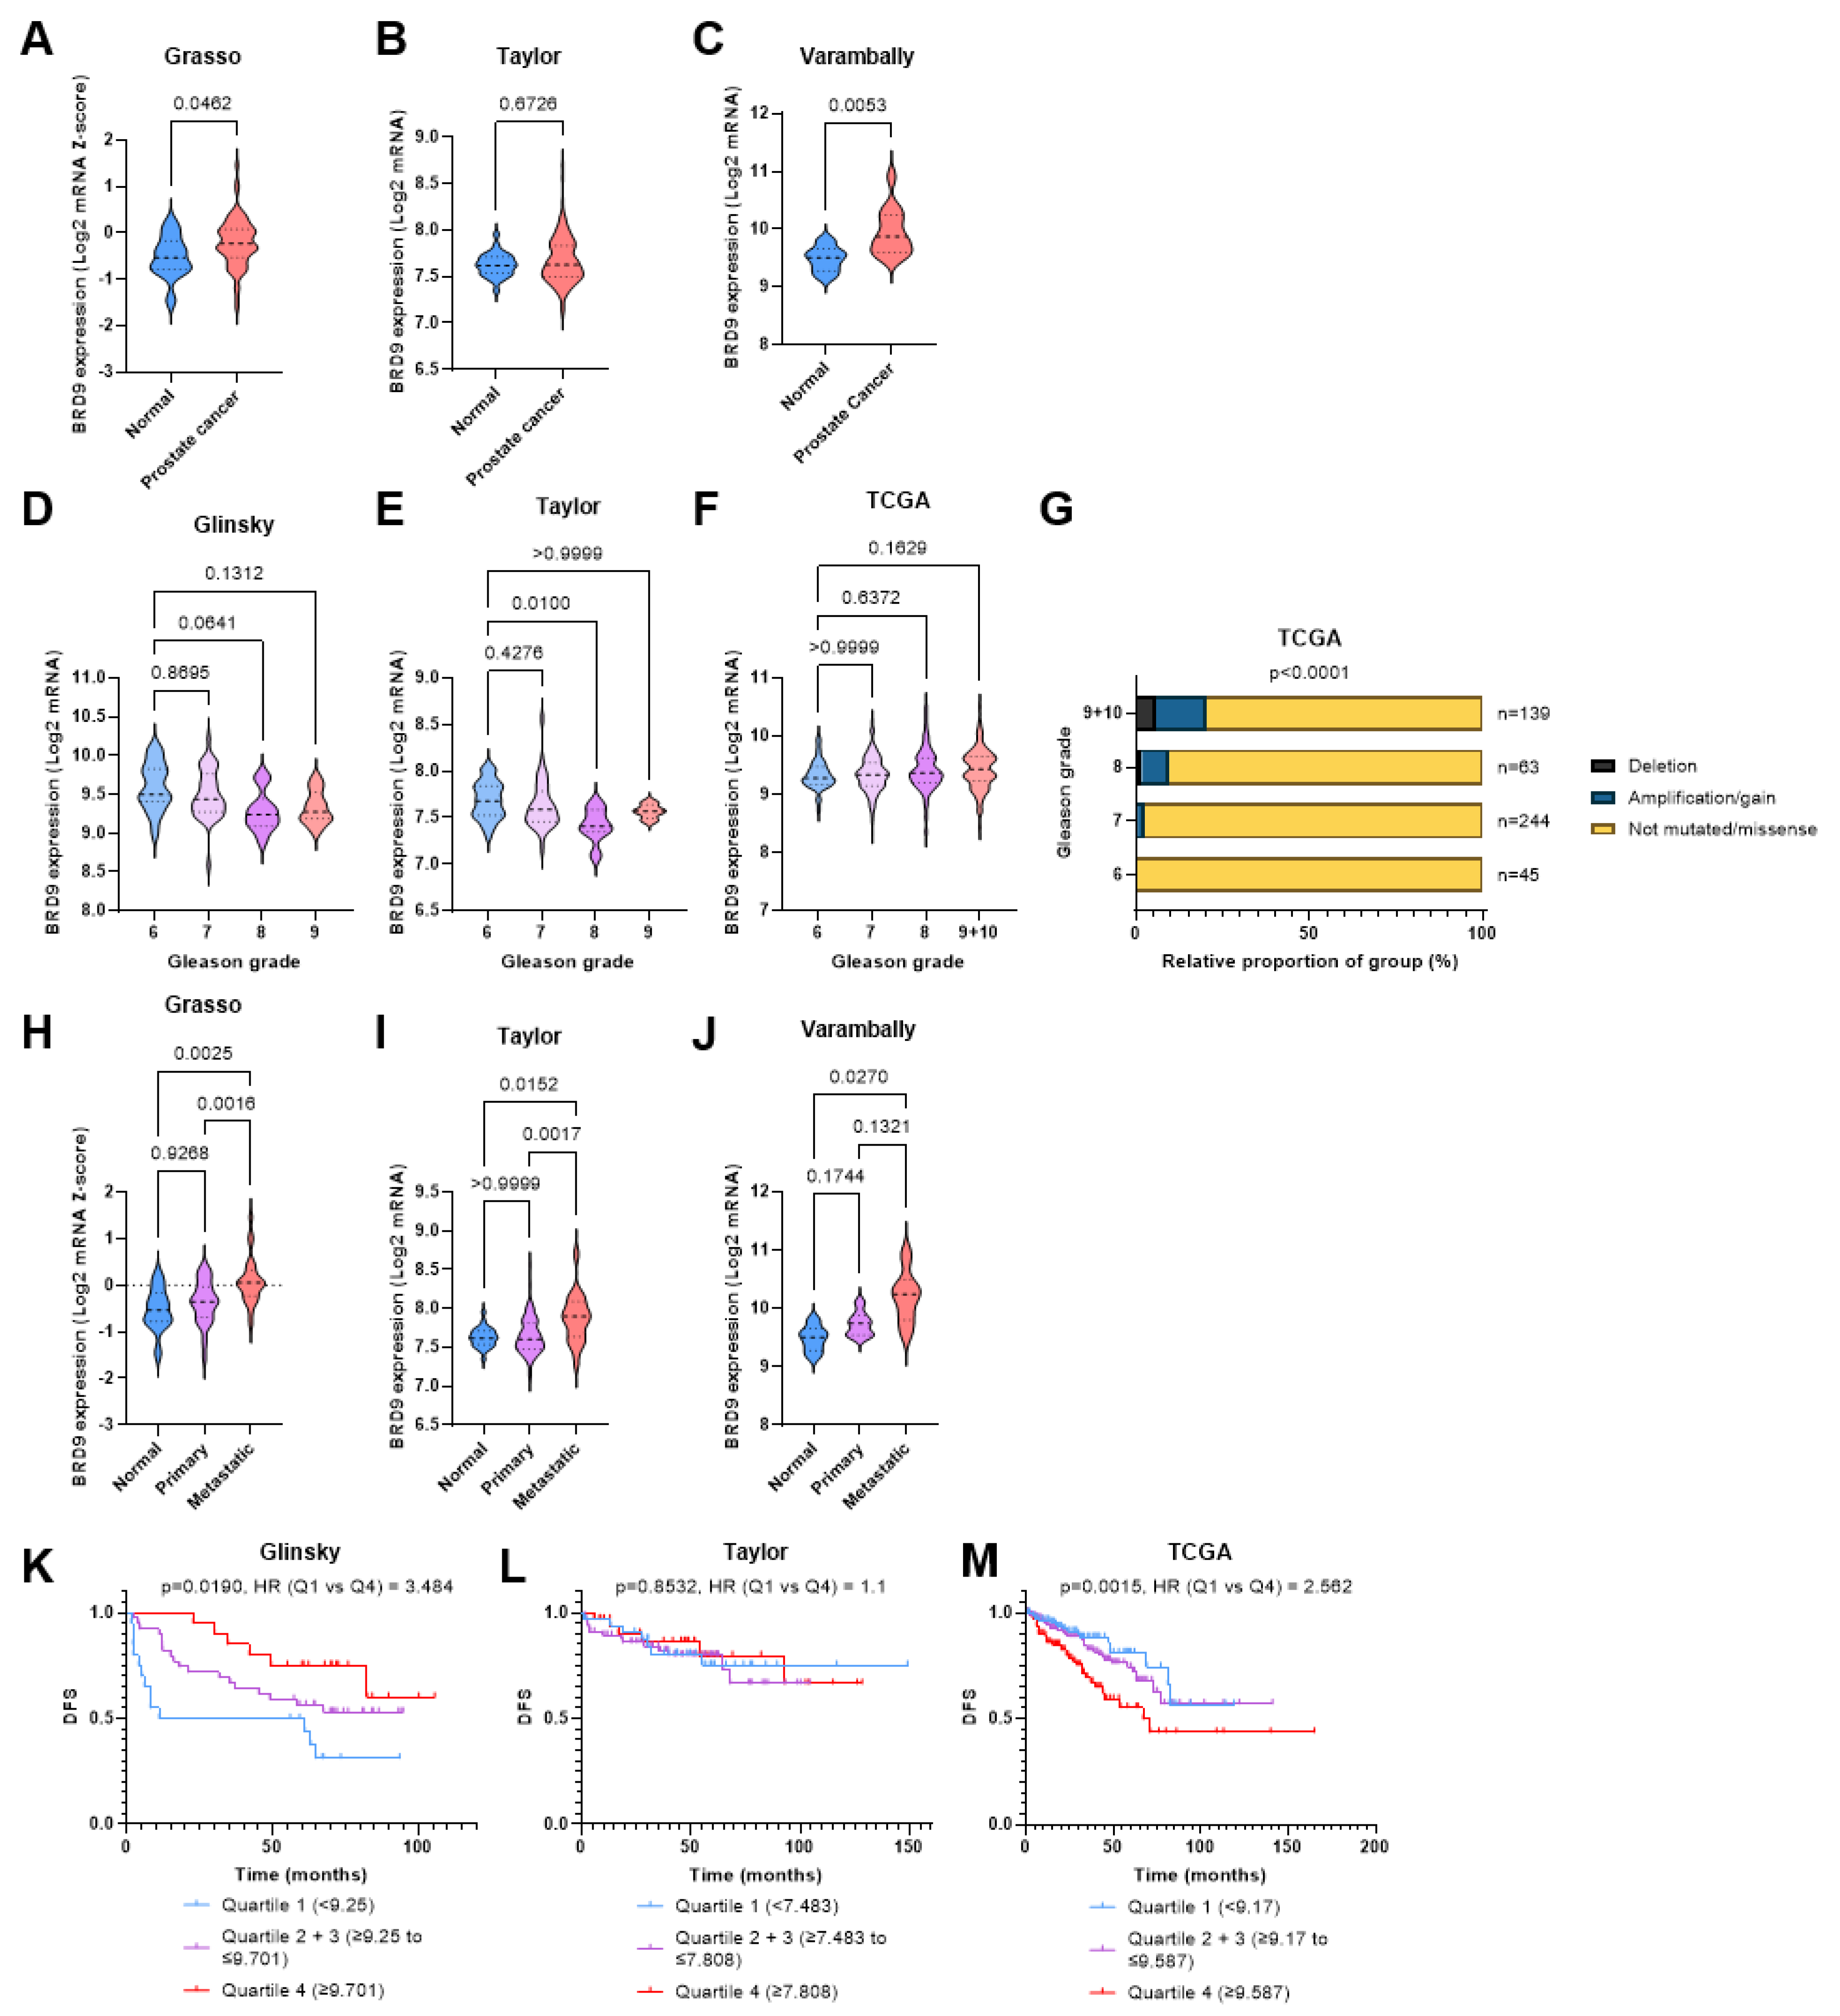
3.1. BRD9 Has Potential as a Diagnostic and Prognostic Biomarker in PCa

BRD9 is overexpressed in human prostate tumour tissue, playing a role as a diagnostic biomarker. It may also be overexpressed in more aggressive PCa, and this overexpression may correlate with reduced survival in patients. Comparison of BRD9 expression in the Grasso cohort revealed that BRD9 is overexpressed in PCa patients (p = 0.0462) (Figure 1A). In the Taylor cohort, there was no significant difference in BRD9 expression (p = 0.6726); however, this was positively skewed (Figure 1B). The Varambally cohort also showed greater BRD9 expression in PCa (p = 0.0053) compared to benign samples from the same prostate (Figure 1C). Regarding Gleason grade and BRD9 mRNA expression, using Gleason grade 6 as a baseline, there was no significant change in BRD9 expression level as Gleason grade increased in the Glinsky cohort (p > 0.05) (Figure 1D). In the Taylor cohort, there was only a significant change (decrease) in BRD9 expression at Gleason grade 8 (p = 0.0100) (Figure 1E). In the TCGA cohort, there was no significant difference between Gleason grade and BRD9 expression (p > 0.05) (Figure 1F). BRD9 mutations were more prevalent in patients with higher graded disease (p < 0.0001) (Figure 1G). In terms of BRD9 expression in normal prostate, primary, and metastatic PCa, in the Grasso cohort, there was no significant difference (p = 0.9268) in BRD9 expression between normal prostate and primary PCa; however, there was a significant increase in BRD9 expression in the metastatic PCa group, both when compared to benign prostate (p = 0.0025) and primary PCa (p = 0.0016) groups (Figure 1H). Similarly, in the Taylor cohort, there was only a significant increase in BRD9 expression between the normal prostate and metastatic (p = 0.0152), and primary and metastatic groups (p = 0.0017) (Figure 1I). The Varambally cohort only showed a significant change in BRD9 expression between the normal and metastatic groups (p = 0.0270) (Figure 1J). In the Glinsky cohort, patients with higher BRD9 expression had significantly higher DFS (p = 0.0190) (Figure 1K). In the Taylor cohort, there was no significant difference (p = 0.8532) in DFS between patients with the lowest and highest BRD9 expression (Figure 1L). In the TCGA cohort, patients with higher BRD9 levels had significantly lower DFS than those with lower levels (p = 0.0015) (Figure 1M).

3.2. BRD9 Is Not Overexpressed in Patients with Advanced Stage PCa

BRD9 expression in advanced stage PCa was assessed. In all cohorts investigated, there was no significant change in BRD9 expression in more advanced stage disease (p > 0.05) (Supplementary Figure S1a,c,e–g). In the TCGA cohort, BRD9 mutations were more prevalent in patients with more advanced disease (p < 0.0001) (Supplementary Figure S1b); however, this did not appear to be the case in the Ren cohort (p = 0.7062) (Supplementary Figure S1d).

3.3. BRD9 Does Not Appear to Play a Role as a Predictive Biomarker in PCa

BRD9 expression levels were assessed in patient responses to therapy and in patients undergoing various therapeutic regimens. Data regarding this were lacking in most cohorts. There was no significant difference in BRD9 expression between primary therapy outcomes in the TCGA cohort (p > 0.05) (Figure 2A). BRD9 mutations were less prevalent in patients with a complete response to primary therapy in this cohort (p < 0.0001) (Figure 2B). There was no significant difference in BRD9 expression in patients indicated for adjuvant radiotherapy in the TCGA cohort (p = 0.4795) (Figure 2C), though BRD9 mutations were more prevalent in patients indicated for adjuvant radiotherapy here (p < 0.0001) (Figure 2D). There was no significant difference in BRD9 expression in patients who received chemotherapy in the Kumar cohort (p = 0.4564) (Figure 2E), though BRD9 mutations were more prevalent in patients who did not receive chemotherapy (p < 0.0001) (Figure 2F). There was no significant difference in BRD9 expression between different therapy regimens in the Abida cohort (p > 0.05) (Figure 2G). BRD9 mutations appeared to be similarly prevalent across various regimens (p < 0.0001) (Figure 2H).

3.4. BRD9 May Play a Role as a Therapeutic Target in CRPC

BRD9 and AR mRNA expression correlation and BRD9 expression in patients receiving second generation antiandrogens (abiraterone and enzalutamide) was investigated. The TCGA cohort demonstrated a moderate negative correlation between BRD9 and AR expression in PCa patients (R = −0.4117, p < 0.0001) (Figure 3A). There was no significant difference in BRD9 expression and abiraterone and enzalutamide exposure status in the Abida and Dan cohorts (p > 0.05) (Figure 3B,D); however, BRD9 mutations were more prevalent in patients treated with these drugs (p < 0.0001) (Figure 3C,E)

3.5. BRD9 Correlates with Genes in the SWI/SNF and BET Complexes

BRD9 expression and its correlation with other genes in the SWI/SNF and BET complexes was investigated. BRD9 expression was positively correlated with most genes in the SWI/SNF complex (Figure 4A–C): it was negatively correlated with ACTB, BCL7A, BCL7B, BCL7C, SMARCA4, SMARCC2, SMARCD1, SMARCD2, SMARCD3, GLTSCR1, DPF1, DPF2, SMARCB1, and SMARCE1 and negatively correlated with SMARCA2 and ARID2 at a significant level (p > 0.05). The cohorts disagreed on whether BRD9 expression was positively or negatively correlated with other genes in the SWI/SNF complex at a significant level (p > 0.05) (Supplementary Figure S2a). BRD9 was co-expressed and co-localised and physically interacted with SMARCD1. It also physically interacted with SS18 and shared a domain with BRD7 and PBRM1. BRD9 genetically interacted with DPF2 and was co-expressed with SMARCC1, SMARCC2, BCL7B, and BCL7C (Supplementary Figure S2b). BRD9 was positively correlated with most genes in the BET complex (Figure 4D): it positively correlated with BRD2, BRD3, and BRD4 at a significant level in the Grasso, Taylor, and Varambally cohorts (p > 0.05). BRD9 was negatively correlated with BRDT at a significant level in the Taylor cohort—though it was positively correlated with BRDT in the other cohorts, the correlation was not significant (p > 0.05) (Supplementary Figure S3a). BRD9 has shared protein domains with genes found in the BET complex, physically interacted with BRD4, and was co-expressed with BRD2 (Supplementary Figure S3b).

3.6. BRD9 Correlates with Genes Involved in Common PCa Proliferation-Driving Pathways

The correlation of BRD9 with known genes involved in the JAK-STAT, MAPK, and PI3K-AKT-mTOR pathways was investigated (Figure 5). We found that BRD9 is negatively correlated with JAK2 and positively with TYK2. BRD9 was also positively correlated with STAT2, STAT4, STAT5A, STAT5B, and STAT6 as well as PIM1, PIM2, and PIM3 at a significant level (p > 0.05). The cohorts disagreed on its correlation with BCL2 and MYC: Taylor demonstrated a significant negative correlation between BRD9 and BCL2; however, Varambally demonstrated the opposite (p > 0.05). Taylor demonstrated a positive correlation between BRD9 and MYC, whereas the Varambally cohort demonstrated the opposite. BRD9 was positively correlated with SOCS1 and negatively correlated with SOCS2, SOCS5, and SOCS6. It appeared to be positively correlated with SOCS3 and negatively correlated with SOCS4. The cohorts disagreed on whether it was positively or negatively correlated with SOCS7—though Grasso and Varambally found significant positive correlations between BRD9 and SOCS7 expression, TCGA data showed a significant negative correlation between these genes (p > 0.05) (Supplementary Figure S4a). BRD9 was co-expressed with TYK2, STAT4, and SOCS7 (Supplementary Figure S4b). In all cohorts investigated, there was a positive correlation between BRD9 expression and HRAS expression, though this was only significant in the Grasso, Taylor, and TCGA cohorts (p > 0.05). The cohorts disagreed on whether BRD9 is correlated with KRAS and NRAS positively or negatively at a significant level (p > 0.05). BRD9 was positively correlated with ARAF, BRAF and RAF1 at a significant level in most of cohorts; however, in the TCGA cohort the correlations are negative and significant (p > 0.05). BRD9 was negatively correlated with MAP2K1 and positively correlated with MAP2K2. BRD9 was positively correlated with MAPK3 and negatively correlated with MAPK1 (Supplementary Figure S5a). BRD9 was co-expressed with HRAS, RAF1, and ARAF (Supplementary Figure S5b). BRD9 was negatively correlated with PIK3CA, PIK3CB, PIK3CG, PIK3R1, PIK3R3, PIK3R4, PIK3C2A, PIK3C2G, and PIK3C3 (p > 0.05). It was positively correlated with PIK3R2. BRD9 was negatively correlated with PTEN at a significant level in the Grasso, Taylor, and TCGA cohorts (p > 0.05). BRD9 was positively correlated with PDK1 at a significant level in the Grasso and Taylor cohorts (p > 0.05). BRD9 was positively correlated with AKT1 and AKT2; however, it was negatively correlated with AKT3 (p > 0.05). In terms of the TOR complexes, BRD9 was positively correlated with AKT1S1, RPTOR, MLST8, PRR5, and MAPKAP1 (Supplementary Figure S6a). BRD9 was co-expressed with PI3K3C2B and AKT2 (Supplementary Figure S6b).

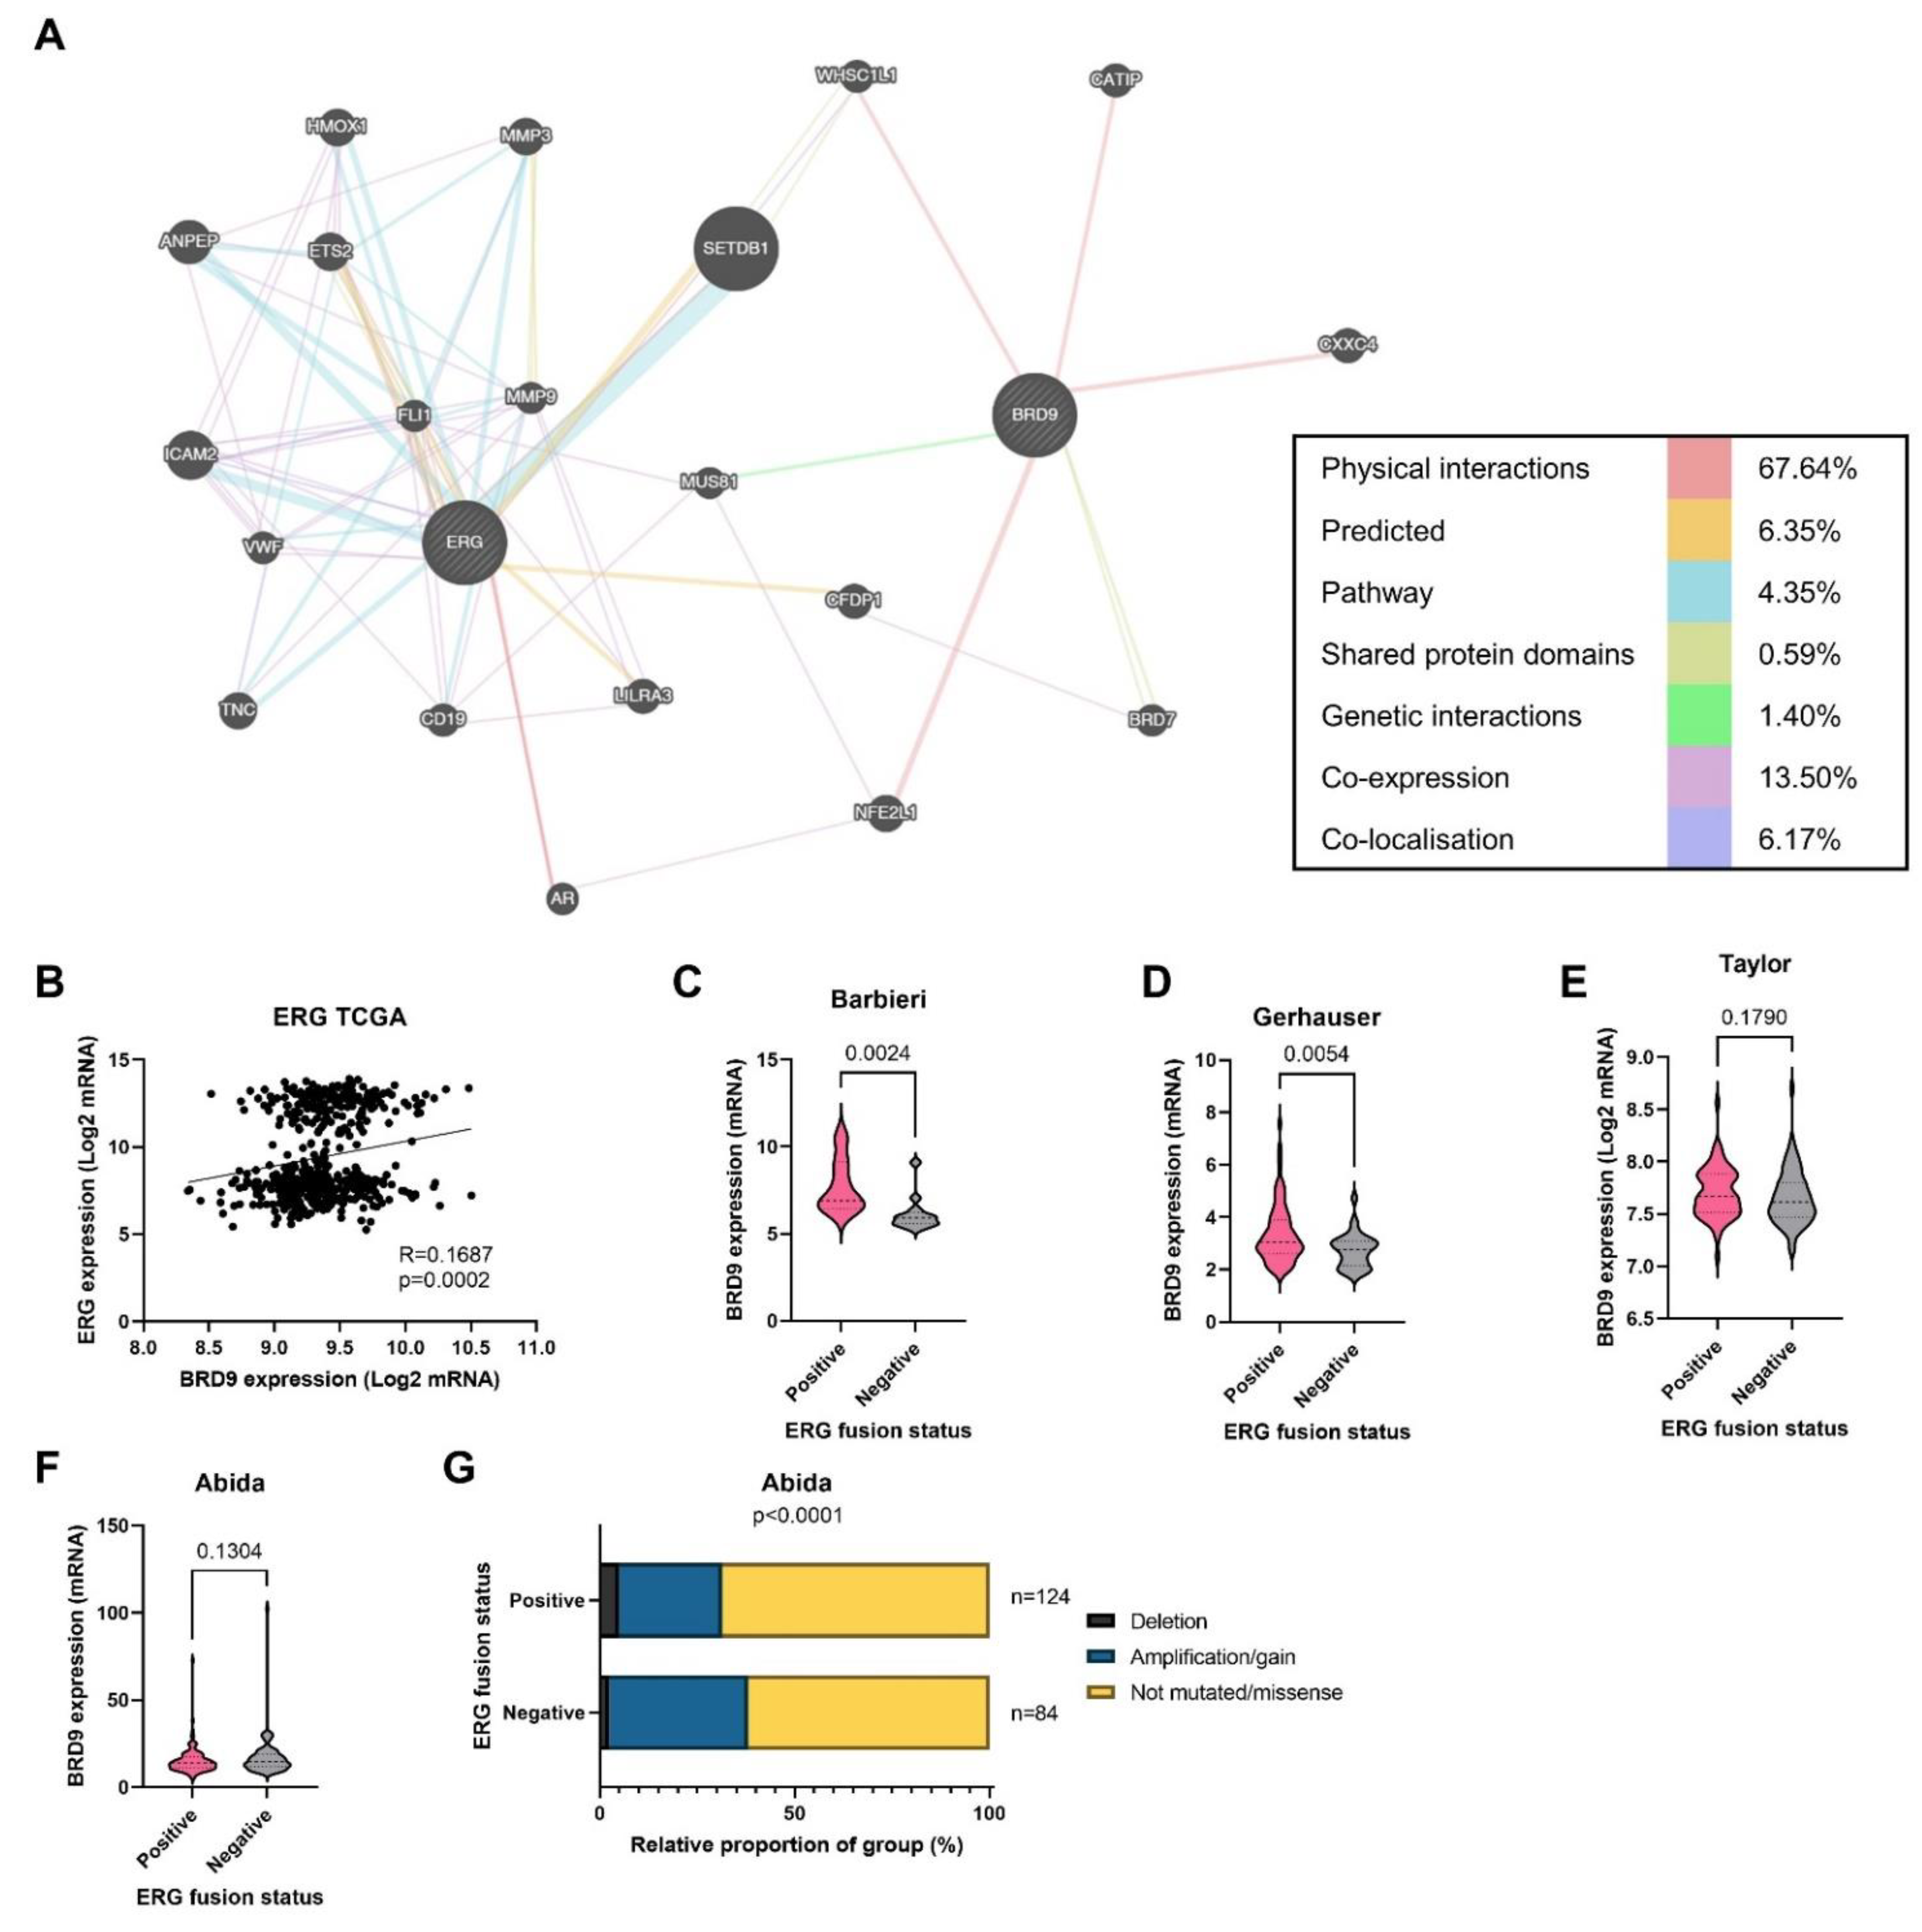
3.7. BRD9 Could Play a Role as a Therapeutic Co-Target Alongside ERG

The potential BRD9 as a co-target with ERG was investigated. Though not directly related to ERG, BRD9 and ERG were indirectly connected via co-expression, physical, and genetic interactions (Figure 6A). PCa is either ERG positive or negative; TMPRSS2 and ERG genes fuse, increasing the expression of ERG in roughly half of cases. This is shown by the two distinct groups in the scatterplot, which also shows that BRD9 and ERG expression are positively correlated in the TCGA cohort (Figure 6B). BRD9 is overexpressed in ERG positive PCa in the Barbieri (p = 0.0024) and Gerhauser (p = 0.0054) cohorts; however, there was no significant difference in BRD9 expression in the Taylor (p = 0.1790) and Abida (p = 0.1304) cohorts (Figure 6C–F). BRD9 mutations were more prevalent in the ERG negative group in the Abida cohort (p < 0.0001) (Figure 6G).

4. Discussion

Though BRD9 is understudied in PCa, growing interest in the community has recently pointed to a potential role in other cancers. Here, we set out to characterise BRD9 expression and mutations in depth within 11 independent PCa cohorts to identify whether BRD9 has potential as a biomarker and therapeutic target or co-target in PCa.

4.1. BRD9 as a Biomarker

SWI/SNF subunits are the most commonly mutated chromatin-regulatory complexes in human cancer, mutated in 19.6% cancers, with subunits ARID1A, PBRM1, SMARCA4, and ARID2 already part of routine cancer diagnostics [15,58]. The literature suggests that BRD9 plays an oncogenic role in many cancers with promise both as a diagnostic and prognostic biomarker [32,33,36]. The only paper on BRD9 and PCa used the TCGA evidence to show that BRD9 worsened DFS but did not investigate BRD9 as a biomarker in PCa [19].
Our findings show that BRD9 is overexpressed in PCa and therefore may play a role as a diagnostic biomarker in this disease. While BRD9 could represent a good diagnostic biomarker in PCa, it may not necessarily mean that this is needed, with PSA being widely used. Biomarkers that more accurately predict aggressive disease are more needed, so we went on to identify whether BRD9 could represent a more clinically useful biomarker here. Currently, researchers are investigating panels of genes rather than individual genes in PCa diagnostics [59]. BRD9 could be a useful panel component, given most genes composing a biomarker panel would not exhibit as strong correlations with disease status as BRD9 exhibits. Though BRD9 expression does not change with increases in Gleason grade and tumour stage, its expression was higher in metastatic PCa when compared to cancer-free patients and patients with local disease, suggesting that BRD9 could play a role as a prognostic biomarker and therapeutic target, especially in metastatic PCa. As with any study of historic data, it should be noted that analysis methods have changed over time here. For Gleason scoring, both pathological methods and WHO classifications have changed during the collection of these data, which could affect the conclusions here, and is an unavoidable limitation in the use of publicly available retrospective cohorts. It has been shown that BRD9 is required for cell growth, and its degradation prevents synovial sarcoma tumour progression [32,33]. Similar findings have been reported in hepatocellular carcinoma (HCC), with BRD9 overexpressed in HCC patients as well as promoting cell growth and metastasis, and its depletion and inhibition reducing these effects in HCC cells [36]. Data on DFS and BRD9 expression was conflicting; however, the widely studied TCGA cohort with the largest sample size found patients with higher BRD9 expression to have worse prognoses. Similarly, higher BRD9 expression reduces OS and DFS in HCC [36]. In the TCGA cohort, there is evidence suggesting that BRD9 is more likely to be mutated in higher Gleason grades and more advanced cancer, and screening these groups and targeting BRD9 in patients with mutations may be a viable therapeutic strategy. Though these data provide limited evidence that BRD9 plays a role as a predictive biomarker in PCa, it suggests that mutations are more prevalent in patients indicated for radiotherapy. Further work should be carried out to determine if this means BRD9 expression correlates with some other factor that leads clinicians to indicate patients for radiotherapy. Targeting BRD9 may be synergistic with adjuvant radiotherapy, with one study finding BRD9 sensitised ovarian cancer cell lines to radiotherapy [60].

4.2. BRD9 and CRPC

Alpsoy et al.’s paper on BRD9 in PCa suggests that BRD9 could play a role in CRPC with BRD9 knockdown, reducing the viability of AR-positive cell lines (including castration-resistant cell lines) [19]. Here, this cell line data was further characterised in 2053 PCa patients and did not suggest as promising a role, given BRD9 expression was similar in patients treated with and without second-generation antiandrogens. However, the decision to treat or not treat patients is made in the absence of knowledge of BRD9 expression, and naturally, the optimal experiment would be to compare BRD9 expression with response to antiandrogens in all patients—data that are not currently available within these datasets. While the cell line data is promising, cell lines cannot create a biomimetic environment and can become contaminated or subject to genetic drift [61,62,63]. We look forward to clinical outcome data becoming available, allowing us to further investigate these findings in more relevant settings.
BRD9 expression is moderately negatively correlated with AR expression in the TCGA cohort. Though this cohort was treatment-naïve, the correlation suggests that BRD9 could be a viable target in patients with AR-negative disease. After PCa differentiates into CRPC (stops responding to ADT) and is treated with second generation antiandrogens, it may stop responding to these also and then de-differentiate into AR-negative disease [64]. Though not in line with existing literature, if successful in AR-negative PCa, targeting BRD9 could be clinically very useful: following the introduction and approval of second-generation anti-androgens, the percentage of patients with AR-negative tumours has increased from 11.7% (1996–2011) to 36.6% (2012–2016) [65]. Prognosis for AR-negative CRPC is poor with a median survival of 12 months for AR-negative small cell carcinoma [66]. A recent randomised-control trial found that the targeted PARPi olaparib (recently FDA approved for PCa in May 2020) increased progression-free survival in patients with mCRPC whose cancer progressed despite abiraterone or enzalutamide treatment [67]. This suggests, as with PARP, BRD9 may be a good therapeutic target in patients who stop responding to second generation antiandrogens. Another study found BRD9 depletion increased cancer cell chemotherapy sensitivity as well as sensitivity to olaparib in Ovarian cancer, suggesting a drug targeting BRD9 may work synergistically with olaparib [60].

4.3. Co-Targeting BRD9

The literature suggests that suggest BRD9 interacts with other genes in the SWI/SNF complex and cooperates with BET proteins [18,19].
We provide evidence showing that BRD9 correlates and associates with many genes in the SWI/SNF complex as well as most genes in the BET complex. BRD9 could therefore be a viable co-target alongside other genes in these complexes. Though their positive correlation is very weak, GLTSCR1 and its paralog GLTSCR1-like (GLTSCR1-L), the other unique GBAF complex components, interact with BRD9 [18]. Interestingly, BRD9 appears to be weakly positively correlated with SMARCB1, despite these genes being intrinsic competitors during SWI/SNF complex formation [34]. Alpsoy et al. showed that BET complex and BRD9 inhibition exhibit similar effects, and that BRD9 interacts with BRD2 and BRD4, as well as with BRD9 and BET proteins, regulating similar gene sets [19]. Though the authors discussed the effects of targeting the GBAF subunit, they did not investigate other SWI/SNF subunits and BRD9’s interactions with these.
The literature suggests that BRD9 may interact with genes in the JAK-STAT, MAPK, and PI3K-AKT-mTor pathways. It has been shown that BRD9 depletion (at the mRNA and protein level) upregulates SOCS3, which, in turn, inhibits STAT5, reducing JAK-STAT pathway activation in acute myeloid leukaemia. Though BRD9 is not correlated with SOCS3 at a significant level in most cohorts and has a weakly positive correlation overall, BRD9 and STAT5A/B mRNA expression are positively correlated [68]. BRD9 is notably correlated with AKT1 and AKT 2 as well as other downstream effector protein genes including RPTOR, MLST8, PRR5, and MAPKAP1) in the PI3K-AKT-mTOR pathway and associates with a few genes in this signalling cascade. Though there is no uniform BRD9-MYC correlation, one study found that BRD9 inhibition reduced MYC levels in breast epithelial cell lines [69]. It has also been shown that MiR-140-3p (a tumour-suppressive miRNA) targets BRD9 mRNA, downregulating MYC and reducing proliferation [35]. Interestingly, BRD9 is negatively correlated with PIK3CA; its correlation with KRAS is non-uniform, though it has been shown that BRD9 may mediate a PI3KCA-KRAS mutant oncogenic cancer phenotype [69]. BRD9 positively correlates with most genes in the MAPK pathway with a few exceptions and has some associations with this signalling cascade. Given its correlations with genes in this pathway and trametinib being trialled here in PCa, BRD9 has most promise as a co-target with this pathway.
We provide some evidence (in two treatment-naïve cohorts) that BRD9 is overexpressed in ERG fusion positive cancers and that ERG expression is very weakly correlated with BRD9 expression. This suggests that BRD9 may be a worthwhile co-target alongside ERG. Our data show that BRD9 mutations are less prevalent in ERG fusion positive cancers, in line with the literature suggesting these cancers are less likely to have mutated SWI/SNF complexes [70,71]. BRD9 warrants further investigation in ERG fusion positive cancers and possibly co-targeted with ERG inhibition, as ERG depends on BAF complexes for its epithelial to mesenchymal transition (EMT) [72].

4.4. Limitations

This work investigated publicly available cohorts, which have limitations including that not all cohorts had mutation data. Some cohorts had small sample sizes and most lacked data on patients with more advanced stage cancers. Most cohorts also did not include information on treatment response, meaning it is difficult to conclude whether BRD9 has potential as a predictive biomarker using publicly available data. In some cohorts, original papers were unclear as to whether ‘normal’ or ‘benign’ samples were adjacent tissue from prostate cancer patients, or healthy tissue from patients who were determined not to have prostate cancer. This can lead to uncertainty in analysis. Some of the less recent data also uses grading classifications that we would not now, e.g., Gleason Grade 5 is now not considered cancer [72].
Another limitation is that, in each dataset, some samples are lost from each analysis due to the lack of data. For example, of the 491 patients in the TCGA cohort, there were only data for primary therapy outcome for 223 of these patients (45%), and there were only data for 284 (58%) patients on whether they were indicated for postoperative targeted radiotherapy.
We were also unable to investigate protein expression, as publicly available data regarding BRD9 protein expression were unavailable, which was a limitation of this work, where all the expression data were regarding mRNA.
In addition, it is not possible to determine causation—we can only study correlation in publicly available datasets; in the future, overexpression and knockdown studies must be performed to establish causation.

5. Conclusions

This approach to characterising BRD9 using cancer omics cohorts has yielded promising results and, alongside the one published paper, forms a basis for future study of BRD9 in PCa. BRD9 has most potential as a diagnostic biomarker and drug target in metastatic disease. Given its overexpression in patients with PCa across the datasets investigated, BRD9 could form part of a future PCa biomarker panel. This work warrants further experimental work, in vitro, in vivo, and ex vivo, to continue determining where and how targeting BRD9 could be successful in PCa.

Supplementary Materials

The following are available online at https://www.mdpi.com/article/10.3390/biom11121794/s1, Supplementary Figure S1: BRD9 expression by cancer stage in cancer omics cohorts; Supplementary Figure S2: Correlation and association of BRD9 with genes composing the SWISNF complex; Supplementary Figure S3: Correlation and association of BRD9 with genes composing the BET complex; Supplementary Figure S4: The correlation and association of BRD9 with genes expressed in the JAK-STAT pathway; Supplementary Figure S5: The correlation and association of BRD9 with genes expressed in the MAPK pathway; Supplementary Figure S6: Investigating the correlation and association of BRD9 with genes expressed in the PI3K-AKT-mTOR pathway.

Author Contributions

Conceptualization, S.H. and N.B.; methodology, S.H. and N.B.; software, N.B. and T.C.S.; validation, N.B., T.C.S., L.M.C.E. and S.H.; formal analysis, N.B.; investigation, N.B.; resources, N/A—Publicly available data; data curation, N.B.; writing—original draft preparation, N.B.; writing—review and editing, N.B. and S.H.; visualization, S.H.; supervision, S.H.; project administration, S.H.; funding acquisition, N/A—no funding acquired. All authors have read and agreed to the published version of the manuscript.

Funding

This research received no external funding.

Institutional Review Board Statement

No humans or animals were involved as this study looked at publicly available data.

Informed Consent Statement

Not applicable.

Data Availability Statement

Data available in a publicly accessible repository at: Cancertool DOI: 10.1158/0008-5472.CAN-18-1669 [39]; cBioPortal DOI: 10.1158/2159-8290.CD-12-0095 and DOI: 10.1126/scisignal.2004088 [40,41]; Genemania DOI: 10.1126/scisignal.2004088 [42].

Conflicts of Interest

The authors declare no conflict of interest.

References

  1. Rawla, P. Epidemiology of Prostate Cancer. World J. Oncol. 2019, 10, 63–89. [Google Scholar] [CrossRef] [PubMed] [Green Version]
  2. Bray, F.; Ferlay, J.; Soerjomataram, I.; Siegel, R.L.; Torre, L.A.; Jemal, A. Global cancer statistics 2018: GLOBOCAN estimates of incidence and mortality worldwide for 36 cancers in 185 countries. CA Cancer J. Clin. 2018, 68, 394–424. [Google Scholar] [CrossRef] [PubMed] [Green Version]
  3. Prostate Cancer UK. About Prostate Cancer. Available online: https://prostatecanceruk.org/prostate-information/about-prostate-cancer (accessed on 19 April 2021).
  4. Prostate Cancer UK. Prostate Cancer UK’s Best Practice Pathway TREATMENT. Prostate Cancer UK, 2019. Available online: https://prostatecanceruk.org/media/1fknrpz5/treatmentpathwaypathwaycommentaryupdatenov2018-2-1.pdf (accessed on 19 April 2021).
  5. NICE. Information about PSA Testing. Available online: https://cks.nice.org.uk/topics/prostate-cancer/diagnosis/psa-testing/#:~:text=If%20the%20prostate%2Dspecific%20antigen,2%20weeks)%20to%20a%20specialist (accessed on 19 April 2021).
  6. Ilic, D.; Djulbegovic, M.; Jung, J.H.; Hwang, E.C.; Zhou, Q.; Cleves, A.; Agoritsas, T.; Dahm, P. Prostate cancer screening with prostate-specific antigen (PSA) test: A systematic review and meta-analysis. BMJ 2018, 362, k3519. [Google Scholar] [CrossRef] [PubMed] [Green Version]
  7. Filella, X.; Fernández-Galan, E.; Fernández Bonifacio, R.; Foj, L. Emerging biomarkers in the diagnosis of prostate cancer. Pharmgenom. Pers. Med. 2018, 11, 83–94. [Google Scholar] [CrossRef] [Green Version]
  8. Möller, A.; Olsson, H.; Grönberg, H.; Eklund, M.; Aly, M.; Nordström, T. The Stockholm3 blood-test predicts clinically-significant cancer on biopsy: Independent validation in a multi-center community cohort. Prostate Cancer Prostatic Dis. 2019, 22, 137–142. [Google Scholar] [CrossRef]
  9. Grönberg, H. Stockholm3 Validation Study in a Multi-Ethnic Cohort (SEPTA). Available online: https://clinicaltrials.gov/ct2/show/NCT04583072 (accessed on 1 May 2021).
  10. Siow, Z.R.; de Boer, R.H.; Lindeman, G.J.; Mann, G.B. Spotlight on the utility of the Oncotype DX(®) breast cancer assay. Int. J. Womens Health 2018, 10, 89–100. [Google Scholar] [CrossRef] [Green Version]
  11. CRUK. Survival. Available online: https://www.cancerresearchuk.org/about-cancer/prostate-cancer/survival (accessed on 20 April 2021).
  12. Fridriksson, J.; Folkvaljon, Y.; Nilsson, P.; Robinson, D.; Franck-Lissbrant, I.; Ehdaie, B.; Eastham, J.A.; Widmark, A.; Karlsson, C.T.; Stattin, P. Long-term adverse effects after curative radiotherapy and radical prostatectomy: Population-based nationwide register study. Scand. J. Urol. 2016, 50, 338–345. [Google Scholar] [CrossRef] [Green Version]
  13. Litwin, M.S.; Tan, H.J. The Diagnosis and Treatment of Prostate Cancer: A Review. JAMA 2017, 317, 2532–2542. [Google Scholar] [CrossRef]
  14. NCI Staff. With Two FDA Approvals, Prostate Cancer Treatment Enters the PARP Era 2020. 2021. Available online: https://www.cancer.gov/news-events/cancer-currents-blog/2020/fda-olaparib-rucaparib-prostate-cancer (accessed on 19 April 2021).
  15. Centore, R.C.; Sandoval, G.J.; Soares, L.M.M.; Kadoch, C.; Chan, H.M. Mammalian SWI/SNF Chromatin Remodeling Complexes: Emerging Mechanisms and Therapeutic Strategies. Trends Genet. 2020, 36, 936–950. [Google Scholar] [CrossRef]
  16. Shi, J.; Vakoc, C.R. The mechanisms behind the therapeutic activity of BET bromodomain inhibition. Mol. Cell 2014, 54, 728–736. [Google Scholar] [CrossRef] [Green Version]
  17. Wyce, A.; Degenhardt, Y.; Bai, Y.; Le, B.; Korenchuk, S.; Crouthame, M.C.; McHugh, C.F.; Vessella, R.; Creasy, C.L.; Tummino, P.J.; et al. Inhibition of BET bromodomain proteins as a therapeutic approach in prostate cancer. Oncotarget 2013, 4, 2419–2429. [Google Scholar] [CrossRef] [Green Version]
  18. Gatchalian, J.; Malik, S.; Ho, J.; Lee, D.S.; Kelso, T.W.R.; Shokhirev, M.N.; Dixon, J.R.; Hargreaves, D.C. A non-canonical BRD9-containing BAF chromatin remodeling complex regulates naive pluripotency in mouse embryonic stem cells. Nat. Commun. 2018, 9, 5139. [Google Scholar] [CrossRef] [Green Version]
  19. Alpsoy, A.; Utturkar, S.M.; Carter, B.C.; Dhiman, A.; Torregrosa-Allen, S.E.; Currie, M.P.; Elzey, B.D.; Dykhuizen, E.C. BRD9 Is a Critical Regulator of Androgen Receptor Signaling and Prostate Cancer Progression. Cancer Res. 2021, 81, 820–833. [Google Scholar] [CrossRef]
  20. Canesin, G.; Krzyzanowska, A.; Hellsten, R.; Bjartell, A. Cytokines and Janus kinase/signal transducer and activator of transcription signaling in prostate cancer: Overview and therapeutic opportunities. Curr. Opin. Endocr. Metab. Res. 2020, 10, 36–42. [Google Scholar] [CrossRef]
  21. Haddad, B.R.; Gu, L.; Mirtti, T.; Dagvadorj, A.; Vogiatzi, P.; Hoang, D.T.; Bajaj, R.; Leiby, B.; Ellsworth, E.; Blackmon, S.; et al. STAT5A/B gene locus undergoes amplification during human prostate cancer progression. Am. J. Pathol. 2013, 182, 2264–2275. [Google Scholar] [CrossRef] [Green Version]
  22. Rodríguez-Berriguete, G.; Fraile, B.; Martínez-Onsurbe, P.; Olmedilla, G.; Paniagua, R.; Royuela, M. MAP Kinases and Prostate Cancer. J. Signal Transduct. 2012, 2012, 169170. [Google Scholar] [CrossRef] [Green Version]
  23. Mukherjee, R.; McGuinness, D.H.; McCall, P.; Underwood, M.A.; Seywright, M.; Orange, C.; Edwards, J. Upregulation of MAPK pathway is associated with survival in castrate-resistant prostate cancer. Br. J. Cancer 2011, 104, 1920–1928. [Google Scholar] [CrossRef]
  24. Jonsson Comprehensive Cancer Center. Trametinib in Treating Patients with Progressive Metastatic Hormone-Resistant Prostate Cancer. Available online: https://clinicaltrials.gov/ct2/show/NCT02881242 (accessed on 1 May 2021).
  25. Edlind, M.P.; Hsieh, A.C. PI3K-AKT-mTOR signaling in prostate cancer progression and androgen deprivation therapy resistance. Asian J. Androl. 2014, 16, 378–386. [Google Scholar] [CrossRef]
  26. De Bono, J.S.; de Giorgi, U.; Rodrigues, D.N.; Massard, C.; Bracarda, S.; Font, A.; Arranz Arija, J.A.; Shih, K.C.; Radavoi, G.D.; Xu, N.; et al. Randomized Phase II Study Evaluating Akt Blockade with Ipatasertib, in Combination with Abiraterone, in Patients with Metastatic Prostate Cancer with and without PTEN Loss. Clin. Cancer Res. 2019, 25, 928–936. [Google Scholar] [CrossRef] [Green Version]
  27. Roche, H.-L. Ipatasertib Plus Abiraterone Plus Prednisone/Prednisolone, Relative to Placebo Plus Abiraterone Plus Prednisone/Prednisolone in Adult Male Patients with Metastatic Castrate-Resistant Prostate Cancer (IPATential150). Available online: https://clinicaltrials.gov/ct2/show/study/NCT03072238 (accessed on 1 May 2021).
  28. Bono, J.D. ESMO Virtual Congress 2020: IPATential150: Phase III Study of Ipatasertib plus Abiraterone vs Placebo plus Abiraterone in Metastatic Castration-Resistant Prostate Cancer. In Proceedings of the ESMO Virtual Congress, virtual, 19–20 September 2020. [Google Scholar]
  29. Tomlins, S.A.; Laxman, B.; Varambally, S.; Cao, X.; Yu, J.; Helgeson, B.E.; Cao, Q.; Prensner, J.R.; Rubin, M.A.; Shah, R.B.; et al. Role of the TMPRSS2-ERG gene fusion in prostate cancer. Neoplasia 2008, 10, 177–188. [Google Scholar] [CrossRef] [Green Version]
  30. Demichelis, F.; Fall, K.; Perner, S.; Andrén, O.; Schmidt, F.; Setlur, S.R.; Hoshida, Y.; Mosquera, J.M.; Pawitan, Y.; Lee, C.; et al. TMPRSS2:ERG gene fusion associated with lethal prostate cancer in a watchful waiting cohort. Oncogene 2007, 26, 4596–4599. [Google Scholar] [CrossRef] [Green Version]
  31. Mohamed, A.A.; Xavier, C.P.; Sukumar, G.; Tan, S.H.; Ravindranath, L.; Seraj, N.; Kumar, V.; Sreenath, T.; McLeod, D.G.; Petrovics, G.; et al. Identification of a Small Molecule That Selectively Inhibits ERG-Positive Cancer Cell Growth. Cancer Res. 2018, 78, 3659–3671. [Google Scholar] [CrossRef] [Green Version]
  32. Zhu, X.; Liao, Y.; Tang, L. Targeting BRD9 for Cancer Treatment: A New Strategy. Onco. Targets Ther. 2020, 13, 13191–13200. [Google Scholar] [CrossRef]
  33. Brien, G.L.; Remillard, D.; Shi, J.; Hemming, M.L.; Chabon, J.; Wynne, K.; Dillon, E.T.; Cagney, G.; van Mierlo, G.; Baltissen, M.P.; et al. Targeted degradation of BRD9 reverses oncogenic gene expression in synovial sarcoma. eLife 2018, 7. [Google Scholar] [CrossRef]
  34. Del Gaudio, N.; Di Costanzo, A.; Liu, N.Q.; Conte, L.; Migliaccio, A.; Vermeulen, M.; Martens, J.H.A.; Stunnenberg, H.G.; Nebbioso, A.; Altucci, L. BRD9 binds cell type-specific chromatin regions regulating leukemic cell survival via STAT5 inhibition. Cell Death Dis. 2019, 10, 338. [Google Scholar] [CrossRef]
  35. Hartley, A.; Leung, H.Y.; Ahmad, I. Targeting the BAF complex in advanced prostate cancer. Expert Opin. Drug Discov. 2021, 16, 173–181. [Google Scholar] [CrossRef]
  36. Dou, C.; Sun, L.; Wang, L.; Cheng, J.; Wu, W.; Zhang, C.; Xu, Q.; Tu, K.; Liu, J. Bromodomain-containing protein 9 promotes the growth and metastasis of human hepatocellular carcinoma by activating the TUFT1/AKT pathway. Cell Death Dis. 2020, 11, 730. [Google Scholar] [CrossRef]
  37. Alpsoy, A.; Dykhuizen, E.C. Glioma tumor suppressor candidate region gene 1 (GLTSCR1) and its paralog GLTSCR1-like form SWI/SNF chromatin remodeling subcomplexes. J. Biol. Chem. 2018, 293, 3892–3903. [Google Scholar] [CrossRef] [Green Version]
  38. Kirby, M.; Hirst, C.; Crawford, E.D. Characterising the castration-resistant prostate cancer population: A systematic review. Int. J. Clin. Pract. 2011, 65, 1180–1192. [Google Scholar] [CrossRef]
  39. Cortazar, A.R.; Torrano, V.; Martín-Martín, N.; Caro-Maldonado, A.; Camacho, L.; Hermanova, I.; Guruceaga, E.; Lorenzo-Martín, L.F.; Caloto, R.; Gomis, R.R.; et al. CANCERTOOL: A Visualization and Representation Interface to Exploit Cancer Datasets. Cancer Res. 2018, 78, 6320–6328. [Google Scholar] [CrossRef] [Green Version]
  40. Cerami, E.; Gao, J.; Dogrusoz, U.; Gross, B.E.; Sumer, S.O.; Aksoy, B.A.; Jacobsen, A.; Byrne, C.J.; Heuer, M.L.; Larsson, E.; et al. The cBio cancer genomics portal: An open platform for exploring multidimensional cancer genomics data. Cancer Discov. 2012, 2, 401–404. [Google Scholar] [CrossRef] [PubMed] [Green Version]
  41. Gao, J.; Aksoy, B.A.; Dogrusoz, U.; Dresdner, G.; Gross, B.; Sumer, S.O.; Sun, Y.; Jacobsen, A.; Sinha, R.; Larsson, E.; et al. Integrative analysis of complex cancer genomics and clinical profiles using the cBioPortal. Sci. Signal 2013, 6, l1. [Google Scholar] [CrossRef] [PubMed] [Green Version]
  42. Warde-Farley, D.; Donaldson, S.L.; Comes, O.; Zuberi, K.; Badrawi, R.; Chao, P.; Franz, M.; Grouios, C.; Kazi, F.; Lopes, C.T.; et al. The GeneMANIA prediction server: Biological network integration for gene prioritization and predicting gene function. Nucleic. Acids Res. 2010, 38, W214–W220. [Google Scholar] [CrossRef] [PubMed]
  43. The Molecular Taxonomy of Primary Prostate Cancer. Cell 2015, 163, 1011–1025. [CrossRef] [Green Version]
  44. Glinsky, G.V.; Glinskii, A.B.; Stephenson, A.J.; Hoffman, R.M.; Gerald, W.L. Gene expression profiling predicts clinical outcome of prostate cancer. J. Clin. Investig. 2004, 113, 913–923. [Google Scholar] [CrossRef]
  45. Grasso, C.S.; Wu, Y.M.; Robinson, D.R.; Cao, X.; Dhanasekaran, S.M.; Khan, A.P.; Quist, M.J.; Jing, X.; Lonigro, R.J.; Brenner, J.C.; et al. The mutational landscape of lethal castration-resistant prostate cancer. Nature 2012, 487, 239–243. [Google Scholar] [CrossRef] [Green Version]
  46. Taylor, B.S.; Schultz, N.; Hieronymus, H.; Gopalan, A.; Xiao, Y.; Carver, B.S.; Arora, V.K.; Kaushik, P.; Cerami, E.; Reva, B.; et al. Integrative genomic profiling of human prostate cancer. Cancer Cell 2010, 18, 11–22. [Google Scholar] [CrossRef] [Green Version]
  47. Varambally, S.; Yu, J.; Laxman, B.; Rhodes, D.R.; Mehra, R.; Tomlins, S.A.; Shah, R.B.; Chandran, U.; Monzon, F.A.; Becich, M.J.; et al. Integrative genomic and proteomic analysis of prostate cancer reveals signatures of metastatic progression. Cancer Cell 2005, 8, 393–406. [Google Scholar] [CrossRef] [Green Version]
  48. Gerhauser, C.; Favero, F.; Risch, T.; Simon, R.; Feuerbach, L.; Assenov, Y.; Heckmann, D.; Sidiropoulos, N.; Waszak, S.M.; Hübschmann, D.; et al. Molecular Evolution of Early-Onset Prostate Cancer Identifies Molecular Risk Markers and Clinical Trajectories. Cancer Cell 2018, 34, 996–1011. [Google Scholar] [CrossRef] [Green Version]
  49. Barbieri, C.E.; Baca, S.C.; Lawrence, M.S.; Demichelis, F.; Blattner, M.; Theurillat, J.P.; White, T.A.; Stojanov, P.; van Allen, E.; Stransky, N.; et al. Exome sequencing identifies recurrent SPOP, FOXA1 and MED12 mutations in prostate cancer. Nat. Genet. 2012, 44, 685–689. [Google Scholar] [CrossRef] [Green Version]
  50. Ren, S.; Wei, G.-H.; Liu, D.; Wang, L.; Hou, Y.; Zhu, S.; Peng, L.; Zhang, Q.; Cheng, Y.; Su, H.; et al. Whole-genome and Transcriptome Sequencing of Prostate Cancer Identify New Genetic Alterations Driving Disease Progression. Eur. Urol. 2018, 73, 322–339. [Google Scholar] [CrossRef]
  51. Abida, W.; Cyrta, J.; Heller, G.; Prandi, D.; Armenia, J.; Coleman, I.; Cieslik, M.; Benelli, M.; Robinson, D.; van Allen, E.M.; et al. Genomic correlates of clinical outcome in advanced prostate cancer. Proc Natl. Acad. Sci. USA 2019, 116, 11428–11436. [Google Scholar] [CrossRef] [Green Version]
  52. Dan, R.; van Allen, E.M.; Wu, Y.M.; Schultz, N.; Lonigro, R.J.; Mosquera, J.M.; Montgomery, B.; Taplin, M.E.; Pritchard, C.C.; Attard, G.; et al. Integrative clinical genomics of advanced prostate cancer. Cell 2015, 161, 1215–1228. [Google Scholar] [CrossRef] [Green Version]
  53. Kumar, A.; Coleman, I.; Morrissey, C.; Zhang, X.; True, L.D.; Gulati, R.; Etzioni, R.; Bolouri, H.; Montgomery, B.; White, T.; et al. Substantial interindividual and limited intraindividual genomic diversity among tumors from men with metastatic prostate cancer. Nat. Med. 2016, 22, 369–378. [Google Scholar] [CrossRef]
  54. Weissgerber, T.L.; Winham, S.J.; Heinzen, E.P.; Milin-Lazovic, J.S.; Garcia-Valencia, O.; Bukumiric, Z.; Savic, M.D.; Garovic, V.D.; Milic, N.M. Reveal, Don’t Conceal: Transforming Data Visualization to Improve Transparency. Circulation 2019, 140, 1506–1518. [Google Scholar] [CrossRef]
  55. BMJ. Correlation and Regression. Available online: https://www.bmj.com/about-bmj/resources-readers/publications/statistics-square-one/11-correlation-and-regression (accessed on 23 April 2021).
  56. Luszczak, S.; Kumar, C.; Sathyadevan, V.K.; Simpson, B.S.; Gately, K.A.; Whitaker, H.C.; Heavey, S. PIM kinase inhibition: Co-targeted therapeutic approaches in prostate cancer. Signal Transduct. Target. Ther. 2020, 5, 7. [Google Scholar] [CrossRef]
  57. Kadoch, C.; Hargreaves, D.C.; Hodges, C.; Elias, L.; Ho, L.; Ranish, J.; Crabtree, G.R. Proteomic and bioinformatic analysis of mammalian SWI/SNF complexes identifies extensive roles in human malignancy. Nat. Genet. 2013, 45, 592–601. [Google Scholar] [CrossRef]
  58. Guo, J.; Yang, J.; Zhang, X.; Feng, X.; Zhang, H.; Chen, L.; Johnson, H.; Persson, J.L.; Xiao, K. A Panel of Biomarkers for Diagnosis of Prostate Cancer Using Urine Samples. Anticancer Res. 2018, 38, 1471–1477. [Google Scholar] [CrossRef] [Green Version]
  59. Zhou, Q.; Huang, J.; Zhang, C.; Zhao, F.; Kim, W.; Tu, X.; Zhang, Y.; Nowsheen, S.; Zhu, Q.; Deng, M.; et al. The bromodomain containing protein BRD-9 orchestrates RAD51–RAD54 complex formation and regulates homologous recombination-mediated repair. Nat. Commun. 2020, 11, 2639. [Google Scholar] [CrossRef]
  60. Ghallab, A. In vitro test systems and their limitations. Excli J. 2013, 12, 1024–1026. [Google Scholar]
  61. Geraghty, R.J.; Capes-Davis, A.; Davis, J.M.; Downward, J.; Freshney, R.I.; Knezevic, I.; Lovell-Badge, R.; Masters, J.R.W.; Meredith, J.; Stacey, G.N.; et al. Guidelines for the use of cell lines in biomedical research. Br. J. Cancer 2014, 111, 1021–1046. [Google Scholar] [CrossRef] [PubMed] [Green Version]
  62. Olarerin-George, A.O.; Hogenesch, J.B. Assessing the prevalence of mycoplasma contamination in cell culture via a survey of NCBI’s RNA-seq archive. Nucleic. Acids Res. 2015, 43, 2535–2542. [Google Scholar] [CrossRef] [PubMed] [Green Version]
  63. Formaggio, N.; Rubin, M.A.; Theurillat, J.-P. Loss and revival of androgen receptor signaling in advanced prostate cancer. Oncogene 2021, 40, 1205–1216. [Google Scholar] [CrossRef] [PubMed]
  64. Bluemn, E.G.; Coleman, I.M.; Lucas, J.M.; Coleman, R.T.; Hernandez-Lopez, S.; Tharakan, R.; Bianchi-Frias, D.; Dumpit, R.F.; Kaipainen, A.; Corella, A.N.; et al. Androgen Receptor Pathway-Independent Prostate Cancer Is Sustained through FGF Signaling. Cancer Cell 2017, 32, 474–489.e6. [Google Scholar] [CrossRef] [PubMed] [Green Version]
  65. Metzger, A.L.; Abel, S.; Wegner, R.E.; Fuhrer, R.; Mao, S.; Miller, R.; Beriwal, S.; Horne, Z.D. Patterns of care and outcomes in small cell carcinoma of the prostate: A national cancer database analysis. Prostate 2019, 79, 1457–1461. [Google Scholar] [CrossRef] [PubMed]
  66. De Bono, J.; Mateo, J.; Fizazi, K.; Saad, F.; Shore, N.; Sandhu, S.; Chi, K.N.; Sartor, O.; Agarwal, N.; Olmos, D.; et al. Olaparib for Metastatic Castration-Resistant Prostate Cancer. N. Engl. J. Med. 2020, 382, 2091–2102. [Google Scholar] [CrossRef] [PubMed]
  67. Wang, X.; Wang, S.; Troisi, E.C.; Howard, T.P.; Haswell, J.R.; Wolf, B.K.; Hawk, W.H.; Ramos, P.; Oberlick, E.M.; Tzvetkov, E.P.; et al. BRD9 defines a SWI/SNF sub-complex and constitutes a specific vulnerability in malignant rhabdoid tumors. Nat. Commun. 2019, 10, 1881. [Google Scholar] [CrossRef] [PubMed] [Green Version]
  68. Bell, C.M.; Raffeiner, P.; Hart, J.R.; Vogt, P.K. PIK3CA Cooperates with KRAS to Promote MYC Activity and Tumorigenesis via the Bromodomain Protein BRD9. Cancers 2019, 11, 1634. [Google Scholar] [CrossRef] [Green Version]
  69. Huang, H.; Wang, Y.; Li, Q.; Fei, X.; Ma, H.; Hu, R. miR-140-3p functions as a tumor suppressor in squamous cell lung cancer by regulating BRD9. Cancer Lett. 2019, 446, 81–89. [Google Scholar] [CrossRef]
  70. Armenia, J.; Wankowicz, S.A.M.; Liu, D.; Gao, J.; Kundra, R.; Reznik, E.; Chatila, W.K.; Chakravarty, D.; Han, G.C.; Coleman, I.; et al. The long tail of oncogenic drivers in prostate cancer. Nat. Genet. 2018, 50, 645–651. [Google Scholar] [CrossRef]
  71. Sandoval, G.J.; Pulice, J.L.; Pakula, H.; Schenone, M.; Takeda, D.Y.; Pop, M.; Boulay, G.; Williamson, K.E.; McBride, M.J.; Pan, J.; et al. Binding of TMPRSS2-ERG to BAF Chromatin Remodeling Complexes Mediates Prostate Oncogenesis. Mol. Cell 2018, 71, 554–566.e7. [Google Scholar] [CrossRef] [Green Version]
  72. Miah, S.; Ahmed, H.U.; Freeman, A.; Emberton, M. Does true Gleason pattern 3 merit its cancer descriptor? Nat. Rev. Urol. 2016, 13, 541–548. [Google Scholar] [CrossRef]
Figure 1. BRD9 as a diagnostic and prognostic biomarker in cancer omics cohorts. (A) Violin plot showing BRD9 expression in normal and PCa patients in the Grasso cohort. p-value was obtained using Welch’s t-test. (B) Violin plot showing BRD9 expression in normal and PCa patients in the Taylor cohort. p-value was obtained using Mann-Whitney U test. (C) Violin plot showing BRD9 expression in normal and PCa patients in the Varambally cohort. p-value was obtained using Welch’s t-test. (D) Violin plot showing how BRD9 expression varies with Gleason grade in the Glinsky cohort. p-values were obtained using Dunnett’s T3 post-hoc test. (E) Violin plot showing how BRD9 expression varies with Gleason grade in the Taylor cohort. p-values were obtained using Dunn’s post-hoc test. (F) Violin plot showing how BRD9 expression varies with Gleason grade in the TCGA cohort. p-values were obtained using Dunnett’s T3 post-hoc test. (G) Stacked bar chart showing BRD9 mutation distribution at different Gleason grades and the number of patients at each grade in the TCGA cohort. p-value was obtained via Fisher’s exact test using the Monte Carlo simulation. Grades 9 and 10 have been combined due to an n = 4 sample size at grade 10. (H) Violin plot showing how BRD9 expression varies with cancer progression in the Grasso cohort. p-values were obtained using Dunn’s post-hoc test. (I) Violin plot showing how BRD9 expression varies with cancer progression in the Taylor cohort. p-values were obtained using Dunn’s post-hoc test. (J) Violin plot showing how BRD9 expression varies with cancer progression in the Varambally cohort. p-values were obtained using Dunnett’s T3 post-hoc test. (K) DFS shown via KM survival curve in the Glinsky cohort. p value was obtained from a Mantel-Cox test and HR was calculated from a cox regression model by comparing the highest and lowest quartiles of BRD9 expression. (L) DFS shown via KM survival curve in the Taylor cohort. p value was obtained from a Mantel-Cox test and HR was calculated from a cox regression model by comparing the highest and lowest quartiles of BRD9 expression. (M) DFS shown via KM survival curve in the TCGA cohort. p value was obtained from a Mantel-Cox test and HR was calculated from a cox regression model by comparing the highest and lowest quartiles of BRD9 expression. Gleason grade (1–5) increases with more aggressive and less well-differentiated cancer. Overall grade (6–10) is the sum score of the two most prevalent grades in the sample. Y axis scales on violin plots vary due to experimental variation.
Biomolecules 11 01794 g001
Figure 2. BRD9 as a predictive biomarker in PCa in cancer omics cohorts. (A) Violin plot showing how BRD9 expression varies with primary therapy outcome in the TCGA cohort. p-values were obtained using Dunn’s post-hoc test. (B) Stacked bar chart showing BRD9 mutation distribution across primary therapy outcomes and the number of patients in each sample in the TCGA cohort. p-value was obtained via Fisher’s exact test using the Monte Carlo simulation. (C) Violin plot showing BRD9 expression in patients indicated for adjuvant radiotherapy (left) and those who were not (right) in the TCGA cohort. p-value was obtained using a Mann Whitney U test. (D) Stacked bar chart showing BRD9 mutation distribution in patients who were and were not indicated for adjuvant radiotherapy and the number of patients in each sample in the TCGA cohort. p-value was obtained using Fisher’s exact test. (E) Violin plot showing BRD9 expression in patients who received chemotherapy (left) and those who did not (right) in the Kumar cohort. p-value was obtained using a Mann Whitney U test. (F) Stacked bar chart showing BRD9 mutation distribution in patients who did and did not receive chemotherapy and the number of patients in each sample in the Kumar cohort. p-value was obtained via Fisher’s exact test using the Monte Carlo simulation. (G) Violin plot showing how BRD9 expression varies with therapy regimen in the Abida cohort. p-values were obtained using Dunn’s post-hoc test. (H) Stacked bar chart showing BRD9 mutation distribution in patients across therapy regimens the number of patients in each sample in the TCGA cohort. p-value was obtained using Fisher’s exact test. Regimen categories were combined as above due to small sample sizes (n) of various individual regimens. Y axis scales on violin plots vary due to experimental variation.
Biomolecules 11 01794 g002
Figure 3. BRD9 as a potential drug target in CRPC in cancer omics cohorts. (A) Scatterplot with line of best fit showing the correlation between BRD9 and AR expression in the TCGA cohort. Spearman’s R and its associated two-tailed p-value have been calculated. (B) Violin plot showing BRD9 expression in who patients were and were not treated with the second generation antiandrogens abiraterone and enzalutamide in the Abida cohort. p-value was obtained using a Mann Whitney U test. (C) Stacked bar chart showing BRD9 mutation distribution in patients who were and were not treated with the second generation antiandrogens abiraterone and enzalutamide and the number of patients in each sample in the Abida cohort. p-value was obtained using Fisher’s exact test. (D) Violin plot showing BRD9 expression in who patients were and were not treated with the second generation antiandrogens abiraterone and enzalutamide in the Dan cohort. p-value was obtained using a Mann Whitney U test. (E) Stacked bar chart showing BRD9 mutation distribution in patients who were and were not treated with the second generation antiandrogens abiraterone and enzalutamide and the number of patients in each sample in the Dan cohort. p-value was obtained using Fisher’s exact test. Y axis scales on violin plots vary due to experimental variation.
Biomolecules 11 01794 g003
Figure 4. An overview of BRD9 correlation with genes composing the SWI/SNF and BET complexes. Heatmap diagrams showing mean significant Spearman’s R BRD9 correlation from datasets with gene subunits composing SWI/SNF subcomplexes (cBAF, PBAF, GBAF) and BET complex. (A) Heatmap diagram showing mean significant Spearman’s R BRD9 correlation from datasets with gene subunits composing the cBAF subcomplex. (B) Heatmap diagram showing mean significant Spearman’s R BRD9 correlation from datasets with gene subunits composing the PBAF subcomplex. (C) Heatmap diagram showing mean significant Spearman’s R BRD9 correlation from datasets with gene subunits composing the GBAF subcomplex. SWI/SNF diagrams adapted from Centore et al.’s Figure 1 [15]. Image created using Microsoft PowerPoint. (D) Heatmap diagram showing mean significant Spearman’s R BRD9 correlation from datasets with gene subunits composing the BET complex.
Biomolecules 11 01794 g004
Figure 5. An overview of BRD9 correlation with common signalling pathways involved in PCa. Flowchart signalling pathway diagram/heatmap showing mean significant Spearman’s R BRD9 correlation from datasets with genes in the JAK-STAT, MAPK and PI3K-AKT-mTOR signalling pathways. Adapted and expanded from Luzczak et al.’s Figure 2 [57]. Image created using Microsoft PowerPoint.
Biomolecules 11 01794 g005
Figure 6. The potential of ERG as a co-target with BRD9. (A) Gene network map showing the associations between BRD9 and ERG. (B) Scatterplot with line of best fit showing the correlation between BRD9 and ERG expression in the TCGA cohort. (C) Violin plot showing BRD9 expression in who patients were ERG (TMPRSS2-ETS fusion) positive (right) and negative (left) in the Barbieri cohort. p-value was obtained using a Mann Whitney U test. (D) Violin plot showing BRD9 expression in who patients were ERG positive (right) and negative (left) in the Gerhauser cohort. p-value was obtained using a Mann Whitney U test. (E) Violin plot showing BRD9 expression in who patients were ERG positive (right) and negative (left) in the Taylor cohort. p-value was obtained using a Mann Whitney U test. (F) Violin plot showing BRD9 expression in who patients were ERG positive (right) and negative (left) in the Abida cohort. p-value was obtained using a Mann Whitney U test. (G) Stacked bar chart showing BRD9 mutation distribution in patients who were ERG positive and negative and the number of patients in each sample in the Abida cohort. p-value was obtained using Fisher’s exact test. Y axis scales on violin plots vary due to experimental variation. Gene network map created using https://genemania.org/. (accessed on 19 April 2021).
Biomolecules 11 01794 g006
Table 1. Characteristics of human prostate cancer omics datasets investigated. Table summarising characteristics of publicly available cancer omics datasets and their patients. For each clinical attribute investigated, there was not necessarily data for each patient in the cohort.
TCGA [43]Glinsky [44]Grasso [45]Taylor [46]Varambally [47]Gerhauser [48]Barbieri [49]Ren [50]Abida [51]Dan [52]Kumar [53]
Cancertool nameTCGAGlinskyGrassoTaylorVaramballyN/AN/AN/AN/AN/AN/A
cBioPortal nameTCGA Firehose LegacyN/AMetastatic Prostate Adenocarcinoma (MCTP, Nature 2012)Prostate Adenocarcinoma (MSKCC, Cancer Cell 2010)N/AProstate Cancer (DKFZ, Cancer Cell 2018)Prostate Adenocarcinoma (Broad/Cornell, Nat Genet 2012)Prostate Adenocarcinoma (SMMU, Eur Urol 2017)Metastatic Prostate Adenocarcinoma (SU2C/PCF Dream Team, PNAS 2019)Metastatic Prostate Cancer SU2C/PCF Dream Team, Cell 2015)Prostate Adenocarcinoma (Fred Hutchinson CRC, Nat Med 2016)
Number of patients (N)49979612181325111265429150176
Cancer typePrimary prostate adenocarcinomaRecurrent (n = 37) and nonrecurrent (n = 42) diseaseHeavily penetrated CRPC (n = 50), high grade localised PCa (n = 11)Primary tumours (n = 81), metastatic disease (n = 37)Primary tumours (n = 7), metastatic disease (n = 6)Primary prostate adenocarcinomaProstate adenocarcinomaProstate adenocarcinomaMetastatic CRPCMetastatic CRPCPrimary and metastatic—mCRPC (n = 63)
Treatment (prior to specimen collection)NaïveUndergoing routine treatmentProstatectomy, chemotherapy, hormone therapy, radiotherapy, palliative radiotherapy. Localised cancers were treatment naïve.No informationNo informationTreatment naïve (except for two patients receiving neoadjuvant hormone therapy)Treatment-naïveTreatment-naïveStandard of care (including second generation antiandrogens)/enrolled in a clinical trial (e.g., targeted therapy)Various—second generation antiandrogens, clinical trial, taxane chemotherapyADT followed by second-generation antiandrogens (following disease progression) and docetaxel chemotherapy
Method of sample collectionRadical prostatectomyDuring therapeutic/diagnostic proceduresRapid autopsy (CRPC) and radical prostatectomy (localised)Radical prostatectomyRadical prostatectomy and rapid autopsyRadical prostatectomyRadical prostatectomyRadical prostatectomyRadiographic-guided biopsyRadiographic-guided biopsyRapid autopsy
Gleason grade5: -5: -5: -5: 2 (1%)-5: -5: -5: -5: ---
6: 45 (9%)6: 15 (19%)6: -6: 101 (47%)-6: 13 (11%)6: 4 (20%)6: 5 (8%)6: 15 (9%)--
7: 244 (50%)7: 45 (57%)7: 2 (18%)7: 77 (36%)-7: 86 (74%)7: 13 (65%) 7.5: 1 (5%)7: 37 (57%)7: 49 (29%)--
8: 63 (13%)8: 10 (13%)8: 4 (36%)8: 19 (9%)-8: 1 (1%)8: 2 (10%)8: 9 (14%)8: 23 (14%)--
9: 135 (27%)9: 9 (11%)9: 5 (46%)9: 15 (7%)-9: 15 (13%)9: -9: 12 (18%)9: 67 (40%)--
10: 4 (1%)10: -10: -10: --10: 1 (1%10: -10: 2 (3%)10: 13 (8%)--
11: -11: -11: -11: --11: -11: -11: -11: 1 (1%)--
Total patients (n) for whom a Gleason grade was available491 (100%)79 (100%)11 (100%)
(High grade localised PCas only)
214 (100%)No data available116 (100%)20 (100%)65 (100%)168 (101%)No data availableNo data available
Table 2. Classification of correlation strength. Table summarising correlation strength.
Spearman’s R (Positive)Spearman’s R (Negative)
Very weak0–0.190–−0.19
Weak0.2–0.39−0.2–−0.39
Moderate0.4–0.59−0.4–−0.59
Strong0.6–0.79−0.6–−0.79
Very strong0.8–1−0.8–−1
Publisher’s Note: MDPI stays neutral with regard to jurisdictional claims in published maps and institutional affiliations.

