
Heat Shock Proteins HSPA1 and HSP90AA1 Are Upregulated in Colorectal Polyps and Can Be Targeted in Cancer Cells by Anti-Inflammatory Oxicams with Arylpiperazine Pharmacophore and Benzoyl Moiety Substitutions at Thiazine Ring

 , , and
Abstract
:1. Introduction
2. Materials and Methods
2.1. Patients
2.2. Oxicams
2.3. Cell Cultures
2.4. Analytical Methods
2.4.1. Transcriptomic Analysis
2.4.2. Protein Analysis
2.5. Data Analysis
3. Results
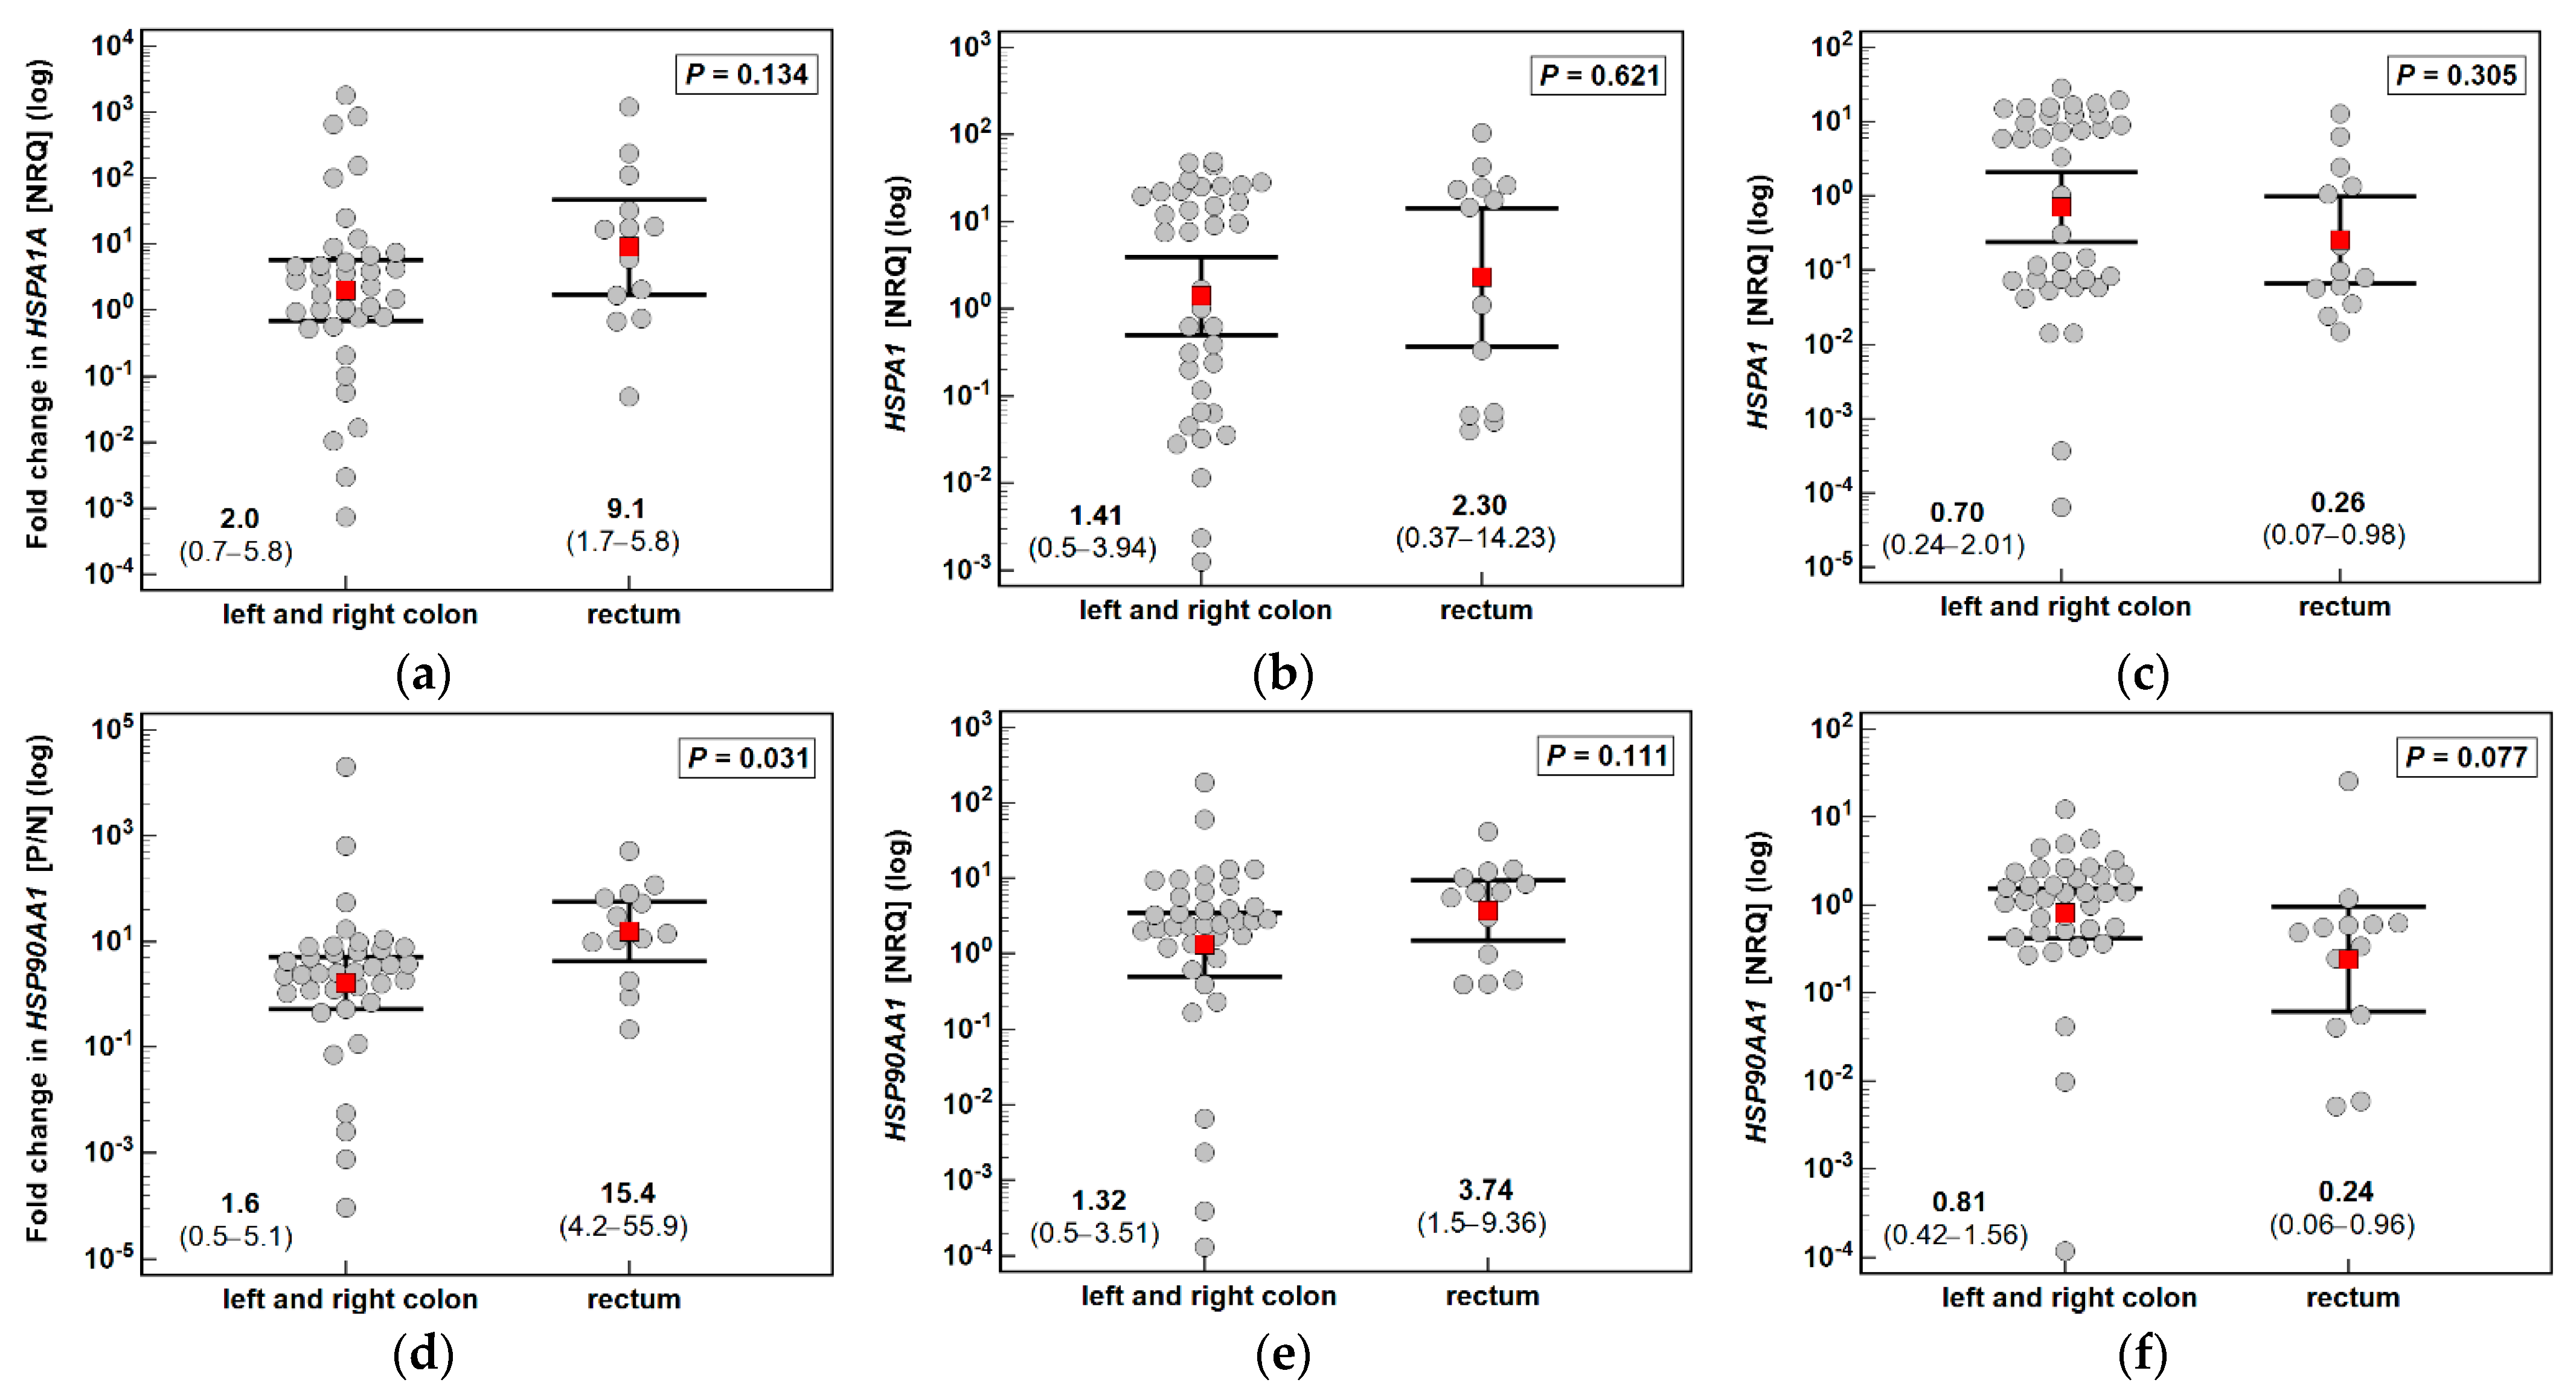
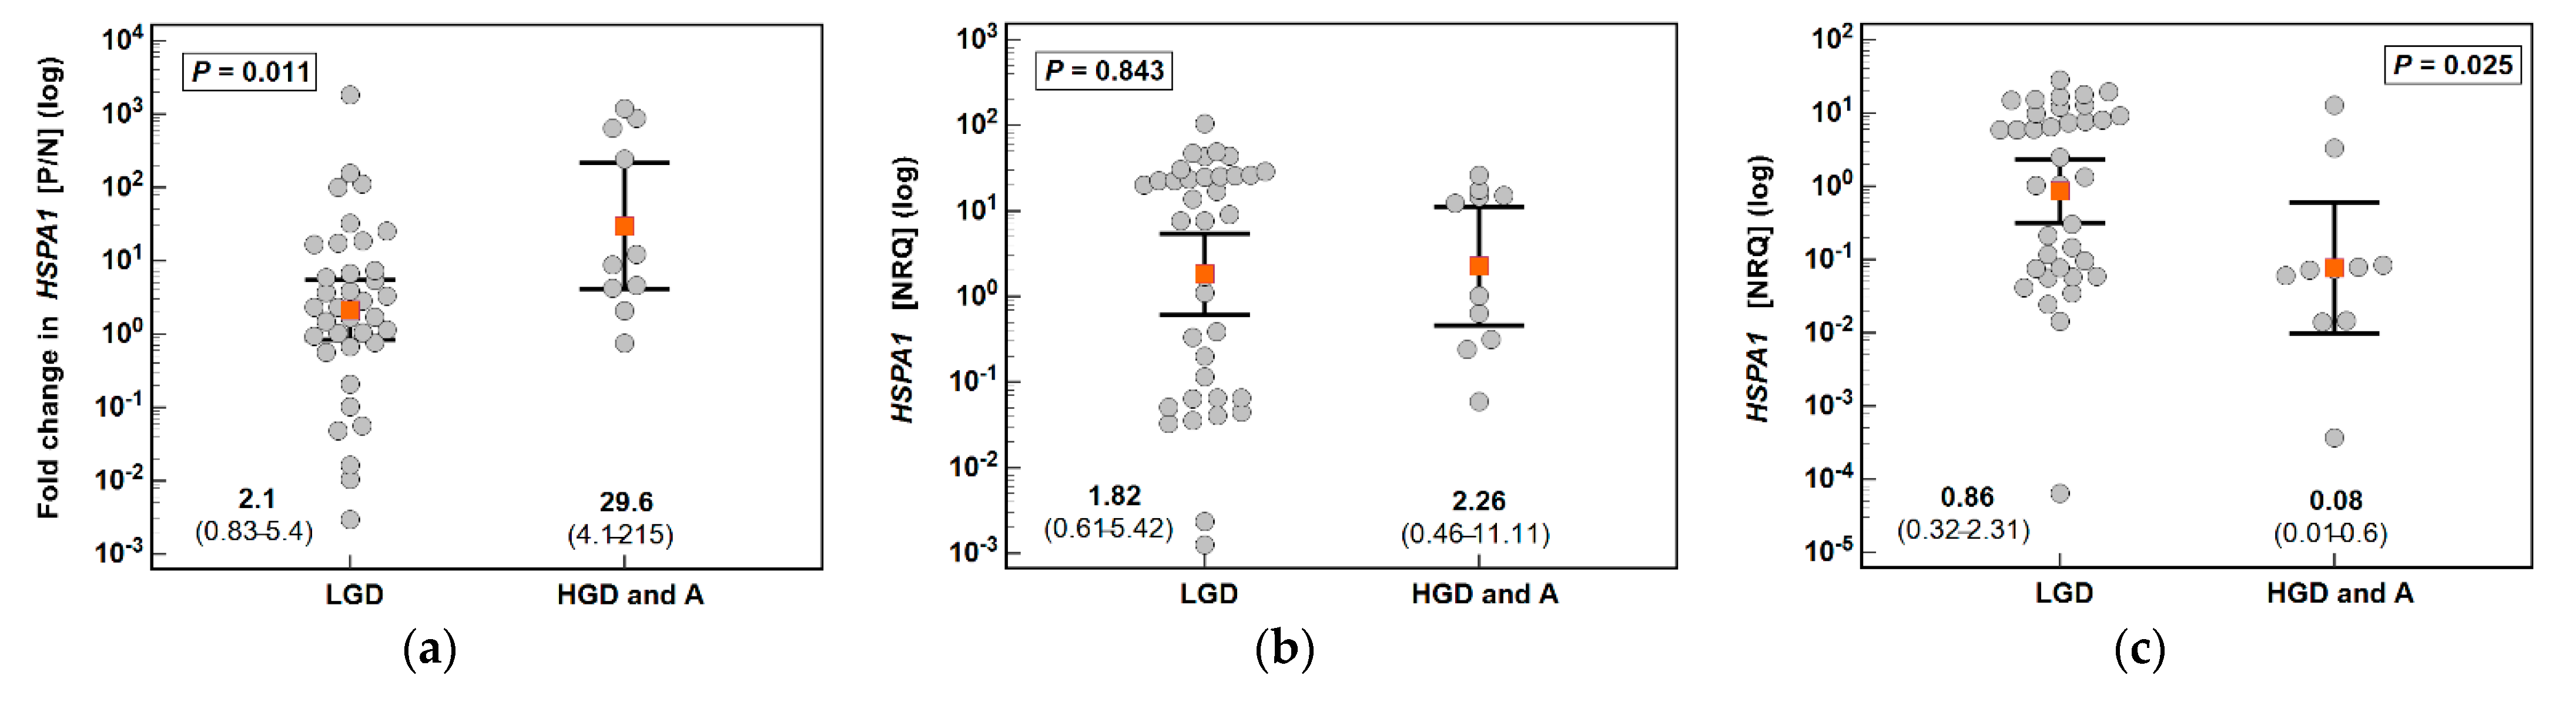
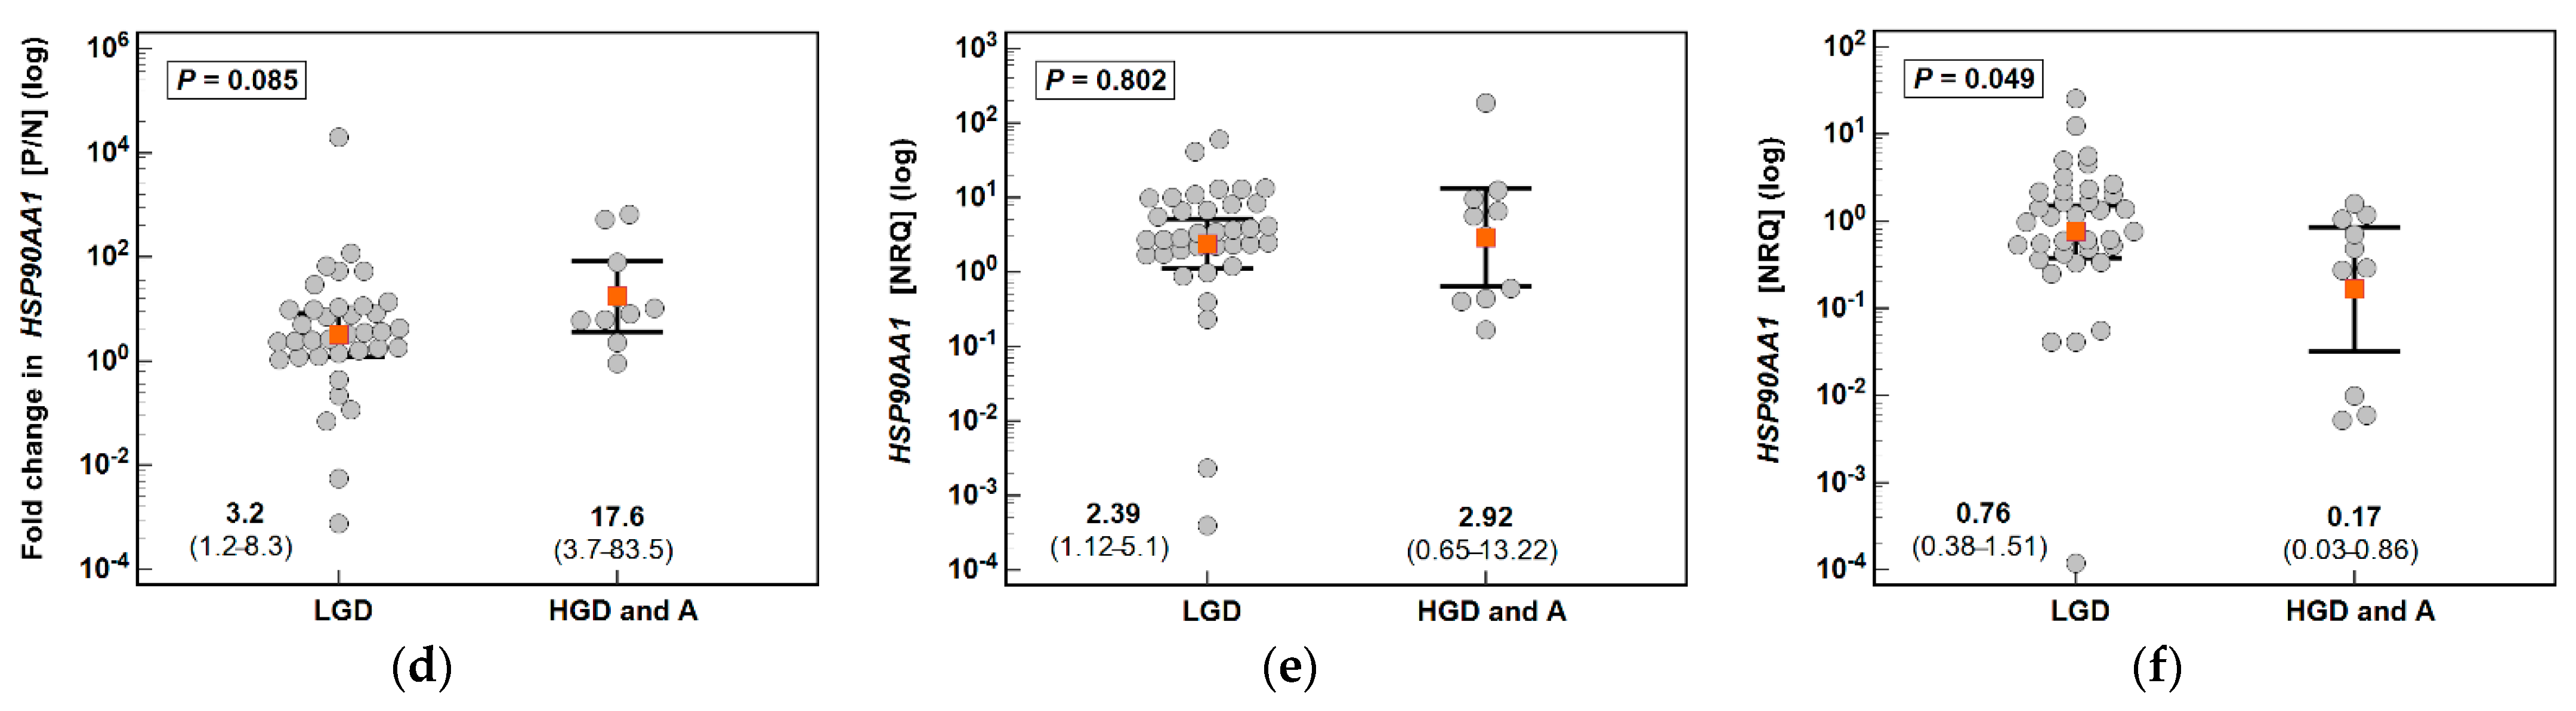
3.1. HSPA1 and HSP90AA1 Expression in Patients with Colorectal Polyps
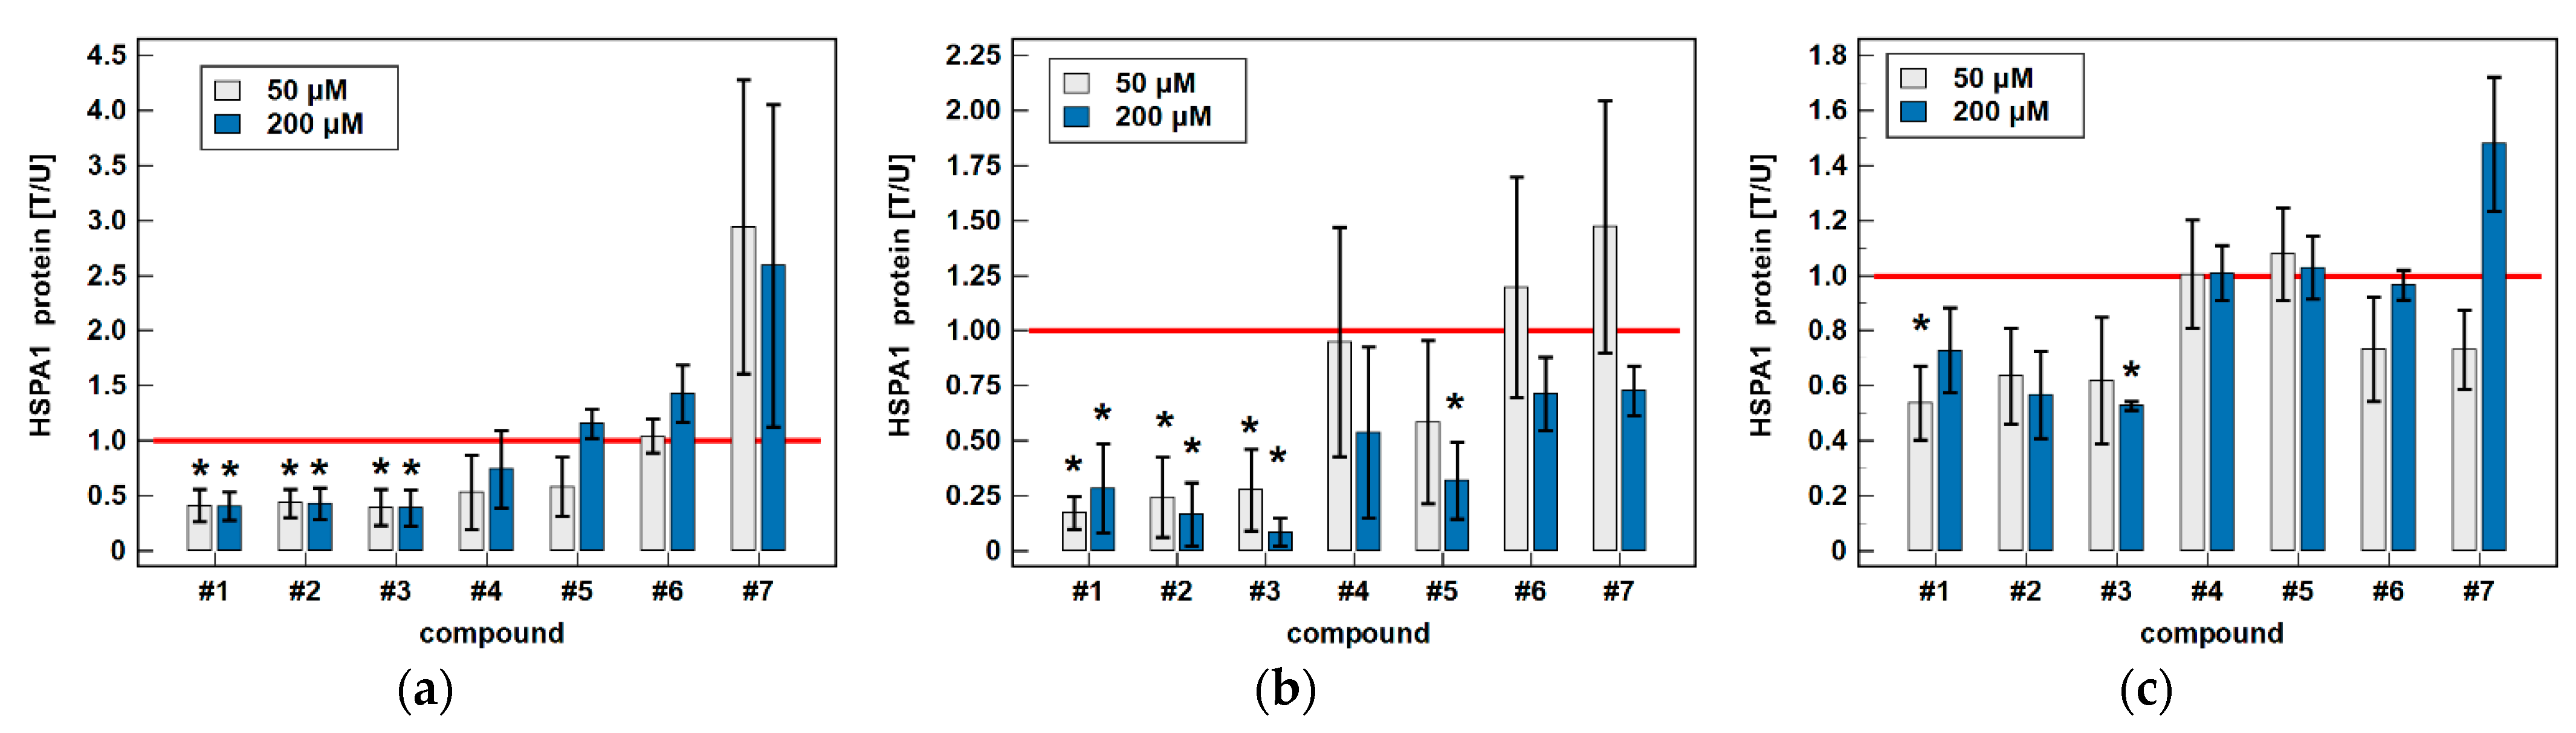
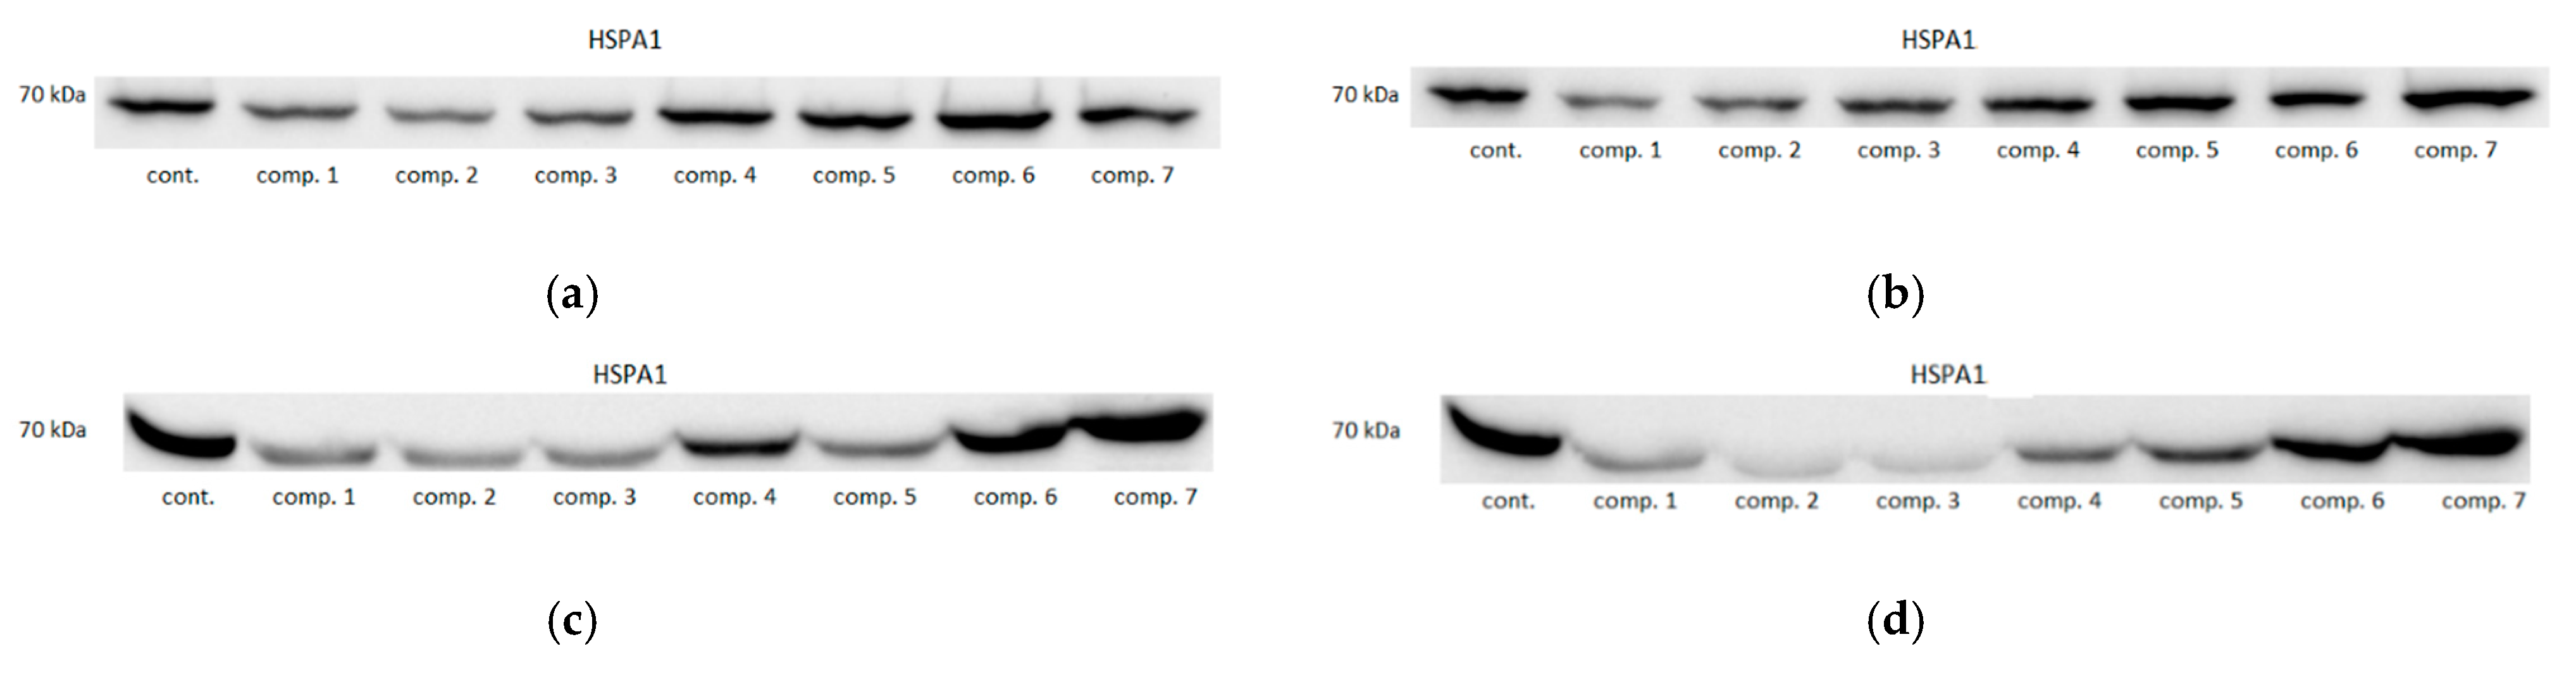
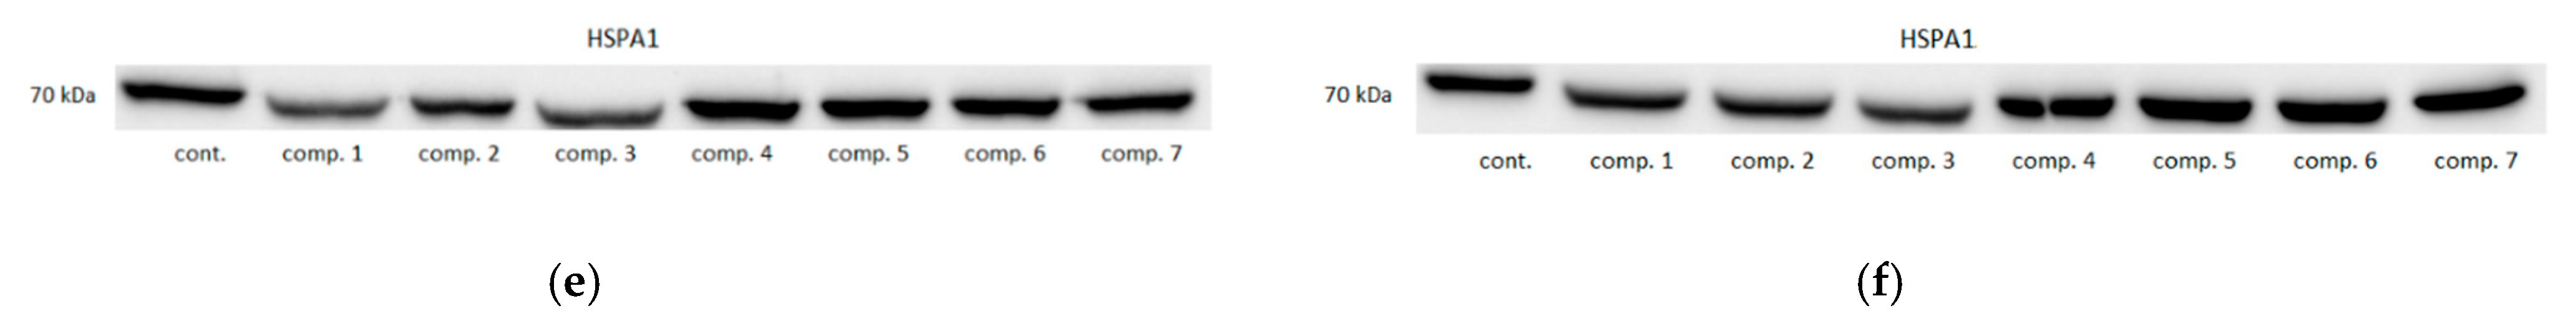
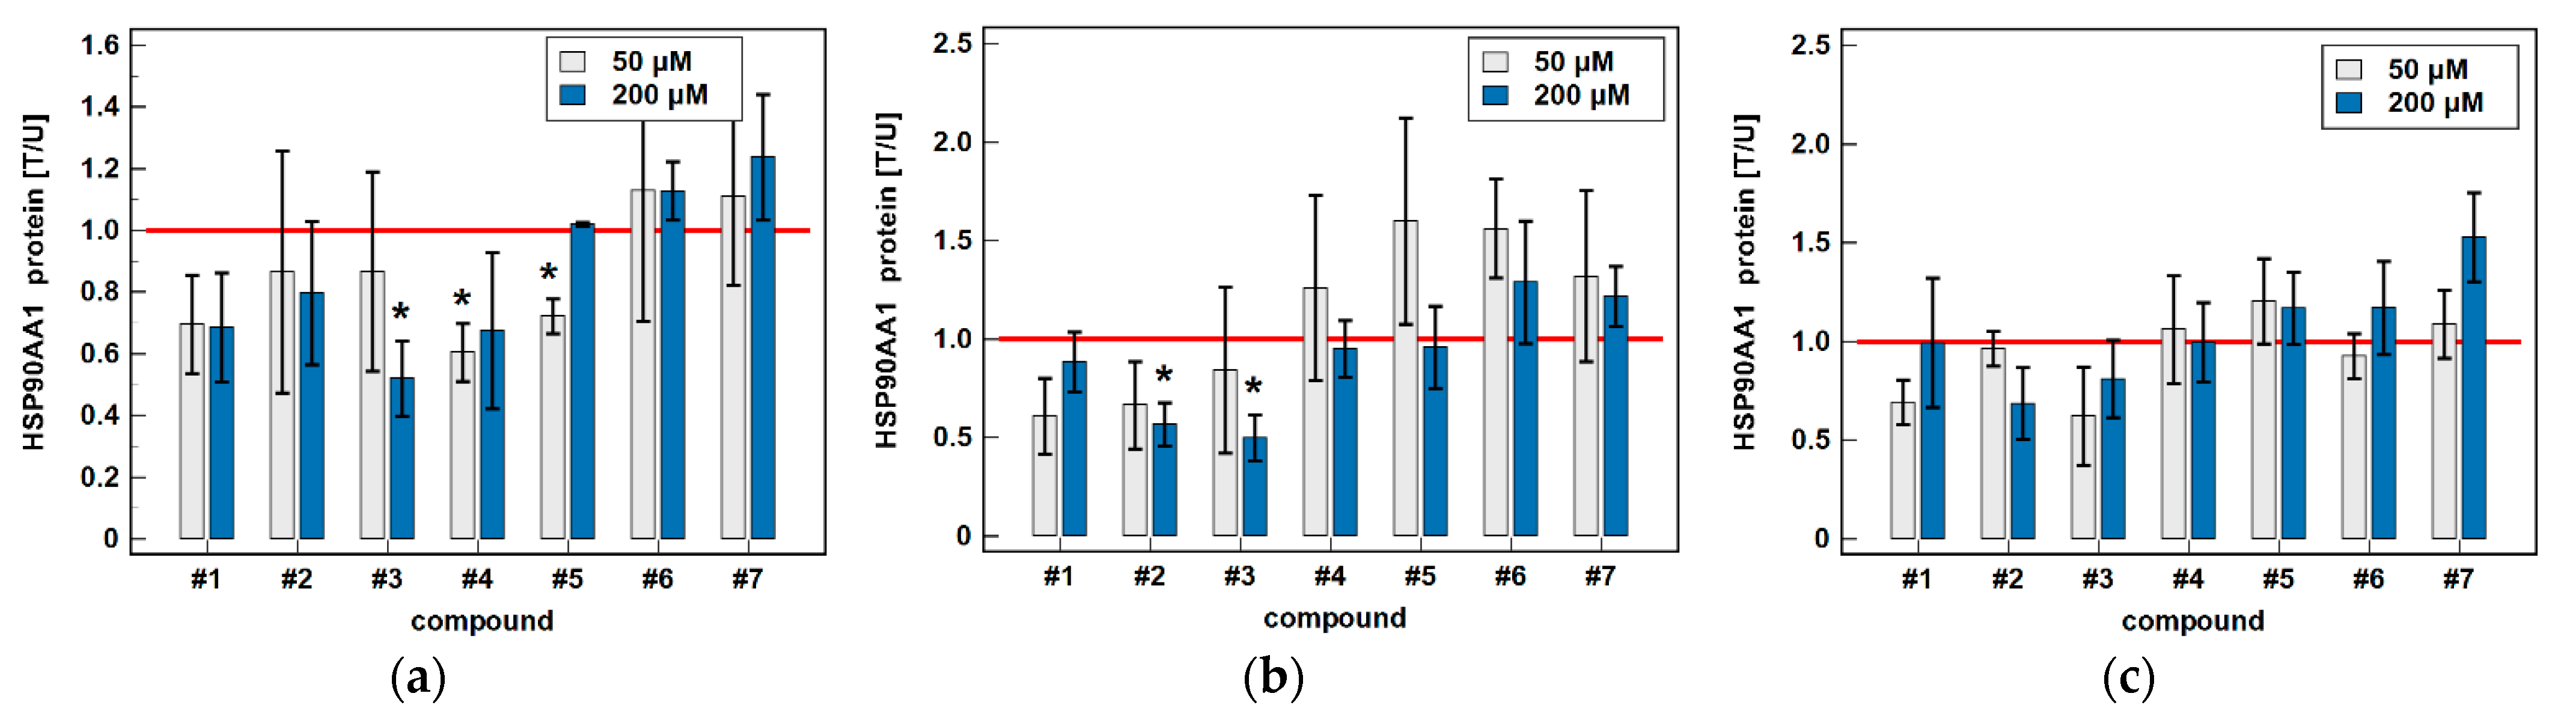
3.2. Effect of Oxicams on HSPA1 and HSP90AA1 Expression in Colorectal Adenocarcinoma Cell Lines Caco-2, HCT 116 and HT-29
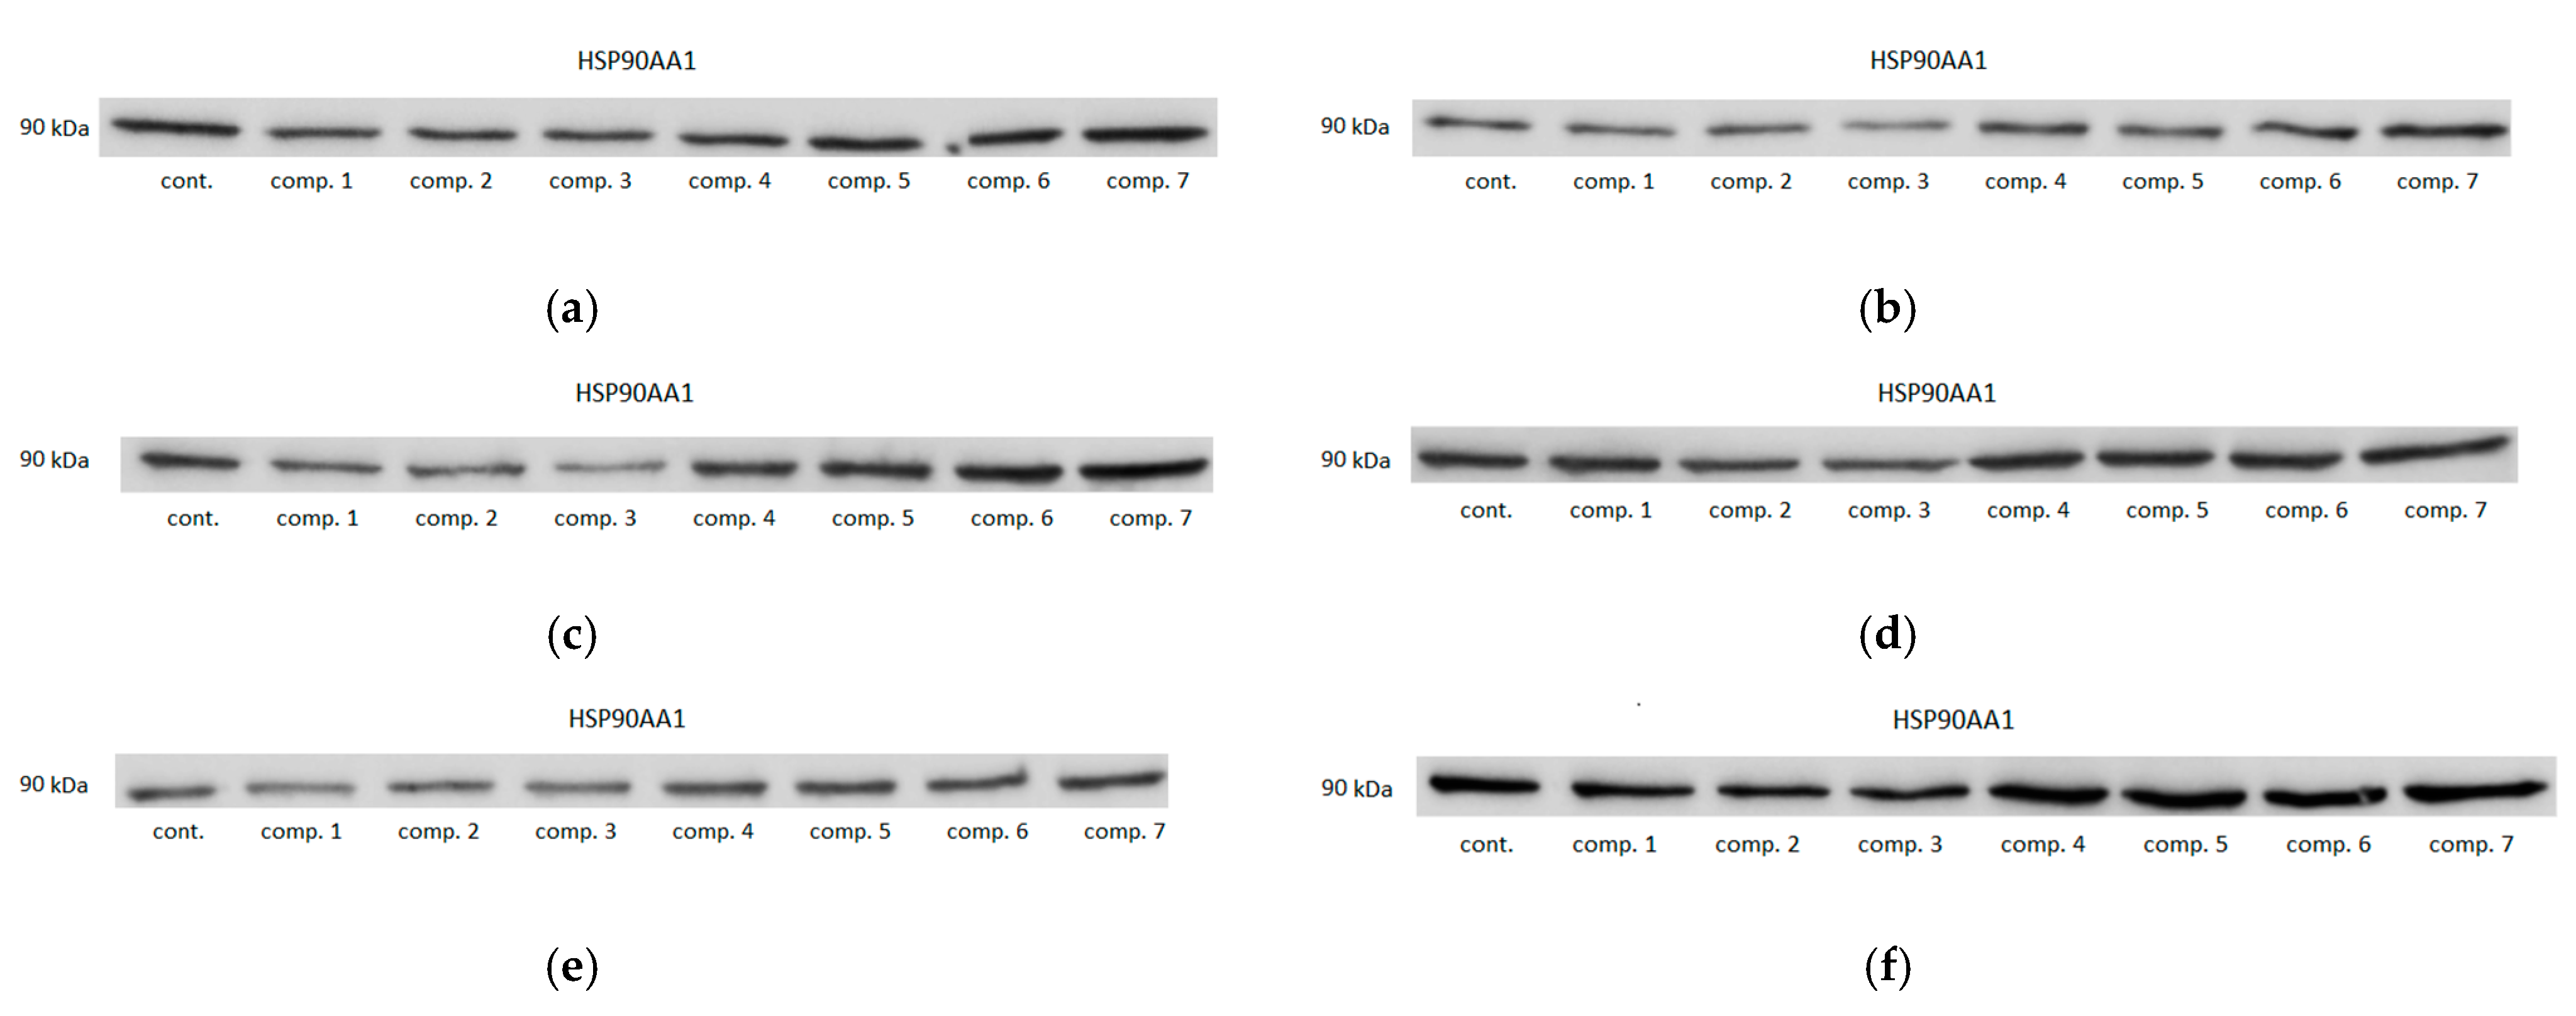
3.2.1. HSPA1/Hsp70α and HSP90AA1/Hsp90α Proteins
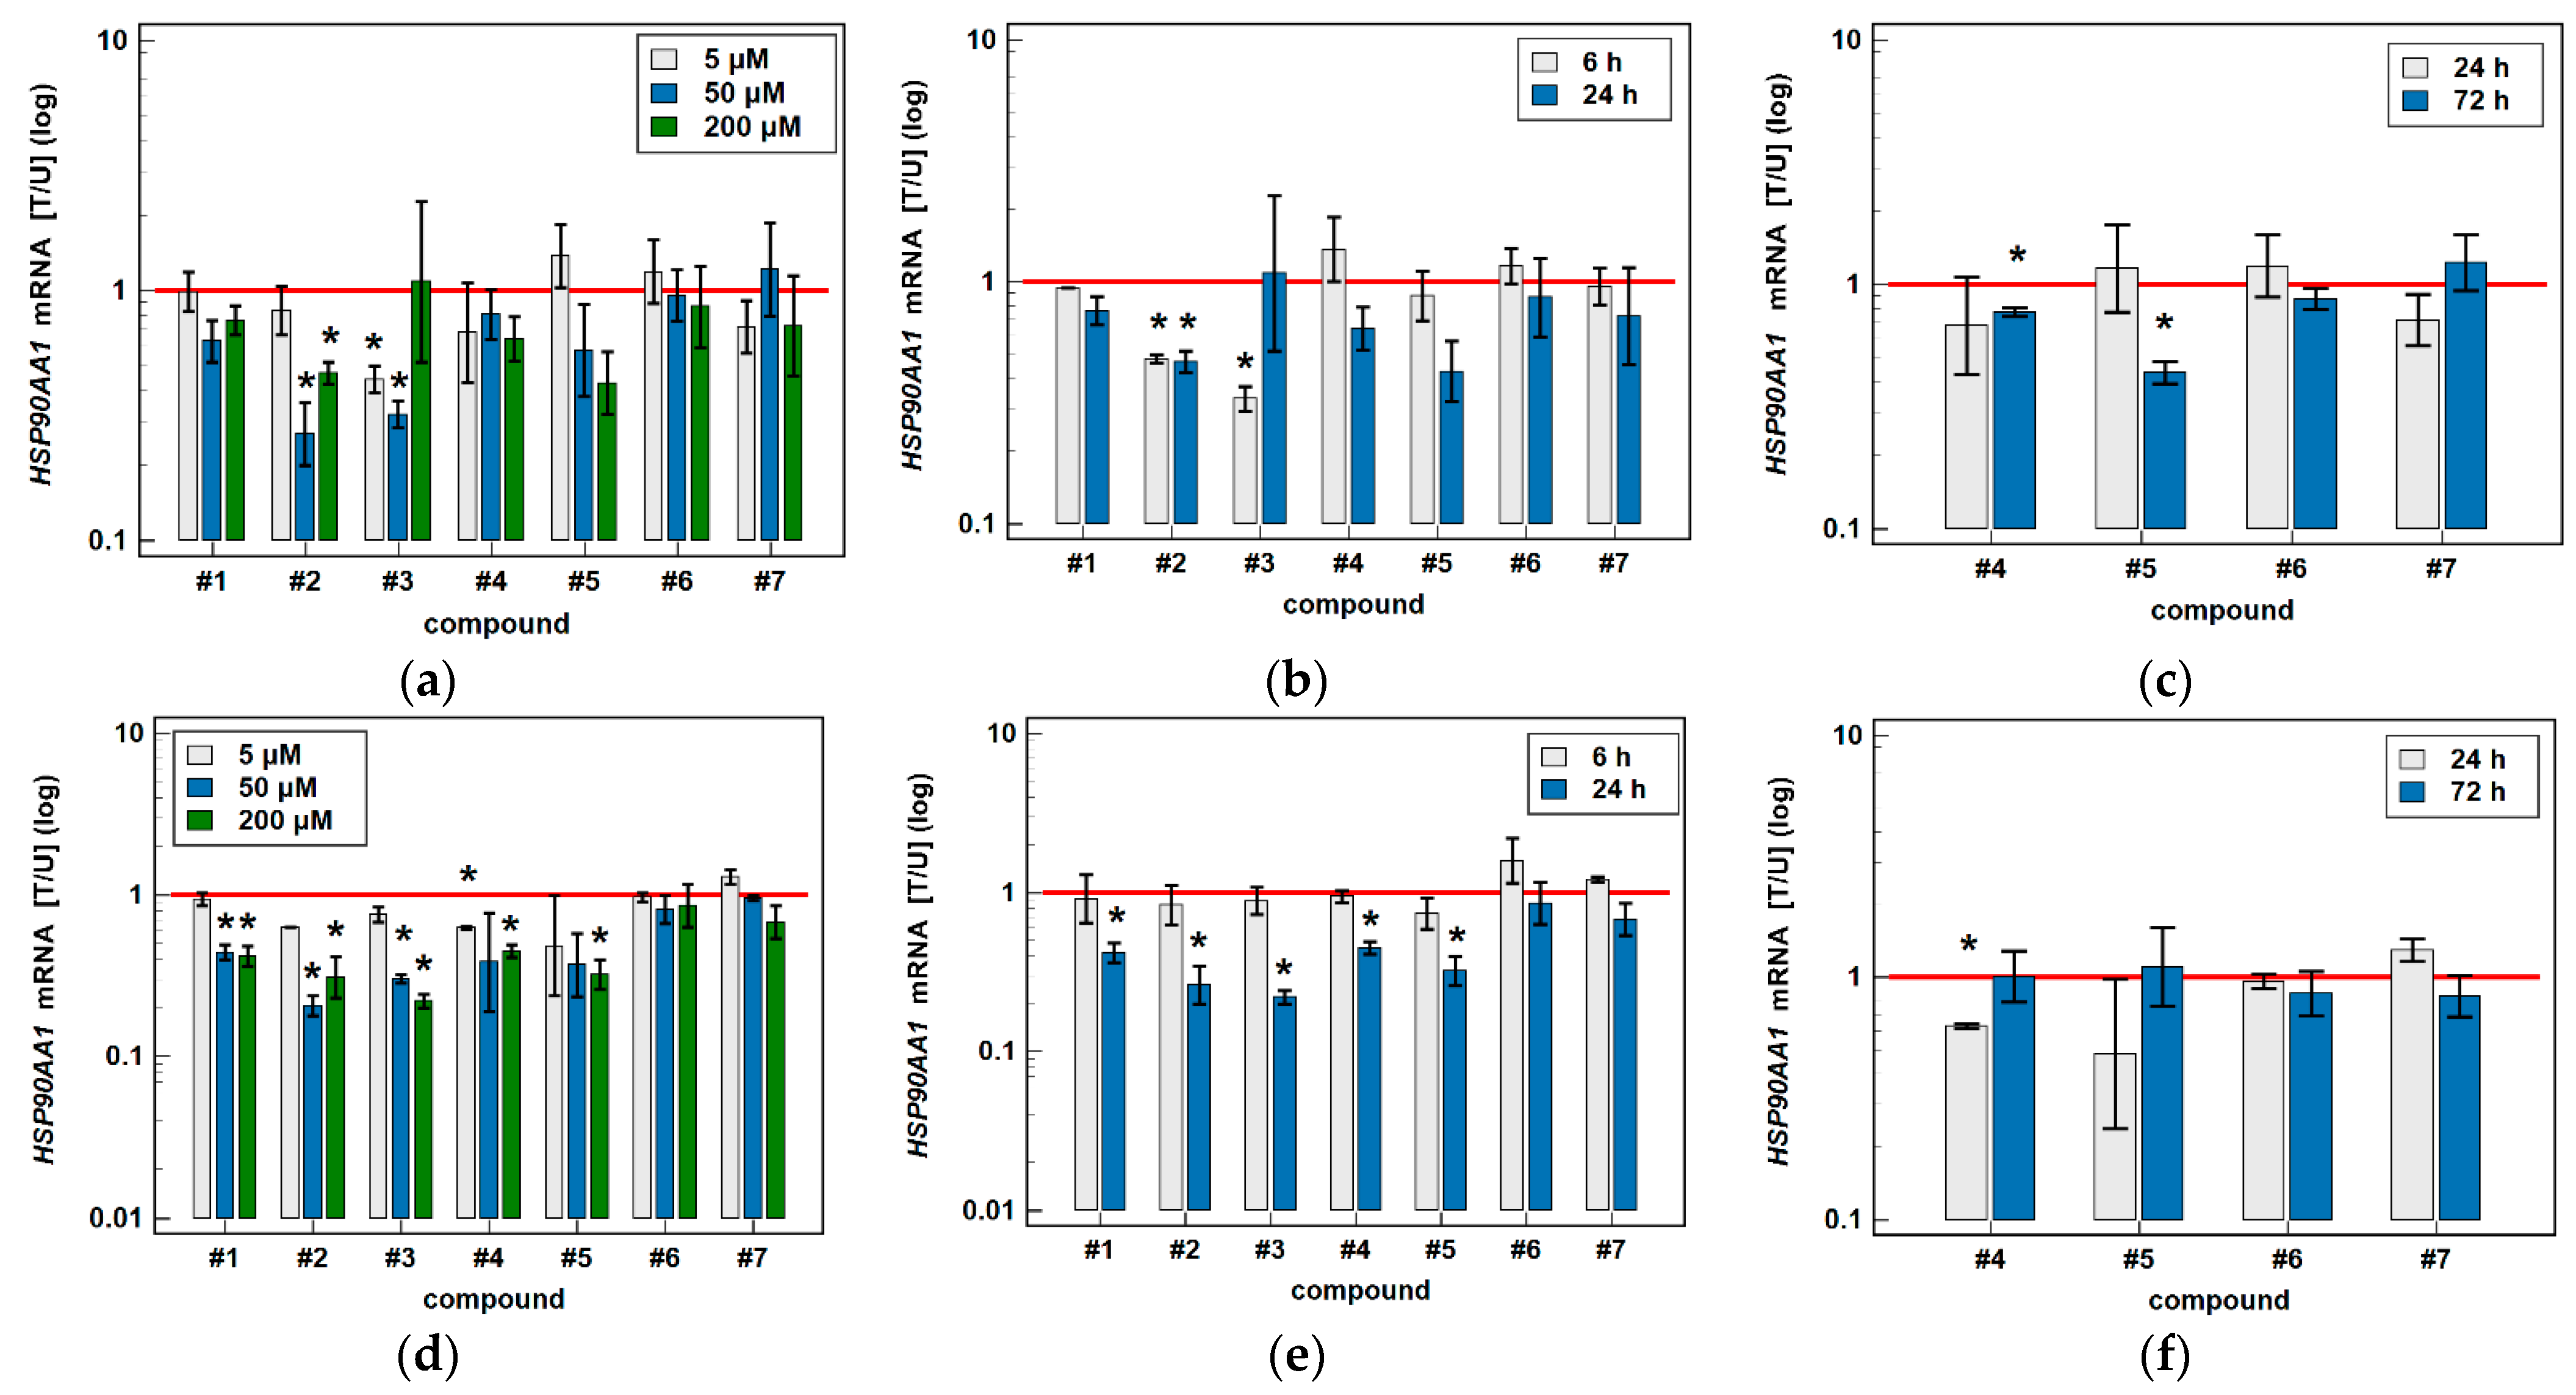
3.2.2. HSPA1 and HSP90AA1 Transcripts
4. Discussion
5. Conclusions
Author Contributions
Funding
Institutional Review Board Statement
Informed Consent Statement
Data Availability Statement
Conflicts of Interest
References
- Xie, Y.H.; Chen, Y.X.; Fang, J.Y. Comprehensive review of targeted therapy for colorectal cancer. Signal Transduct. Target. Ther. 2020, 5, 22. [Google Scholar] [CrossRef]
- Hanahan, D.; Weinberg, R.A. Hallmarks of cancer: The next generation. Cell 2011, 144, 646–674. [Google Scholar] [CrossRef] [PubMed] [Green Version]
- Zappavigna, S.; Cossu, A.M.; Grimaldi, A.; Bocchetti, M.; Ferraro, G.A.; Nicoletti, G.F.; Filosa, R.; Caraglia, M. Anti-Inflammatory Drugs as Anticancer Agents. Int. J. Mol. Sci. 2020, 21, 2605. [Google Scholar] [CrossRef] [Green Version]
- Galisteo, A.; Jannus, F.; García-García, A.; Aheget, H.; Rojas, S.; Lupiañez, J.A.; Rodríguez-Diéguez, A.; Reyes-Zurita, F.J.; Quílez Del Moral, J.F. Diclofenac N-Derivatives as Therapeutic Agents with Anti-Inflammatory and Anti-Cancer Effect. Int. J. Mol. Sci. 2021, 22, 5067. [Google Scholar] [CrossRef]
- Wong, R.S.Y. Role of Nonsteroidal Anti-Inflammatory Drugs (NSAIDs) in Cancer Prevention and Cancer Promotion. Adv. Pharmacol. Pharmaceutical Sci. 2019, 2019, 34189752019. [Google Scholar] [CrossRef] [Green Version]
- Maniewska, J.; Jeżewska, D. Non-steroidal anti-inflammatory drugs in colorectal cancer chemoprevention. Cancers 2021, 13, 594. [Google Scholar] [CrossRef]
- Pantziarka, P.; Verbaanderd, C.; Sukhatme, V.; Rica Capistrano, I.; Crispino, S.; Gyawali, B.; Rooman, I.; Van Nuffel, A.M.; Meheus, L.; Sukhatme, V.P.; et al. ReDO_DB: The repurposing drugs in oncology database. Ecancermedicalscience 2018, 12, 886. [Google Scholar] [CrossRef] [Green Version]
- Xu, S.; Rouzer, C.A.; Marnett, L.J. Oxicams, a class of nonsteroidal anti-inflammatory drugs and beyond. IUBMB Life 2014, 66, 803–811. [Google Scholar] [CrossRef]
- Calaluce, R.; Earnest, D.L.; Heddens, D.; Einspahr, J.G.; Roe, D.; Bogert, C.L.; Marshall, J.R.; Alberts, D.S. Effects of piroxicam on prostaglandin E2 levels in rectal mucosa of adenomatous polyp patients: A randomized phase IIb trial. Cancer Epidemiol. Biomarkers Prev. 2000, 9, 1287–1292. [Google Scholar]
- Saini, M.K.; Vaiphei, K.; Sanyal, S.N. Chemoprevention of DMH-induced rat colon carcinoma initiation by combination administration of piroxicam and C-phycocyanin. Mol. Cell. Biochem. 2012, 361, 217–228. [Google Scholar] [CrossRef]
- Saini, M.K.; Sanya, S.N. Targeting angiogenic pathway for chemoprevention of experimental colon cancer using C-phycocyanin as cyclooxygenase-2 inhibitor. Biochem. Cell Biol. 2014, 92, 206–218. [Google Scholar] [CrossRef] [PubMed]
- Saini, M.K.; Sanya, S.N. Cell cycle regulation and apoptotic cell death in experimental colon carcinogenesis: Intervening with cyclooxygenase-2 inhibitors. Nutr. Cancer 2015, 67, 620–636. [Google Scholar] [CrossRef]
- Goldman, A.P.; Williams, C.S.; Sheng, H.; Lamps, L.W.; Williams, V.P.; Pairet, M.; Morrow, J.D.; DuBois, R.N. Meloxicam inhibits the growth of colorectal cancer cells. Carcinogenesis 1998, 19, 2195–2199. [Google Scholar] [CrossRef]
- Naruse, T.; Nishida, Y.; Hosono, K.; Ishiguro, N. Meloxicam inhibits osteosarcoma growth, invasiveness and metastasis by COX-2-dependent and independent routes. Carcinogenesis 2006, 27, 584–592. [Google Scholar] [CrossRef] [Green Version]
- Da-Costa-Rocha, I.; Prieto, J.M. In vitro effects of selective COX and LOX inhibitors and their combinations with antineoplastic drugs in the mouse melanoma cell line B16F10. Int. J. Mol. Sci. 2021, 22, 6498. [Google Scholar] [CrossRef]
- Thabet, N.A.; El-Guendy, N.; Mohamed, M.M.; Shouman, S.A. Suppression of macrophages- Induced inflammation via targeting RAS and PAR-4 signaling in breast cancer cell lines. Toxicol. Appl. Pharmacol. 2019, 385, 114773. [Google Scholar] [CrossRef]
- Bjarnason, I.; Scarpignato, C.; Holmgren, E.; Olszewski, M.; Rainsford, K.D.; Lanas, A. Mechanisms of damage to the gastrointestinal tract from nonsteroidal anti-inflammatory drugs. Gastroenterology 2018, 154, 500–514. [Google Scholar] [CrossRef] [Green Version]
- Szczęśniak-Sięga, B.M.; Mogilski, S.; Wiglusz, R.J.; Janczak, J.; Maniewska, J.; Malinka, W.; Filipek, B. Synthesis and pharmacological evaluation of novel arylpiperazine oxicams derivatives as potent analgesics without ulcerogenicity. Bioorg. Med. Chem. 2019, 27, 1619–1628. [Google Scholar] [CrossRef]
- Krzystek-Korpacka, M.; Szczęśniak-Sięga, B.; Szczuka, I.; Fortuna, P.; Zawadzki, M.; Kubiak, A.; Mierzchała-Pasierb, M.; Fleszar, M.G.; Lewandowski, Ł.; Serek, P.; et al. L-arginine/nitric oxide pathway is altered in colorectal cancer and can be modulated by novel derivatives from oxicam class of non-steroidal anti-inflammatory drugs. Cancers 2020, 12, 2594. [Google Scholar] [CrossRef] [PubMed]
- HSP90 Facts & Literature. Available online: https://www.picard.ch/downloads/Hsp90facts.pdf (accessed on 10 August 2021).
- Ryu, S.W.; Stewart, R.; Pectol, D.C.; Ender, N.A.; Wimalarathne, O.; Lee, J.H.; Zanini, C.P.; Harvey, A.; Huibregtse, J.M.; Mueller, P.; et al. Proteome-wide identification of HSP70/HSC70 chaperone clients in human cells. PLoS Biol. 2020, 18, e3000606. [Google Scholar] [CrossRef] [PubMed]
- Ge, H.; Yan, Y.; Guo, L.; Tian, F.; Wu, D. Prognostic role of HSPs in human gastrointestinal cancer: A systematic review and meta-analysis. Oncol. Targets Ther. 2018, 11, 351–359. [Google Scholar] [CrossRef] [Green Version]
- Lacey, T.; Lacey, H. Linking Hsp90’s role as an evolutionary capacitator to the development of cancer. Cancer Treat. Res. Commun. 2021, 28, 100400. [Google Scholar] [CrossRef]
- Gráf, L.; Barabás, L.; Madaras, B.; Garam, N.; Maláti, É.; Horváth, L.; Prohászka, Z.; Horváth, Z.; Kocsis, J. High serum Hsp70 level predicts poor survival in colorectal cancer: Results obtained in an independent validation cohort. Cancer Biomark. 2018, 23, 539–547. [Google Scholar] [CrossRef]
- Jagadish, N.; Parashar, D.; Gupta, N.; Agarwal, S.; Suri, V.; Kumar, R.; Suri, V.; Sadasukhi, T.C.; Gupta, A.; Ansari, A.S.; et al. Heat shock protein 70-2 (HSP70-2) is a novel therapeutic target for colorectal cancer and is associated with tumor growth. BMC Cancer 2016, 16, 561. [Google Scholar] [CrossRef] [Green Version]
- Jiang, W.; Pan, X.; Yan, H.; Wang, G. Prognostic significance of the Hsp70 gene family in colorectal cancer. Med. Sci. Monit. 2021, 27, e928352. [Google Scholar] [CrossRef]
- Milani, A.; Basirnejad, M.; Bolhassani, A. Heat-shock proteins in diagnosis and treatment: An overview of different biochemical and immunological functions. Immunotherapy 2019, 11, 215–239. [Google Scholar] [CrossRef]
- Biebl, M.M.; Buchner, J. Structure, function, and regulation of the Hsp90 machinery. Cold Spring Harb. Perspect. Biol. 2019, 11, a034017. [Google Scholar] [CrossRef] [Green Version]
- Moradi-Marjaneh, R.; Paseban, M.; Moradi-Marjaneh, M. Hsp70 inhibitors: Implications for the treatment of colorectal cancer. IUBMB Life 2019, 71, 1834–1845. [Google Scholar] [CrossRef]
- Chanteloup, G.; Cordonnier, M.; Isambert, N.; Bertaut, A.; Hervieu, A.; Hennequin, A.; Luu, M.; Zanetta, S.; Coudert, B.; Bengrine, L.; et al. Monitoring HSP70 exosomes in cancer patients’ follow up: A clinical prospective pilot study. J. Extracell 3Vesicles 2020, 9, 1766192. [Google Scholar] [CrossRef]
- Krzyżak, E.; Szczęśniak-Sięga, B.; Malinka, W. Synthesis and thermal behaviour of new benzo-1,2-thiazine long-chain aryl-piperazine derivatives. J. Therm. Anal. Calorim. 2014, 115, 793–802. [Google Scholar] [CrossRef] [Green Version]
- Szczęśniak-Sięga, B.; Maniewska, J.; Poła, A.; Środa-Pomianek, K.; Malinka, W.; Michalak, K. Synthesis of new Piroxicam analogues and their influence on lipid bilayers. Acta Pol. Pharm. Drug Res. 2014, 71, 1045–1050. [Google Scholar] [CrossRef]
- Maniewska, J.; Szczęśniak-Sięga, B.; Poła, A.; Środa-Pomianek, K.; Malinka, W.; Michalak, K. The interaction of new piroxicam analogues with lipid bilayers–a calorimetric and fluorescence spectroscopic study. Acta Pol. Pharm. Drug Res. 2014, 71, 1004–1012. [Google Scholar] [CrossRef]
- Lewandowska, P.; Wierzbicki, J.; Zawadzki, M.; Agrawal, A.; Krzystek-Korpacka, M. Biphasic expression of atypical chemokine receptor (ACKR) 2 and ACKR4 in colorectal neoplasms in association with histopathological findings. Biomolecules 2020, 11, 8. [Google Scholar] [CrossRef]
- Hellemans, J.; Vandesompele, J. qPCR data analysis–unlocking the secret to successful results. In PCR Troubleshooting and Optimization: The Essential Guide, 1st ed.; Kennedy, S., Oswald, N., Eds.; Caister Academic Press: Poole, UK, 2011. [Google Scholar]
- Chan, T.A. Nonsteroidal anti-inflammatory drugs, apoptosis, and colon-cancer chemoprevention. Lancet Oncol. 2002, 3, 166–174. [Google Scholar] [CrossRef]
- Gao, G.; Liu, S.; Yao, Z.; Zhan, Y.; Chen, W.; Liu, Y. The Prognostic Significance of Hsp70 in Patients with Colorectal Cancer Patients: A PRISMA-Compliant Meta-Analysis. Biomed. Res. Int. 2021, 2021, 5526327. [Google Scholar] [CrossRef]
- Lazaris, A.C.; Theodoropoulos, G.E.; Davaris, P.S.; Panoussopoulos, D.; Nakopoulou, L.; Kittas, C.; Golematis, B.C. Heat shock protein 70 and HLA-DR molecules tissue expression. Prognostic implications in colorectal cancer. Dis. Colon Rectum 1995, 38, 739–745. [Google Scholar] [CrossRef]
- Bauer, K.; Nitsche, U.; Slotta-Huspenina, J.; Drecoll, E.; von Weyhern, C.H.; Rosenberg, R.; Höfler, H.; Langer, R. High HSP27 and HSP70 expression levels are independent adverse prognostic factors in primary resected colon cancer. Cell Oncol. 2012, 35, 197–205. [Google Scholar] [CrossRef]
- Shotar, A.M. P53 and heat shock protein 70 expressions in colorectal adenocarcinoma. Saudi Med. J. 2005, 26, 1602–1606. [Google Scholar]
- Tao, Y.; Messer, J.S.; Goss, K.H.; Hart, J.; Bissonnette, M.; Chang, E.B. Hsp70 exerts oncogenic activity in the Apc mutant Min mouse model. Carcinogenesis 2016, 37, 731–739. [Google Scholar] [CrossRef] [Green Version]
- Nikotina, A.D.; Vladimirova, S.A.; Komarovat, E.Y.; Alexeev, D.; Efremov, S.; Leonova, E.; Pavlov, R.; Kartsev, V.G.; Polonik, S.G.; Margulis, B.A.; et al. Prevention of High Glucose-Mediated EMT by Inhibition of Hsp70 Chaperone. Int. J. Mol. Sci. 2021, 22, 6902. [Google Scholar] [CrossRef]
- Gurbuxani, S.; Bruey, J.M.; Fromentin, A.; Larmonier, N.; Parcellier, A.; Jäättelä, M.; Martin, F.; Solary, E.; Garrido, C. Selective depletion of inducible HSP70 enhances immunogenicity of rat colon cancer cells. Oncogene 2001, 20, 7478–7485. [Google Scholar] [CrossRef] [Green Version]
- Nylandsted, J.; Wick, W.; Hirt, U.A.; Brand, K.; Rohde, M.; Leist, M.; Weller, M.; Jäättelät, M. Eradication of glioblastoma, and breast and colon carcinoma xenografts by Hsp70 depletion. Cancer Res. 2002, 62, 7139–7142. [Google Scholar]
- Diakowska, D.; Krzystek-Korpacka, M. Local and systemic interleukin-32 in esophageal, gastric, and colorectal cancers: Clinical and diagnostic significance. Diagnostics 2020, 10, 785. [Google Scholar] [CrossRef]
- Patel, A.; Tripathi, G.; Gopalakrishnan, K.; Williams, N.; Arasaradnam, R.P. Field cancerisation in colorectal cancer: A new frontier or pastures past? World J. Gastroenterol. 2015, 21, 3763–3772. [Google Scholar] [CrossRef]
- Colucci, P.M.; Yale, S.H.; Rall, C.J. Colorectal polyps. Clin. Med. Res. 2003, 1, 261–262. [Google Scholar] [CrossRef] [Green Version]
- Meng, L.; Hunt, C.; Yaglom, J.; Gabai, V.L.; Sherman, M.Y. Heat shock protein Hsp72 plays an essential role in Her2-induced mammary tumorigenesis. Oncogene 2011, 30, 2836–2845. [Google Scholar] [CrossRef] [Green Version]
- Agarwal, B.; Swaroop, P.; Protiva, P.; Raj, S.V.; Shirin, H.; Holt, P.R. Cox-2 is needed but not sufficient for apoptosis induced by Cox-2 selective inhibitors in colon cancer cells. Apoptosis 2003, 8, 649–654. [Google Scholar] [CrossRef]
- Hatnapure, G.D.; Keche, A.P.; Rodge, A.H.; Birajdar, S.S.; Tale, R.H.; Kamble, V.M. Synthesis and biological evaluation of novel piperazine derivatives of flavone as potent anti-inflammatory and antimicrobial agent. Bioorg. Med. Chem. Lett. 2012, 22, 6385–6390. [Google Scholar] [CrossRef]
- Jaeger, A.M.; Whitesell, L. HSP90: Enabler of Cancer Adaptation. Annu. Rev. Cancer Biol. 2019, 3, 275–297. [Google Scholar] [CrossRef]
- Moser, C.; Lang, S.A.; Stoeltzing, O. Heat-shock protein 90 (Hsp90) as a molecular target for therapy of gastrointestinal cancer. Anticancer Res. 2009, 29, 2031–2042. [Google Scholar]


| Parameter | Characteristics |
|---|---|
| N | 50 |
| Sex distribution [F/M], n | 23/27 |
| Age [yrs.], mean (95%CI) | 62.9 (59.1–66.7) |
| Polyp histology, n: | |
| tubular adenoma | 5 |
| tubulo-villous adenoma | 33 |
| villous adenoma | 5 |
| hyperplastic polyps | 4 |
| adenocarcinomas | 3 |
| Grade of dysplasia, n: | |
| low | 10 |
| high | 36 |
| Polyp size, n: | |
| <10 mm | 9 |
| 10–19 mm | 25 |
| ≥20 mm | 16 |
| Polyp location, n: | |
| left colon | 22 |
| right colon | 15 |
| rectum | 13 |
| Number of polyps: | |
| One | 34 |
| Multiple | 26 |
| Oxicam | Structure |
|---|---|
| Compound #1 |  |
| Compound #2 | 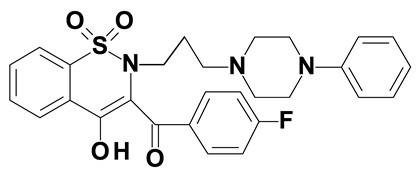 |
| Compound #3 | 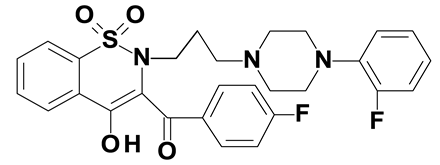 |
| Compound #4 | 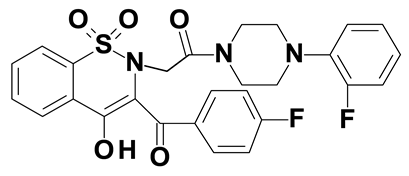 |
| Compound #5 | 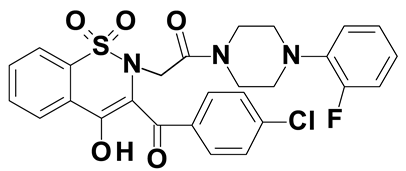 |
| Piroxicam #6 | 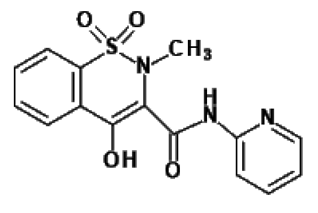 |
| Meloxicam #7 | 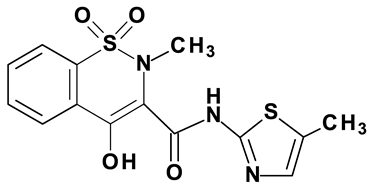 |
| Gene | Mean Expression (95%CI) [NRQ] | FC [P/N], p | |
|---|---|---|---|
| Normal Mucosa | Polyp | ||
| HSPA1 | 0.54 (0.23‒1.27) | 1.60 (0.67‒3.80) | 2.97, p = 0.016 |
| HSP90AA1 | 0.59 (0.32‒1.07) | 1.73 (0.82‒3.69) | 2.94, p = 0.023 |
Publisher’s Note: MDPI stays neutral with regard to jurisdictional claims in published maps and institutional affiliations. |
© 2021 by the authors. Licensee MDPI, Basel, Switzerland. This article is an open access article distributed under the terms and conditions of the Creative Commons Attribution (CC BY) license (https://creativecommons.org/licenses/by/4.0/).
Share and Cite
Szczuka, I.; Wierzbicki, J.; Serek, P.; Szczęśniak-Sięga, B.M.; Krzystek-Korpacka, M. Heat Shock Proteins HSPA1 and HSP90AA1 Are Upregulated in Colorectal Polyps and Can Be Targeted in Cancer Cells by Anti-Inflammatory Oxicams with Arylpiperazine Pharmacophore and Benzoyl Moiety Substitutions at Thiazine Ring. Biomolecules 2021, 11, 1588. https://doi.org/10.3390/biom11111588
Szczuka I, Wierzbicki J, Serek P, Szczęśniak-Sięga BM, Krzystek-Korpacka M. Heat Shock Proteins HSPA1 and HSP90AA1 Are Upregulated in Colorectal Polyps and Can Be Targeted in Cancer Cells by Anti-Inflammatory Oxicams with Arylpiperazine Pharmacophore and Benzoyl Moiety Substitutions at Thiazine Ring. Biomolecules. 2021; 11(11):1588. https://doi.org/10.3390/biom11111588
Chicago/Turabian StyleSzczuka, Izabela, Jarosław Wierzbicki, Paweł Serek, Berenika M. Szczęśniak-Sięga, and Małgorzata Krzystek-Korpacka. 2021. "Heat Shock Proteins HSPA1 and HSP90AA1 Are Upregulated in Colorectal Polyps and Can Be Targeted in Cancer Cells by Anti-Inflammatory Oxicams with Arylpiperazine Pharmacophore and Benzoyl Moiety Substitutions at Thiazine Ring" Biomolecules 11, no. 11: 1588. https://doi.org/10.3390/biom11111588
APA StyleSzczuka, I., Wierzbicki, J., Serek, P., Szczęśniak-Sięga, B. M., & Krzystek-Korpacka, M. (2021). Heat Shock Proteins HSPA1 and HSP90AA1 Are Upregulated in Colorectal Polyps and Can Be Targeted in Cancer Cells by Anti-Inflammatory Oxicams with Arylpiperazine Pharmacophore and Benzoyl Moiety Substitutions at Thiazine Ring. Biomolecules, 11(11), 1588. https://doi.org/10.3390/biom11111588