Heterogeneity of Glucose Transport in Lung Cancer

Abstract
1. Glucose Metabolism in Cancer
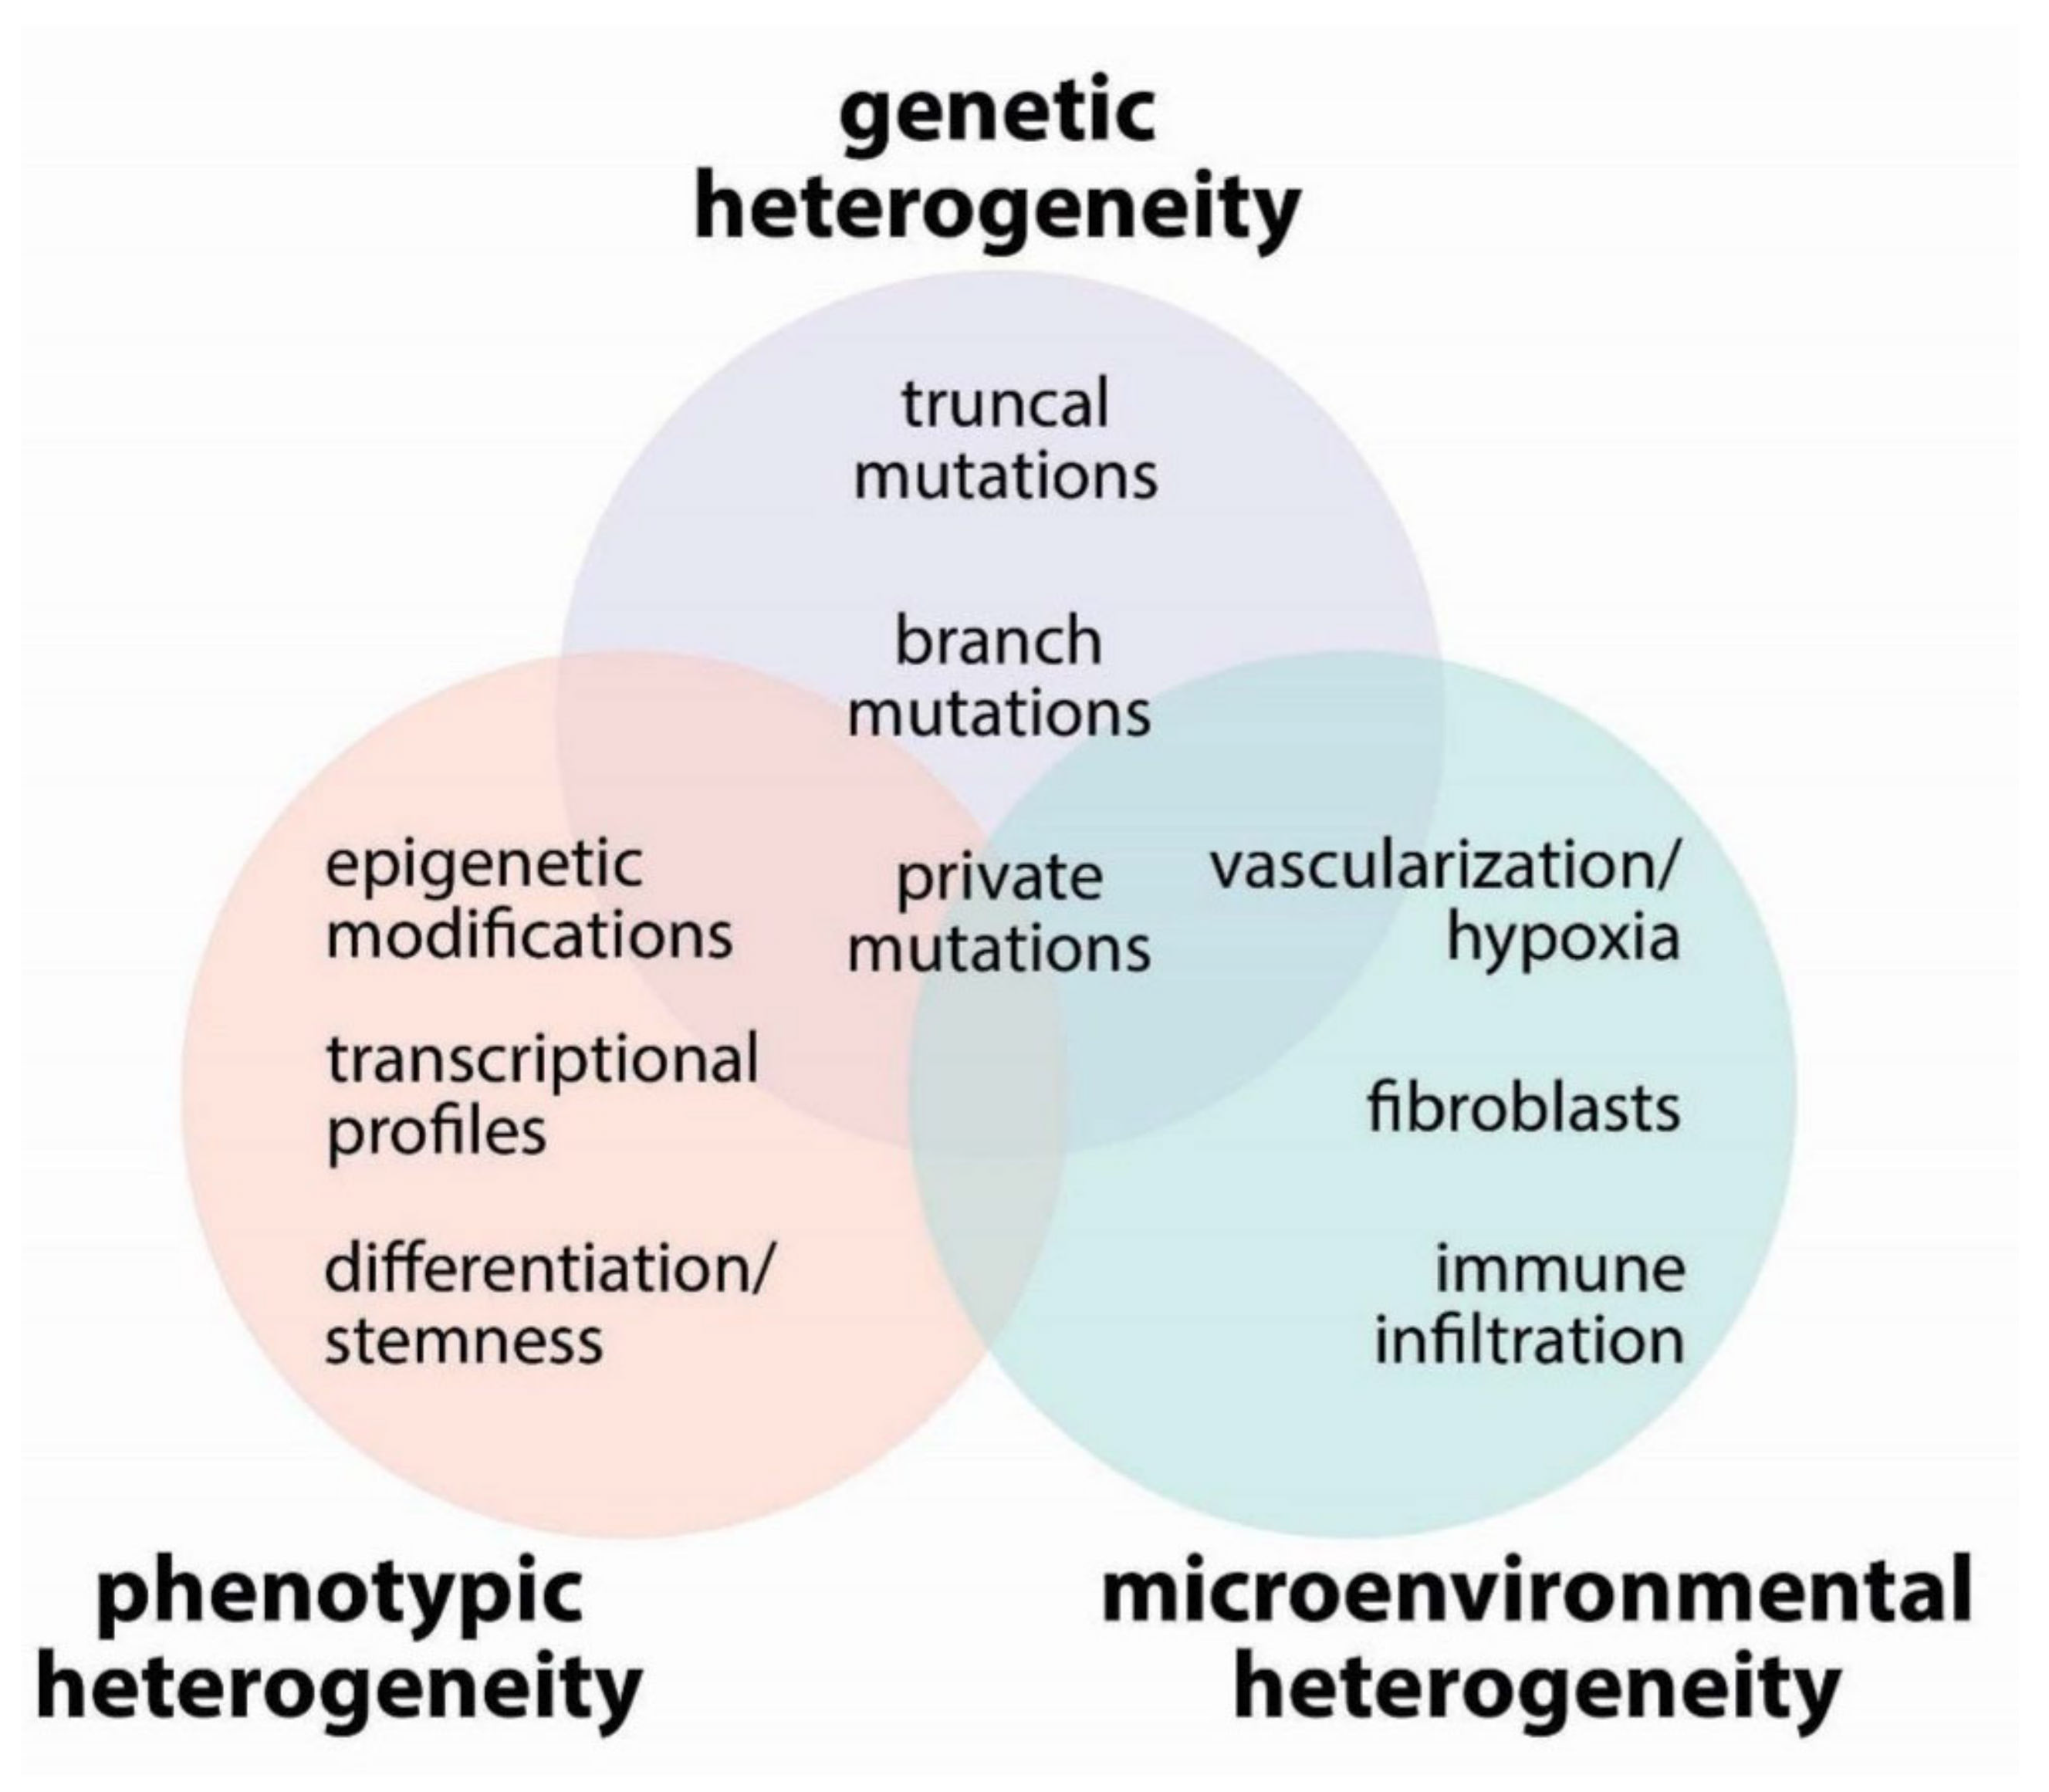
2. Tumor Heterogeneity
2.1. Genetic Heterogeneity
2.2. Phenotypic Heterogeneity
2.3. Microenvironmental Heterogeneity
2.3.1. Blood Vessels
2.3.2. Fibroblasts
2.3.3. Immune Cells
3. Metabolic Interactions in the Tumor Microenvironment
- (1)
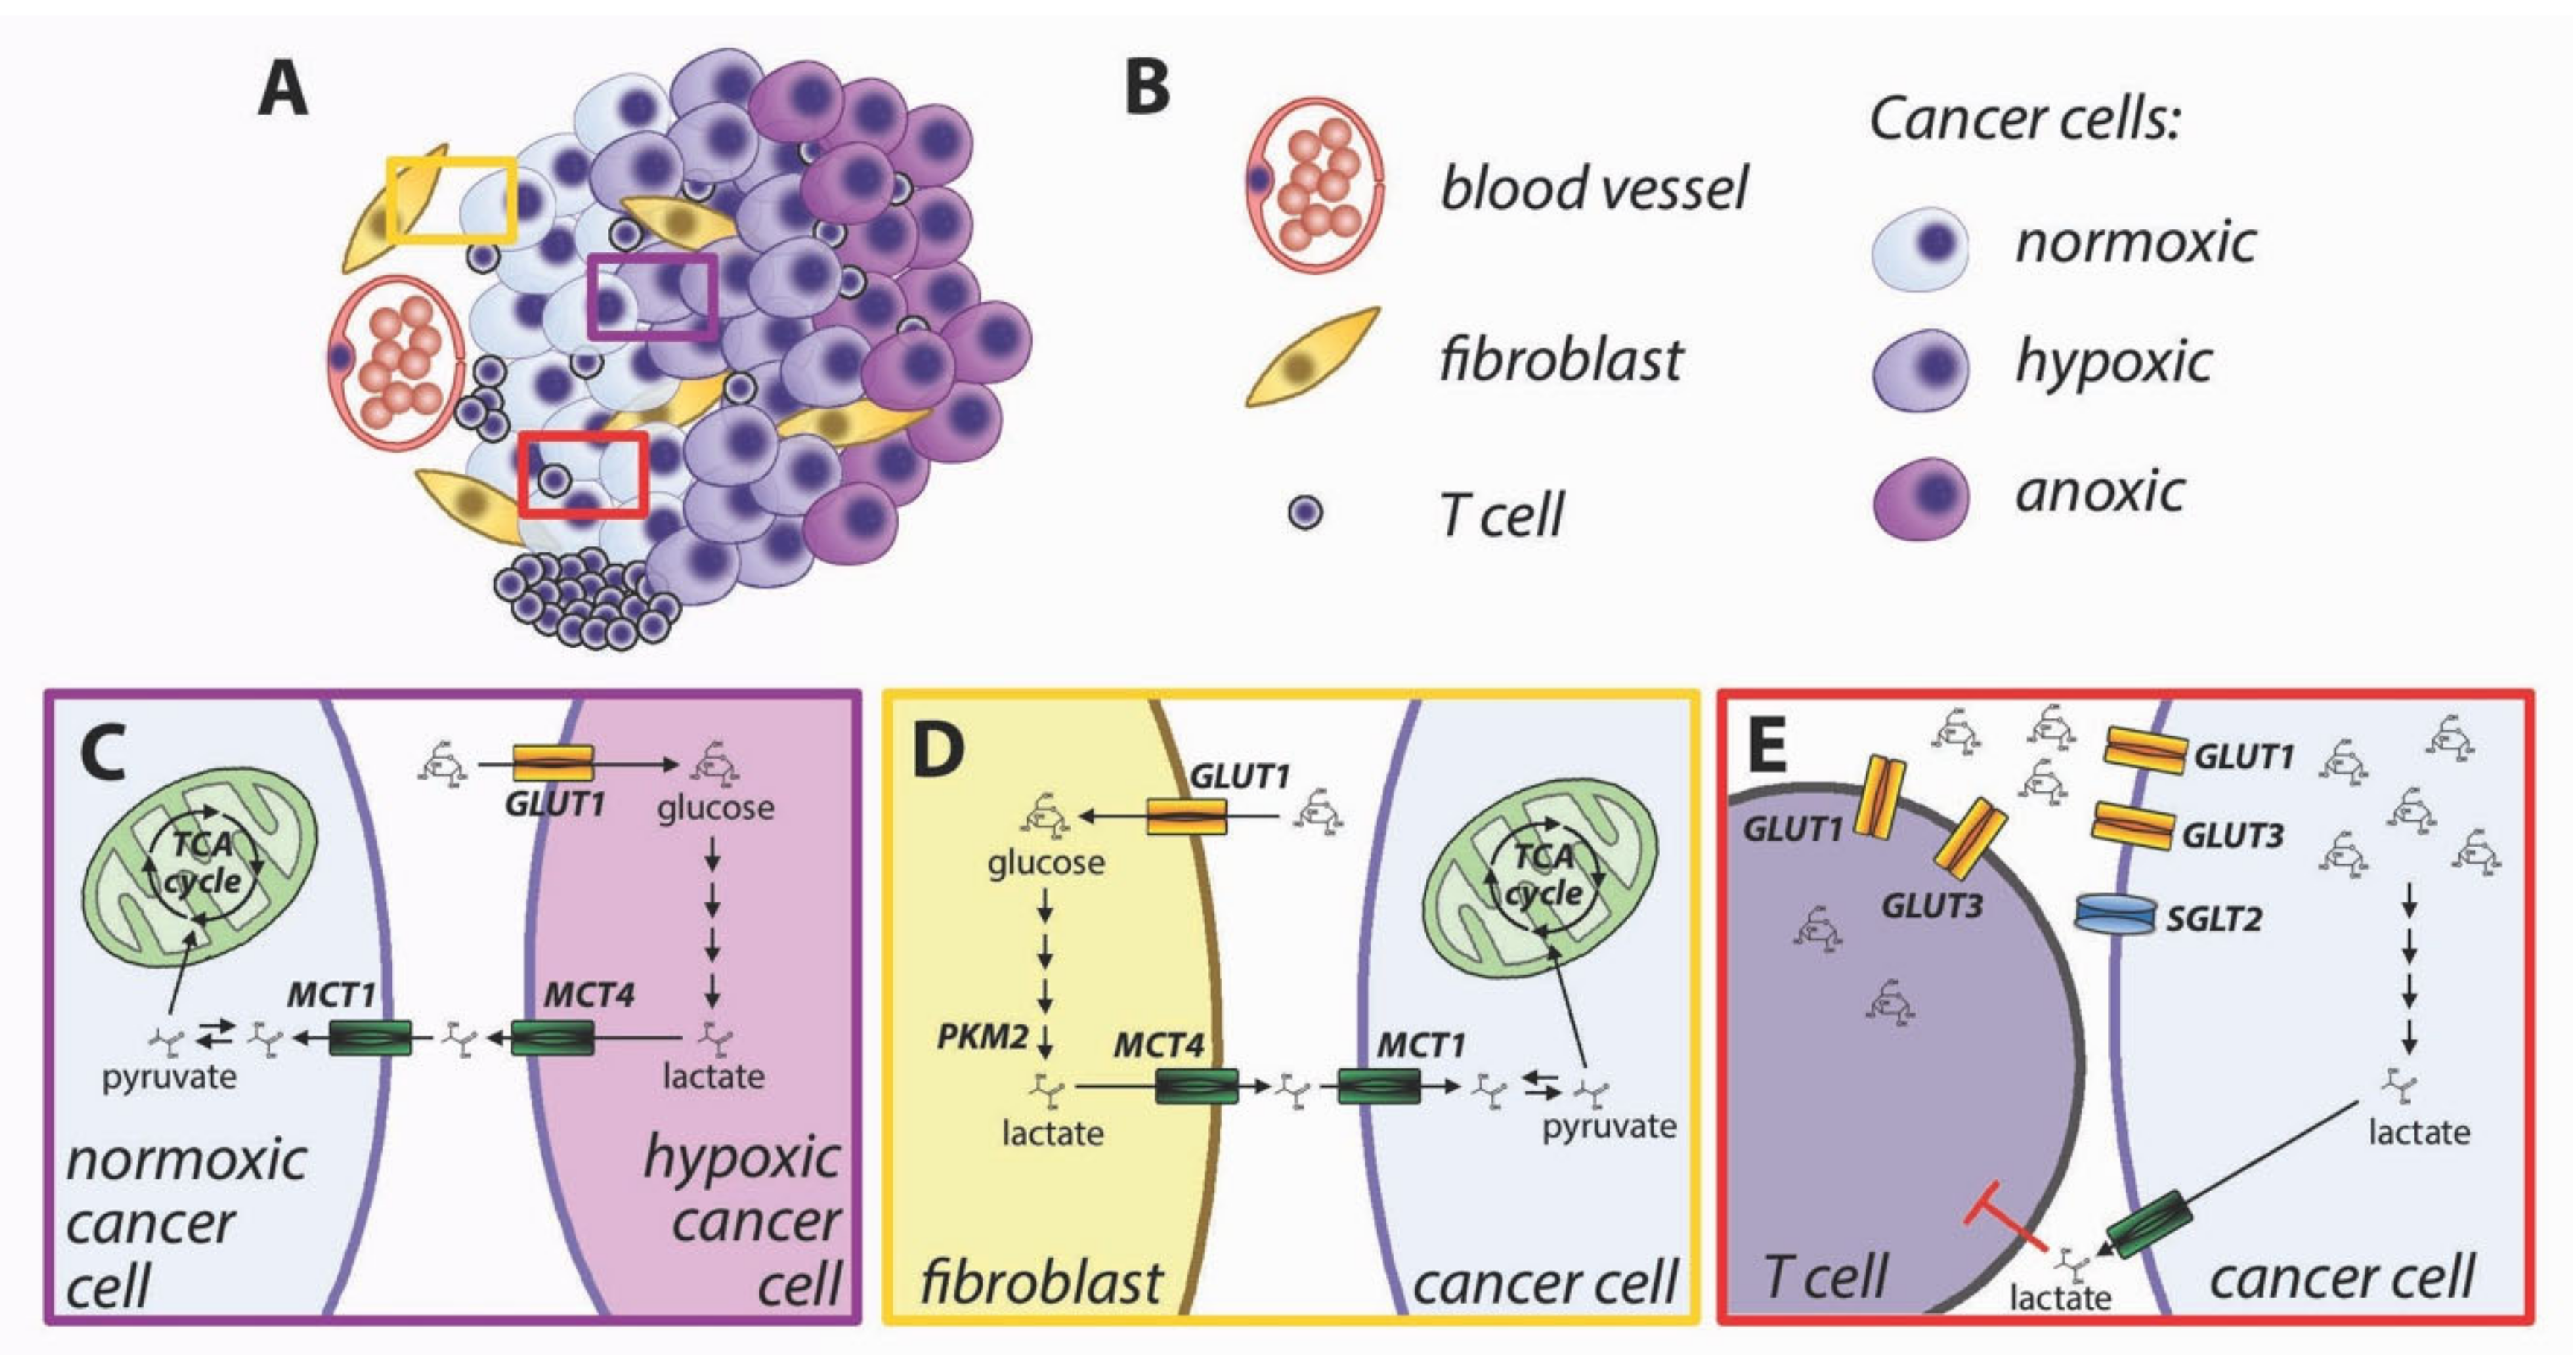
- Lactate-fueled respiration [71]. Metabolic tracing studies in humans have shown that tumors take up not only glucose but also lactate from the bloodstream, and the FDG-avid tumors are also responsible for higher lactate uptake [72]. This apparent paradox is consistent with lactate-fueled respiration, which is a consequence of the microenvironmental heterogeneity of most solid tumors. The neoplastic tissues are characterized by steep gradients of oxygen and nutrients (Figure 4A,B), and the metabolism of well-perfused cells is different from that of poorly perfused cells [73]. Hypoxia induces glucose uptake and increased glycolysis via activation of hypoxia-inducible factors (HIFs), which directly induce the transcription of glucose transporter GLUT1 and glycolytic enzymes [74]. Hypoxic cells engage in anaerobic glycolysis and export lactate via upregulation of monocarboxylate transporter MCT4 [75]. MCT4 is adapted to export lactate from cancer cells [76], and its lower affinity for pyruvate prevents an efflux of this metabolite [19], which would hinder the restoration of intracellular NAD+ in highly glycolytic cells. Lactate accumulates in the tumor microenvironment and can be taken up by well-perfused cancer cells via MCT1 [71]. Lactate can be oxidized to pyruvate with the concurrent reduction of NAD+ to NADH. Both pyruvate and NADH can feed the mitochondrial TCA cycle and oxidative phosphorylation (Figure 4C). Cytoplasmic NADH can be transported to the mitochondrial matrix via the malate-aspartate shuttle.
- (2)
- Reverse Warburg effect [77]. Similar to the lactate-fueled glycolysis described in the previous paragraph, the transfer of catabolites from stromal cells can allow tumor cells to replenish their ATP stores. Activated fibroblasts undergo metabolic reprogramming and perform aerobic glycolysis similarly to cancer cells [78]. Loss of caveolin-1 in breast cancer-associated fibroblasts causes oxidative stress leading to HIF-1 activation and induction of glycolysis [77,79]. Oxidative stress in cancer-associated fibroblasts can be caused by hydrogen peroxide produced by cancer cells [80]. Aerobic glycolysis can also be induced in cancer-associated fibroblasts by reduced isocitrate dehydrogenase activity, with a reduction of alpha-ketoglutarate and stabilization of HIF-1 [81]. Direct cell-to-cell contact induces GLUT1 and glycolytic activity in fibroblasts, along with overexpression of MCT4, responsible for cellular export of lactate [82]. The lactate exported by fibroblasts can be imported into cancer cells via MCT1 [82]. Pyruvate can be used by well perfused cancer cells to fuel mitochondrial TCA cycle (Figure 4D).
- (3)
- Immune metabolic competition. The immune responses against cancer cells are shaped by complex interactions between tumor cells, immune cells, and the microenvironment [70]. T cell activation is strictly dependent upon glucose availability [83]. Upon activation, T cells undergo a metabolic switch with increased rate of glucose uptake and utilization [84]. Glucose is imported in T lymphocytes though GLUT3 and GLUT1 transporters. The increased requirement for glucose during T cell activation is supported by upregulation and membrane translocation of GLUT1 [84,85]. Glucose availability is a limiting factor for T cell proliferation [15], cytokine production [83], and cytotoxic activity by CD8+ lymphocytes [86]. The tumor microenvironment is characterized by a lower glucose concentration than normal tissues [87], for insufficient vascularization and increased glucose utilization by cancer cells. Because both cancer cells and lymphocytes display increased reliance on glucose uptake, there is metabolic competition for limiting amounts of glucose in the tumor microenvironment [88,89]. In addition, increased glycolysis in cancer cells produces lactate and acidifies the tumor microenvironment, leading to further inhibition of T cell activation [90,91] (Figure 4E). Comparison of glucose uptake and gene expression patterns in human tumors has suggested that the tumor-specific immunity is hindered in highly glycolytic tumors [92,93]. Inhibition of metabolic reprogramming in cancer cells has been proposed to improve antitumor immunity [94].
4. Heterogeneity of Glucose Transporters in Lung Cancer
4.1. GLUTs and Cancer
4.2. SGLTs in Cancer
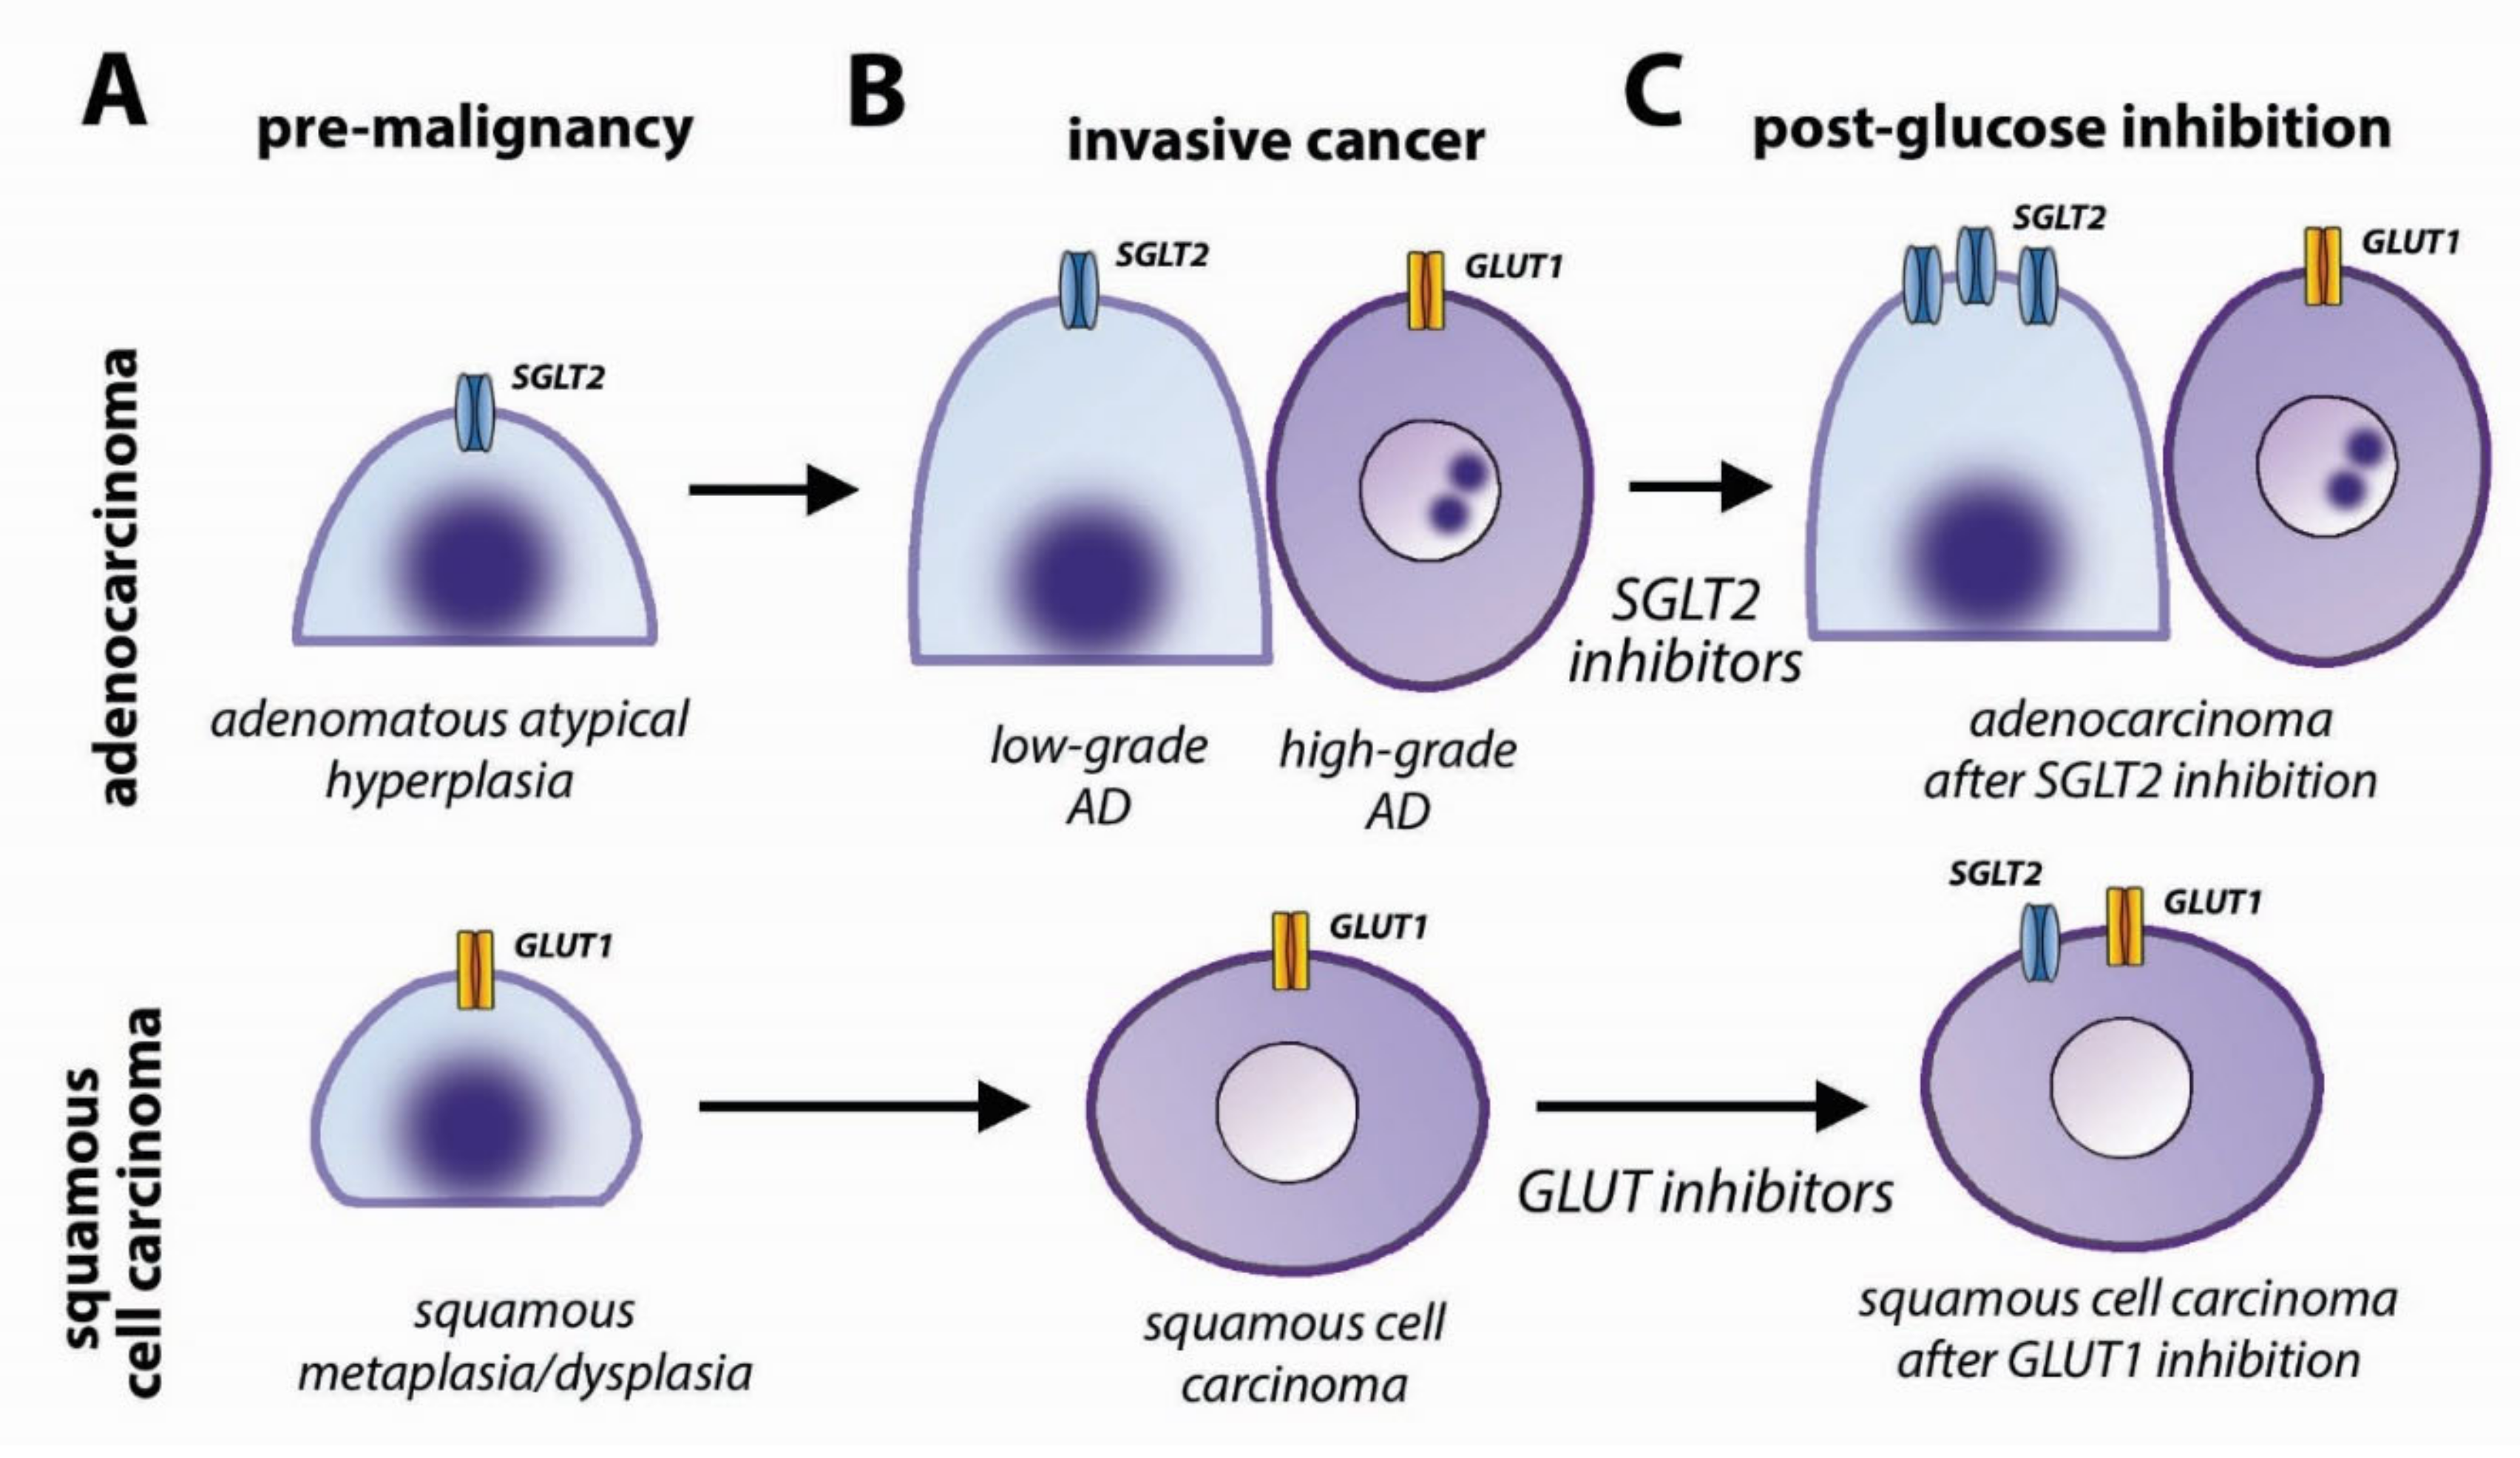
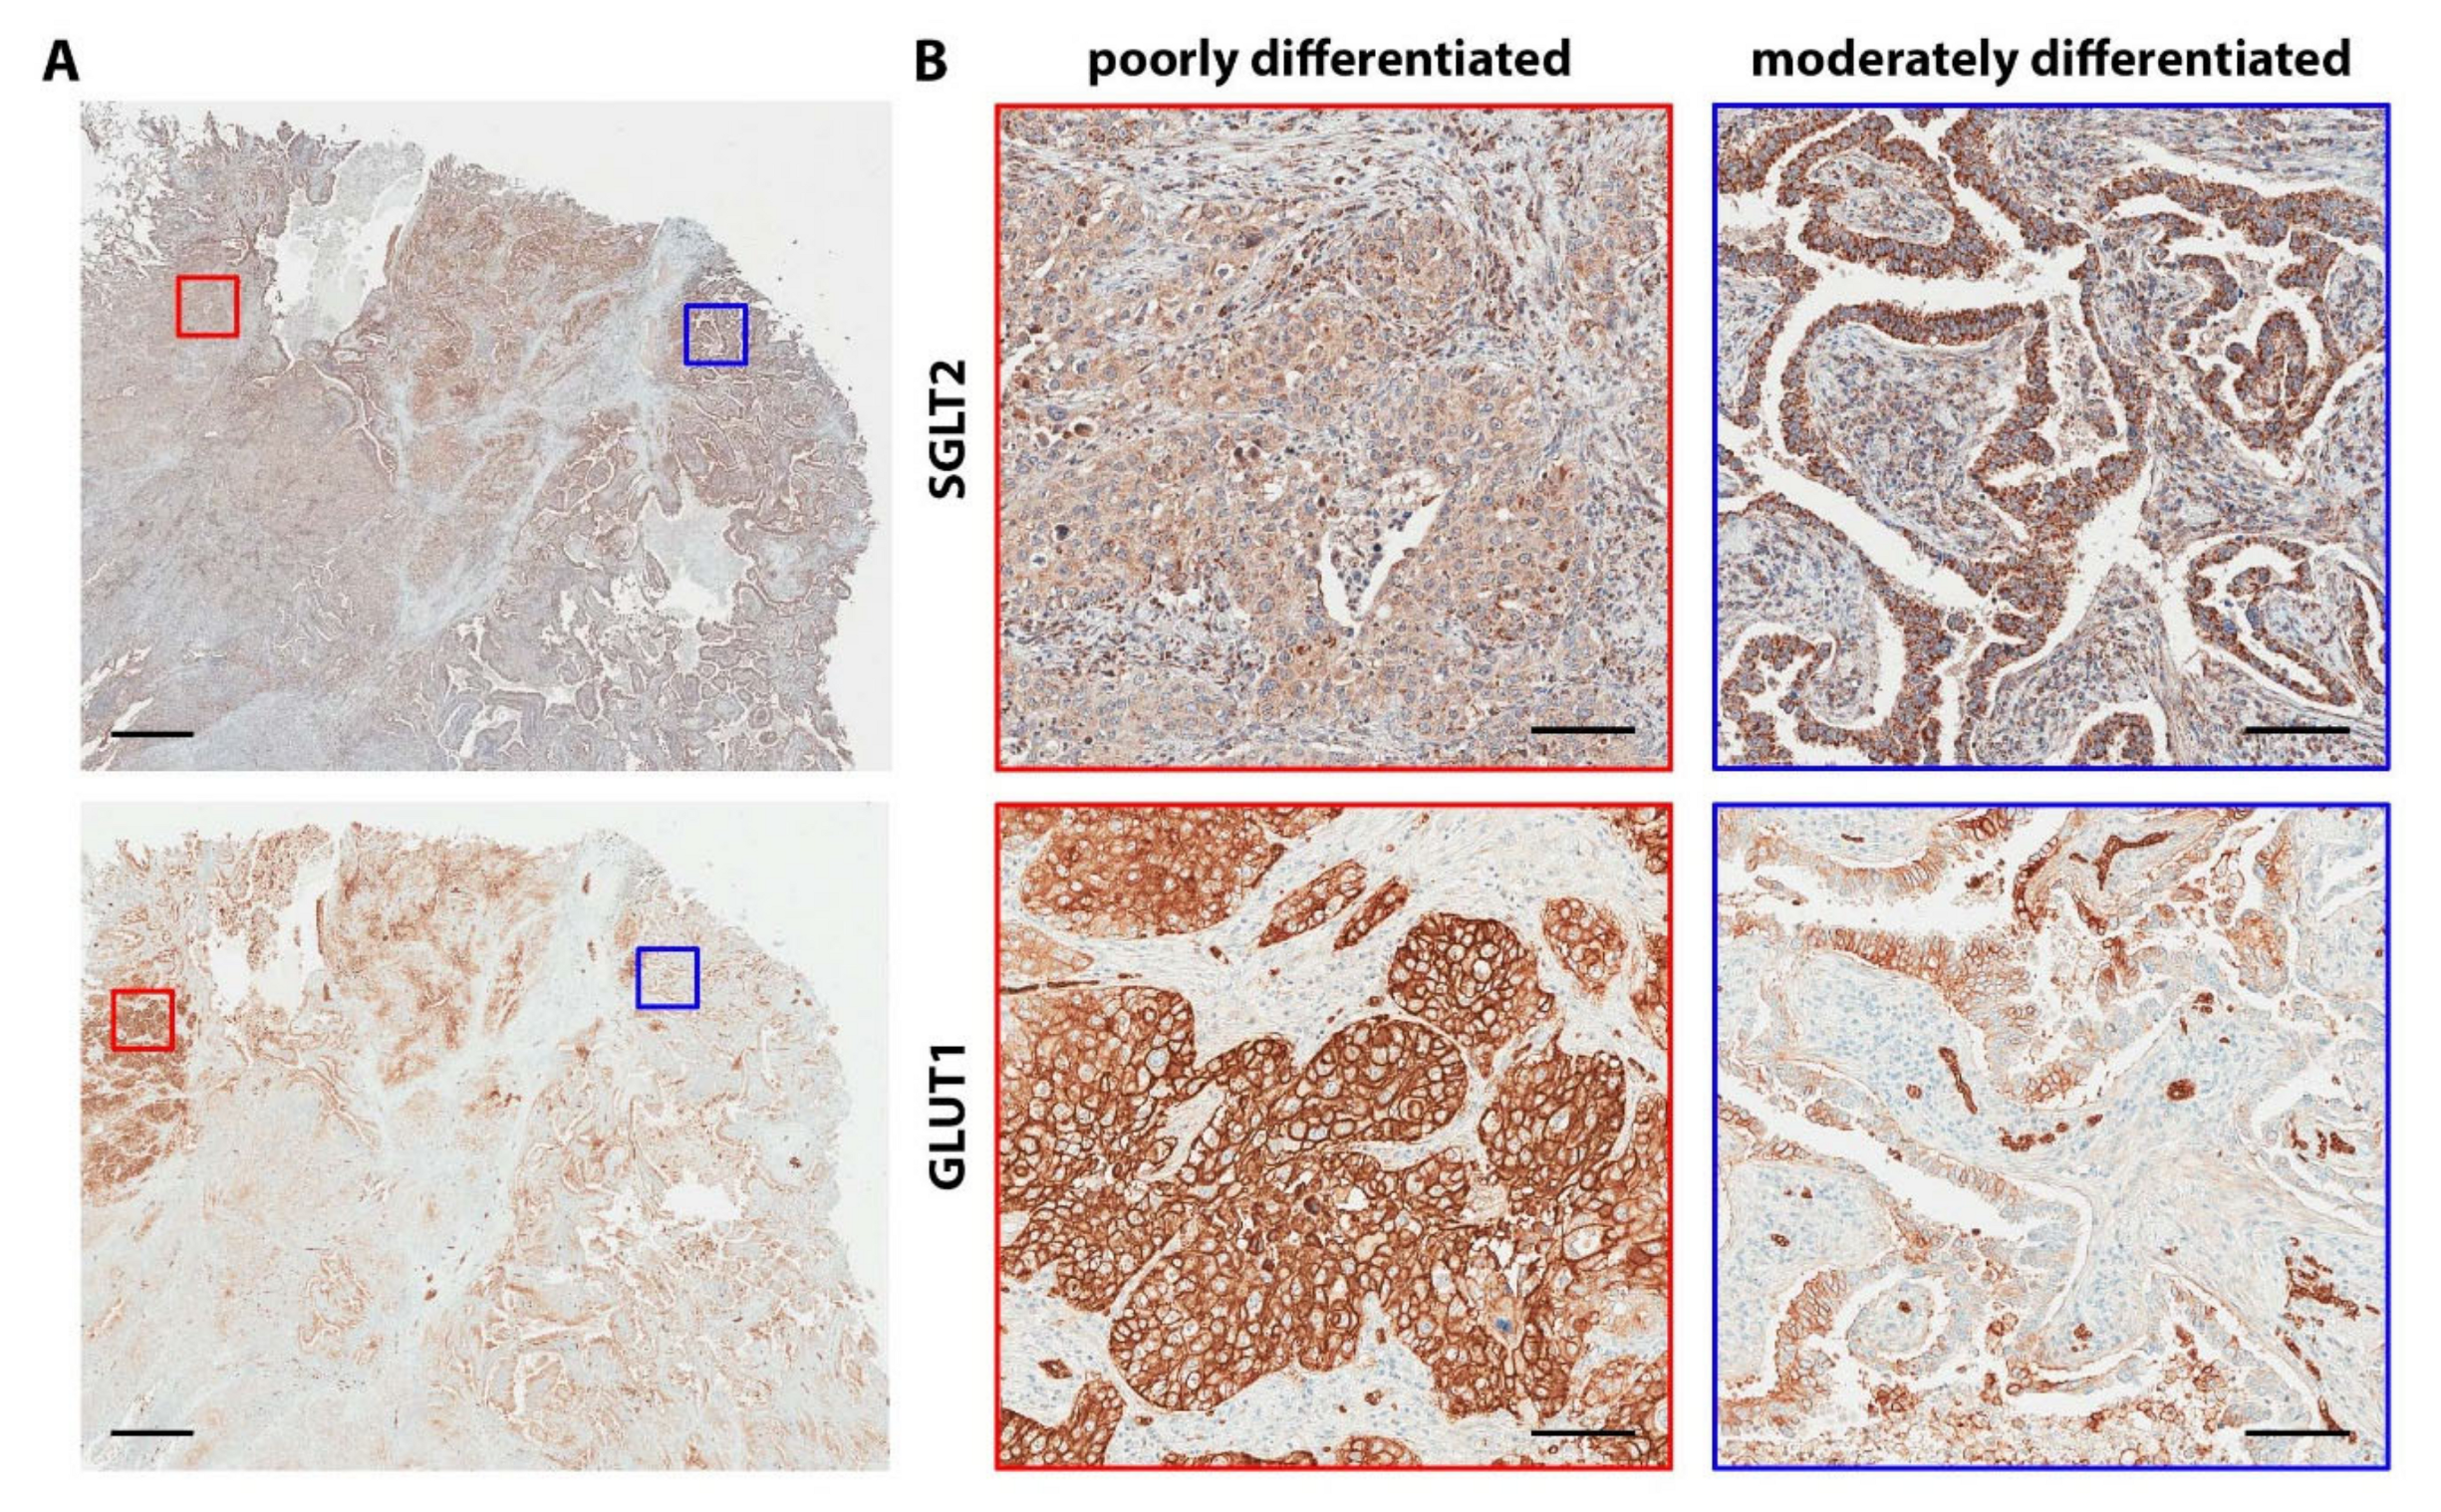
4.3. Glucose Transporters in Lung Cancer
4.4. Clinical Implications
5. Concluding Remarks
Funding
Conflicts of Interest
References
- Birsoy, K.; Possemato, R.; Lorbeer, F.K.; Bayraktar, E.C.; Thiru, P.; Yucel, B.; Wang, T.; Chen, W.W.; Clish, C.B.; Sabatini, D.M. Metabolic determinants of cancer cell sensitivity to glucose limitation and biguanides. Nature 2014, 508, 108–112. [Google Scholar] [CrossRef] [PubMed]
- Scafoglio, C.; Hirayama, B.A.; Kepe, V.; Liu, J.; Ghezzi, C.; Satyamurthy, N.; Moatamed, N.A.; Huang, J.; Koepsell, H.; Barrio, J.R.; et al. Functional expression of sodium-glucose transporters in cancer. Proc. Natl. Acad. Sci. USA 2015, 112, E4111–E4119. [Google Scholar] [CrossRef] [PubMed]
- Scafoglio, C.R.; Villegas, B.; Abdelhady, G.; Bailey, S.T.; Liu, J.; Shirali, A.S.; Wallace, W.D.; Magyar, C.E.; Grogan, T.R.; Elashoff, D.; et al. Sodium-glucose transporter 2 is a diagnostic and therapeutic target for early-stage lung adenocarcinoma. Sci. Transl. Med. 2018, 10, eaat5933. [Google Scholar] [CrossRef] [PubMed]
- Goodwin, J.; Neugent, M.L.; Lee, S.Y.; Choe, J.H.; Choi, H.; Jenkins, D.M.R.; Ruthenborg, R.J.; Robinson, M.W.; Jeong, J.Y.; Wake, M.; et al. The distinct metabolic phenotype of lung squamous cell carcinoma defines selective vulnerability to glycolytic inhibition. Nat. Commun. 2017, 8, 15503. [Google Scholar] [CrossRef]
- Hsieh, M.H.; Choe, J.H.; Gadhvi, J.; Kim, Y.J.; Arguez, M.A.; Palmer, M.; Gerold, H.; Nowak, C.; Do, H.; Mazambani, S.; et al. P63 and sox2 dictate glucose reliance and metabolic vulnerabilities in squamous cell carcinomas. Cell. Rep. 2019, 28, 1860–1878. [Google Scholar] [CrossRef]
- Warburg, O. On the origin of cancer cells. Science 1956, 123, 309–314. [Google Scholar] [CrossRef]
- Berg, J.M.; Tymoczko, J.L.; Stryer, L. The regulation of cellular respiration is governed primarily by the need for atp. In Biochemistry, 5th ed.; W H Freeman: New York, NY, USA, 2002. [Google Scholar]
- Fan, J.; Kamphorst, J.J.; Mathew, R.; Chung, M.K.; White, E.; Shlomi, T.; Rabinowitz, J.D. Glutamine-driven oxidative phosphorylation is a major atp source in transformed mammalian cells in both normoxia and hypoxia. Mol. Syst. Biol. 2013, 9, 712. [Google Scholar] [CrossRef]
- Weinberg, F.; Hamanaka, R.; Wheaton, W.W.; Weinberg, S.; Joseph, J.; Lopez, M.; Kalyanaraman, B.; Mutlu, G.M.; Budinger, G.R.; Chandel, N.S. Mitochondrial metabolism and ros generation are essential for kras-mediated tumorigenicity. Proc. Natl. Acad. Sci. USA 2010, 107, 8788–8793. [Google Scholar] [CrossRef]
- Sussman, I.; Erecinska, M.; Wilson, D.F. Regulation of cellular energy metabolism: The crabtree effect. Biochim. Biophys. Acta 1980, 591, 209–223. [Google Scholar] [CrossRef]
- Leese, H.J.; Barton, A.M. Pyruvate and glucose uptake by mouse ova and preimplantation embryos. J. Reprod. Fertil. 1984, 72, 9–13. [Google Scholar] [CrossRef]
- Bhattacharya, D.; Azambuja, A.P.; Simoes-Costa, M. Metabolic reprogramming promotes neural crest migration via yap/tead signaling. Dev. Cell 2020, 53, 199–211. [Google Scholar] [CrossRef] [PubMed]
- Folmes, C.D.; Nelson, T.J.; Martinez-Fernandez, A.; Arrell, D.K.; Lindor, J.Z.; Dzeja, P.P.; Ikeda, Y.; Perez-Terzic, C.; Terzic, A. Somatic oxidative bioenergetics transitions into pluripotency-dependent glycolysis to facilitate nuclear reprogramming. Cell Metab. 2011, 14, 264–271. [Google Scholar] [CrossRef]
- Hedeskov, C.J. Early effects of phytohaemagglutinin on glucose metabolism of normal human lymphocytes. Biochem. J. 1968, 110, 373–380. [Google Scholar] [CrossRef]
- Jacobs, S.R.; Herman, C.E.; Maciver, N.J.; Wofford, J.A.; Wieman, H.L.; Hammen, J.J.; Rathmell, J.C. Glucose uptake is limiting in t cell activation and requires cd28-mediated akt-dependent and independent pathways. J. Immunol. 2008, 180, 4476–4486. [Google Scholar] [CrossRef] [PubMed]
- Pfeiffer, T.; Schuster, S.; Bonhoeffer, S. Cooperation and competition in the evolution of atp-producing pathways. Science 2001, 292, 504–507. [Google Scholar] [CrossRef] [PubMed]
- Felmlee, M.A.; Jones, R.S.; Rodriguez-Cruz, V.; Follman, K.E.; Morris, M.E. Monocarboxylate transporters (slc16): Function, regulation, and role in health and disease. Pharmacol. Rev. 2020, 72, 466–485. [Google Scholar] [CrossRef] [PubMed]
- Doherty, J.R.; Yang, C.; Scott, K.E.; Cameron, M.D.; Fallahi, M.; Li, W.; Hall, M.A.; Amelio, A.L.; Mishra, J.K.; Li, F.; et al. Blocking lactate export by inhibiting the myc target mct1 disables glycolysis and glutathione synthesis. Cancer Res. 2014, 74, 908–920. [Google Scholar] [CrossRef]
- Hong, C.S.; Graham, N.A.; Gu, W.; Espindola Camacho, C.; Mah, V.; Maresh, E.L.; Alavi, M.; Bagryanova, L.; Krotee, P.A.L.; Gardner, B.K.; et al. Mct1 modulates cancer cell pyruvate export and growth of tumors that co-express mct1 and mct4. Cell Rep. 2016, 14, 1590–1601. [Google Scholar] [CrossRef]
- Benjamin, D.; Robay, D.; Hindupur, S.K.; Pohlmann, J.; Colombi, M.; El-Shemerly, M.Y.; Maira, S.M.; Moroni, C.; Lane, H.A.; Hall, M.N. Dual inhibition of the lactate transporters mct1 and mct4 is synthetic lethal with metformin due to nad+ depletion in cancer cells. Cell Rep. 2018, 25, 3047–3058. [Google Scholar] [CrossRef]
- Goetze, K.; Walenta, S.; Ksiazkiewicz, M.; Kunz-Schughart, L.A.; Mueller-Klieser, W. Lactate enhances motility of tumor cells and inhibits monocyte migration and cytokine release. Int. J. Oncol. 2011, 39, 453–463. [Google Scholar] [CrossRef]
- Sonveaux, P.; Copetti, T.; De Saedeleer, C.J.; Vegran, F.; Verrax, J.; Kennedy, K.M.; Moon, E.J.; Dhup, S.; Danhier, P.; Frerart, F.; et al. Targeting the lactate transporter mct1 in endothelial cells inhibits lactate-induced hif-1 activation and tumor angiogenesis. PLoS ONE 2012, 7, e33418. [Google Scholar] [CrossRef] [PubMed]
- Ahmed, K.; Tunaru, S.; Tang, C.; Muller, M.; Gille, A.; Sassmann, A.; Hanson, J.; Offermanns, S. An autocrine lactate loop mediates insulin-dependent inhibition of lipolysis through gpr81. Cell Metab. 2010, 11, 311–319. [Google Scholar] [CrossRef] [PubMed]
- Roland, C.L.; Arumugam, T.; Deng, D.; Liu, S.H.; Philip, B.; Gomez, S.; Burns, W.R.; Ramachandran, V.; Wang, H.; Cruz-Monserrate, Z.; et al. Cell surface lactate receptor gpr81 is crucial for cancer cell survival. Cancer Res. 2014, 74, 5301–5310. [Google Scholar] [CrossRef]
- Lee, Y.J.; Shin, K.J.; Park, S.A.; Park, K.S.; Park, S.; Heo, K.; Seo, Y.K.; Noh, D.Y.; Ryu, S.H.; Suh, P.G. G-protein-coupled receptor 81 promotes a malignant phenotype in breast cancer through angiogenic factor secretion. Oncotarget 2016, 7, 70898–70911. [Google Scholar] [CrossRef] [PubMed]
- Berg, J.M.; Stryer, L. 20.3 the pentose phosphate pathway generates nadph and synthesizes five-carbon sugars. In Biochemistry; W H Freeman: New York, NY, USA, 2002. [Google Scholar]
- Patra, K.C.; Hay, N. The pentose phosphate pathway and cancer. Trends Biochem. Sci. 2014, 39, 347–354. [Google Scholar] [CrossRef] [PubMed]
- Berg, J.M.; Stryer, L. Section 24.2, amino acids are made from intermediates of the citric acid cycle and other major pathways. In Biochemistry, 5th ed.; W H Freeman: New York, NY, USA, 2002. [Google Scholar]
- Locasale, J.W.; Grassian, A.R.; Melman, T.; Lyssiotis, C.A.; Mattaini, K.R.; Bass, A.J.; Heffron, G.; Metallo, C.M.; Muranen, T.; Sharfi, H.; et al. Phosphoglycerate dehydrogenase diverts glycolytic flux and contributes to oncogenesis. Nat. Genet. 2011, 43, 869–874. [Google Scholar] [CrossRef]
- Fan, T.W.M.; Bruntz, R.C.; Yang, Y.; Song, H.; Chernyavskaya, Y.; Deng, P.; Zhang, Y.; Shah, P.P.; Beverly, L.J.; Qi, Z.; et al. De novo synthesis of serine and glycine fuels purine nucleotide biosynthesis in human lung cancer tissues. J. Biol. Chem. 2019, 294, 13464–13477. [Google Scholar] [CrossRef]
- Lu, S.C. Glutathione synthesis. Biochim. Biophys. Acta 2013, 1830, 3143–3153. [Google Scholar] [CrossRef]
- Chiaradonna, F.; Ricciardiello, F.; Palorini, R. The nutrient-sensing hexosamine biosynthetic pathway as the hub of cancer metabolic rewiring. Cells 2018, 7, 53. [Google Scholar] [CrossRef]
- Taparra, K.; Wang, H.; Malek, R.; Lafargue, A.; Barbhuiya, M.A.; Wang, X.; Simons, B.W.; Ballew, M.; Nugent, K.; Groves, J.; et al. O-glcnacylation is required for mutant kras-induced lung tumorigenesis. J. Clin. Investig. 2018, 128, 4924–4937. [Google Scholar] [CrossRef]
- Lucena, M.C.; Carvalho-Cruz, P.; Donadio, J.L.; Oliveira, I.A.; de Queiroz, R.M.; Marinho-Carvalho, M.M.; Sola-Penna, M.; de Paula, I.F.; Gondim, K.C.; McComb, M.E.; et al. Epithelial mesenchymal transition induces aberrant glycosylation through hexosamine biosynthetic pathway activation. J. Biol. Chem. 2016, 291, 12917–12929. [Google Scholar] [CrossRef] [PubMed]
- Shimizu, M.; Tanaka, N. Il-8-induced o-glcnac modification via glut3 and gfat regulates cancer stem cell-like properties in colon and lung cancer cells. Oncogene 2019, 38, 1520–1533. [Google Scholar] [CrossRef] [PubMed]
- Lopez-Sambrooks, C.; Shrimal, S.; Khodier, C.; Flaherty, D.P.; Rinis, N.; Charest, J.C.; Gao, N.; Zhao, P.; Wells, L.; Lewis, T.A.; et al. Oligosaccharyltransferase inhibition induces senescence in rtk-driven tumor cells. Nat. Chem. Biol. 2016, 12, 1023–1030. [Google Scholar] [CrossRef] [PubMed]
- Hatzivassiliou, G.; Zhao, F.; Bauer, D.E.; Andreadis, C.; Shaw, A.N.; Dhanak, D.; Hingorani, S.R.; Tuveson, D.A.; Thompson, C.B. Atp citrate lyase inhibition can suppress tumor cell growth. Cancer Cell 2005, 8, 311–321. [Google Scholar] [CrossRef] [PubMed]
- Liu, M.; Wang, Y.; Yang, C.; Ruan, Y.; Bai, C.; Chu, Q.; Cui, Y.; Chen, C.; Ying, G.; Li, B. Inhibiting both proline biosynthesis and lipogenesis synergistically suppresses tumor growth. J. Exp. Med. 2020, 217, e20191226. [Google Scholar] [CrossRef] [PubMed]
- Christofk, H.R.; Vander Heiden, M.G.; Harris, M.H.; Ramanathan, A.; Gerszten, R.E.; Wei, R.; Fleming, M.D.; Schreiber, S.L.; Cantley, L.C. The m2 splice isoform of pyruvate kinase is important for cancer metabolism and tumour growth. Nature 2008, 452, 230–233. [Google Scholar] [CrossRef]
- Anastasiou, D.; Yu, Y.; Israelsen, W.J.; Jiang, J.K.; Boxer, M.B.; Hong, B.S.; Tempel, W.; Dimov, S.; Shen, M.; Jha, A.; et al. Pyruvate kinase m2 activators promote tetramer formation and suppress tumorigenesis. Nat. Chem. Biol. 2012, 8, 839–847. [Google Scholar] [CrossRef]
- Hensley, C.T.; Faubert, B.; Yuan, Q.; Lev-Cohain, N.; Jin, E.; Kim, J.; Jiang, L.; Ko, B.; Skelton, R.; Loudat, L.; et al. Metabolic heterogeneity in human lung tumors. Cell 2016, 164, 681–694. [Google Scholar] [CrossRef]
- Torgovnick, A.; Schumacher, B. DNA repair mechanisms in cancer development and therapy. Front. Genet. 2015, 6, 157. [Google Scholar] [CrossRef]
- Turajlic, S.; Sottoriva, A.; Graham, T.; Swanton, C. Resolving genetic heterogeneity in cancer. Nat. Rev. Genet. 2019, 20, 404–416. [Google Scholar] [CrossRef]
- de Bruin, E.C.; McGranahan, N.; Mitter, R.; Salm, M.; Wedge, D.C.; Yates, L.; Jamal-Hanjani, M.; Shafi, S.; Murugaesu, N.; Rowan, A.J.; et al. Spatial and temporal diversity in genomic instability processes defines lung cancer evolution. Science 2014, 346, 251–256. [Google Scholar] [CrossRef] [PubMed]
- Zhang, J.; Fujimoto, J.; Zhang, J.; Wedge, D.C.; Song, X.; Zhang, J.; Seth, S.; Chow, C.W.; Cao, Y.; Gumbs, C.; et al. Intratumor heterogeneity in localized lung adenocarcinomas delineated by multiregion sequencing. Science 2014, 346, 256–259. [Google Scholar] [CrossRef]
- Laughney, A.M.; Hu, J.; Campbell, N.R.; Bakhoum, S.F.; Setty, M.; Lavallee, V.P.; Xie, Y.; Masilionis, I.; Carr, A.J.; Kottapalli, S.; et al. Regenerative lineages and immune-mediated pruning in lung cancer metastasis. Nat. Med. 2020, 26, 259–269. [Google Scholar] [CrossRef]
- Tang, E.R.; Schreiner, A.M.; Pua, B.B. Advances in lung adenocarcinoma classification: A summary of the new international multidisciplinary classification system (iaslc/ats/ers). J. Thorac. Dis. 2014, 6, S489–S501. [Google Scholar] [PubMed]
- Van Schil, P.E.; Sihoe, A.D.; Travis, W.D. Pathologic classification of adenocarcinoma of lung. J. Surg. Oncol. 2013, 108, 320–326. [Google Scholar] [CrossRef] [PubMed]
- Yanagawa, N.; Shiono, S.; Abiko, M.; Ogata, S.Y.; Sato, T.; Tamura, G. New iaslc/ats/ers classification and invasive tumor size are predictive of disease recurrence in stage i lung adenocarcinoma. J. Thorac. Oncol. 2013, 8, 612–618. [Google Scholar] [CrossRef]
- Jain, R.K.; Au, P.; Tam, J.; Duda, D.G.; Fukumura, D. Engineering vascularized tissue. Nat. Biotechnol. 2005, 23, 821–823. [Google Scholar] [CrossRef]
- Vakkila, J.; Lotze, M.T. Inflammation and necrosis promote tumour growth. Nat. Rev. Immunol. 2004, 4, 641–648. [Google Scholar] [CrossRef]
- Hanahan, D.; Folkman, J. Patterns and emerging mechanisms of the angiogenic switch during tumorigenesis. Cell 1996, 86, 353–364. [Google Scholar] [CrossRef]
- Baluk, P.; Morikawa, S.; Haskell, A.; Mancuso, M.; McDonald, D.M. Abnormalities of basement membrane on blood vessels and endothelial sprouts in tumors. Am. J. Pathol. 2003, 163, 1801–1815. [Google Scholar] [CrossRef]
- Stacker, S.A.; Williams, S.P.; Karnezis, T.; Shayan, R.; Fox, S.B.; Achen, M.G. Lymphangiogenesis and lymphatic vessel remodelling in cancer. Nat. Rev. Cancer 2014, 14, 159–172. [Google Scholar] [CrossRef]
- Dewhirst, M.W.; Cao, Y.; Moeller, B. Cycling hypoxia and free radicals regulate angiogenesis and radiotherapy response. Nat. Rev. Cancer 2008, 8, 425–437. [Google Scholar] [CrossRef] [PubMed]
- Dvorak, H.F. Tumors: Wounds that do not heal. Similarities between tumor stroma generation and wound healing. N. Engl. J. Med. 1986, 315, 1650–1659. [Google Scholar] [PubMed]
- Guido, C.; Whitaker-Menezes, D.; Capparelli, C.; Balliet, R.; Lin, Z.; Pestell, R.G.; Howell, A.; Aquila, S.; Ando, S.; Martinez-Outschoorn, U.; et al. Metabolic reprogramming of cancer-associated fibroblasts by tgf-beta drives tumor growth: Connecting tgf-beta signaling with “warburg-like” cancer metabolism and l-lactate production. Cell Cycle 2012, 11, 3019–3035. [Google Scholar] [CrossRef]
- Cadamuro, M.; Nardo, G.; Indraccolo, S.; Dall’olmo, L.; Sambado, L.; Moserle, L.; Franceschet, I.; Colledan, M.; Massani, M.; Stecca, T.; et al. Platelet-derived growth factor-d and rho gtpases regulate recruitment of cancer-associated fibroblasts in cholangiocarcinoma. Hepatology 2013, 58, 1042–1053. [Google Scholar] [CrossRef]
- Schauer, I.G.; Zhang, J.; Xing, Z.; Guo, X.; Mercado-Uribe, I.; Sood, A.K.; Huang, P.; Liu, J. Interleukin-1beta promotes ovarian tumorigenesis through a p53/nf-kappab-mediated inflammatory response in stromal fibroblasts. Neoplasia 2013, 15, 409–420. [Google Scholar] [CrossRef]
- Giannoni, E.; Bianchini, F.; Masieri, L.; Serni, S.; Torre, E.; Calorini, L.; Chiarugi, P. Reciprocal activation of prostate cancer cells and cancer-associated fibroblasts stimulates epithelial-mesenchymal transition and cancer stemness. Cancer Res. 2010, 70, 6945–6956. [Google Scholar] [CrossRef]
- Gaggioli, C.; Hooper, S.; Hidalgo-Carcedo, C.; Grosse, R.; Marshall, J.F.; Harrington, K.; Sahai, E. Fibroblast-led collective invasion of carcinoma cells with differing roles for rhogtpases in leading and following cells. Nat. Cell. Biol. 2007, 9, 1392–1400. [Google Scholar] [CrossRef]
- Poggi, A.; Musso, A.; Dapino, I.; Zocchi, M.R. Mechanisms of tumor escape from immune system: Role of mesenchymal stromal cells. Immunol. Lett. 2014, 159, 55–72. [Google Scholar] [CrossRef] [PubMed]
- Kugeratski, F.G.; Atkinson, S.J.; Neilson, L.J.; Lilla, S.; Knight, J.R.P.; Serneels, J.; Juin, A.; Ismail, S.; Bryant, D.M.; Markert, E.K.; et al. Hypoxic cancer-associated fibroblasts increase ncbp2-as2/hiar to promote endothelial sprouting through enhanced vegf signaling. Sci. Signal 2019, 12, eaan8247. [Google Scholar] [CrossRef]
- Chen, W.J.; Ho, C.C.; Chang, Y.L.; Chen, H.Y.; Lin, C.A.; Ling, T.Y.; Yu, S.L.; Yuan, S.S.; Chen, Y.J.; Lin, C.Y.; et al. Cancer-associated fibroblasts regulate the plasticity of lung cancer stemness via paracrine signalling. Nat. Commun. 2014, 5, 3472. [Google Scholar] [CrossRef] [PubMed]
- Fridman, W.H.; Zitvogel, L.; Sautes-Fridman, C.; Kroemer, G. The immune contexture in cancer prognosis and treatment. Nat. Rev. Clin. Oncol. 2017, 14, 717–734. [Google Scholar] [CrossRef] [PubMed]
- Biswas, S.K.; Mantovani, A. Macrophage plasticity and interaction with lymphocyte subsets: Cancer as a paradigm. Nat. Immunol. 2010, 11, 889–896. [Google Scholar] [CrossRef]
- Schumacher, T.N.; Schreiber, R.D. Neoantigens in cancer immunotherapy. Science 2015, 348, 69–74. [Google Scholar] [CrossRef]
- Fridman, W.H.; Galon, J.; Pages, F.; Tartour, E.; Sautes-Fridman, C.; Kroemer, G. Prognostic and predictive impact of intra- and peritumoral immune infiltrates. Cancer Res. 2011, 71, 5601–5605. [Google Scholar] [CrossRef] [PubMed]
- Ahmad, M.; Rees, R.C.; Ali, S.A. Escape from immunotherapy: Possible mechanisms that influence tumor regression/progression. Cancer Immunol. Immunother. 2004, 53, 844–854. [Google Scholar] [CrossRef] [PubMed]
- Dunn, G.P.; Bruce, A.T.; Ikeda, H.; Old, L.J.; Schreiber, R.D. Cancer immunoediting: From immunosurveillance to tumor escape. Nat. Immunol. 2002, 3, 991–998. [Google Scholar] [CrossRef]
- Sonveaux, P.; Vegran, F.; Schroeder, T.; Wergin, M.C.; Verrax, J.; Rabbani, Z.N.; De Saedeleer, C.J.; Kennedy, K.M.; Diepart, C.; Jordan, B.F.; et al. Targeting lactate-fueled respiration selectively kills hypoxic tumor cells in mice. J. Clin. Investig. 2008, 118, 3930–3942. [Google Scholar] [CrossRef]
- Faubert, B.; Li, K.Y.; Cai, L.; Hensley, C.T.; Kim, J.; Zacharias, L.G.; Yang, C.; Do, Q.N.; Doucette, S.; Burguete, D.; et al. Lactate metabolism in human lung tumors. Cell 2017, 171, 358–371. [Google Scholar] [CrossRef]
- Carmona-Fontaine, C.; Deforet, M.; Akkari, L.; Thompson, C.B.; Joyce, J.A.; Xavier, J.B. Metabolic origins of spatial organization in the tumor microenvironment. Proc. Natl. Acad. Sci. USA 2017, 114, 2934–2939. [Google Scholar] [CrossRef]
- Chen, C.; Pore, N.; Behrooz, A.; Ismail-Beigi, F.; Maity, A. Regulation of glut1 mrna by hypoxia-inducible factor-1. Interaction between h-ras and hypoxia. J. Biol. Chem. 2001, 276, 9519–9525. [Google Scholar] [CrossRef] [PubMed]
- Ullah, M.S.; Davies, A.J.; Halestrap, A.P. The plasma membrane lactate transporter mct4, but not mct1, is up-regulated by hypoxia through a hif-1alpha-dependent mechanism. J. Biol. Chem. 2006, 281, 9030–9037. [Google Scholar] [CrossRef] [PubMed]
- Dimmer, K.S.; Friedrich, B.; Lang, F.; Deitmer, J.W.; Broer, S. The low-affinity monocarboxylate transporter mct4 is adapted to the export of lactate in highly glycolytic cells. Biochem. J. 2000, 350 Pt 1, 219–227. [Google Scholar] [CrossRef]
- Pavlides, S.; Whitaker-Menezes, D.; Castello-Cros, R.; Flomenberg, N.; Witkiewicz, A.K.; Frank, P.G.; Casimiro, M.C.; Wang, C.; Fortina, P.; Addya, S.; et al. The reverse warburg effect: Aerobic glycolysis in cancer associated fibroblasts and the tumor stroma. Cell Cycle 2009, 8, 3984–4001. [Google Scholar] [CrossRef] [PubMed]
- Bernard, K.; Logsdon, N.J.; Ravi, S.; Xie, N.; Persons, B.P.; Rangarajan, S.; Zmijewski, J.W.; Mitra, K.; Liu, G.; Darley-Usmar, V.M.; et al. Metabolic reprogramming is required for myofibroblast contractility and differentiation. J. Biol. Chem. 2015, 290, 25427–25438. [Google Scholar] [CrossRef]
- Pavlides, S.; Tsirigos, A.; Vera, I.; Flomenberg, N.; Frank, P.G.; Casimiro, M.C.; Wang, C.; Fortina, P.; Addya, S.; Pestell, R.G.; et al. Loss of stromal caveolin-1 leads to oxidative stress, mimics hypoxia and drives inflammation in the tumor microenvironment, conferring the “reverse warburg effect”: A transcriptional informatics analysis with validation. Cell Cycle 2010, 9, 2201–2219. [Google Scholar] [CrossRef]
- Martinez-Outschoorn, U.E.; Lin, Z.; Trimmer, C.; Flomenberg, N.; Wang, C.; Pavlides, S.; Pestell, R.G.; Howell, A.; Sotgia, F.; Lisanti, M.P. Cancer cells metabolically “fertilize” the tumor microenvironment with hydrogen peroxide, driving the warburg effect: Implications for pet imaging of human tumors. Cell Cycle 2011, 10, 2504–2520. [Google Scholar] [CrossRef]
- Zhang, D.; Wang, Y.; Shi, Z.; Liu, J.; Sun, P.; Hou, X.; Zhang, J.; Zhao, S.; Zhou, B.P.; Mi, J. Metabolic reprogramming of cancer-associated fibroblasts by idh3alpha downregulation. Cell Rep. 2015, 10, 1335–1348. [Google Scholar] [CrossRef]
- Fiaschi, T.; Marini, A.; Giannoni, E.; Taddei, M.L.; Gandellini, P.; De Donatis, A.; Lanciotti, M.; Serni, S.; Cirri, P.; Chiarugi, P. Reciprocal metabolic reprogramming through lactate shuttle coordinately influences tumor-stroma interplay. Cancer Res. 2012, 72, 5130–5140. [Google Scholar] [CrossRef]
- Chang, C.H.; Curtis, J.D.; Maggi, L.B., Jr.; Faubert, B.; Villarino, A.V.; O’Sullivan, D.; Huang, S.C.; van der Windt, G.J.; Blagih, J.; Qiu, J.; et al. Posttranscriptional control of t cell effector function by aerobic glycolysis. Cell 2013, 153, 1239–1251. [Google Scholar] [CrossRef]
- Chakrabarti, R.; Jung, C.Y.; Lee, T.P.; Liu, H.; Mookerjee, B.K. Changes in glucose transport and transporter isoforms during the activation of human peripheral blood lymphocytes by phytohemagglutinin. J. Immunol. 1994, 152, 2660–2668. [Google Scholar] [PubMed]
- Macintyre, A.N.; Gerriets, V.A.; Nichols, A.G.; Michalek, R.D.; Rudolph, M.C.; Deoliveira, D.; Anderson, S.M.; Abel, E.D.; Chen, B.J.; Hale, L.P.; et al. The glucose transporter glut1 is selectively essential for cd4 t cell activation and effector function. Cell Metab. 2014, 20, 61–72. [Google Scholar] [CrossRef] [PubMed]
- Zhao, E.; Maj, T.; Kryczek, I.; Li, W.; Wu, K.; Zhao, L.; Wei, S.; Crespo, J.; Wan, S.; Vatan, L.; et al. Cancer mediates effector t cell dysfunction by targeting micrornas and ezh2 via glycolysis restriction. Nat. Immunol. 2016, 17, 95–103. [Google Scholar] [CrossRef] [PubMed]
- Hirayama, A.; Kami, K.; Sugimoto, M.; Sugawara, M.; Toki, N.; Onozuka, H.; Kinoshita, T.; Saito, N.; Ochiai, A.; Tomita, M.; et al. Quantitative metabolome profiling of colon and stomach cancer microenvironment by capillary electrophoresis time-of-flight mass spectrometry. Cancer Res. 2009, 69, 4918–4925. [Google Scholar] [CrossRef]
- Chang, C.H.; Qiu, J.; O’Sullivan, D.; Buck, M.D.; Noguchi, T.; Curtis, J.D.; Chen, Q.; Gindin, M.; Gubin, M.M.; van der Windt, G.J.; et al. Metabolic competition in the tumor microenvironment is a driver of cancer progression. Cell 2015, 162, 1229–1241. [Google Scholar] [CrossRef]
- Ho, P.C.; Bihuniak, J.D.; Macintyre, A.N.; Staron, M.; Liu, X.; Amezquita, R.; Tsui, Y.C.; Cui, G.; Micevic, G.; Perales, J.C.; et al. Phosphoenolpyruvate is a metabolic checkpoint of anti-tumor t cell responses. Cell 2015, 162, 1217–1228. [Google Scholar] [CrossRef]
- Calcinotto, A.; Filipazzi, P.; Grioni, M.; Iero, M.; De Milito, A.; Ricupito, A.; Cova, A.; Canese, R.; Jachetti, E.; Rossetti, M.; et al. Modulation of microenvironment acidity reverses anergy in human and murine tumor-infiltrating t lymphocytes. Cancer Res. 2012, 72, 2746–2756. [Google Scholar] [CrossRef]
- Fischer, K.; Hoffmann, P.; Voelkl, S.; Meidenbauer, N.; Ammer, J.; Edinger, M.; Gottfried, E.; Schwarz, S.; Rothe, G.; Hoves, S.; et al. Inhibitory effect of tumor cell-derived lactic acid on human t cells. Blood 2007, 109, 3812–3819. [Google Scholar] [CrossRef]
- Cascone, T.; McKenzie, J.A.; Mbofung, R.M.; Punt, S.; Wang, Z.; Xu, C.; Williams, L.J.; Wang, Z.; Bristow, C.A.; Carugo, A.; et al. Increased tumor glycolysis characterizes immune resistance to adoptive t cell therapy. Cell Metab. 2018, 27, 977–987. [Google Scholar] [CrossRef]
- Mitchell, K.G.; Amini, B.; Wang, Y.; Carter, B.W.; Godoy, M.C.B.; Parra, E.R.; Behrens, C.; Villalobos, P.; Reuben, A.; Lee, J.J.; et al. (18)f-fluorodeoxyglucose positron emission tomography correlates with tumor immunometabolic phenotypes in resected lung cancer. Cancer Immunol. Immunother. 2020. [Google Scholar] [CrossRef]
- Kouidhi, S.; Ben Ayed, F.; Benammar Elgaaied, A. Targeting tumor metabolism: A new challenge to improve immunotherapy. Front. Immunol. 2018, 9, 353. [Google Scholar] [CrossRef] [PubMed]
- Liu, D.; Chang, C.; Lu, N.; Wang, X.; Lu, Q.; Ren, X.; Ren, P.; Zhao, D.; Wang, L.; Zhu, Y.; et al. Comprehensive proteomics analysis reveals metabolic reprogramming of tumor-associated macrophages stimulated by the tumor microenvironment. J. Proteome Res. 2017, 16, 288–297. [Google Scholar] [CrossRef] [PubMed]
- Penny, H.L.; Sieow, J.L.; Adriani, G.; Yeap, W.H.; See Chi Ee, P.; San Luis, B.; Lee, B.; Lee, T.; Mak, S.Y.; Ho, Y.S.; et al. Warburg metabolism in tumor-conditioned macrophages promotes metastasis in human pancreatic ductal adenocarcinoma. Oncoimmunology 2016, 5, e1191731. [Google Scholar] [CrossRef] [PubMed]
- Colegio, O.R.; Chu, N.Q.; Szabo, A.L.; Chu, T.; Rhebergen, A.M.; Jairam, V.; Cyrus, N.; Brokowski, C.E.; Eisenbarth, S.C.; Phillips, G.M.; et al. Functional polarization of tumour-associated macrophages by tumour-derived lactic acid. Nature 2014, 513, 559–563. [Google Scholar] [CrossRef]
- Hui, S.; Ghergurovich, J.M.; Morscher, R.J.; Jang, C.; Teng, X.; Lu, W.; Esparza, L.A.; Reya, T.; Le, Z.; Yanxiang Guo, J.; et al. Glucose feeds the tca cycle via circulating lactate. Nature 2017, 551, 115–118. [Google Scholar] [CrossRef]
- Eden, E.; Edstrom, S.; Bennegard, K.; Schersten, T.; Lundholm, K. Glucose flux in relation to energy expenditure in malnourished patients with and without cancer during periods of fasting and feeding. Cancer Res. 1984, 44, 1718–1724. [Google Scholar]
- Waki, A.; Kato, H.; Yano, R.; Sadato, N.; Yokoyama, A.; Ishii, Y.; Yonekura, Y.; Fujibayashi, Y. The importance of glucose transport activity as the rate-limiting step of 2-deoxyglucose uptake in tumor cells in vitro. Nucl. Med. Biol. 1998, 25, 593–597. [Google Scholar] [CrossRef]
- Rivenzon-Segal, D.; Rushkin, E.; Polak-Charcon, S.; Degani, H. Glucose transporters and transport kinetics in retinoic acid-differentiated t47d human breast cancer cells. Am. J. Physiol. Endocrinol. Metab. 2000, 279, E508–E519. [Google Scholar] [CrossRef]
- Hatanaka, M. Transport of sugars in tumor cell membranes. Biochim. Biophys. Acta 1974, 355, 77–104. [Google Scholar] [CrossRef]
- Uldry, M.; Ibberson, M.; Hosokawa, M.; Thorens, B. Glut2 is a high affinity glucosamine transporter. FEBS Lett. 2002, 524, 199–203. [Google Scholar] [CrossRef]
- Kasahara, T.; Kasahara, M. Expression of the rat glut1 glucose transporter in the yeast saccharomyces cerevisiae. Biochem. J. 1996, 315 Pt 1, 177–182. [Google Scholar] [CrossRef][Green Version]
- Kasahara, M.; Hinkle, P.C. Reconstitution and purification of the d-glucose transporter from human erythrocytes. J. Biol. Chem. 1977, 252, 7384–7390. [Google Scholar] [PubMed]
- Pardridge, W.M.; Boado, R.J.; Farrell, C.R. Brain-type glucose transporter (glut-1) is selectively localized to the blood-brain barrier. Studies with quantitative western blotting and in situ hybridization. J. Biol. Chem. 1990, 265, 18035–18040. [Google Scholar] [PubMed]
- Bondy, C.A.; Lee, W.H.; Zhou, J. Ontogeny and cellular distribution of brain glucose transporter gene expression. Mol. Cell. Neurosci. 1992, 3, 305–314. [Google Scholar] [CrossRef]
- Pantaleon, M.; Harvey, M.B.; Pascoe, W.S.; James, D.E.; Kaye, P.L. Glucose transporter glut3: Ontogeny, targeting, and role in the mouse blastocyst. Proc. Natl. Acad. Sci. USA 1997, 94, 3795–3800. [Google Scholar] [CrossRef] [PubMed]
- Heilig, C.W.; Saunders, T.; Brosius, F.C.; Moley, K.; Heilig, K.; Baggs, R.; Guo, L.; Conner, D. Glucose transporter-1-deficient mice exhibit impaired development and deformities that are similar to diabetic embryopathy. Proc. Natl. Acad. Sci. USA 2003, 100, 15613–15618. [Google Scholar] [CrossRef]
- Wang, D.; Pascual, J.M.; Yang, H.; Engelstad, K.; Mao, X.; Cheng, J.; Yoo, J.; Noebels, J.L.; De Vivo, D.C. A mouse model for glut-1 haploinsufficiency. Hum. Mol. Genet. 2006, 15, 1169–1179. [Google Scholar] [CrossRef]
- Thorens, B.; Cheng, Z.Q.; Brown, D.; Lodish, H.F. Liver glucose transporter: A basolateral protein in hepatocytes and intestine and kidney cells. Am. J. Physiol. 1990, 259, C279–C285. [Google Scholar] [CrossRef]
- Dominguez, J.H.; Camp, K.; Maianu, L.; Garvey, W.T. Glucose transporters of rat proximal tubule: Differential expression and subcellular distribution. Am. J. Physiol. 1992, 262, F807–F812. [Google Scholar] [CrossRef]
- Fukumoto, H.; Seino, S.; Imura, H.; Seino, Y.; Eddy, R.L.; Fukushima, Y.; Byers, M.G.; Shows, T.B.; Bell, G.I. Sequence, tissue distribution, and chromosomal localization of mrna encoding a human glucose transporter-like protein. Proc. Natl. Acad. Sci. USA 1988, 85, 5434–5438. [Google Scholar] [CrossRef]
- Thorens, B.; Sarkar, H.K.; Kaback, H.R.; Lodish, H.F. Cloning and functional expression in bacteria of a novel glucose transporter present in liver, intestine, kidney, and beta-pancreatic islet cells. Cell 1988, 55, 281–290. [Google Scholar] [CrossRef]
- Guillam, M.T.; Hummler, E.; Schaerer, E.; Yeh, J.I.; Birnbaum, M.J.; Beermann, F.; Schmidt, A.; Deriaz, N.; Thorens, B. Early diabetes and abnormal postnatal pancreatic islet development in mice lacking glut-2. Nat. Genet. 1997, 17, 327–330. [Google Scholar] [CrossRef]
- Colville, C.A.; Seatter, M.J.; Jess, T.J.; Gould, G.W.; Thomas, H.M. Kinetic analysis of the liver-type (glut2) and brain-type (glut3) glucose transporters in xenopus oocytes: Substrate specificities and effects of transport inhibitors. Biochem. J. 1993, 290 Pt 3, 701–706. [Google Scholar] [CrossRef]
- Gould, G.W.; Thomas, H.M.; Jess, T.J.; Bell, G.I. Expression of human glucose transporters in xenopus oocytes: Kinetic characterization and substrate specificities of the erythrocyte, liver, and brain isoforms. Biochemistry 1991, 30, 5139–5145. [Google Scholar] [CrossRef] [PubMed]
- Kayano, T.; Fukumoto, H.; Eddy, R.L.; Fan, Y.S.; Byers, M.G.; Shows, T.B.; Bell, G.I. Evidence for a family of human glucose transporter-like proteins. Sequence and gene localization of a protein expressed in fetal skeletal muscle and other tissues. J. Biol. Chem. 1988, 263, 15245–15248. [Google Scholar]
- Schmidt, S.; Hommel, A.; Gawlik, V.; Augustin, R.; Junicke, N.; Florian, S.; Richter, M.; Walther, D.J.; Montag, D.; Joost, H.G.; et al. Essential role of glucose transporter glut3 for post-implantation embryonic development. J. Endocrinol. 2009, 200, 23–33. [Google Scholar] [CrossRef] [PubMed]
- Zhao, Y.; Fung, C.; Shin, D.; Shin, B.C.; Thamotharan, S.; Sankar, R.; Ehninger, D.; Silva, A.; Devaskar, S.U. Neuronal glucose transporter isoform 3 deficient mice demonstrate features of autism spectrum disorders. Mol. Psychiatr. 2010, 15, 286–299. [Google Scholar] [CrossRef] [PubMed]
- Nishimura, H.; Pallardo, F.V.; Seidner, G.A.; Vannucci, S.; Simpson, I.A.; Birnbaum, M.J. Kinetics of glut1 and glut4 glucose transporters expressed in xenopus oocytes. J. Biol. Chem. 1993, 268, 8514–8520. [Google Scholar]
- James, D.E.; Strube, M.; Mueckler, M. Molecular cloning and characterization of an insulin-regulatable glucose transporter. Nature 1989, 338, 83–87. [Google Scholar] [CrossRef]
- Katz, E.B.; Stenbit, A.E.; Hatton, K.; DePinho, R.; Charron, M.J. Cardiac and adipose tissue abnormalities but not diabetes in mice deficient in glut4. Nature 1995, 377, 151–155. [Google Scholar] [CrossRef]
- Stenbit, A.E.; Tsao, T.S.; Li, J.; Burcelin, R.; Geenen, D.L.; Factor, S.M.; Houseknecht, K.; Katz, E.B.; Charron, M.J. Glut4 heterozygous knockout mice develop muscle insulin resistance and diabetes. Nat. Med. 1997, 3, 1096–1101. [Google Scholar] [CrossRef] [PubMed]
- Wardzala, L.J.; Jeanrenaud, B. Potential mechanism of insulin action on glucose transport in the isolated rat diaphragm. Apparent translocation of intracellular transport units to the plasma membrane. J. Biol. Chem. 1981, 256, 7090–7093. [Google Scholar] [PubMed]
- Suzuki, K.; Kono, T. Evidence that insulin causes translocation of glucose transport activity to the plasma membrane from an intracellular storage site. Proc. Natl. Acad. Sci. USA 1980, 77, 2542–2545. [Google Scholar] [CrossRef] [PubMed]
- Wu, X.; Freeze, H.H. Glut14, a duplicon of glut3, is specifically expressed in testis as alternative splice forms. Genomics 2002, 80, 553–557. [Google Scholar] [CrossRef] [PubMed]
- Burant, C.F.; Takeda, J.; Brot-Laroche, E.; Bell, G.I.; Davidson, N.O. Fructose transporter in human spermatozoa and small intestine is glut5. J. Biol. Chem. 1992, 267, 14523–14526. [Google Scholar] [PubMed]
- Barone, S.; Fussell, S.L.; Singh, A.K.; Lucas, F.; Xu, J.; Kim, C.; Wu, X.; Yu, Y.; Amlal, H.; Seidler, U.; et al. Slc2a5 (glut5) is essential for the absorption of fructose in the intestine and generation of fructose-induced hypertension. J. Biol. Chem. 2009, 284, 5056–5066. [Google Scholar] [CrossRef]
- Li, Q.; Manolescu, A.; Ritzel, M.; Yao, S.; Slugoski, M.; Young, J.D.; Chen, X.Z.; Cheeseman, C.I. Cloning and functional characterization of the human glut7 isoform slc2a7 from the small intestine. Am. J. Physiol. Gastrointest. Liver Physiol. 2004, 287, G236–G242. [Google Scholar] [CrossRef]
- Manolescu, A.R.; Augustin, R.; Moley, K.; Cheeseman, C. A highly conserved hydrophobic motif in the exofacial vestibule of fructose transporting slc2a proteins acts as a critical determinant of their substrate selectivity. Mol. Membr. Biol. 2007, 24, 455–463. [Google Scholar] [CrossRef]
- Phay, J.E.; Hussain, H.B.; Moley, J.F. Cloning and expression analysis of a novel member of the facilitative glucose transporter family, slc2a9 (glut9). Genomics 2000, 66, 217–220. [Google Scholar] [CrossRef]
- Evans, S.A.; Doblado, M.; Chi, M.M.; Corbett, J.A.; Moley, K.H. Facilitative glucose transporter 9 expression affects glucose sensing in pancreatic beta-cells. Endocrinology 2009, 150, 5302–5310. [Google Scholar] [CrossRef]
- Preitner, F.; Bonny, O.; Laverriere, A.; Rotman, S.; Firsov, D.; Da Costa, A.; Metref, S.; Thorens, B. Glut9 is a major regulator of urate homeostasis and its genetic inactivation induces hyperuricosuria and urate nephropathy. Proc. Natl. Acad. Sci. USA 2009, 106, 15501–15506. [Google Scholar] [CrossRef] [PubMed]
- Scheepers, A.; Schmidt, S.; Manolescu, A.; Cheeseman, C.I.; Bell, A.; Zahn, C.; Joost, H.G.; Schurmann, A. Characterization of the human slc2a11 (glut11) gene: Alternative promoter usage, function, expression, and subcellular distribution of three isoforms, and lack of mouse orthologue. Mol. Membr. Biol. 2005, 22, 339–351. [Google Scholar] [CrossRef] [PubMed]
- Tseng, Y.C.; Lee, J.R.; Lee, S.J.; Hwang, P.P. Functional analysis of the glucose transporters-1a, [corrected] -6, and -13.1 expressed by zebrafish epithelial cells. Am. J. Physiol. Regul. Integr. Comp. Physiol. 2011, 300, R321–R329. [Google Scholar] [CrossRef] [PubMed]
- Doege, H.; Bocianski, A.; Joost, H.G.; Schurmann, A. Activity and genomic organization of human glucose transporter 9 (glut9), a novel member of the family of sugar-transport facilitators predominantly expressed in brain and leucocytes. Biochem. J. 2000, 350 Pt 3, 771–776. [Google Scholar] [CrossRef]
- Maedera, S.; Mizuno, T.; Ishiguro, H.; Ito, T.; Soga, T.; Kusuhara, H. Glut6 is a lysosomal transporter that is regulated by inflammatory stimuli and modulates glycolysis in macrophages. FEBS Lett. 2019, 593, 195–208. [Google Scholar] [CrossRef] [PubMed]
- Byrne, F.L.; Olzomer, E.M.; Brink, R.; Hoehn, K.L. Knockout of glucose transporter glut6 has minimal effects on whole body metabolic physiology in mice. Am. J. Physiol. Endocrinol. Metab. 2018, 315, E286–E293. [Google Scholar] [CrossRef] [PubMed]
- Ibberson, M.; Uldry, M.; Thorens, B. Glutx1, a novel mammalian glucose transporter expressed in the central nervous system and insulin-sensitive tissues. J. Biol. Chem. 2000, 275, 4607–4612. [Google Scholar] [CrossRef]
- Augustin, R.; Riley, J.; Moley, K.H. Glut8 contains a [de]xxxl[li] sorting motif and localizes to a late endosomal/lysosomal compartment. Traffic 2005, 6, 1196–1212. [Google Scholar] [CrossRef]
- Schmidt, S.; Gawlik, V.; Holter, S.M.; Augustin, R.; Scheepers, A.; Behrens, M.; Wurst, W.; Gailus-Durner, V.; Fuchs, H.; Hrabe de Angelis, M.; et al. Deletion of glucose transporter glut8 in mice increases locomotor activity. Behav. Genet. 2008, 38, 396–406. [Google Scholar] [CrossRef]
- Dawson, P.A.; Mychaleckyj, J.C.; Fossey, S.C.; Mihic, S.J.; Craddock, A.L.; Bowden, D.W. Sequence and functional analysis of glut10: A glucose transporter in the type 2 diabetes-linked region of chromosome 20q12-13.1. Mol. Genet. Metab. 2001, 74, 186–199. [Google Scholar] [CrossRef]
- Cheng, C.H.; Kikuchi, T.; Chen, Y.H.; Sabbagha, N.G.; Lee, Y.C.; Pan, H.J.; Chang, C.; Chen, Y.T. Mutations in the slc2a10 gene cause arterial abnormalities in mice. Cardiovasc. Res. 2009, 81, 381–388. [Google Scholar] [CrossRef]
- Rogers, S.; Chandler, J.D.; Clarke, A.L.; Petrou, S.; Best, J.D. Glucose transporter glut12-functional characterization in xenopus laevis oocytes. Biochem. Biophys. Res. Commun. 2003, 308, 422–426. [Google Scholar] [CrossRef]
- Rogers, S.; Macheda, M.L.; Docherty, S.E.; Carty, M.D.; Henderson, M.A.; Soeller, W.C.; Gibbs, E.M.; James, D.E.; Best, J.D. Identification of a novel glucose transporter-like protein-glut-12. Am. J. Physiol. Endocrinol. Metab. 2002, 282, E733–E738. [Google Scholar] [CrossRef] [PubMed]
- Jimenez-Amilburu, V.; Jong-Raadsen, S.; Bakkers, J.; Spaink, H.P.; Marin-Juez, R. Glut12 deficiency during early development results in heart failure and a diabetic phenotype in zebrafish. J. Endocrinol. 2015, 224, 1–15. [Google Scholar] [CrossRef] [PubMed]
- Uldry, M.; Ibberson, M.; Horisberger, J.D.; Chatton, J.Y.; Riederer, B.M.; Thorens, B. Identification of a mammalian h(+)-myo-inositol symporter expressed predominantly in the brain. EMBO J. 2001, 20, 4467–4477. [Google Scholar] [CrossRef]
- Turner, R.J.; Silverman, M. Sugar uptake into brush border vesicles from normal human kidney. Proc. Natl. Acad. Sci. USA 1977, 74, 2825–2829. [Google Scholar] [CrossRef] [PubMed]
- Turner, R.J.; Moran, A. Heterogeneity of sodium-dependent d-glucose transport sites along the proximal tubule: Evidence from vesicle studies. Am. J. Physiol. 1982, 242, F406–F414. [Google Scholar] [CrossRef] [PubMed]
- Vrhovac, I.; Balen Eror, D.; Klessen, D.; Burger, C.; Breljak, D.; Kraus, O.; Radovic, N.; Jadrijevic, S.; Aleksic, I.; Walles, T.; et al. Localizations of na(+)-d-glucose cotransporters sglt1 and sglt2 in human kidney and of sglt1 in human small intestine, liver, lung, and heart. Pflug. Arch. 2015, 467, 1881–1898. [Google Scholar] [CrossRef]
- Madunic, I.V.; Breljak, D.; Karaica, D.; Koepsell, H.; Sabolic, I. Expression profiling and immunolocalization of na(+)-d-glucose-cotransporter 1 in mice employing knockout mice as specificity control indicate novel locations and differences between mice and rats. Pflug. Arch. 2017, 469, 1545–1565. [Google Scholar] [CrossRef]
- Gorboulev, V.; Schurmann, A.; Vallon, V.; Kipp, H.; Jaschke, A.; Klessen, D.; Friedrich, A.; Scherneck, S.; Rieg, T.; Cunard, R.; et al. Na(+)-d-glucose cotransporter sglt1 is pivotal for intestinal glucose absorption and glucose-dependent incretin secretion. Diabetes 2012, 61, 187–196. [Google Scholar] [CrossRef]
- Hummel, C.S.; Lu, C.; Loo, D.D.; Hirayama, B.A.; Voss, A.A.; Wright, E.M. Glucose transport by human renal na+/d-glucose cotransporters sglt1 and sglt2. Am. J. Physiol. Cell. Physiol. 2011, 300, C14–C21. [Google Scholar] [CrossRef] [PubMed]
- Sabolic, I.; Vrhovac, I.; Eror, D.B.; Gerasimova, M.; Rose, M.; Breljak, D.; Ljubojevic, M.; Brzica, H.; Sebastiani, A.; Thal, S.C.; et al. Expression of na+-d-glucose cotransporter sglt2 in rodents is kidney-specific and exhibits sex and species differences. Am. J. Physiol. Cell. Physiol. 2012, 302, C1174–C1188. [Google Scholar] [CrossRef] [PubMed]
- Bonner, C.; Kerr-Conte, J.; Gmyr, V.; Queniat, G.; Moerman, E.; Thevenet, J.; Beaucamps, C.; Delalleau, N.; Popescu, I.; Malaisse, W.J.; et al. Inhibition of the glucose transporter sglt2 with dapagliflozin in pancreatic alpha cells triggers glucagon secretion. Nat. Med. 2015, 21, 512–517. [Google Scholar] [CrossRef] [PubMed]
- Vallon, V.; Platt, K.A.; Cunard, R.; Schroth, J.; Whaley, J.; Thomson, S.C.; Koepsell, H.; Rieg, T. Sglt2 mediates glucose reabsorption in the early proximal tubule. J. Am. Soc. Nephrol. 2011, 22, 104–112. [Google Scholar] [CrossRef] [PubMed]
- Diez-Sampedro, A.; Hirayama, B.A.; Osswald, C.; Gorboulev, V.; Baumgarten, K.; Volk, C.; Wright, E.M.; Koepsell, H. A glucose sensor hiding in a family of transporters. Proc. Natl. Acad. Sci. USA 2003, 100, 11753–11758. [Google Scholar] [CrossRef]
- Tazawa, S.; Yamato, T.; Fujikura, H.; Hiratochi, M.; Itoh, F.; Tomae, M.; Takemura, Y.; Maruyama, H.; Sugiyama, T.; Wakamatsu, A.; et al. Slc5a9/sglt4, a new na+-dependent glucose transporter, is an essential transporter for mannose, 1,5-anhydro-d-glucitol, and fructose. Life Sci. 2005, 76, 1039–1050. [Google Scholar] [CrossRef]
- Grempler, R.; Augustin, R.; Froehner, S.; Hildebrandt, T.; Simon, E.; Mark, M.; Eickelmann, P. Functional characterisation of human sglt-5 as a novel kidney-specific sodium-dependent sugar transporter. FEBS Lett. 2012, 586, 248–253. [Google Scholar] [CrossRef]
- Fukuzawa, T.; Fukazawa, M.; Ueda, O.; Shimada, H.; Kito, A.; Kakefuda, M.; Kawase, Y.; Wada, N.A.; Goto, C.; Fukushima, N.; et al. Sglt5 reabsorbs fructose in the kidney but its deficiency paradoxically exacerbates hepatic steatosis induced by fructose. PLoS ONE 2013, 8, e56681. [Google Scholar] [CrossRef]
- Augustin, R. The protein family of glucose transport facilitators: It’s not only about glucose after all. IUBMB Life 2010, 62, 315–333. [Google Scholar] [CrossRef]
- Mueckler, M. Facilitative glucose transporters. Eur. J. Biochem. 1994, 219, 713–725. [Google Scholar] [CrossRef]
- Barron, C.C.; Bilan, P.J.; Tsakiridis, T.; Tsiani, E. Facilitative glucose transporters: Implications for cancer detection, prognosis and treatment. Metabolism 2016, 65, 124–139. [Google Scholar] [CrossRef] [PubMed]
- Ganapathy, V.; Thangaraju, M.; Prasad, P.D. Nutrient transporters in cancer: Relevance to warburg hypothesis and beyond. Pharmacol. Ther. 2009, 121, 29–40. [Google Scholar] [CrossRef] [PubMed]
- Czernin, J.; Benz, M.R.; Allen-Auerbach, M.S. Pet/ct imaging: The incremental value of assessing the glucose metabolic phenotype and the structure of cancers in a single examination. Eur. J. Radiol. 2010, 73, 470–480. [Google Scholar] [CrossRef]
- Gallamini, A.; Zwarthoed, C.; Borra, A. Positron emission tomography (pet) in oncology. Cancers 2014, 6, 1821–1889. [Google Scholar] [CrossRef] [PubMed]
- Lin, M.; Shon, I.H.; Lin, P. Positron emission tomography: Current status and future challenges. Intern. Med. J. 2010, 40, 19–29. [Google Scholar] [CrossRef]
- Mueckler, M.; Caruso, C.; Baldwin, S.A.; Panico, M.; Blench, I.; Morris, H.R.; Allard, W.J.; Lienhard, G.E.; Lodish, H.F. Sequence and structure of a human glucose transporter. Science 1985, 229, 941–945. [Google Scholar] [CrossRef]
- Smith, T.A. Facilitative glucose transporter expression in human cancer tissue. Br. J. Biomed. Sci. 1999, 56, 285–292. [Google Scholar]
- Macheda, M.L.; Rogers, S.; Best, J.D. Molecular and cellular regulation of glucose transporter (glut) proteins in cancer. J. Cell. Physiol. 2005, 202, 654–662. [Google Scholar] [CrossRef]
- Flier, J.S.; Mueckler, M.M.; Usher, P.; Lodish, H.F. Elevated levels of glucose transport and transporter messenger rna are induced by ras or src oncogenes. Science 1987, 235, 1492–1495. [Google Scholar] [CrossRef]
- Sasaki, H.; Shitara, M.; Yokota, K.; Hikosaka, Y.; Moriyama, S.; Yano, M.; Fujii, Y. Overexpression of glut1 correlates with kras mutations in lung carcinomas. Mol. Med. Rep. 2012, 5, 599–602. [Google Scholar] [CrossRef]
- Osthus, R.C.; Shim, H.; Kim, S.; Li, Q.; Reddy, R.; Mukherjee, M.; Xu, Y.; Wonsey, D.; Lee, L.A.; Dang, C.V. Deregulation of glucose transporter 1 and glycolytic gene expression by c-myc. J. Biol. Chem. 2000, 275, 21797–21800. [Google Scholar] [CrossRef] [PubMed]
- Barthel, A.; Okino, S.T.; Liao, J.; Nakatani, K.; Li, J.; Whitlock, J.P., Jr.; Roth, R.A. Regulation of glut1 gene transcription by the serine/threonine kinase akt1. J. Biol. Chem. 1999, 274, 20281–20286. [Google Scholar] [CrossRef] [PubMed]
- Murakami, T.; Nishiyama, T.; Shirotani, T.; Shinohara, Y.; Kan, M.; Ishii, K.; Kanai, F.; Nakazuru, S.; Ebina, Y. Identification of two enhancer elements in the gene encoding the type 1 glucose transporter from the mouse which are responsive to serum, growth factor, and oncogenes. J. Biol. Chem. 1992, 267, 9300–9306. [Google Scholar] [PubMed]
- Schwartzenberg-Bar-Yoseph, F.; Armoni, M.; Karnieli, E. The tumor suppressor p53 down-regulates glucose transporters glut1 and glut4 gene expression. Cancer Res. 2004, 64, 2627–2633. [Google Scholar] [CrossRef] [PubMed]
- Zhang, C.; Liu, J.; Liang, Y.; Wu, R.; Zhao, Y.; Hong, X.; Lin, M.; Yu, H.; Liu, L.; Levine, A.J.; et al. Tumour-associated mutant p53 drives the warburg effect. Nat. Commun. 2013, 4, 2935. [Google Scholar] [CrossRef] [PubMed]
- Wu, N.; Zheng, B.; Shaywitz, A.; Dagon, Y.; Tower, C.; Bellinger, G.; Shen, C.H.; Wen, J.; Asara, J.; McGraw, T.E.; et al. Ampk-dependent degradation of txnip upon energy stress leads to enhanced glucose uptake via glut1. Mol. Cell. 2013, 49, 1167–1175. [Google Scholar] [CrossRef]
- Waldhart, A.N.; Dykstra, H.; Peck, A.S.; Boguslawski, E.A.; Madaj, Z.B.; Wen, J.; Veldkamp, K.; Hollowell, M.; Zheng, B.; Cantley, L.C.; et al. Phosphorylation of txnip by akt mediates acute influx of glucose in response to insulin. Cell Rep. 2017, 19, 2005–2013. [Google Scholar] [CrossRef]
- Bunn, H.F.; Poyton, R.O. Oxygen sensing and molecular adaptation to hypoxia. Physiological. Rev. 1996, 76, 839–885. [Google Scholar] [CrossRef]
- Zha, X.; Hu, Z.; Ji, S.; Jin, F.; Jiang, K.; Li, C.; Zhao, P.; Tu, Z.; Chen, X.; Di, L.; et al. Nfkappab up-regulation of glucose transporter 3 is essential for hyperactive mammalian target of rapamycin-induced aerobic glycolysis and tumor growth. Cancer Lett. 2015, 359, 97–106. [Google Scholar] [CrossRef]
- Makinoshima, H.; Takita, M.; Matsumoto, S.; Yagishita, A.; Owada, S.; Esumi, H.; Tsuchihara, K. Epidermal growth factor receptor (egfr) signaling regulates global metabolic pathways in egfr-mutated lung adenocarcinoma. J. Biol. Chem. 2014, 289, 20813–20823. [Google Scholar] [CrossRef]
- Crippa, S.; Ancey, P.B.; Vazquez, J.; Angelino, P.; Rougemont, A.L.; Guettier, C.; Zoete, V.; Delorenzi, M.; Michielin, O.; Meylan, E. Mutant ctnnb1 and histological heterogeneity define metabolic subtypes of hepatoblastoma. EMBO Mol. Med. 2017, 9, 1589–1604. [Google Scholar] [CrossRef] [PubMed]
- Masin, M.; Vazquez, J.; Rossi, S.; Groeneveld, S.; Samson, N.; Schwalie, P.C.; Deplancke, B.; Frawley, L.E.; Gouttenoire, J.; Moradpour, D.; et al. Glut3 is induced during epithelial-mesenchymal transition and promotes tumor cell proliferation in non-small cell lung cancer. Cancer Metab. 2014, 2, 11. [Google Scholar] [CrossRef]
- Zelzer, E.; Levy, Y.; Kahana, C.; Shilo, B.Z.; Rubinstein, M.; Cohen, B. Insulin induces transcription of target genes through the hypoxia-inducible factor hif-1alpha/arnt. EMBO J. 1998, 17, 5085–5094. [Google Scholar] [CrossRef] [PubMed]
- Kawauchi, K.; Araki, K.; Tobiume, K.; Tanaka, N. P53 regulates glucose metabolism through an ikk-nf-kappab pathway and inhibits cell transformation. Nat. Cell Biol. 2008, 10, 611–618. [Google Scholar] [CrossRef] [PubMed]
- Godoy, A.; Ulloa, V.; Rodriguez, F.; Reinicke, K.; Yanez, A.J.; Garcia Mde, L.; Medina, R.A.; Carrasco, M.; Barberis, S.; Castro, T.; et al. Differential subcellular distribution of glucose transporters glut1-6 and glut9 in human cancer: Ultrastructural localization of glut1 and glut5 in breast tumor tissues. J. Cell. Physiol. 2006, 207, 614–627. [Google Scholar] [CrossRef]
- Giatromanolaki, A.; Balaska, K.; Kalamida, D.; Kakouratos, C.; Sivridis, E.; Koukourakis, M.I. Thermogenic protein ucp1 and ucp3 expression in non-small cell lung cancer: Relation with glycolysis and anaerobic metabolism. Cancer Biol. Med. 2017, 14, 396–404. [Google Scholar]
- Hamann, I.; Krys, D.; Glubrecht, D.; Bouvet, V.; Marshall, A.; Vos, L.; Mackey, J.R.; Wuest, M.; Wuest, F. Expression and function of hexose transporters glut1, glut2, and glut5 in breast cancer-effects of hypoxia. FASEB J. 2018, 32, 5104–5118. [Google Scholar] [CrossRef]
- McBrayer, S.K.; Cheng, J.C.; Singhal, S.; Krett, N.L.; Rosen, S.T.; Shanmugam, M. Multiple myeloma exhibits novel dependence on glut4, glut8, and glut11: Implications for glucose transporter-directed therapy. Blood 2012, 119, 4686–4697. [Google Scholar] [CrossRef]
- Shibata, K.; Kajiyama, H.; Mizokami, Y.; Ino, K.; Nomura, S.; Mizutani, S.; Terauchi, M.; Kikkawa, F. Placental leucine aminopeptidase (p-lap) and glucose transporter 4 (glut4) expression in benign, borderline, and malignant ovarian epithelia. Gynecol. Oncol. 2005, 98, 11–18. [Google Scholar] [CrossRef]
- Mao, A.; Zhou, X.; Liu, Y.; Ding, J.; Miao, A.; Pan, G. Klf8 is associated with poor prognosis and regulates glycolysis by targeting glut4 in gastric cancer. J. Cell. Mol. Med. 2019, 23, 5087–5097. [Google Scholar] [CrossRef]
- Byrne, F.L.; Poon, I.K.; Modesitt, S.C.; Tomsig, J.L.; Chow, J.D.; Healy, M.E.; Baker, W.D.; Atkins, K.A.; Lancaster, J.M.; Marchion, D.C.; et al. Metabolic vulnerabilities in endometrial cancer. Cancer Res. 2014, 74, 5832–5845. [Google Scholar] [CrossRef] [PubMed]
- Goldman, N.A.; Katz, E.B.; Glenn, A.S.; Weldon, R.H.; Jones, J.G.; Lynch, U.; Fezzari, M.J.; Runowicz, C.D.; Goldberg, G.L.; Charron, M.J. Glut1 and glut8 in endometrium and endometrial adenocarcinoma. Mod. Pathol. 2006, 19, 1429–1436. [Google Scholar] [CrossRef] [PubMed]
- McMillan, E.A.; Ryu, M.J.; Diep, C.H.; Mendiratta, S.; Clemenceau, J.R.; Vaden, R.M.; Kim, J.H.; Motoyaji, T.; Covington, K.R.; Peyton, M.; et al. Chemistry-first approach for nomination of personalized treatment in lung cancer. Cell 2018, 173, 864–878.e29. [Google Scholar] [CrossRef] [PubMed]
- Wright, E.M.; Loo, D.D.; Hirayama, B.A. Biology of human sodium glucose transporters. Physiological. Rev. 2011, 91, 733–794. [Google Scholar] [CrossRef]
- Saponaro, C.; Gmyr, V.; Thevenet, J.; Moerman, E.; Delalleau, N.; Pasquetti, G.; Coddeville, A.; Quenon, A.; Daoudi, M.; Hubert, T.; et al. The glp1r agonist liraglutide reduces hyperglucagonemia induced by the sglt2 inhibitor dapagliflozin via somatostatin release. Cell Rep. 2019, 28, 1447–1454. [Google Scholar] [CrossRef]
- Casneuf, V.F.; Fonteyne, P.; Van Damme, N.; Demetter, P.; Pauwels, P.; de Hemptinne, B.; De Vos, M.; Van de Wiele, C.; Peeters, M. Expression of sglt1, bcl-2 and p53 in primary pancreatic cancer related to survival. Cancer Investig. 2008, 26, 852–859. [Google Scholar] [CrossRef]
- Lai, B.; Xiao, Y.; Pu, H.; Cao, Q.; Jing, H.; Liu, X. Overexpression of sglt1 is correlated with tumor development and poor prognosis of ovarian carcinoma. Arch. Gynecol. Obstet. 2012, 285, 1455–1461. [Google Scholar] [CrossRef]
- Guo, G.F.; Cai, Y.C.; Zhang, B.; Xu, R.H.; Qiu, H.J.; Xia, L.P.; Jiang, W.Q.; Hu, P.L.; Chen, X.X.; Zhou, F.F.; et al. Overexpression of sglt1 and egfr in colorectal cancer showing a correlation with the prognosis. Med. Oncol. 2011, 28 (Suppl. 1), S197–S203. [Google Scholar] [CrossRef]
- Hanabata, Y.; Nakajima, Y.; Morita, K.; Kayamori, K.; Omura, K. Coexpression of sglt1 and egfr is associated with tumor differentiation in oral squamous cell carcinoma. Odontology 2012, 100, 156–163. [Google Scholar] [CrossRef]
- Weihua, Z.; Tsan, R.; Huang, W.C.; Wu, Q.; Chiu, C.H.; Fidler, I.J.; Hung, M.C. Survival of cancer cells is maintained by egfr independent of its kinase activity. Cancer Cell. 2008, 13, 385–393. [Google Scholar] [CrossRef]
- Ishikawa, N.; Oguri, T.; Isobe, T.; Fujitaka, K.; Kohno, N. Sglt gene expression in primary lung cancers and their metastatic lesions. Jpn. J. Cancer Res. 2001, 92, 874–879. [Google Scholar] [CrossRef] [PubMed]
- Kepe, V.; Scafoglio, C.; Liu, J.; Yong, W.H.; Bergsneider, M.; Huang, S.C.; Barrio, J.R.; Wright, E.M. Positron emission tomography of sodium glucose cotransport activity in high grade astrocytomas. J. Neurooncol. 2018, 138, 557–569. [Google Scholar] [CrossRef] [PubMed]
- Travis, W.D.; Brambilla, E.; Nicholson, A.G.; Yatabe, Y.; Austin, J.H.; Beasley, M.B.; Chirieac, L.R.; Dacic, S.; Duhig, E.; Flieder, D.B.; et al. The 2015 world health organization classification of lung tumors: Impact of genetic, clinical and radiologic advances since the 2004 classification. J. Thorac. Oncol. 2015, 10, 1243–1260. [Google Scholar] [CrossRef]
- Chen, Z.; Fillmore, C.M.; Hammerman, P.S.; Kim, C.F.; Wong, K.K. Non-small-cell lung cancers: A heterogeneous set of diseases. Nat. Rev. Cancer 2014, 14, 535–546. [Google Scholar] [CrossRef]
- Rodriguez-Canales, J.; Parra-Cuentas, E.; Wistuba, I.I. Diagnosis and molecular classification of lung cancer. Cancer Treat. Res. 2016, 170, 25–46. [Google Scholar] [PubMed]
- Ferone, G.; Song, J.Y.; Sutherland, K.D.; Bhaskaran, R.; Monkhorst, K.; Lambooij, J.P.; Proost, N.; Gargiulo, G.; Berns, A. Sox2 is the determining oncogenic switch in promoting lung squamous cell carcinoma from different cells of origin. Cancer Cell 2016, 30, 519–532. [Google Scholar] [CrossRef] [PubMed]
- Xu, X.; Rock, J.R.; Lu, Y.; Futtner, C.; Schwab, B.; Guinney, J.; Hogan, B.L.; Onaitis, M.W. Evidence for type ii cells as cells of origin of k-ras-induced distal lung adenocarcinoma. Proc. Natl. Acad. Sci. USA 2012, 109, 4910–4915. [Google Scholar] [CrossRef] [PubMed]
- Noh, M.S.; Jun, B.H.; Kim, S.; Kang, H.; Woo, M.A.; Minai-Tehrani, A.; Kim, J.E.; Kim, J.; Park, J.; Lim, H.T.; et al. Magnetic surface-enhanced raman spectroscopic (m-sers) dots for the identification of bronchioalveolar stem cells in normal and lung cancer mice. Biomaterials 2009, 30, 3915–3925. [Google Scholar] [CrossRef]
- Ito, T.; Noguchi, Y.; Udaka, N.; Kitamura, H.; Satoh, S. Glucose transporter expression in developing fetal lungs and lung neoplasms. Histol. Histopathol. 1999, 14, 895–904. [Google Scholar]
- Ooi, A.T.; Gower, A.C.; Zhang, K.X.; Vick, J.L.; Hong, L.; Nagao, B.; Wallace, W.D.; Elashoff, D.A.; Walser, T.C.; Dubinett, S.M.; et al. Molecular profiling of premalignant lesions in lung squamous cell carcinomas identifies mechanisms involved in stepwise carcinogenesis. Cancer Prev. Res. 2014, 7, 487–495. [Google Scholar] [CrossRef]
- Meijer, T.W.H.; Looijen-Salamon, M.G.; Lok, J.; van den Heuvel, M.; Tops, B.; Kaanders, J.; Span, P.N.; Bussink, J. Glucose and glutamine metabolism in relation to mutational status in nsclc histological subtypes. Thorac. Cancer 2019, 10, 2289–2299. [Google Scholar] [CrossRef] [PubMed]
- Tan, Z.; Yang, C.; Zhang, X.; Zheng, P.; Shen, W. Expression of glucose transporter 1 and prognosis in non-small cell lung cancer: A pooled analysis of 1665 patients. Oncotarget 2017, 8, 60954–60961. [Google Scholar] [CrossRef] [PubMed]
- Schuurbiers, O.C.; Meijer, T.W.; Kaanders, J.H.; Looijen-Salamon, M.G.; de Geus-Oei, L.F.; van der Drift, M.A.; van der Heijden, E.H.; Oyen, W.J.; Visser, E.P.; Span, P.N.; et al. Glucose metabolism in nsclc is histology-specific and diverges the prognostic potential of 18fdg-pet for adenocarcinoma and squamous cell carcinoma. J. Thorac. Oncol. 2014, 9, 1485–1493. [Google Scholar] [CrossRef] [PubMed]
- Meijer, T.W.; Schuurbiers, O.C.; Kaanders, J.H.; Looijen-Salamon, M.G.; de Geus-Oei, L.F.; Verhagen, A.F.; Lok, J.; van der Heijden, H.F.; Rademakers, S.E.; Span, P.N.; et al. Differences in metabolism between adeno-and squamous cell non-small cell lung carcinomas: Spatial distribution and prognostic value of glut1 and mct4. Lung Cancer 2012, 76, 316–323. [Google Scholar] [CrossRef]
- Younes, M.; Brown, R.W.; Stephenson, M.; Gondo, M.; Cagle, P.T. Overexpression of glut1 and glut3 in stage i nonsmall cell lung carcinoma is associated with poor survival. Cancer 1997, 80, 1046–1051. [Google Scholar] [CrossRef]
- Suzawa, N.; Ito, M.; Qiao, S.; Uchida, K.; Takao, M.; Yamada, T.; Takeda, K.; Murashima, S. Assessment of factors influencing fdg uptake in non-small cell lung cancer on pet/ct by investigating histological differences in expression of glucose transporters 1 and 3 and tumour size. Lung Cancer 2011, 72, 191–198. [Google Scholar] [CrossRef]
- de Geus-Oei, L.F.; van Krieken, J.H.; Aliredjo, R.P.; Krabbe, P.F.; Frielink, C.; Verhagen, A.F.; Boerman, O.C.; Oyen, W.J. Biological correlates of fdg uptake in non-small cell lung cancer. Lung Cancer 2007, 55, 79–87. [Google Scholar] [CrossRef]
- Zhang, B.; Xie, Z.; Li, B. The clinicopathologic impacts and prognostic significance of glut1 expression in patients with lung cancer: A meta-analysis. Gene 2019, 689, 76–83. [Google Scholar] [CrossRef]
- Koh, Y.W.; Lee, S.J.; Park, S.Y. Differential expression and prognostic significance of glut1 according to histologic type of non-small-cell lung cancer and its association with volume-dependent parameters. Lung Cancer 2017, 104, 31–37. [Google Scholar] [CrossRef]
- Maki, Y.; Soh, J.; Ichimura, K.; Shien, K.; Furukawa, M.; Muraoka, T.; Tanaka, N.; Ueno, T.; Yamamoto, H.; Asano, H.; et al. Impact of glut1 and ki-67 expression on earlystage lung adenocarcinoma diagnosed according to a new international multidisciplinary classification. Oncol. Rep. 2013, 29, 133–140. [Google Scholar] [CrossRef]
- Kaira, K.; Serizawa, M.; Koh, Y.; Takahashi, T.; Yamaguchi, A.; Hanaoka, H.; Oriuchi, N.; Endo, M.; Ohde, Y.; Nakajima, T.; et al. Biological significance of 18f-fdg uptake on pet in patients with non-small-cell lung cancer. Lung Cancer 2014, 83, 197–204. [Google Scholar] [CrossRef] [PubMed]
- Almuhaideb, A.; Papathanasiou, N.; Bomanji, J. 18f-fdg pet/ct imaging in oncology. Ann. Saudi Med. 2011, 31, 3–13. [Google Scholar] [CrossRef] [PubMed]
- Diez-Sampedro, A.; Wright, E.M.; Hirayama, B.A. Residue 457 controls sugar binding and transport in the na(+)/glucose cotransporter. J. Biol. Chem. 2001, 276, 49188–49194. [Google Scholar] [CrossRef] [PubMed]
- Wu, H.B.; Wang, L.; Wang, Q.S.; Han, Y.J.; Li, H.S.; Zhou, W.L.; Tian, Y. Adenocarcinoma with bac features presented as the nonsolid nodule is prone to be false-negative on 18f-fdg pet/ct. BioMed Res. Int. 2015, 2015, 243681. [Google Scholar]
- Ambrosini, V.; Nicolini, S.; Caroli, P.; Nanni, C.; Massaro, A.; Marzola, M.C.; Rubello, D.; Fanti, S. Pet/ct imaging in different types of lung cancer: An overview. Eur. J. Radiol. 2012, 81, 988–1001. [Google Scholar] [CrossRef]
- Yu, A.S.; Hirayama, B.A.; Timbol, G.; Liu, J.; Basarah, E.; Kepe, V.; Satyamurthy, N.; Huang, S.C.; Wright, E.M.; Barrio, J.R. Functional expression of sglts in rat brain. Am. J. Physiol. Cell Physiol. 2010, 299, C1277–C1284. [Google Scholar] [CrossRef]
- Sala-Rabanal, M.; Hirayama, B.A.; Ghezzi, C.; Liu, J.; Huang, S.C.; Kepe, V.; Koepsell, H.; Yu, A.; Powell, D.R.; Thorens, B.; et al. Revisiting the physiological roles of sglts and gluts using positron emission tomography in mice. J. Physiol. 2016, 594, 4425–4438. [Google Scholar] [CrossRef]
- Yakisich, J.S.; Azad, N.; Kaushik, V.; Iyer, A.K.V. The biguanides metformin and buformin in combination with 2-deoxy-glucose or wzb-117 inhibit the viability of highly resistant human lung cancer cells. Stem Cells Int. 2019, 2019, 6254269. [Google Scholar] [CrossRef]
- Commander, R.; Wei, C.; Sharma, A.; Mouw, J.K.; Burton, L.J.; Summerbell, E.; Mahboubi, D.; Peterson, R.J.; Konen, J.; Zhou, W.; et al. Subpopulation targeting of pyruvate dehydrogenase and glut1 decouples metabolic heterogeneity during collective cancer cell invasion. Nat. Commun. 2020, 11, 1533. [Google Scholar] [CrossRef]
- Garcia-Ropero, A.; Badimon, J.J.; Santos-Gallego, C.G. The pharmacokinetics and pharmacodynamics of sglt2 inhibitors for type 2 diabetes mellitus: The latest developments. Expert Opin. Drug Metab. Toxicol. 2018, 14, 1287–1302. [Google Scholar] [CrossRef]
- Ferrannini, E.; Solini, A. Sglt2 inhibition in diabetes mellitus: Rationale and clinical prospects. Nat. Rev. Endocrinol. 2012, 8, 495–502. [Google Scholar] [CrossRef] [PubMed]
- Liu, Y.; Cao, Y.; Zhang, W.; Bergmeier, S.; Qian, Y.; Akbar, H.; Colvin, R.; Ding, J.; Tong, L.; Wu, S.; et al. A small-molecule inhibitor of glucose transporter 1 downregulates glycolysis, induces cell-cycle arrest, and inhibits cancer cell growth in vitro and in vivo. Mol. Cancer Ther. 2012, 11, 1672–1682. [Google Scholar] [CrossRef] [PubMed]


| Transporter | Km for Glucose | Other Substrates | Expression in Normal Tissues | KO Phenotype | Notes |
|---|---|---|---|---|---|
| Class I GLUTs | |||||
| GLUT1 (SLC2A1) | 3 mM [103,104] | Galactose, mannose, glucosamine | Red blood cells [105]; Blood-brain barrier [106]; Glial cells [107]; Early embryonic development [108] | -/- embryonic lethal +/- seizures, developmental delay, microcephaly, ataxia [109,110] | |
| GLUT2 (SLC2A2) | 17 mM [103] | Glucosamine [103] | Small intestine (basolateral [111]), kidney tubules (basolateral [112]), liver [113]; Pancreatic beta-cells [114] | -/- type 2 diabetes mellitus, neonatal death [115] | |
| GLUT3 (SLC2A3) | 1.4 mM [116] | Xylose, mannose [117] | Neurons [107,118]; Early embryonic development [108] | -/- embryonic lethal [119]; +/- features of autism spectrum [120] | |
| GLUT4 (SLC2A4) | 4 mM [121] | Dehydroascorbic acid, glucosamine | Skeletal muscle, adipose tissue, heart [122] | -/- growth retardation, cardiomegaly [123]; +/- diabetes [124] | Insulin-dependent translocation [125,126] |
| GLUT14 (SLC2A14) | ? | ? | Testis [127] | ? | 95% homology with GLUT3 |
| Class II GLUTs | |||||
| GLUT5 (SLC2A5) | n/a | Fructose [128] | Small intestine, Kidney, testes [128] | -/- fructose malabsorption [129] | |
| GLUT7 (SLC2A7) | 0.3 mM [130] | Fructose [130] | Small intestine, colon [130] | ? | 68% homology with GLUT5 [130] |
| GLUT9 (SLC2A9) | 0.6 mM [131] | Fructose [131], uric acid [131] | Kidney tubule, liver [132]; Pancreatic beta cells [133] | -/- hyperuricemia, urate nephropathy [134] | |
| GLUT11 (SLC2A11) | 0.1 mM [131] | Fructose [131] | Heart, skeletal muscle, adipose tissue, kidney, pancreas [135] | ? | |
| Class III GLUTs | |||||
| GLUT6 (SLC2A6) | 17.5 mM (zebrafish) [136] | ? | Brain, spleen, leukocytes [137]; Intracellular (lysosomal) [138] | -/- minimal effects (reduced fat in female mice) [139] | Previously known as GLUT9 [137] |
| GLUT8 (SLC2A8) | 2 mM [140] | ? | Testis, brain; Intracellular [140]; lysosomal [141] | -/- hyperactivity [142] | Previously known as GLUTX1 |
| GLUT10 (SLC2A10) | 0.3 mM [143] | Galactose [143] | Heart, lung [143] | Mutants: thickened, irregular arteries [144] | |
| GLUT12 (SLC2A12) | ? | Galactose, fructose [145] | Heart, skeletal muscle, prostate, adipose tissue, small intestine [146] | Knock-down in zebrafish: impaired cardiac development, arrhythmias; hyperinsulinemia, insulin resistance [147] | Insulin-induced translocation [146] |
| GLUT13 (SLC2A13) | n/a | Myoinositol; Inositol-3-phosphate [148] | Brain [148] | ? | |
| SGLTs | |||||
| SGLT1 (SLC5A1) | 0.3 mM [149,150] | Galactose, α-methyl-deoxyglucose | Small intestine (apical), kidney proximal tubule, heart, liver, lung, pancreatic ducts, prostate, salivary glands [151,152] | -/- glucose-galactose malabsorption [153] | |
| SGLT2 (SLC5A2) | 6 mM [149,150,154] | α-Methyl-deoxyglucose [154] | Kidney proximal tubule (apical) [151,155], pancreatic ducts [2], pancreatic alpha cells [156] | -/- glycosyuria [157] | |
| SGLT3 (SLC5A4) | 60 mM [158] | α-Methyl-deoxyglucose [158] | Small intestine, skeletal muscle [158] | ? | For the low affinity, it acts as a glucose sensor, not transporter, at physiological sugar concentration and pH |
| SGLT4 (SLC5A9) | 1.6 mM [159] | Mannose [159] | Small intestine, kidney, liver [159] | ? | |
| SGLT5 (SLC5A10) | 10 mM [160] | Mannose > fructose > glucose > galactose [160] | Kidney [160] | -/- fructosuria, hepatic steatosis [161] | |
© 2020 by the authors. Licensee MDPI, Basel, Switzerland. This article is an open access article distributed under the terms and conditions of the Creative Commons Attribution (CC BY) license (http://creativecommons.org/licenses/by/4.0/).
Share and Cite
Martinez, C.A.; Scafoglio, C. Heterogeneity of Glucose Transport in Lung Cancer. Biomolecules 2020, 10, 868. https://doi.org/10.3390/biom10060868
Martinez CA, Scafoglio C. Heterogeneity of Glucose Transport in Lung Cancer. Biomolecules. 2020; 10(6):868. https://doi.org/10.3390/biom10060868
Chicago/Turabian StyleMartinez, Cesar A., and Claudio Scafoglio. 2020. "Heterogeneity of Glucose Transport in Lung Cancer" Biomolecules 10, no. 6: 868. https://doi.org/10.3390/biom10060868
APA StyleMartinez, C. A., & Scafoglio, C. (2020). Heterogeneity of Glucose Transport in Lung Cancer. Biomolecules, 10(6), 868. https://doi.org/10.3390/biom10060868