TLC-Based Bioassay to Isolate Kairomones from Tea Tree Essential Oil That Attract Male Mediterranean Fruit Flies, Ceratitis capitata (Wiedemann) †


Abstract
1. Introduction
2. Materials and Methods
2.1. Test Substrates, Chemicals, and Reagents
2.2. Laboratory Bioassays
2.2.1. Source of Flies
2.2.2. Short-Range Bioassays
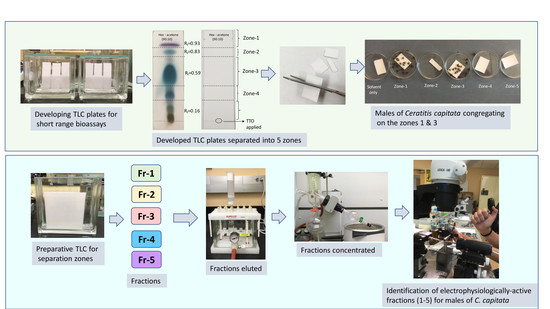
2.2.3. Thin Layer Chromatography and TLC-Based Bioassay
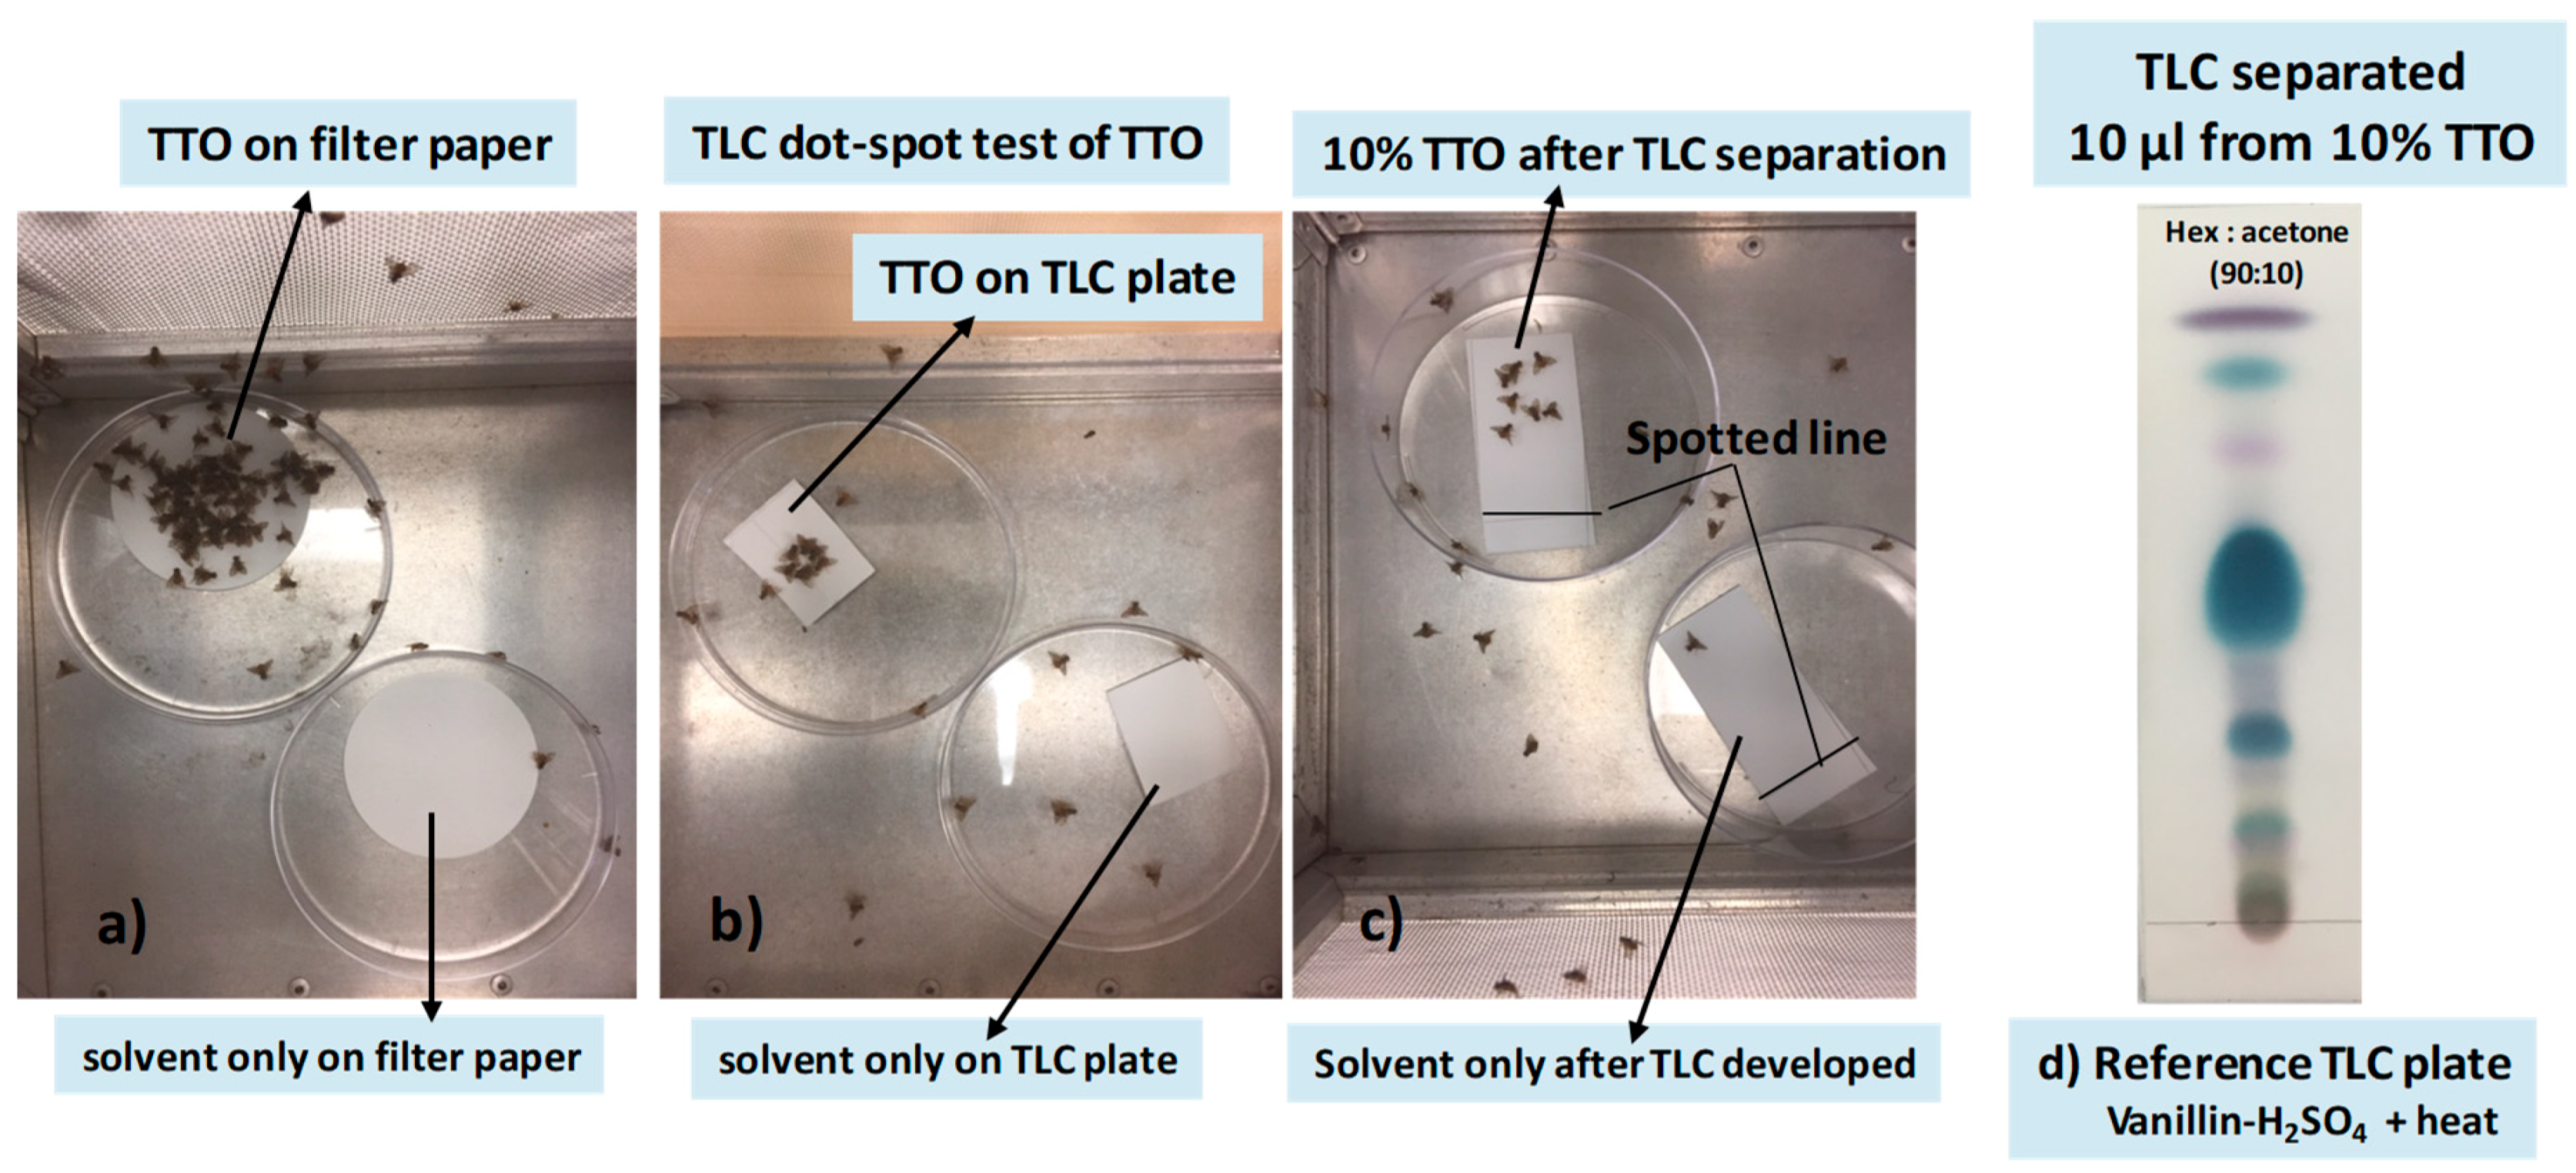
Experiment 1
Experiment 2
Experiment 3
2.2.4. Experiment 4
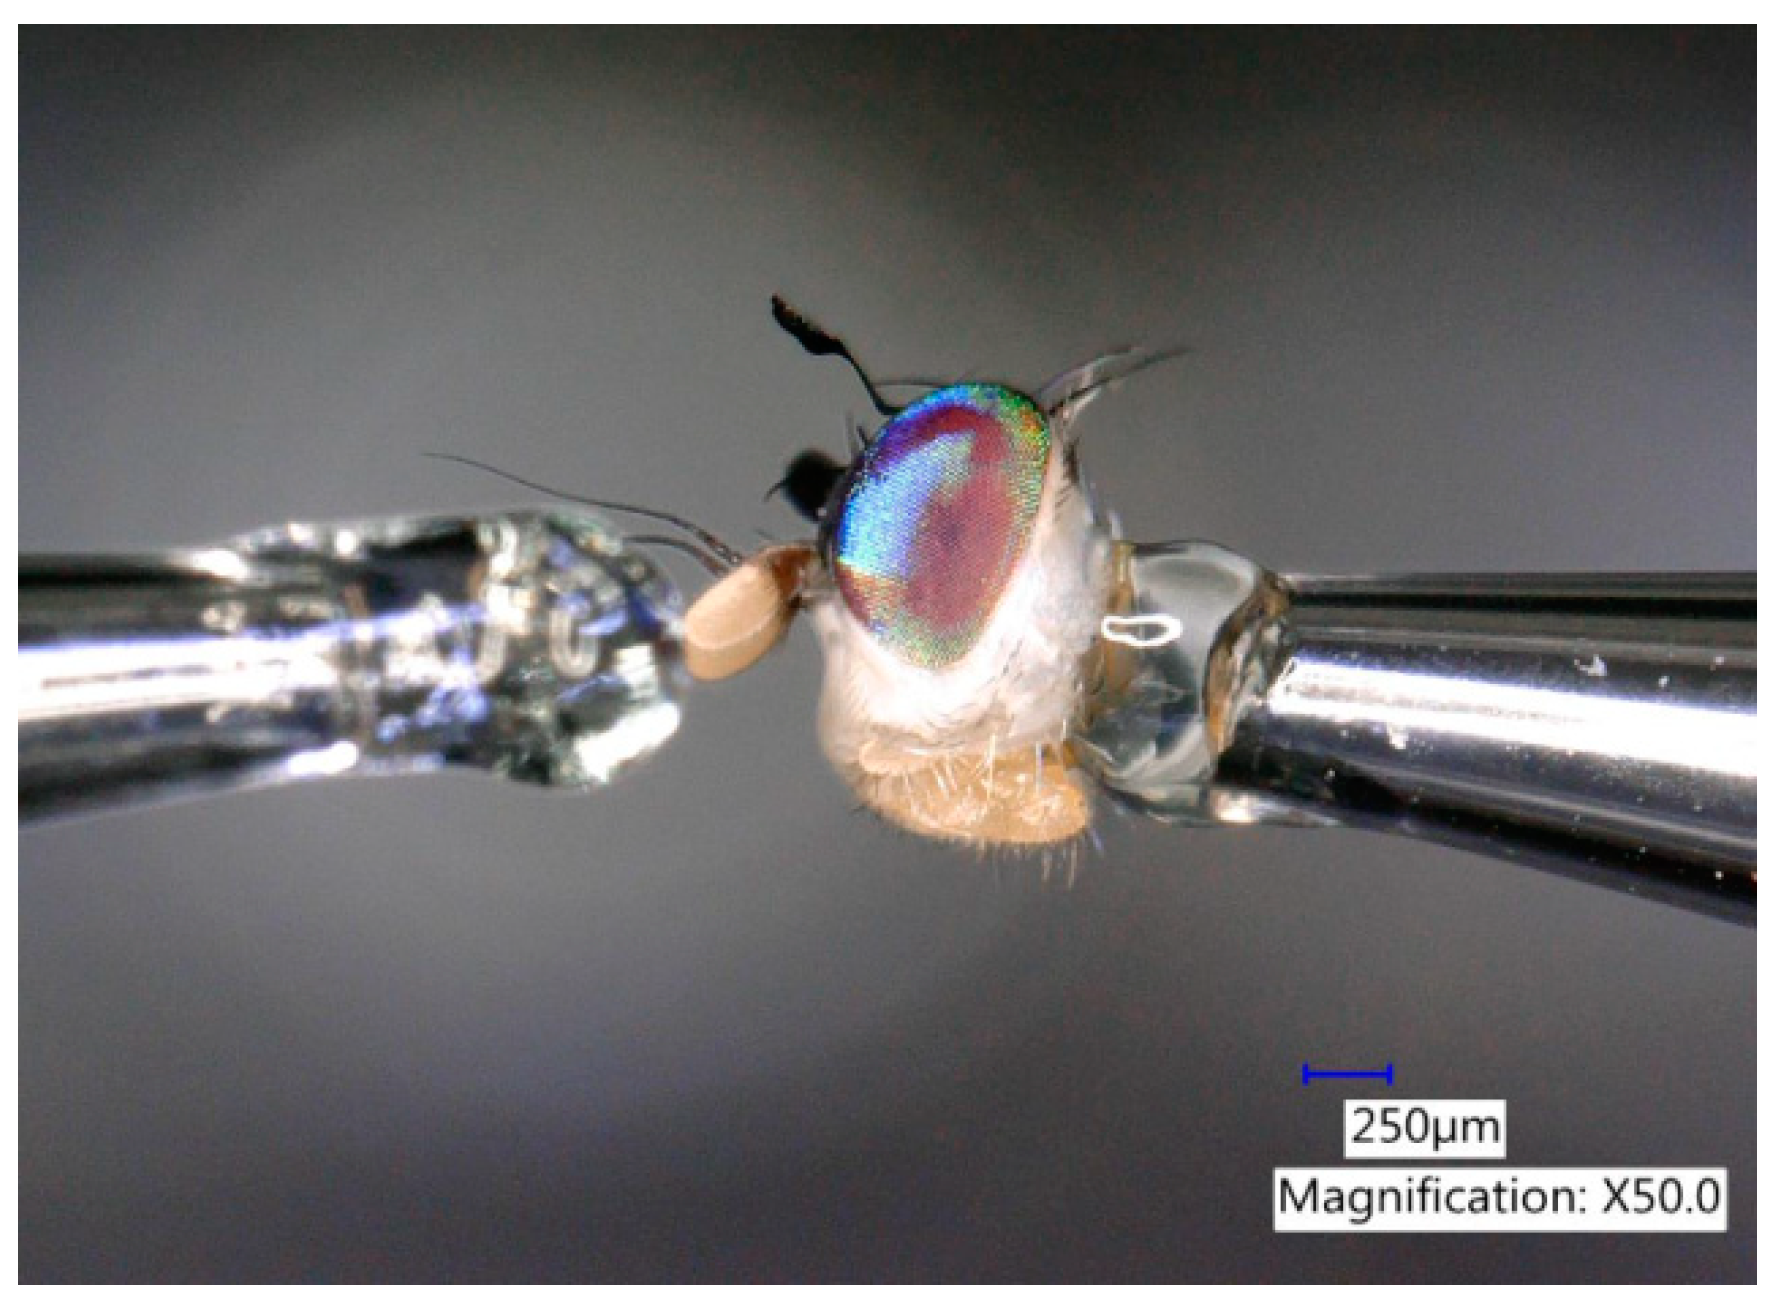
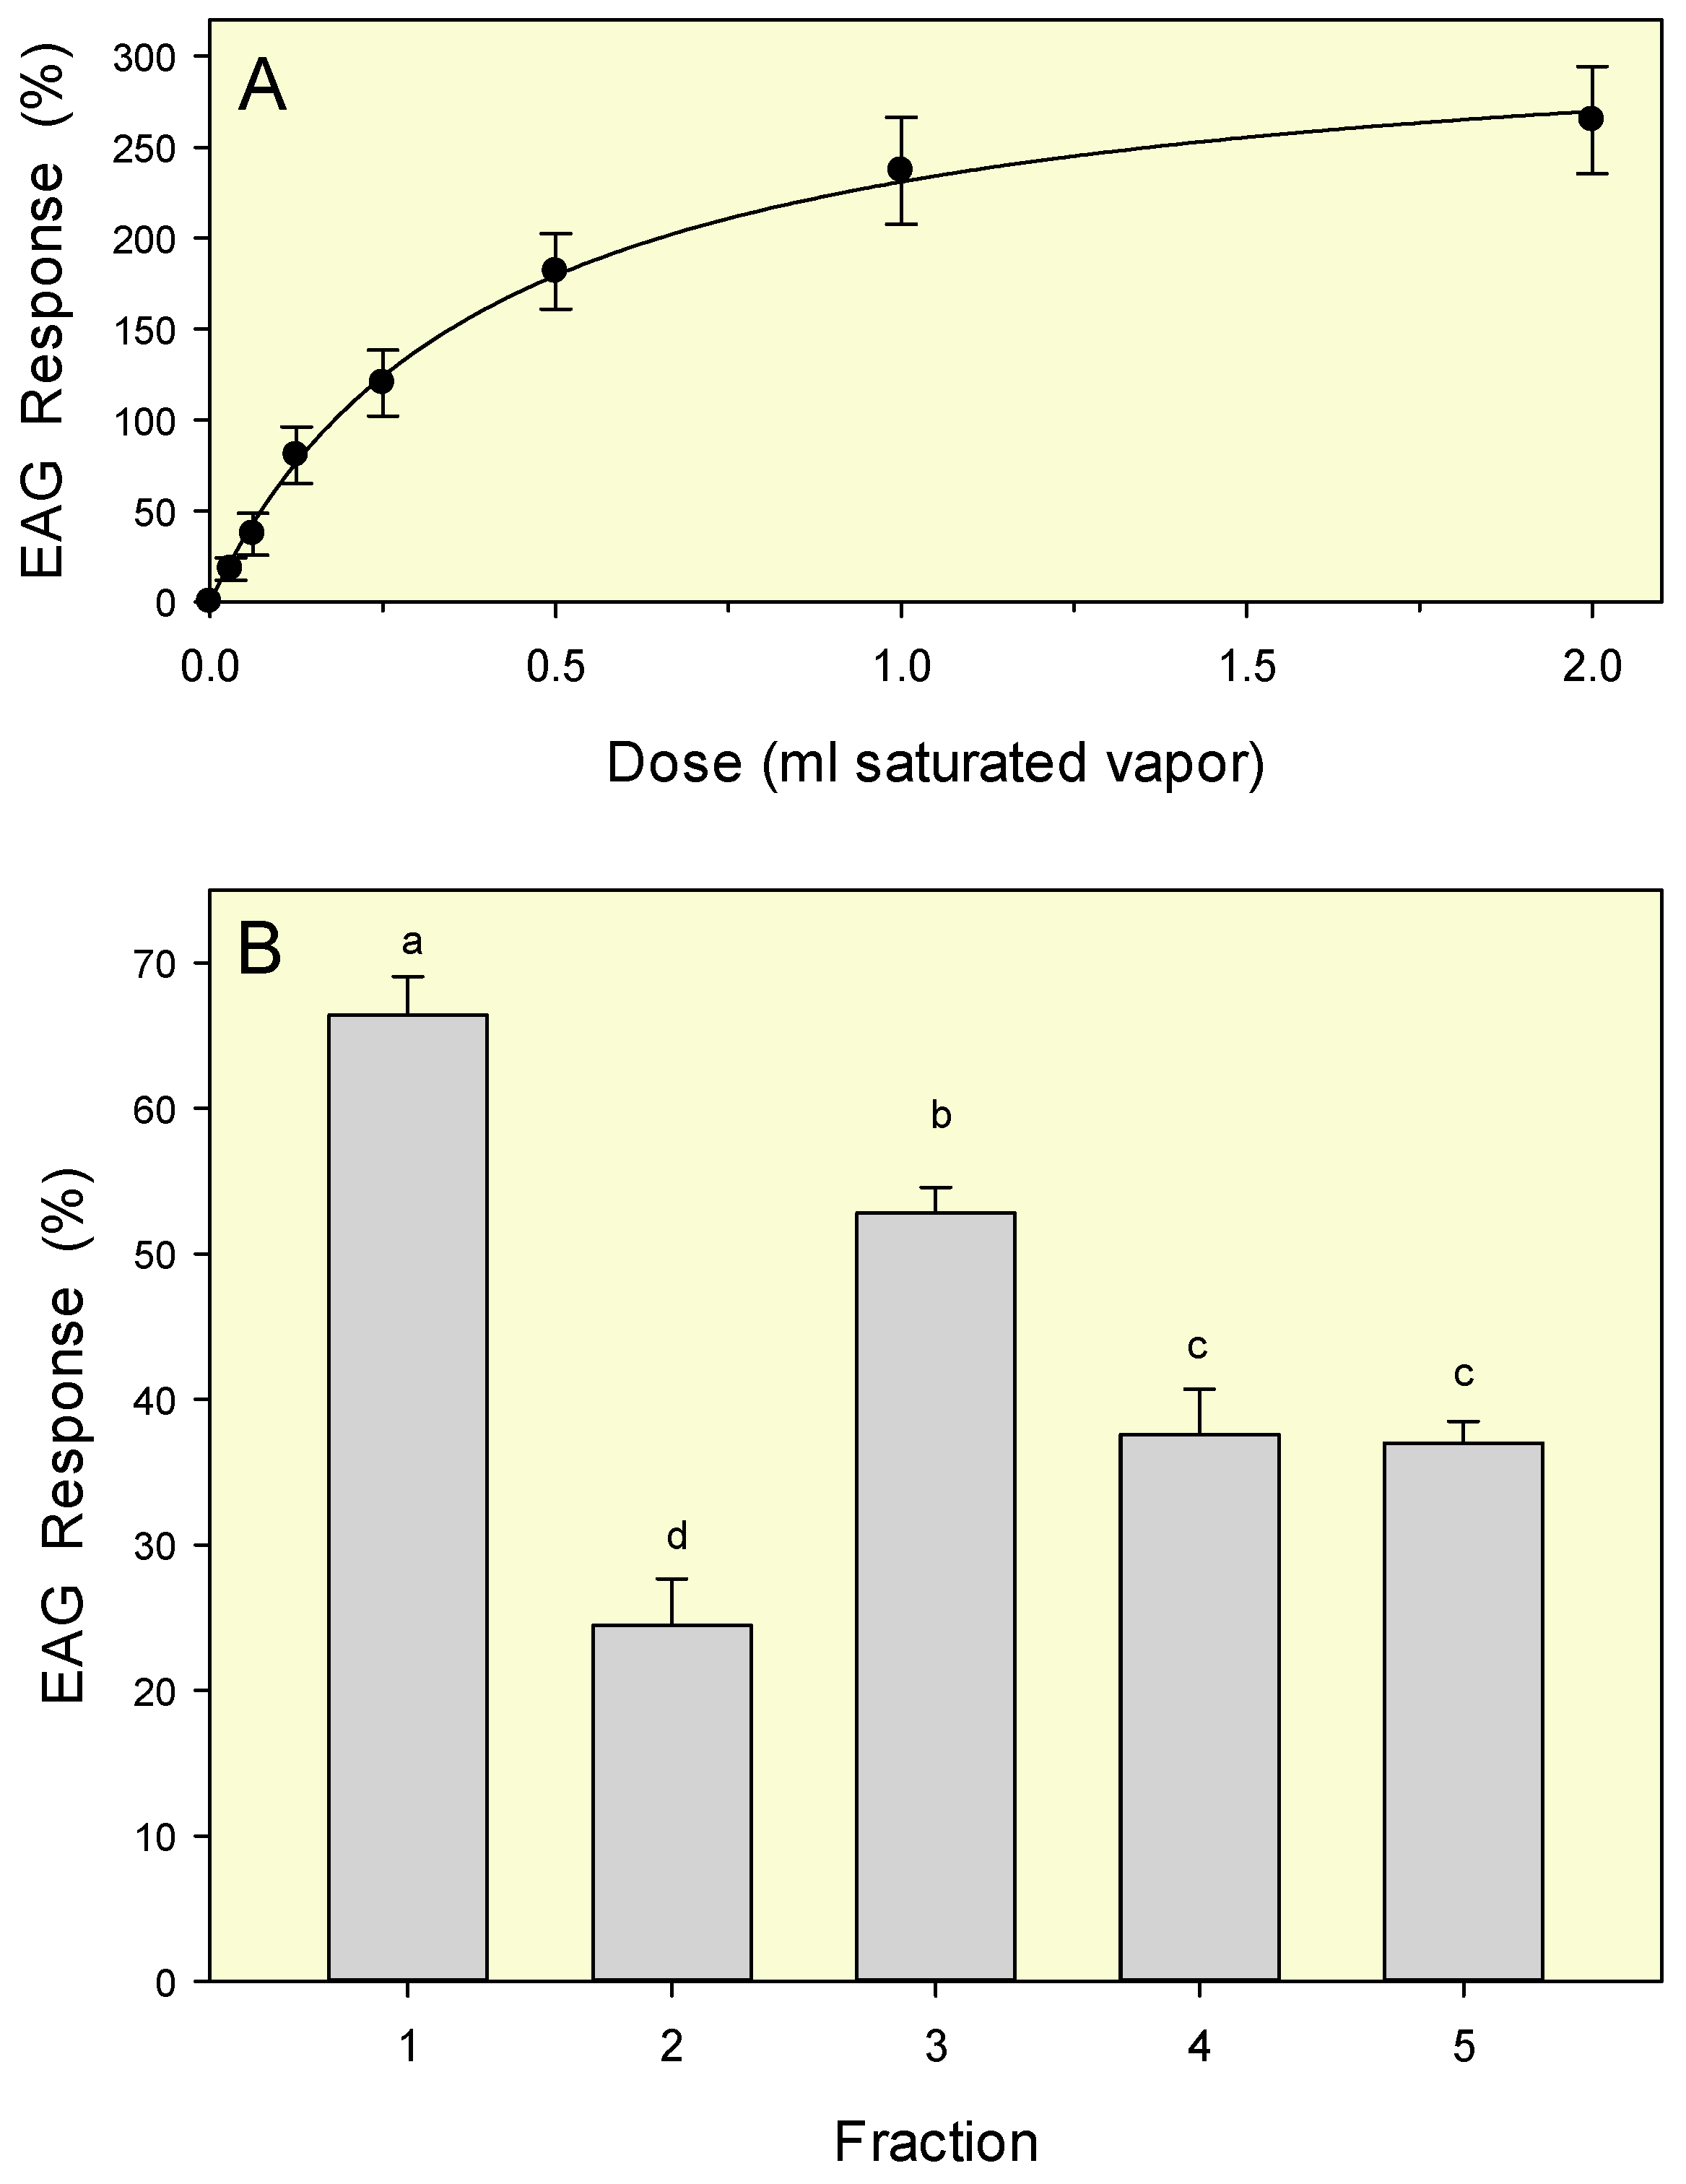
Electroantennography
2.3. Chemical Analysis of Tea Tree Essential Oil Components
2.3.1. Gas Chromatography
2.3.2. Gas Chromatography-Mass Spectrometry
2.3.3. Enantio–Gas Chromatography Analysis of Tea Tree Oil
3. Results and Discussion
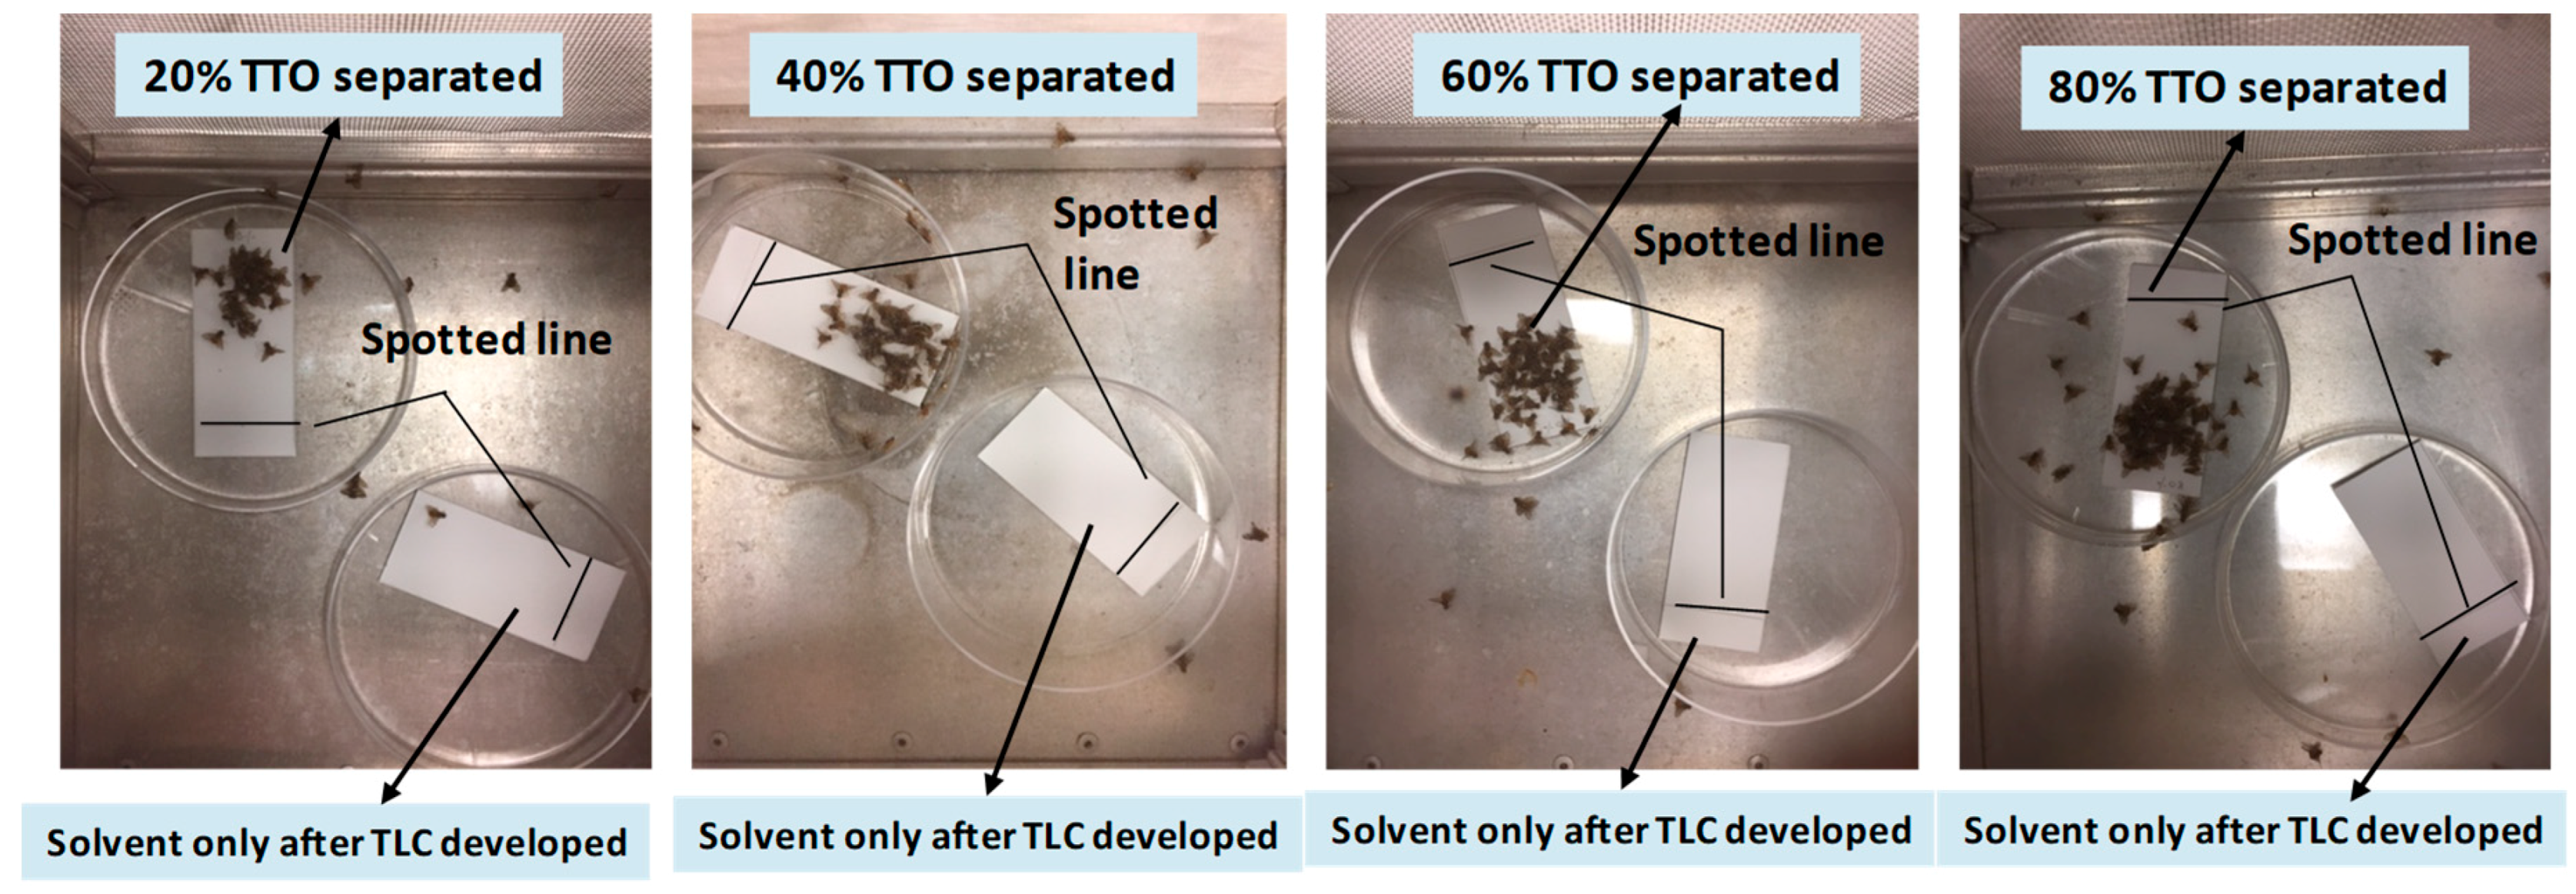
3.1. Localization of Male Attractants on the TLC Plate
3.2. Electroantennography Responses
3.3. Chemical Composition of TTO
4. Conclusions
Author Contributions
Funding
Acknowledgments
Conflicts of Interest
References
- Papadopoulos, N.T. Fruit fly invasion: Historical, biological, economical aspects and management. In Trapping and the Detection, Control, and Regulation of Tephritid Fruit Flies, 1st ed.; Shelly, T., Epsky, N.D., Jang, E.B., Reyes-Flores, J., Vargas, R., Eds.; Springer Publishing: New York, NY, USA, 2014; pp. 219–252. [Google Scholar]
- Vargas, R.I.; Leblanc, L.; Pinero, J.C.; Hoffman, K.M. Male annihilation, past, present, and future. In Trapping and the Detection, Control, and Regulation of Tephritid Fruit Flies, 1st ed.; Shelly, T., Epsky, N.D., Jang, E.B., Reyes-Flores, J., Vargas, R., Eds.; Springer Publishing: New York, NY, USA, 2014; pp. 493–511. [Google Scholar]
- Maddison, P.A.; Bartlett, B.J. Contribution towards the zoogeography of the Tephritidae. In Word Crop Pests. Fruit Flies: Their Biology, Natural Enemies and Control, 1st ed.; Robinson, A.S., Hooper, G., Eds.; Elsevier Science Publishers: Amsterdam, The Netherlands, 1989; Volume 3A, pp. 27–35. [Google Scholar]
- Malacrida, A.R.; Marinoni, F.; Torti, C.; Gomulski, L.M.; Sebastiani, F.; Bonvicini, C.; Gasperi, G.; Guglielmino, C.R. Genetic aspects of the worldwide colonization process of Ceratitis capitata. J. Hered. 1998, 89, 501–507. [Google Scholar] [CrossRef] [PubMed]
- Thomas, M.C.; Heppner, J.B.; Woodruff, R.E.; Weems, H.V.; Steck, G.J.; Fasulo, T.R. Mediterranean Fruit Fly, Ceratitis Capitata (Wiedemann) (Insecta: Diptera: Tephritidae). EENY-214/IN371. Available online: https://edis.ifas.ufl.edu/in371 (accessed on 7 August 2019).
- Steiner, L.F.; Rohwer, G.G.; Ayers, E.L.; Christenson, L.D. The role of attractants in the recent Mediterranean fruit fly eradication program in Florida. J. Econ. Entomol. 1961, 54, 30–35. [Google Scholar] [CrossRef]
- Szyniszewska, A.M.; Tatem, A.J. Global assessment of seasonal potential distribution of Mediterranean fruit fly, Ceratitis capitata (Diptera: Tephritidae). PLoS ONE 2014, 9, e111582. [Google Scholar] [CrossRef]
- Steiner, L.F.; Miyashita, D.H.; Christenson, L.D. Angelica oils as Mediterranean fruit fly lures. J. Econ. Entomol. 1957, 50, 505. [Google Scholar] [CrossRef]
- Liquido, N.J.; Cunningham, R.T.; Nakagawa, S. Host Plants of Mediterranean Fruit Fly (Diptera: Tephritidae) on the Island of Hawaii (1949–1985 Survey). J. Econ. Entomol. 1990, 83, 1863–1878. [Google Scholar] [CrossRef]
- Fornasiero, U.; Guitto, A.; Caporale, G.; Baccichetti, R.; Musajo, L. Identification of the attractant of Ceratitis capitata males contained in the Angelica archangelica seed oil. Gazz. Chim. Ital. 1969, 99, 700–710. [Google Scholar]
- Nishida, R.; Shelly, T.E.; Whittier, T.S.; Kaneshiro, K.Y. α-Copaene, a potential rendezvous cue for the Mediterranean fruit fly, Ceratitis capitata? J. Chem. Ecol. 2000, 26, 87–100. [Google Scholar] [CrossRef]
- Jacobson, M.; Uebel, E.C.; Lusby, W.R.; Waters, R.M. Optical isomers of—Copaene derived from several plant sources. J. Agric. Food Chem. 1987, 35, 798–800. [Google Scholar] [CrossRef]
- Flath, R.A.; Cunningham, R.T.; Mon, T.R.; John, J.O. Additional male Mediterranean fruit fly (Ceratitis capitata Wied.) attractants from Angelica seed oil (Angelica archangelica L.). J. Chem. Ecol. 1994, 20, 1969–1984. [Google Scholar] [CrossRef]
- Flath, R.A.; Cunningham, R.T.; Mon, T.R.; John, J.O. Male lures for Mediterranean fruit fly (Ceratitis capitata Wied.): Structural analogs of α-copaene. J. Chem. Ecol. 1994, 20, 2595–2609. [Google Scholar] [CrossRef]
- Cunningham, R.T. Parapheromones. In Word Crop Pests Fruit Flies: Their Biology, Natural Enemies and Control, 1st ed.; Robinson, A.S., Hooper, G., Eds.; Elsevier Science Publishers: Amsterdam, The Netherlands, 1989; Volume 3A, pp. 221–230. [Google Scholar]
- Beroza, M.; Green, N.; Gertler, S.I. New attractants for the Mediterranean fruit fly. J. Agric. Food Chem. 1961, 9, 361–365. [Google Scholar] [CrossRef]
- McGovern, T.P.; Beroza, M.; Ohinata, K.; Miyashita, D.; Steiner, L.F. Volatility and attractiveness to the Mediterranean fruit fly of trimedlure and its isomers, and a comparison of its volatility with that of seven other insect attractants. J. Chem. Ecol. 1966, 59, 1450–1455. [Google Scholar] [CrossRef] [PubMed]
- Warthen, J.D.; Cunningham, R.T.; Leonhardt, B.A.; Cook, J.M.; Avery, J.W.; Harte, E.M. Comparison of ceralure and trimedlure controlled-release formulations for male Mediterranean fruit flies in C&C traps. J. Chem. Ecol. 1998, 24, 1305–1314. [Google Scholar]
- Payne, T.L.; Shorey, H.H.; Gaston, L.K. Sex Pheromones of Lepidoptera. XXXVIII. Electroantennogram responses in Autographa californica to cis-7-dodecenyl acetate and related compounds. Ann. Entomol. Soc. Am. 1973, 66, 703–704. [Google Scholar] [CrossRef]
- Sivinski, J.M.; Calkins, C. Pheromones and parapheramones in the control of tephritids. Fla. Entomol. 1986, 69, 157–168. [Google Scholar] [CrossRef]
- Renou, M.; Guerrero, A. Insect parapheromones in olfaction research and semiochemical-based pest control strategies. Annu. Rev. Entomol. 2000, 45, 605–630. [Google Scholar] [CrossRef]
- Dean, D.; Pierre, H.; Mosser, L.; Kurashima, R.; Shelly, T. Field longevity and attractiveness of trimedlure plugs to male Ceratitis capitata in Florida and Hawaii. Fla. Entomol. 2018, 101, 441–446. [Google Scholar] [CrossRef]
- (IAEA) International Atomic Energy Agency. Trapping Guidelines for Area-Wide Fruit Fly Programmes; International Atomic Energy Agency: Vienna, Austria, 2003. [Google Scholar]
- Epsky, N.F.; Niogret, J. Short range attraction of Ceratitis capitata (Diptera: Tephritidae) sterile males to six commercially available plant essential oils. Nat. Volatiles Essent. Oils 2017, 4, 1–7. [Google Scholar]
- Jang, E.B.; Raw, A.S.; Carvalho, L.A. Field Attraction of Mediterranean fruit fly, Ceratitis capitata (Wiedemann) to synthetic stereoselective enantiomers of the Ceralure B1 isomer. J. Chem. Ecol. 2001, 27, 235–242. [Google Scholar] [CrossRef]
- Shelly, T.E.; Pahio, E. Relative attractiveness of enriched ginger root oil and trimedlure to male Mediterranean fruit flies (Diptera: Tephritidae). Fla. Entomol. 2002, 85, 545–551. [Google Scholar] [CrossRef]
- Hardt, I.H.; Rieck, A.; Fricke, C.; Koening, W.A. Enantiomeric composition of sesquiterpene hydrocarbons of the essential oil of Cedrela odorata L. Flavour Fragr. J. 1995, 10, 165–171. [Google Scholar] [CrossRef]
- Light, D.M.; Jang, E.B.; Flath, R.A. Electroantennogram responses of the Mediterranean fruit fly, Ceratitis capitata to the volatile constituents of nectarines. Entomol. Exp. Appl. 1992, 63, 13–26. [Google Scholar] [CrossRef]
- Shelly, T.E. Exposure to α-copaene and α-copaene-containing oils enhances mating success of male Mediterranean fruit flies (Diptera: Tephritidae). Ann. Entomol. Soc. Am. 2001, 94, 497–502. [Google Scholar] [CrossRef]
- Shelly, T.E.; Villalobos, E.M. Host plant influence on the mating success of male Mediterranean fruit flies: Variable effects within and between individual plants. Anim. Behav. 2004, 68, 417–426. [Google Scholar] [CrossRef]
- Shelly, T.E.; Dang, C.; Kennelly, S. Exposure to orange (Citrus sinensis L.) trees, fruit, and oil enhances mating success of male Mediterranean fruit flies (Ceratitis capitata [Wiedemann]). J. Insect Behav. 2004, 17, 303–315. [Google Scholar] [CrossRef]
- Papadopoulos, N.T.; Shelly, T.E.; Niyazi, N.; Jang, E. Olfactory and behavioral mechanisms underlying enhanced mating competitiveness following exposure to ginger root oil and orange oil in males of the Mediterranean fruit fly, Ceratitis capitata (Diptera: Tephritidae). J. Insect Behav. 2006, 19, 403–419. [Google Scholar] [CrossRef]
- Shelly, T.E.; Edu, J.; Pahio, E.; Nishimoto, J. Scented males and choosy females: Does male odor influence female mate choice in the Mediterranean fruit fly? J. Chem. Ecol. 2007, 33, 2308–2324. [Google Scholar] [CrossRef]
- Shelly, T.E.; Cowan, A.N.; Edu, J.; Pahio, E. Mating success of male Mediterranean fruit flies following exposure to two sources of α-copaene, manuka oil and mango. Fla. Entomol. 2008, 91, 9–15. [Google Scholar] [CrossRef]
- Niogret, J.; Montgomery, W.S.; Kendra, P.E.; Heath, R.R.; Epsky, N.D. Attraction and electroantennogram responses of male Mediterranean fruit fly to volatile chemicals from Persea, Litchi and Ficus wood. J. Chem. Ecol. 2011, 37, 483–491. [Google Scholar] [CrossRef]
- Juan-Blasco, M.; Andrés, V.S.; Martínez-Utrillas, M.A.; Herrero, R.A.; Pla, I.; Urbaneja, A.; Sabater-Muñoz, B. Alternatives to ginger root oil aromatherapy for improved mating performance of sterile Ceratitis capitata (Diptera: Tephritidae) males. J. Appl. Entomol. 2013, 137, 244–251. [Google Scholar] [CrossRef]
- Niogret, J.; Gill, M.A.; Espinoza, H.R.; Kendra, P.E.; Epsky, N.D. Attraction and electroantennogram responses of male Mediterranean fruit fly (Diptera: Tephritidae) to six plant essential oils. J. Entomol. Zool. Stud. 2017, 5, 958–964. [Google Scholar]
- Shelly, T.E.; Epsky, N.D. Exposure to tea tree oil enhances the mating success of male Mediterranean fruit flies (Diptera: Tephritidae). Fla. Entomol. 2015, 98, 1127–1133. [Google Scholar] [CrossRef][Green Version]
- Segura, D.F.; Belliard, S.A.; Vera, M.T.; Bachmann, G.E.; Ruiz, M.J.; Jofre-Barud, F.; Fernández, P.C.; López, M.L.; Shelly, T.E. Plant chemicals and the sexual behavior of male Tephritid fruit flies. Ann. Entomol. Soc. Am. 2018, 111, 239–264. [Google Scholar] [CrossRef]
- Available online: https://www.ars.usda.gov/southeast-area/miami-fl/subtropical-horticulture-research/ (accessed on 1 September 2019).
- Niogret, J.; Epsky, N.D. Attraction of Ceratitis capitata (Diptera: Tephritidae) sterile males to essential oils: The importance of linalool. Environ. Entomol. 2018, 47, 1287–1292. [Google Scholar] [CrossRef] [PubMed]
- Bejar, E. Adulteration of tea tree oil (Melaleuca alternifolia and M. linariifolia). In ABC-AHP-NCNPR Botanical Adulterants Prevention Program; Botanical Adulteration Prevention Bulletin: Austin, TX, USA, 2017; pp. 1–8. [Google Scholar]
- Tabanca, N.; Masi, M.; Epsky, N.; Nocera, P.; Cimmino, A.; Kendra, P.E.; Niogret, J.; Evidente, A. Laboratory evaluation of natural and synthetic aromatic compounds as potential attractants for male Mediterranean fruit fly, Ceratitis capitata. Molecules 2019, 24, 2409. [Google Scholar] [CrossRef]
- SAS Institute. SAS System for Windows Release 9.4; SAS Institute: Cary, NC, USA, 2016. [Google Scholar]
- Wolfinger, R.; Chang, M. Comparing the SAS GLM and MIXED procedures for repeated measures. SAS User’s Group Int. Conf. Proc. 1995, 20, 1–11. [Google Scholar]
- Box, G.E.P.; Hunter, W.G.; Hunter, J.S. Statistics for experimenters. In An Introduction to Design, Data Analysis, and Model Building; J. Wiley & Sons: New York, NY, USA, 1978. [Google Scholar]
- Moricz, A.M.; Horvath, G.; Boszormenyi, A.; Ott, P.G. Detection and identification of antibacterial and antioxidant components of essential oils by TLC-biodetection and GC-MS. Nat. Prod. Commun. 2016, 11, 1705–1708. [Google Scholar] [CrossRef]
- Kendra, P.E.; Vázquez, A.; Epsky, N.D.; Heath, R.R. Ammonia and carbon dioxide: Quantitation and electroantennogram responses of Caribbean fruit fly, Anastrepha suspensa (Diptera: Tephritidae). Environ. Entomol. 2005, 34, 569–575. [Google Scholar] [CrossRef]
- Kendra, P.E.; Montgomery, W.S.; Mateo, D.M.; Puche, H.; Epsky, N.D.; Heath, R.R. Effect of age on EAG response and attraction of female Anastrepha suspensa (Diptera: Tephritidae) to ammonia and carbon dioxide. Environ. Entomol. 2005, 34, 584–590. [Google Scholar] [CrossRef]
- Owens, D.; Nuessly, G.S.; Kendra, P.E.; Colquhoun, T.A.; Seal, D.R. Attraction, oviposition preferences, and olfactory responses of corn-infesting Ulidiidae (Diptera) to various host-based substrates. Environ. Entomol. 2017, 46, 885–894. [Google Scholar] [CrossRef]
- Gardner, E.M.; Gagné, R.J.; Kendra, P.E.; Montgomery, W.S.; Raguso, R.A.; McNeil, T.T.; Zerega, N.J.C. 2018. A flower in fruit’s clothing: Pollination of jackfruit (Artocarpus heterophyllus, Moraceae) by a new species of gall midge, Clinodiplosis ultracrepidata sp. nov. (Diptera: Cecidomyiidae). Int. J. Plant. Sci. 2018, 179, 350–367. [Google Scholar] [CrossRef]
- Kendra, P.E.; Epsky, N.D.; Montgomery, W.S.; Heath. R.R. Response of Anastrepha suspensa (Diptera: Tephritidae) to terminal diamines in a food-based synthetic attractant. Environ. Entomol. 2008, 37, 1119–1125. [Google Scholar] [CrossRef] [PubMed]
- Kendra, P.E.; Montgomery, W.S.; Niogret, J.; Schnell, E.Q.; Deyrup, M.A.; Epsky, N.D. Evaluation of seven essential oils identifies cubeb oil as most effective attractant for detection of Xyleborus glabratus. J. Pest. Sci. 2014, 87, 681–689. [Google Scholar] [CrossRef]
- Kendra, P.E.; Montgomery, W.S.; Niogret, J.; Pruett, G.E.; Mayfield, A.E., III; MacKenzie, M.; Deyrup, M.A.; Bauchan, G.R.; Ploetz, R.C.; Epsky, N.D. North American Lauraceae: Terpenoid emissions, relative attraction and boring preferences of redbay ambrosia beetle, Xyleborus glabratus (Coleoptera: Curculionidae: Scolytinae). PLoS ONE 2014, 9, e102086. [Google Scholar] [CrossRef] [PubMed]
- Kendra, P.E.; Owens, D.R.; Montgomery, W.S.; Narvaez, T.I.; Bauchan, G.R.; Schnell, E.Q.; Tabanca, N.; Carrillo. D. α-Copaene is an attractant, synergistic with quercivorol, for improved detection of Euwallacea nr. fornicatus (Coleoptera: Curculionidae: Scolytinae). PLoS ONE 2017, 12, e0179416. [Google Scholar]
- Systat Software. SigmaPlot for Windows; Systat Software Inc.: San Jose, CA, USA, 2017; Volume 14. [Google Scholar]
- Van Den Dool, H.; Kratz, P.D. A generalization of the retention index system including linear temperature programmed gas-liquid partition chromatography. J. Chromatogr. A 1963, 11, 463–471. [Google Scholar] [CrossRef]
- MassFinder. MassFinder Software, Version 3; Dr. Hochmuth Scientific Consulting: Hamburg, Germany, 2004. [Google Scholar]
- Adams, R.P. Identification of Essential Oil Components by Gas Chromatography/Mass Spectrometry, 4th ed.; Allured Publishing Corp: Carol Stream, IL, USA, 2017; pp. 1–804. [Google Scholar]
- FFNSC-3. Flavors and Fragrances of Natural and Synthetic Compounds 3. In Mass Spectral Database; Scientific Instrument Services Inc.: Hoboken, NJ, USA, 2015. [Google Scholar]
- NIST. NIST/EPA/NIH Mass Spectral Library, Version: NIST 17. In Mass Spectrometry Data Center; National Institute of Standard and Technology: Gaithersburg, MD, USA, 2017. [Google Scholar]
- Wiley. Wiley Registry of Mass Spectral Data, 11th ed.; Scientific Instrument Services Inc.: Ringoes, NJ, USA, 2017. [Google Scholar]
- Sciarrone, D.; Ragonese, C.; Carnovale, C.; Piperno, A.; Dugo, P.; Dugo, G.; Mondello, L. Evaluation of tea tree oil quality and ascaridole: A deep study by means of chiral and multi heart-cuts multidimensional gas chromatography system coupled to mass spectrometry detection. J. Chromatogr. A 2010, 41, 6422–6427. [Google Scholar] [CrossRef]
- ISO 4730, 2004 Oil of Melaleuca, Terpinen-4-Ol Type (Tea Tree oil). Available online: https://www.iso.org/standard/69082.html (accessed on 12 August 2019).
- Australian Tea Tree Industry Association (ATTIA). Available online: https://teatree.org.au/standards.php (accessed on 16 September 2019).
- Australian Tea Tree Industry Association (ATTIA). Available online: https://www.escuelaesenco.com/wp-content/uploads/2016/09/How_ISO__AS_Standards_help_identify_fraudulent_TTO-1.pdf (accessed on 16 September 2019).
- Brophy, J.J.; Davies, N.W.; Soutwell, I.A.; Stiff, I.A.; Williams, L.R. Gas chromatographic quality control of Melaleuca terpinen-4-ol type (Australian tea tree). J. Agric. Food Chem. 1989, 37, 1330–1335. [Google Scholar] [CrossRef]
- Wang, M.; Zhao, J.; Avula, B.; Wang, Y.H.; Chittiboyina, A.G.; Parcher, J.F.; Khan, I.A. Quality evaluation of terpinen-4-ol-type Australian tea tree oils and commercial products: An integrated approach using conventional and chiral GC/MS combined with chemometrics. J. Agric. Food Chem. 2015, 63, 2674–2682. [Google Scholar] [CrossRef]
- Wong, Y.F.; West, R.N.; Chin, S.T.; Marriott, P.J. Evaluation of fast enantioselective multidimensional gas chromatography methods for monoterpenic compounds: Authenticity control of Australian tea tree oil. J. Chromatogr. A 2015, 1406, 307–315. [Google Scholar] [CrossRef]
- Wong, Y.F.; Davies, N.W.; Chin, S.T.; Larkman, T.; Marriott, P.J. Enantiomeric distribution of selected terpenes for authenticity assessment of Australian Melaleuca alternifolia oil. Ind. Crops Prod. 2015, 67, 475–483. [Google Scholar] [CrossRef]
- Davies, N.W.; Larkman, T.; Marriott, P.J.; Khan, I.A. Determination of enantiomeric distribution of terpenes for quality assessment of Australian tea tree oil. J. Agric. Food Chem. 2016, 64, 4817–4819. [Google Scholar] [CrossRef] [PubMed]


| Min | Filter Papera | TLC Dot-Blot Test | TLC Separated | F2,12 | p-Value |
|---|---|---|---|---|---|
| 5 | 40.8 ± 17.7*Ab | 5.4 ± 4.4 B | 6.2 ± 3.7 *Bb | 12.91 | 0.0010 |
| 10 | 46.8 ± 8.9 *Aa | 9.0 ± 3.3 *B | 13.8 ± 7.5 *Bb | 24.84 | <0.0001 |
| 15 | 40.8 ± 6.4 *Ab | 12.4 ± 5.9 *B | 15.2 ± 7.5 *Ba | 11.78 | 0.0015 |
| 30 | 10.8 ± 5.4 c | 13.2 ± 6.0 * | 10.6 ± 6.6 *b | 0.17 | 0.8430 |
| 45 | 2.8 ± 1.5 ABc | 8.8 ± *A | 3.2 ± 3.4 Bc | 4.94 | 0.0272 |
| 60 | 2.6 ± 1.8c | 4.8 ± 1.3 * | 2.0 ± 2.1 c | 2.61 | 0.1142 |
| F5,20 | 45.04 | 3.15 | 8.23 | ||
| pb | <0.0001 | 0.1259 | 0.0002 | ||
| G-Gb | 0.3513 | 0.2828 | 0.37551 |
| Min | 20%a | 40% | 60% | 80% | F4,20 | p-Value |
|---|---|---|---|---|---|---|
| 5 | 19.0 ± 9.6 *b | 21.8 ± 9.4 *b | 21.6 ± 11.1 *c | 21.4 ± 11.2 *b | 0.13 | 0.9432 |
| 10 | 29.2 ± 16.7 *a | 34.0 ± 15.20 | 34.8 ± 10.5 *b | 38.8 ± 7.8 *b | 0.55 | 0.6543 |
| 15 | 32.2 ± 10.3 *a | 47.2 ± 11.3 *a | 44.6 ± 14.5 *a | 48.2 ± 14.2 *a | 1.97 | 0.1598 |
| 30 | 28.4 ± 16.9 *a | 47.2 ± 17.2 *a | 46.4 ± 16.6 *a | 53.0 ± 12.4 *a | 2.66 | 0.0831 |
| 45 | 19.2 ± 14.0 *Bb | 39.2 ± 20.2 *Aa | 43.2 ± 18.0 *Aa | 48.0 ± 20.8 *Aa | 3.42 | 0.0427 |
| 60 | 8.4 ± 8.3 Bb | 30.6 ± 17.4 *Ab | 41.4 ± 20.0 *Aa | 42.2 ± 18.5 *Aa | 8.17 | 0.0016 |
| 75 | 6.0 ± 4.2 *Bb | 23.2 ± 19.7 *ABb | 36.4 ± 20.3 *Aa | 35.4 ± 15.3 *Aa | 8.12 | 0.0016 |
| F6,24 | 14.31 | 9.84 | 10.85 | 6.47 | ||
| pb | 0.0022 | 0.0077 | 0.0077 | 0.0432 | ||
| G-Gb | 0.3374 | 0.3233 | 0.2959 | 0.2277 |
| Min | Zone-1a | Zone-2 | Zone-3 | Zone-4 | Zone-5 | F4,20 | p |
|---|---|---|---|---|---|---|---|
| 5 | 22.0 ± 7.6 *A | 2.0 ± 2.8 B | 6.0 ± 5.5 B | 0.8 ± 1.8 B | 0.4 ± 0.9 B | 18.31 | <0.0001 |
| 10 | 36.4 ± 14.1 *A | 2.4 ± 2.6 B | 8.0 ± 9.3 B | 1.2 ± 1.8 B | 0.0 ± 0.0 B | 21.39 | <0.0001 |
| 15 | 44.4 ± 16.6 *A | 1.2 ± 2.7 C | 11.6 ± 8.9 B | 0.8 ± 1.1 C | 0.4 ± 0.9 C | 36.84 | <0.0001 |
| 30 | 53.6 ± 15.6 *A | 1.6 ± 3.6 C | 13.2 ± 9.5 *B | 2.0 ± 2.8 C | 0.0 ± 0.0 C | 39.03 | <0.0001 |
| 45 | 54.0 ± 17.4 *A | 1.2 ± 2.7 C | 16.0 ± 8.4 *B | 0.4 ± 0.9 C | 0.4 ± 0.9 C | 56.80 | <0.0001 |
| 60 | 48.4 ± 17.9 *A | 0.0 ± 0.0 C | 18.4± 14.1 *B | 0.8 ± 1.8 C | 0.0 ± 0.0 C | 29.01 | <0.0001 |
| 75 | 38.0 ± 25.1 *A | 0.0 ± 0.0 B | 22.0 ± 15.8 *A | 0.0 ± 0.0 B | 0.8 ± 1.8 B | 15.58 | <0.0001 |
| 90 | 28.0 ± 28.8 A | 0.0 ± 0.0 C | 21.2 ± 14.5 *AB | 0.4 ± 0.9 C | 1.2 ± 1.8 BC | 7.13 | 0.0001 |
| F5,20 | 3.53 | 1.77 | 3.02 | 0.76 | 0.74 | ||
| pb | 0.1186 | 0.2240 | 0.1212 | 0.4814 | 0.5330 | ||
| G-Gb | 0.1748 | 0.3252 | 0.2347 | 0.2396 | 0.3614 |
| RI aexp | RI blit | Compounds | Mean ± SEc (%) | Identification Method d |
|---|---|---|---|---|
| 922 | 924 | α -thujene | 0.91 ± 0.03 | f |
| 928 | 932 | α-pinene | 2.87 ± 0.15 | e, f |
| 944 | 946 | camphene | <0.01 | e, f |
| 968 | 969 | sabinene | 0.05 ± 0 | e, f |
| 972 | 974 | β-pinene | 0.92 ± 0.01 | e, f |
| 987 | 988 | myrcene | 0.85 ± 0.02 | e, f |
| 1003 | 1002 | α-phellandrene | 0.49 ± 0.02 | e, f |
| 1014 | 1014 | α-terpinene | 3.93 ± 0.02 | e, f |
| 1023 | 1020 | p-cymene | 11.87 ± 0.02 | e, f |
| 1026 | 1024 | limonene | 0.49 ± 0 | e, f |
| 1029 | 1026 | 1,8-cineole | 3.46 ± 0.02 | e, f |
| 1056 | 1054 | γ-terpinene | 15.53 ± 0.09 | e, f |
| 1084 | 1086 | terpinolene | 2.77 ± 0.04 | e, f |
| 1182 | 1174 | terpinen-4-ol | 41.78 ± 0.21 | e, f |
| 1193 | 1186 | α-terpineol | 4.59 ± 0.03 | e, f |
| 1338 | 1345 | α-cubebene | <0.01 | f |
| 1360 | 1374 | α-copaene | <0.01 | e, f |
| 1396 | 1409 | α-gurjunene | 0.59 ± 0.01 | f |
| 1407 | 1417 | β-caryophyllene | <0.01 | e, f |
| 1425 | 1439 | aromadendrene | 1.54 ± 0 | e, f |
| 1441 | 1452 | α-humulene | <0.01 | e, f |
| 1445 | 1458 | alloaromadendrene | 0.72 ± 0.01 | f |
| 1460 | 1475 | cadina-1(6),4-diene | 0.25 ± 0.01 | f |
| 1463 | 1478 | γ-muurolene | <0.01 | f |
| 1478 | 1496 | ledene | 1.19 ± 0.01 | e, f |
| 1482 | 1498 | α-selinene | <0.01 | f |
| 1487 | 1500 | α-muurolene | <0.01 | f |
| 1507 | 1522 | ẟ-cadinene | 1.51 ± 0.02 | f |
| 1561 | 1577 | spathulenol | 0.09 ± 0 | f |
| 1569 | 1590 | globulol | 0.10 ± 0 | e, f |
| 1577 | 1592 | viridiflorol | 0.27 ± 0.01 | e, f |
| Total | 96.76 ± 0.08 |
© 2020 by the US government employees and is in the public domain in the US. Licensee MDPI, Basel, Switzerland. This article is an open access article distributed under the terms and conditions of the Creative Commons Attribution (CC BY) license (http://creativecommons.org/licenses/by/4.0/).
Share and Cite
Tabanca, N.; Niogret, J.; Kendra, P.E.; Epsky, N.D. TLC-Based Bioassay to Isolate Kairomones from Tea Tree Essential Oil That Attract Male Mediterranean Fruit Flies, Ceratitis capitata (Wiedemann). Biomolecules 2020, 10, 683. https://doi.org/10.3390/biom10050683
Tabanca N, Niogret J, Kendra PE, Epsky ND. TLC-Based Bioassay to Isolate Kairomones from Tea Tree Essential Oil That Attract Male Mediterranean Fruit Flies, Ceratitis capitata (Wiedemann). Biomolecules. 2020; 10(5):683. https://doi.org/10.3390/biom10050683
Chicago/Turabian StyleTabanca, Nurhayat, Jerome Niogret, Paul E. Kendra, and Nancy D. Epsky. 2020. "TLC-Based Bioassay to Isolate Kairomones from Tea Tree Essential Oil That Attract Male Mediterranean Fruit Flies, Ceratitis capitata (Wiedemann)" Biomolecules 10, no. 5: 683. https://doi.org/10.3390/biom10050683
APA StyleTabanca, N., Niogret, J., Kendra, P. E., & Epsky, N. D. (2020). TLC-Based Bioassay to Isolate Kairomones from Tea Tree Essential Oil That Attract Male Mediterranean Fruit Flies, Ceratitis capitata (Wiedemann). Biomolecules, 10(5), 683. https://doi.org/10.3390/biom10050683