Grape-Leaf Extract Attenuates Alcohol-Induced Liver Injury via Interference with NF-κB Signaling Pathway

 ,
,  ,
,  and
and
Abstract
1. Introduction
2. Material and Methods
2.1. Reagents and Chemicals
2.2. Plant Material
2.3. Extract Preparation
2.4. LC Analysis
2.5. Experiment Animals
2.6. GLE Preparation for Oral Administration to Rats (In Vivo Studies)
2.7. Experiment Design
2.8. Collection of Serum, Plasma, and Tissue Homogenate
2.9. Assessment of Biochemical Markers of Liver Function
2.10. Assessment of Total Nitrite/Nitrate (NOx) Products
2.11. Assessment of MDA and Superoxide Dismutase (SOD) Activity
2.12. Assessment of Hepatic GSH Levels and Glutathione-Utilizing Enzyme Activities: Glutathione Reductase (GR) and Glutathione Peroxidase (GPx)
2.13. Measurement of Proinflammatory Cytokines: Interleukin-6 (IL-6) and TNF-α Levels in Liver Homogenate
2.14. Histopathological Examination of Liver Tissue
2.15. IHC Analysis
2.16. Statistical Analysis
3. Results
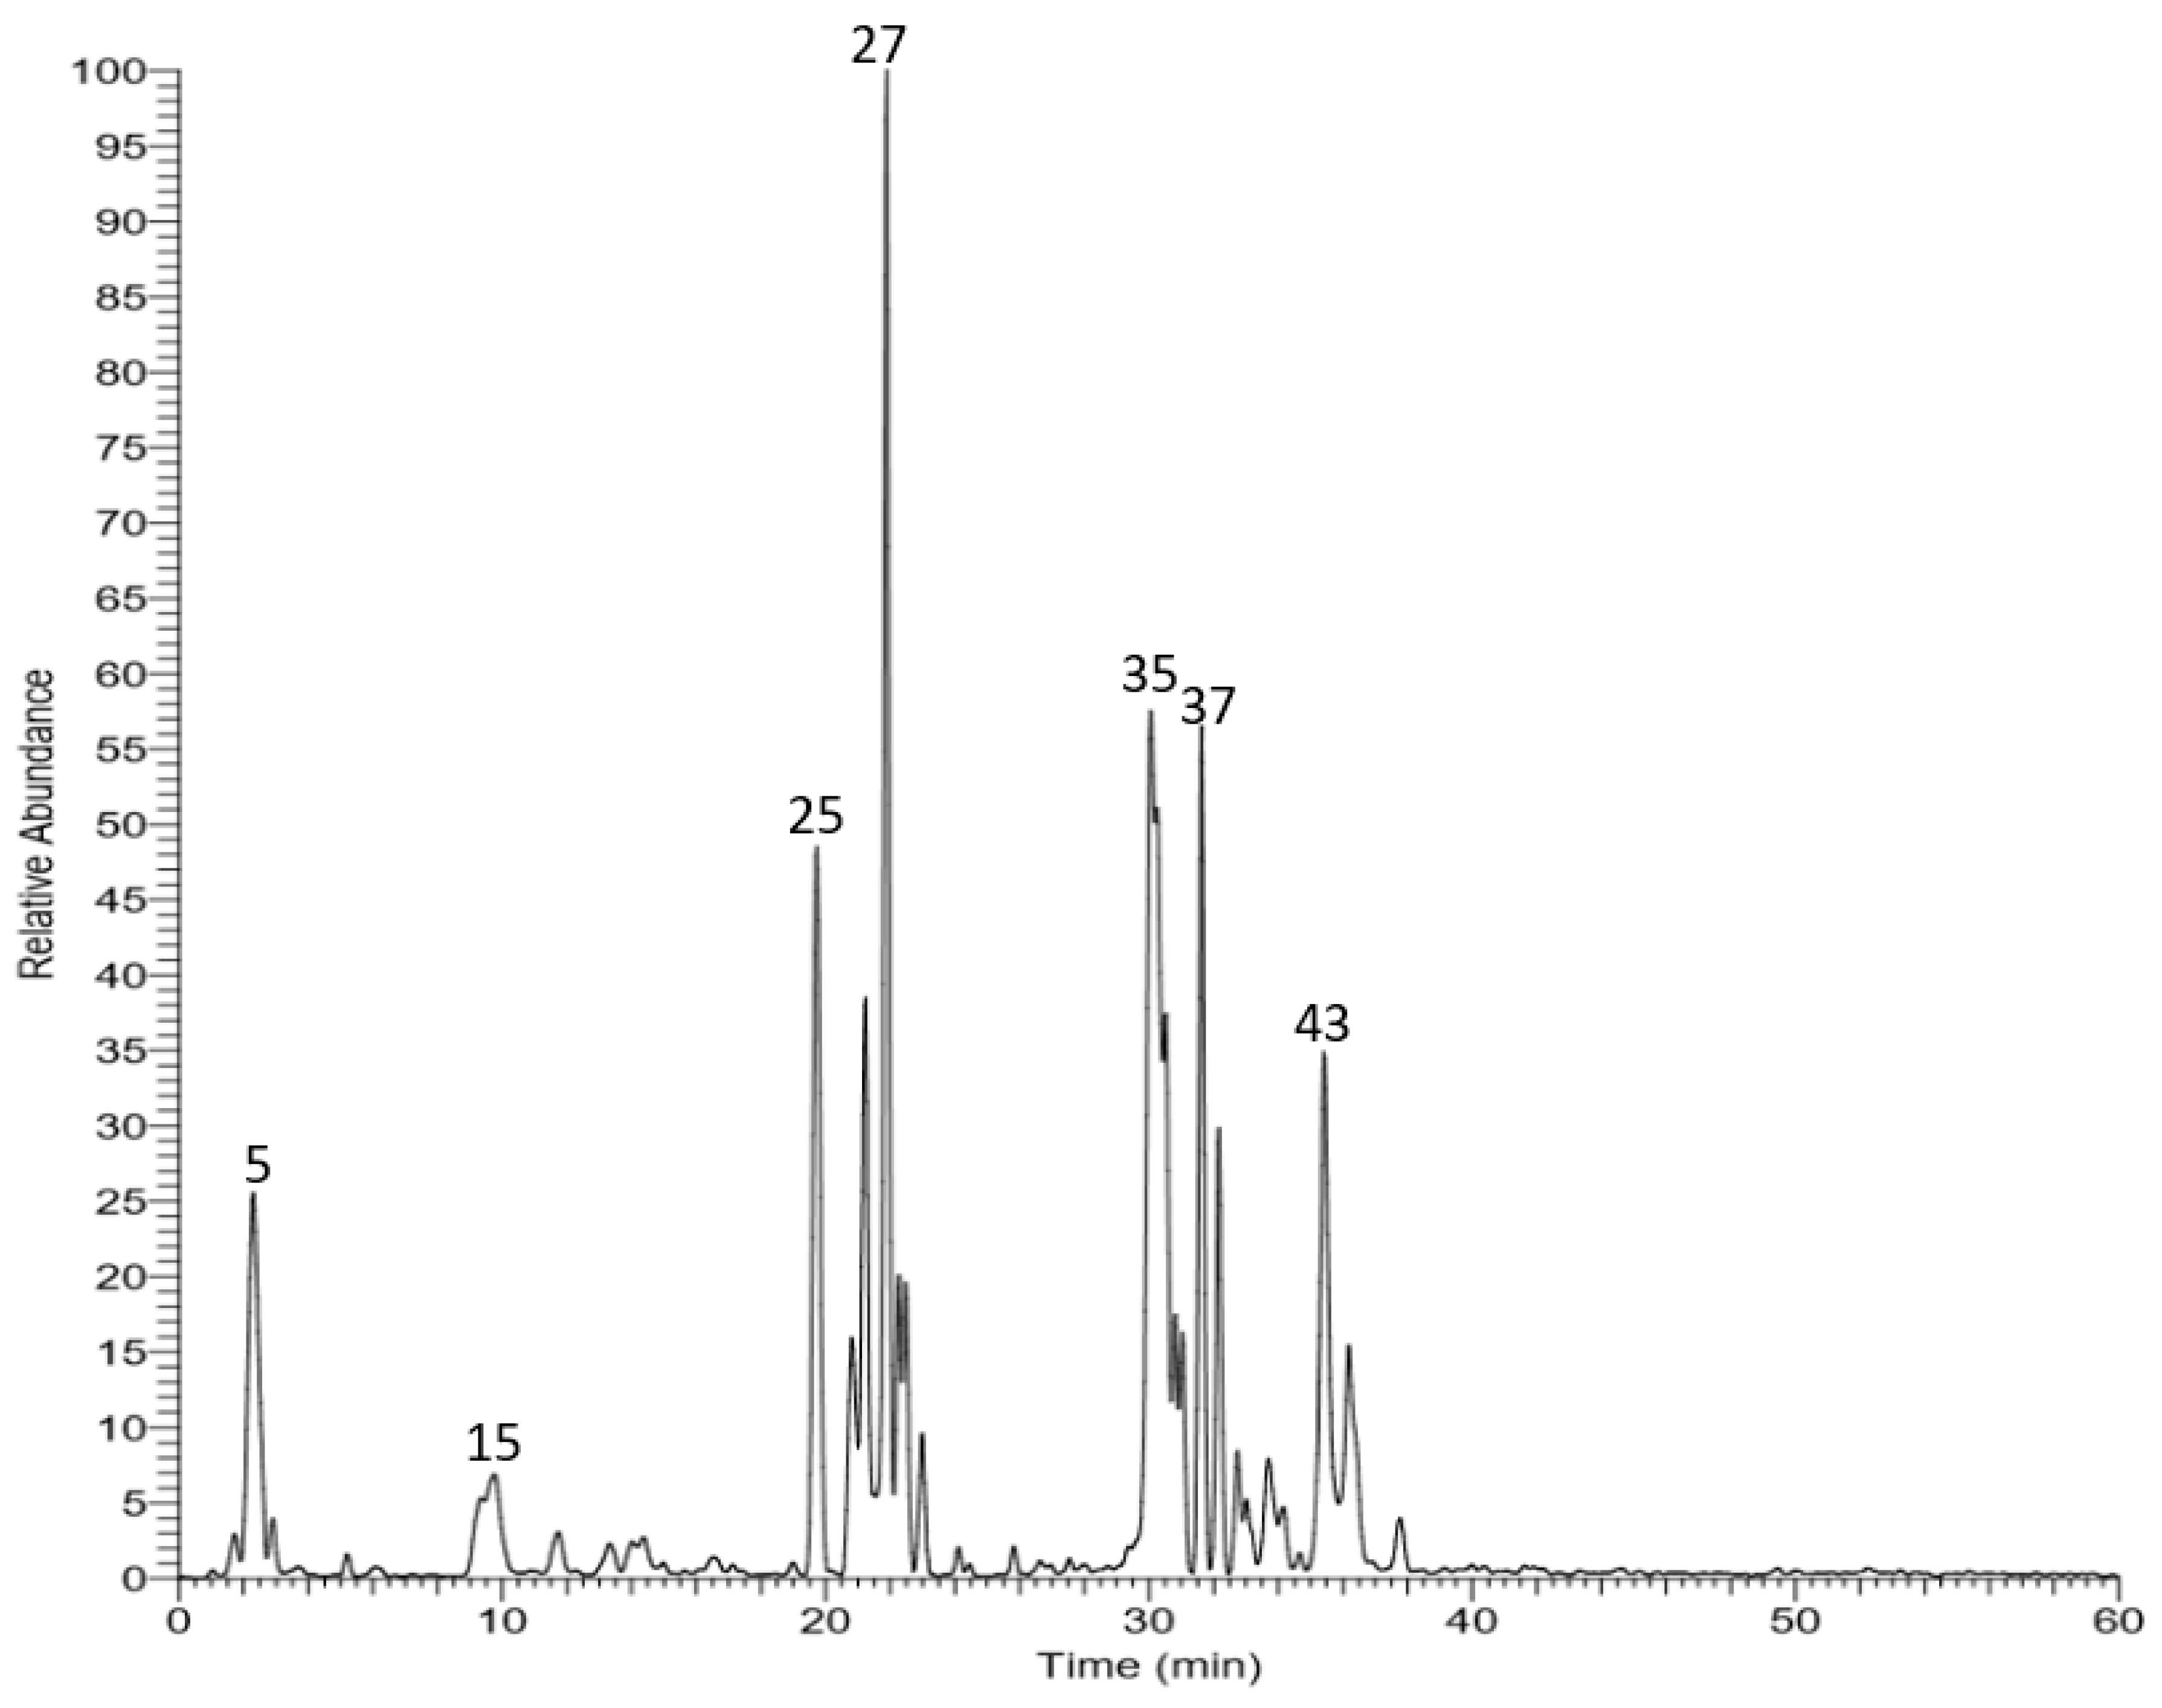
3.1. LC–MS Analysis
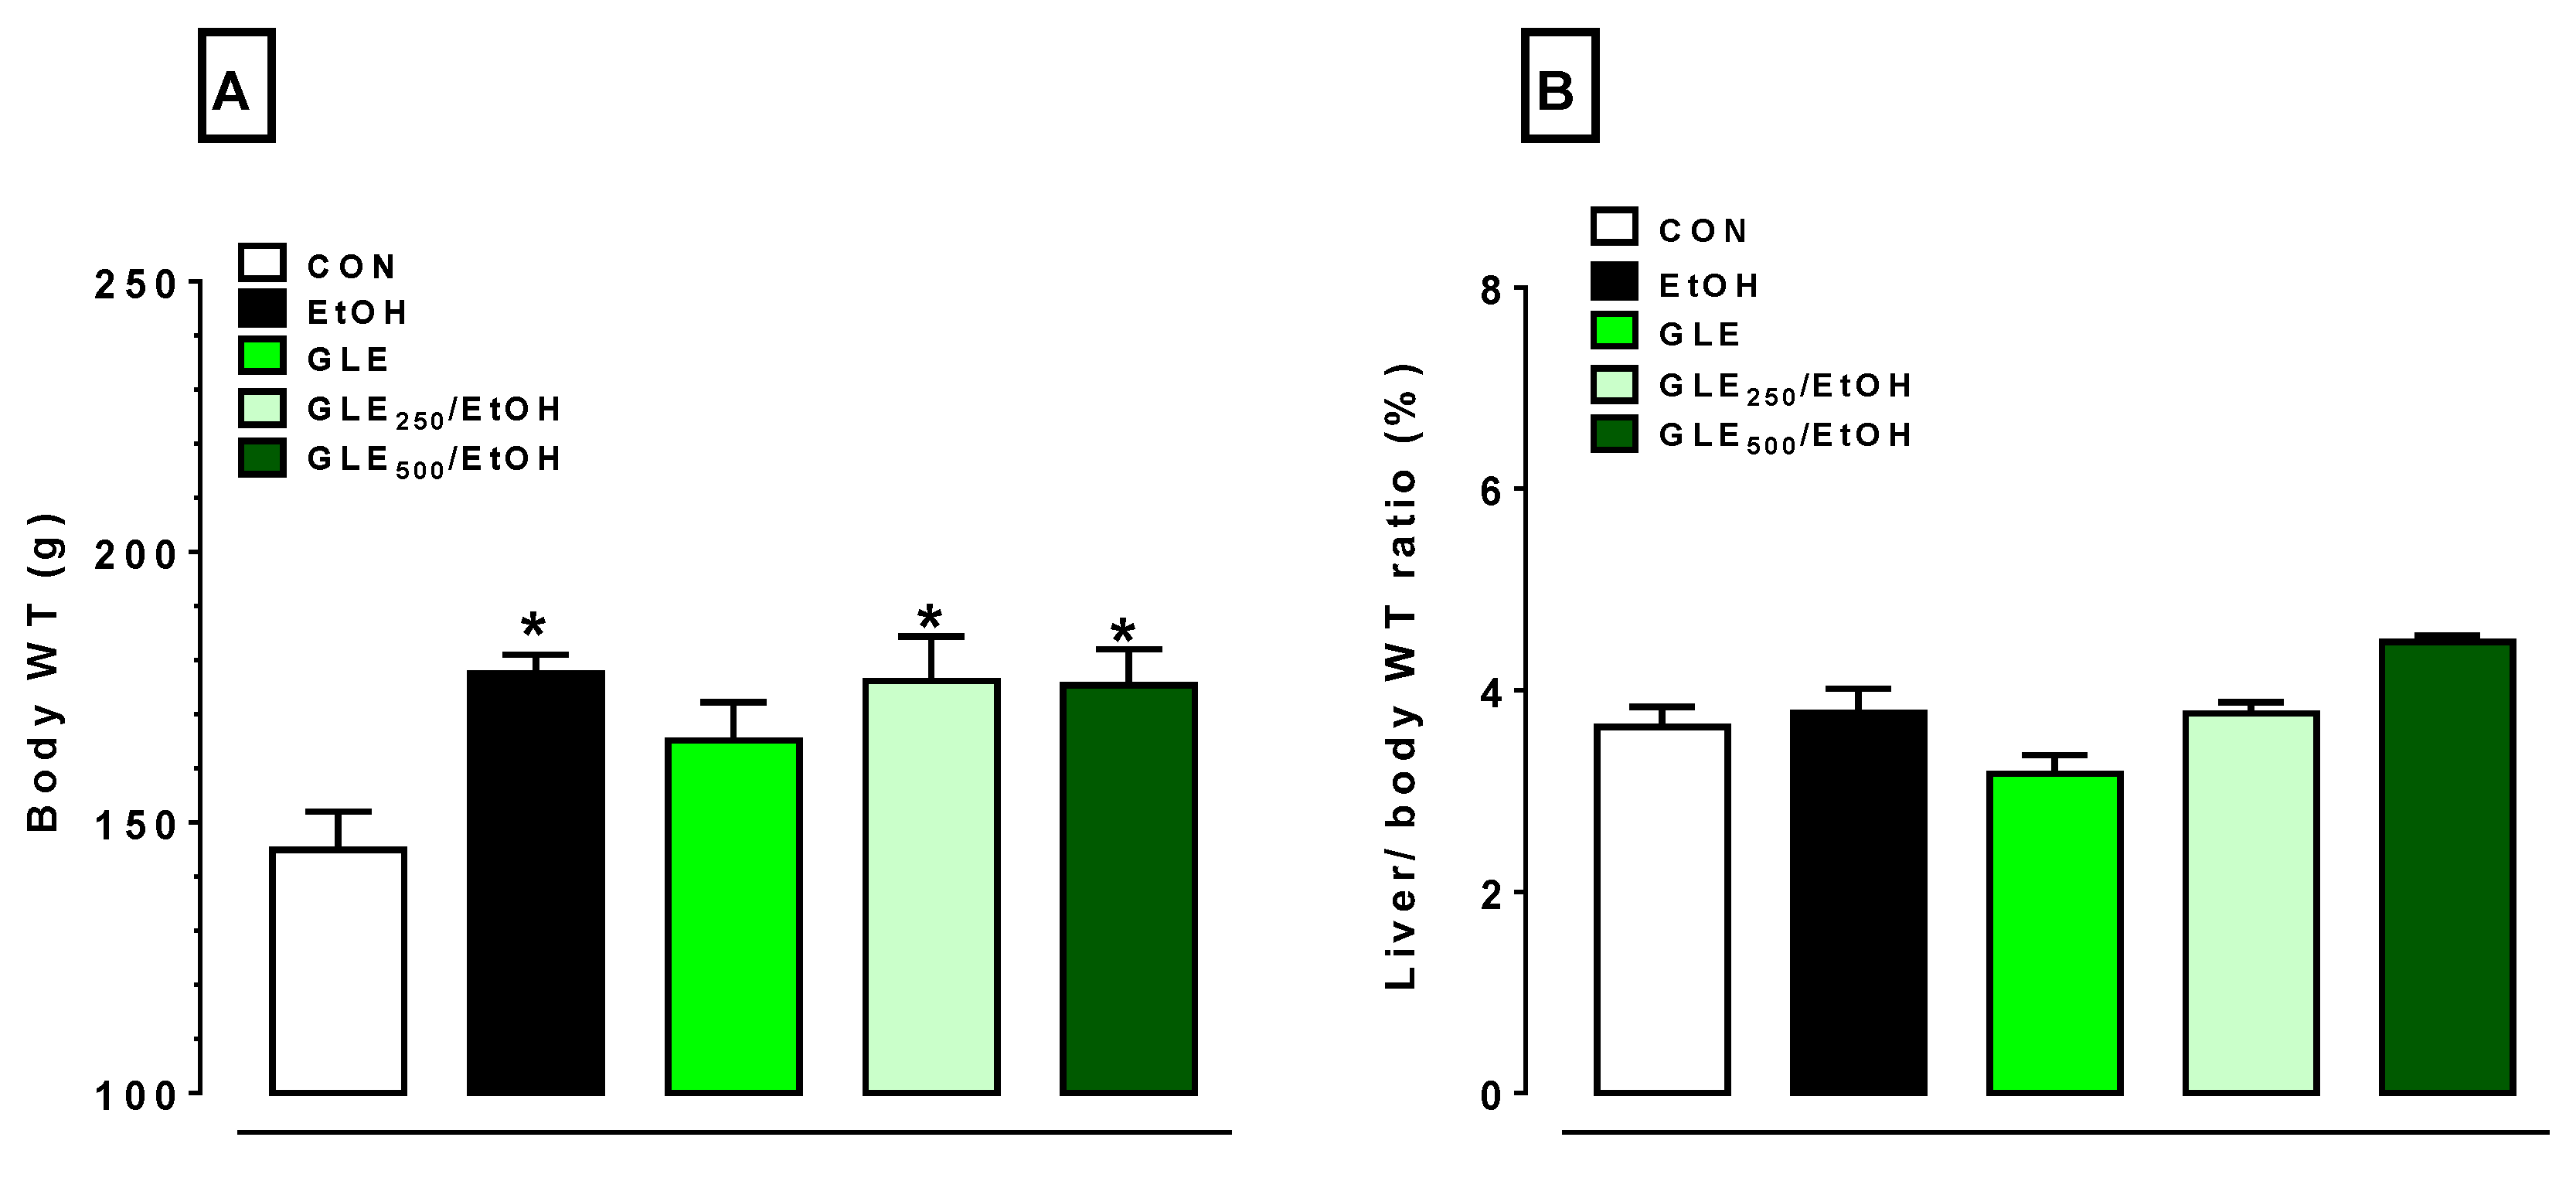
3.2. GLE Did Not Significantly Alter EtOH-Induced Body-Weight Increase
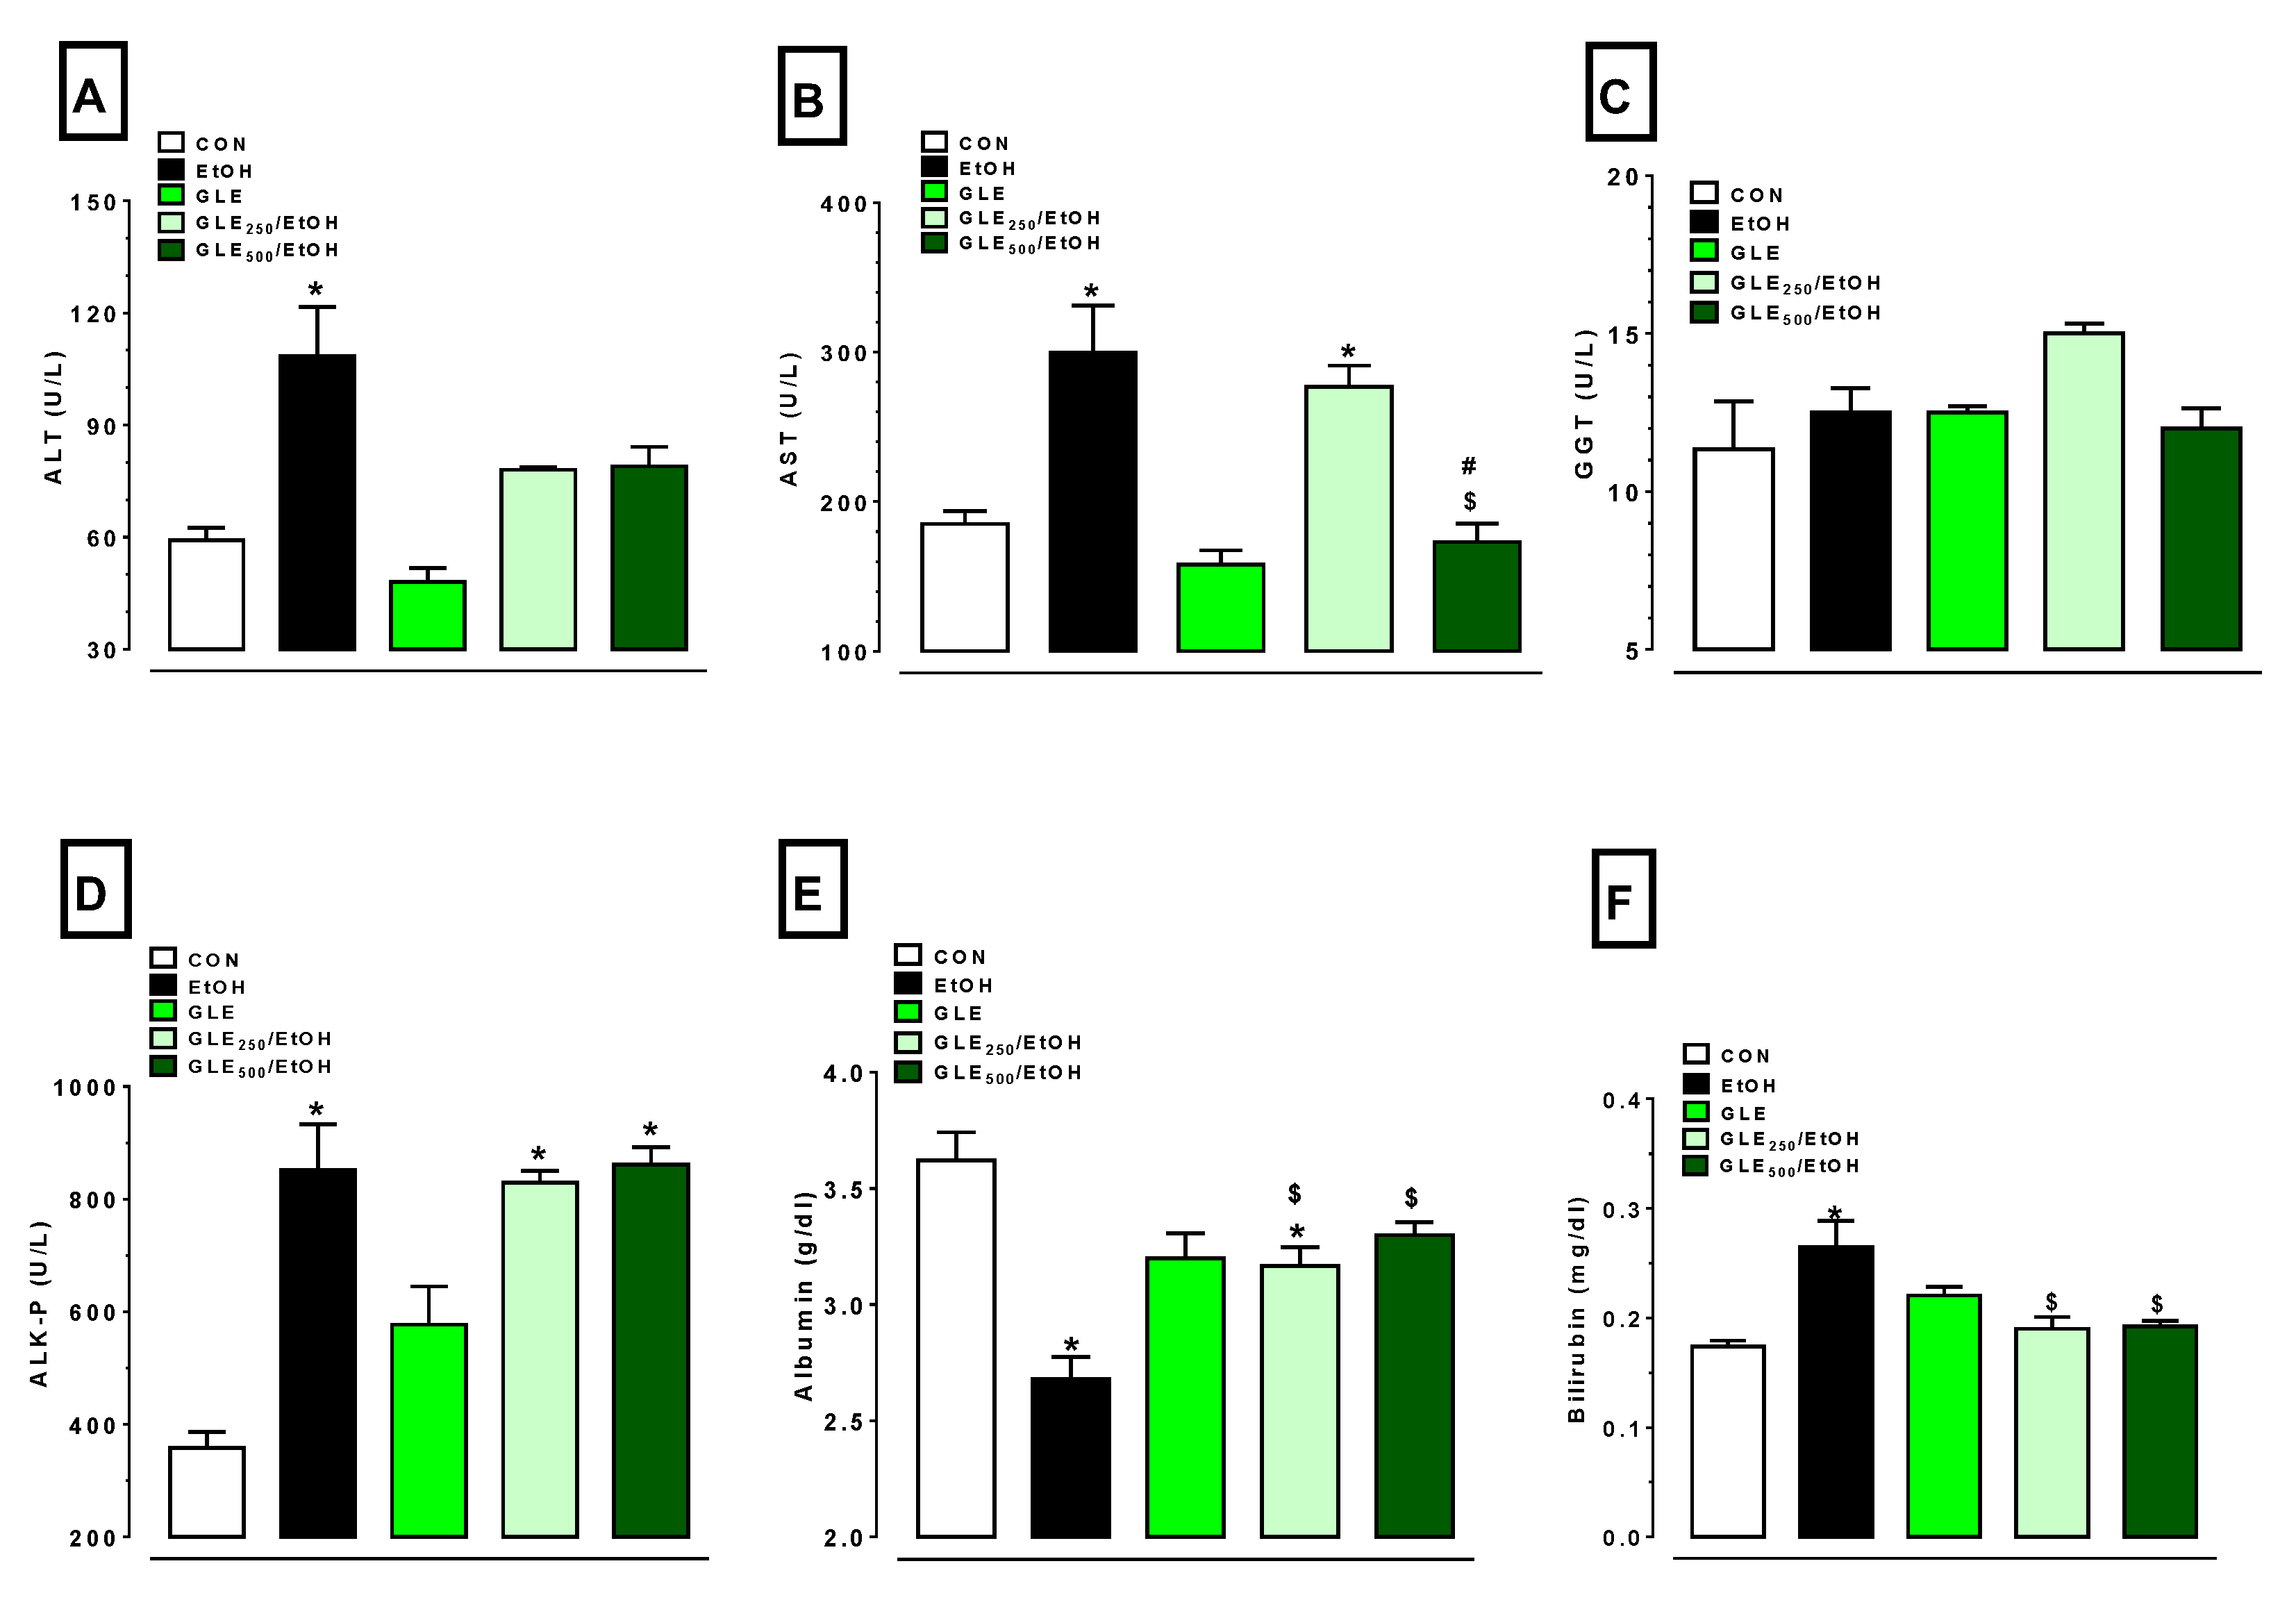
3.3. GLE Markedly Attenuates EtOH-Induced Changes in Liver-Injury Markers
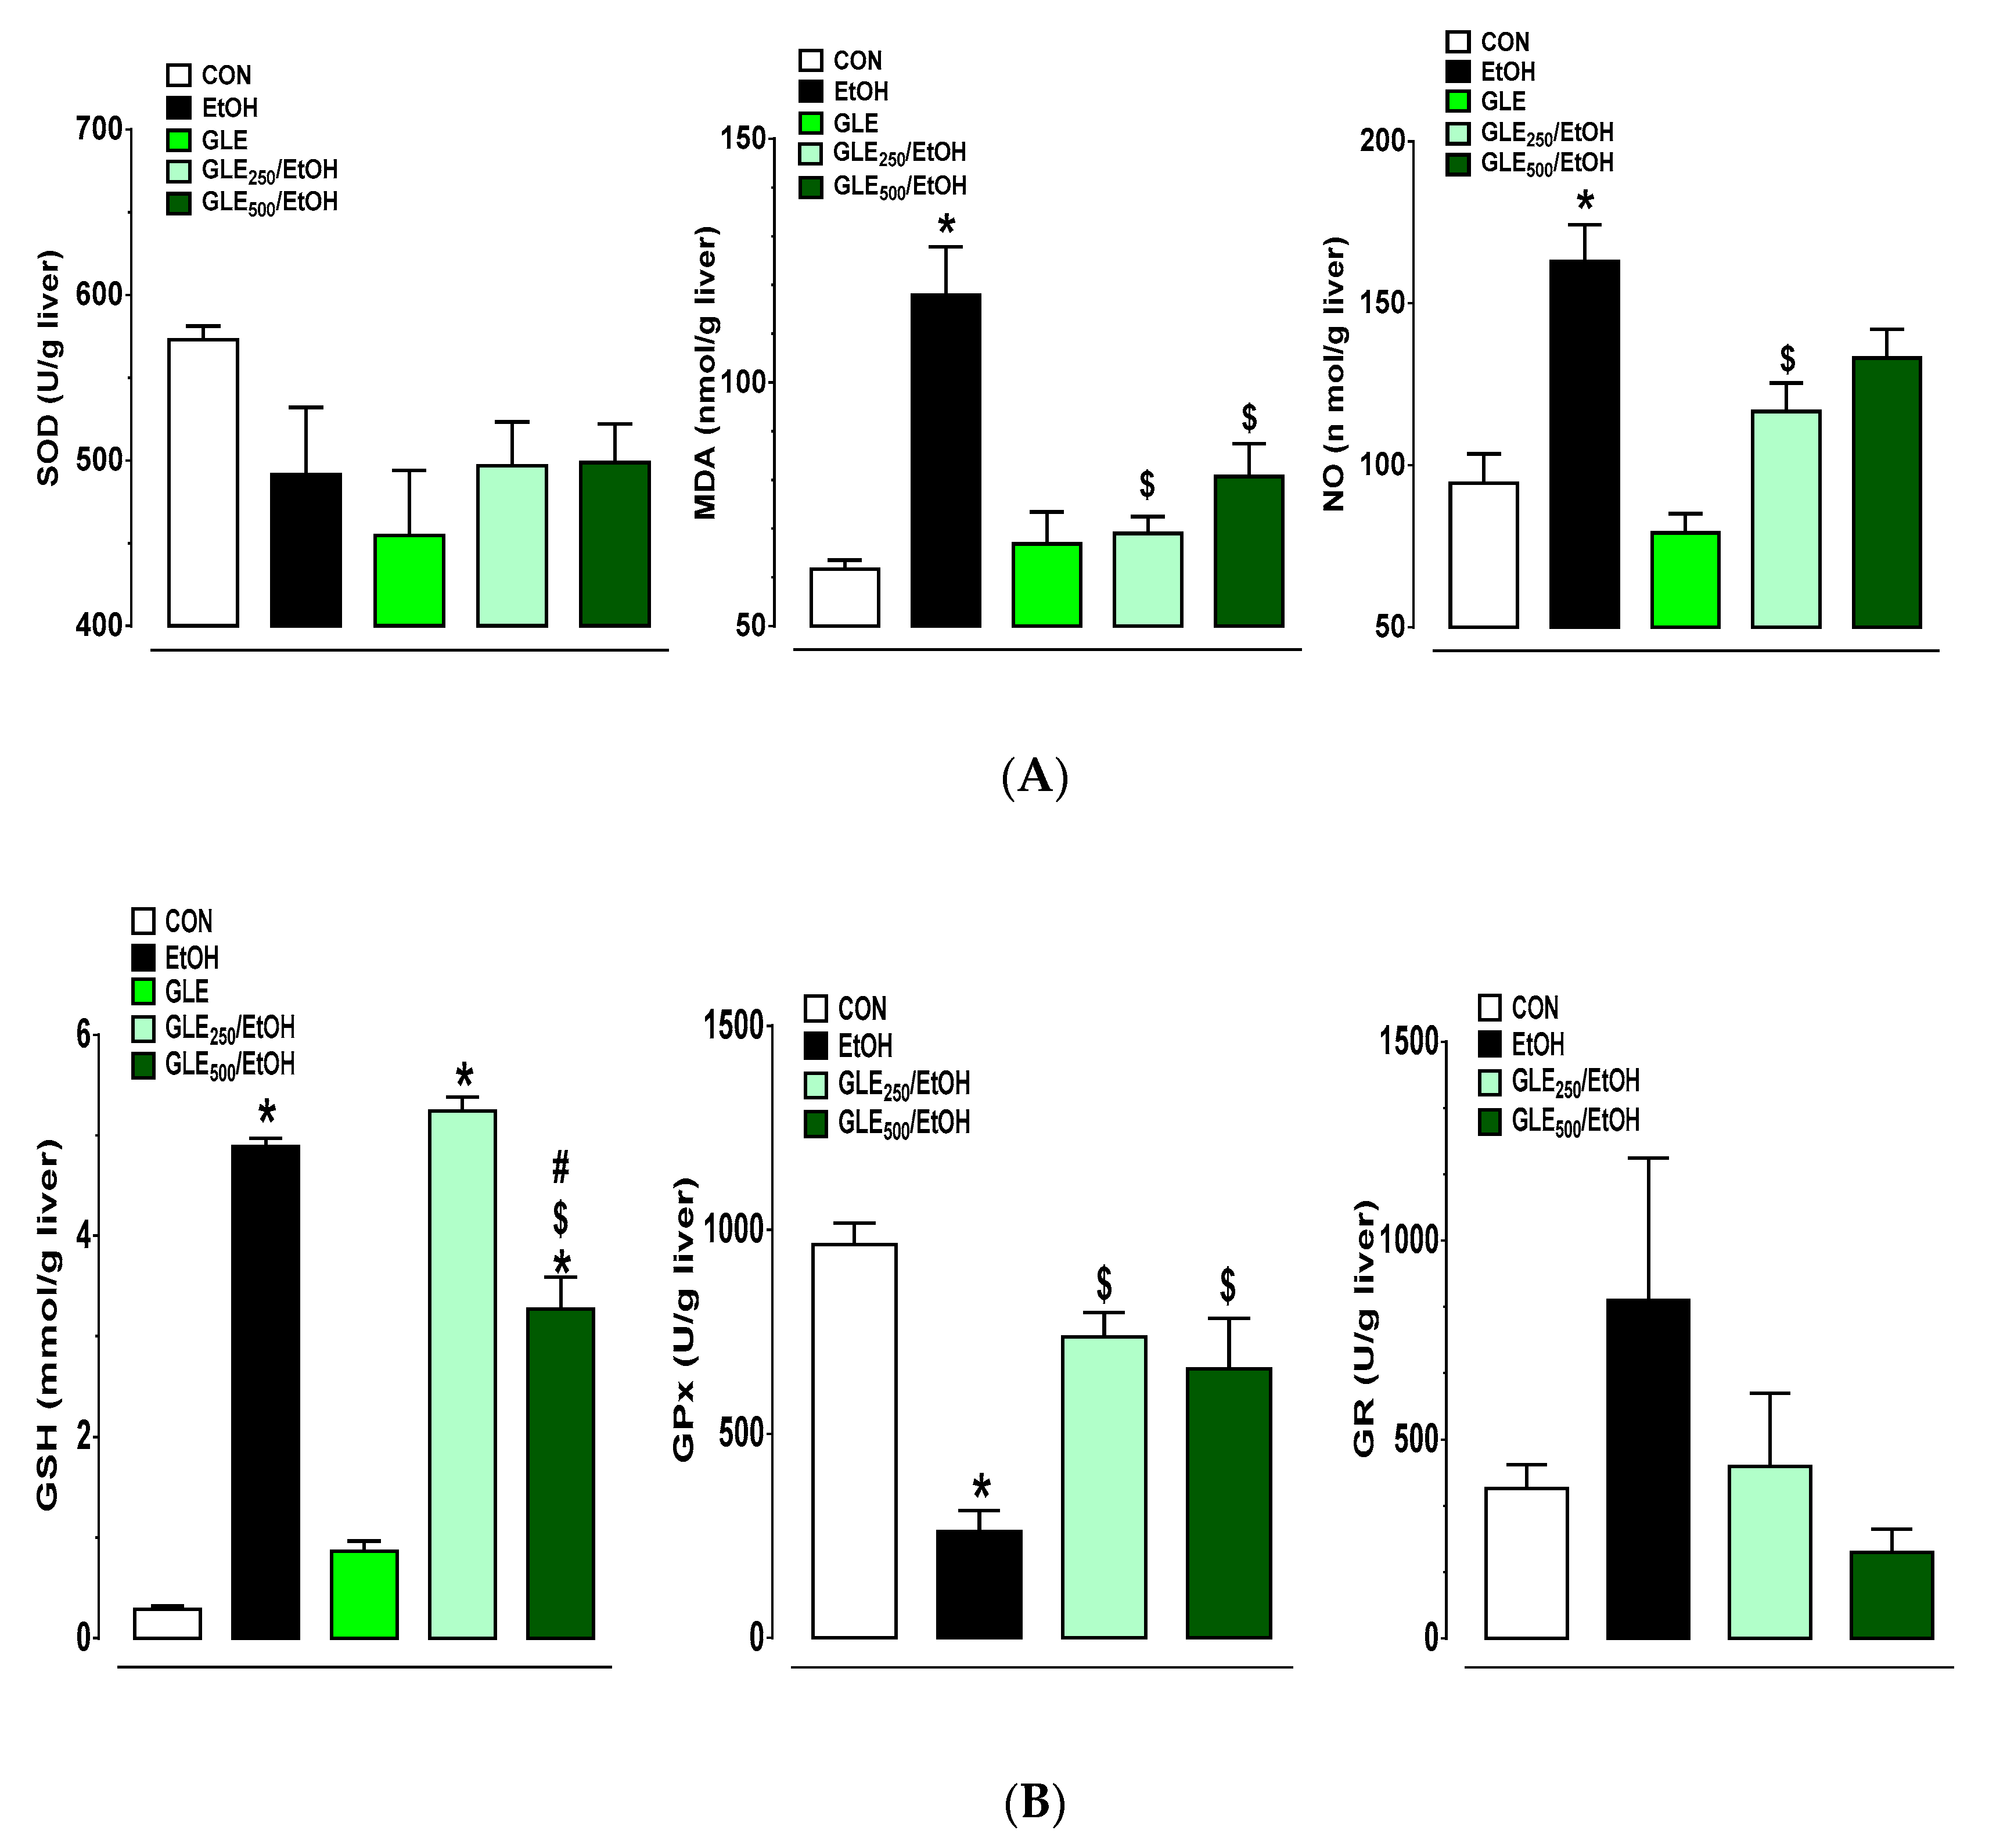
3.4. GLE Promotes Hepatic Antioxidant Defense in EtOH-Treated Rats
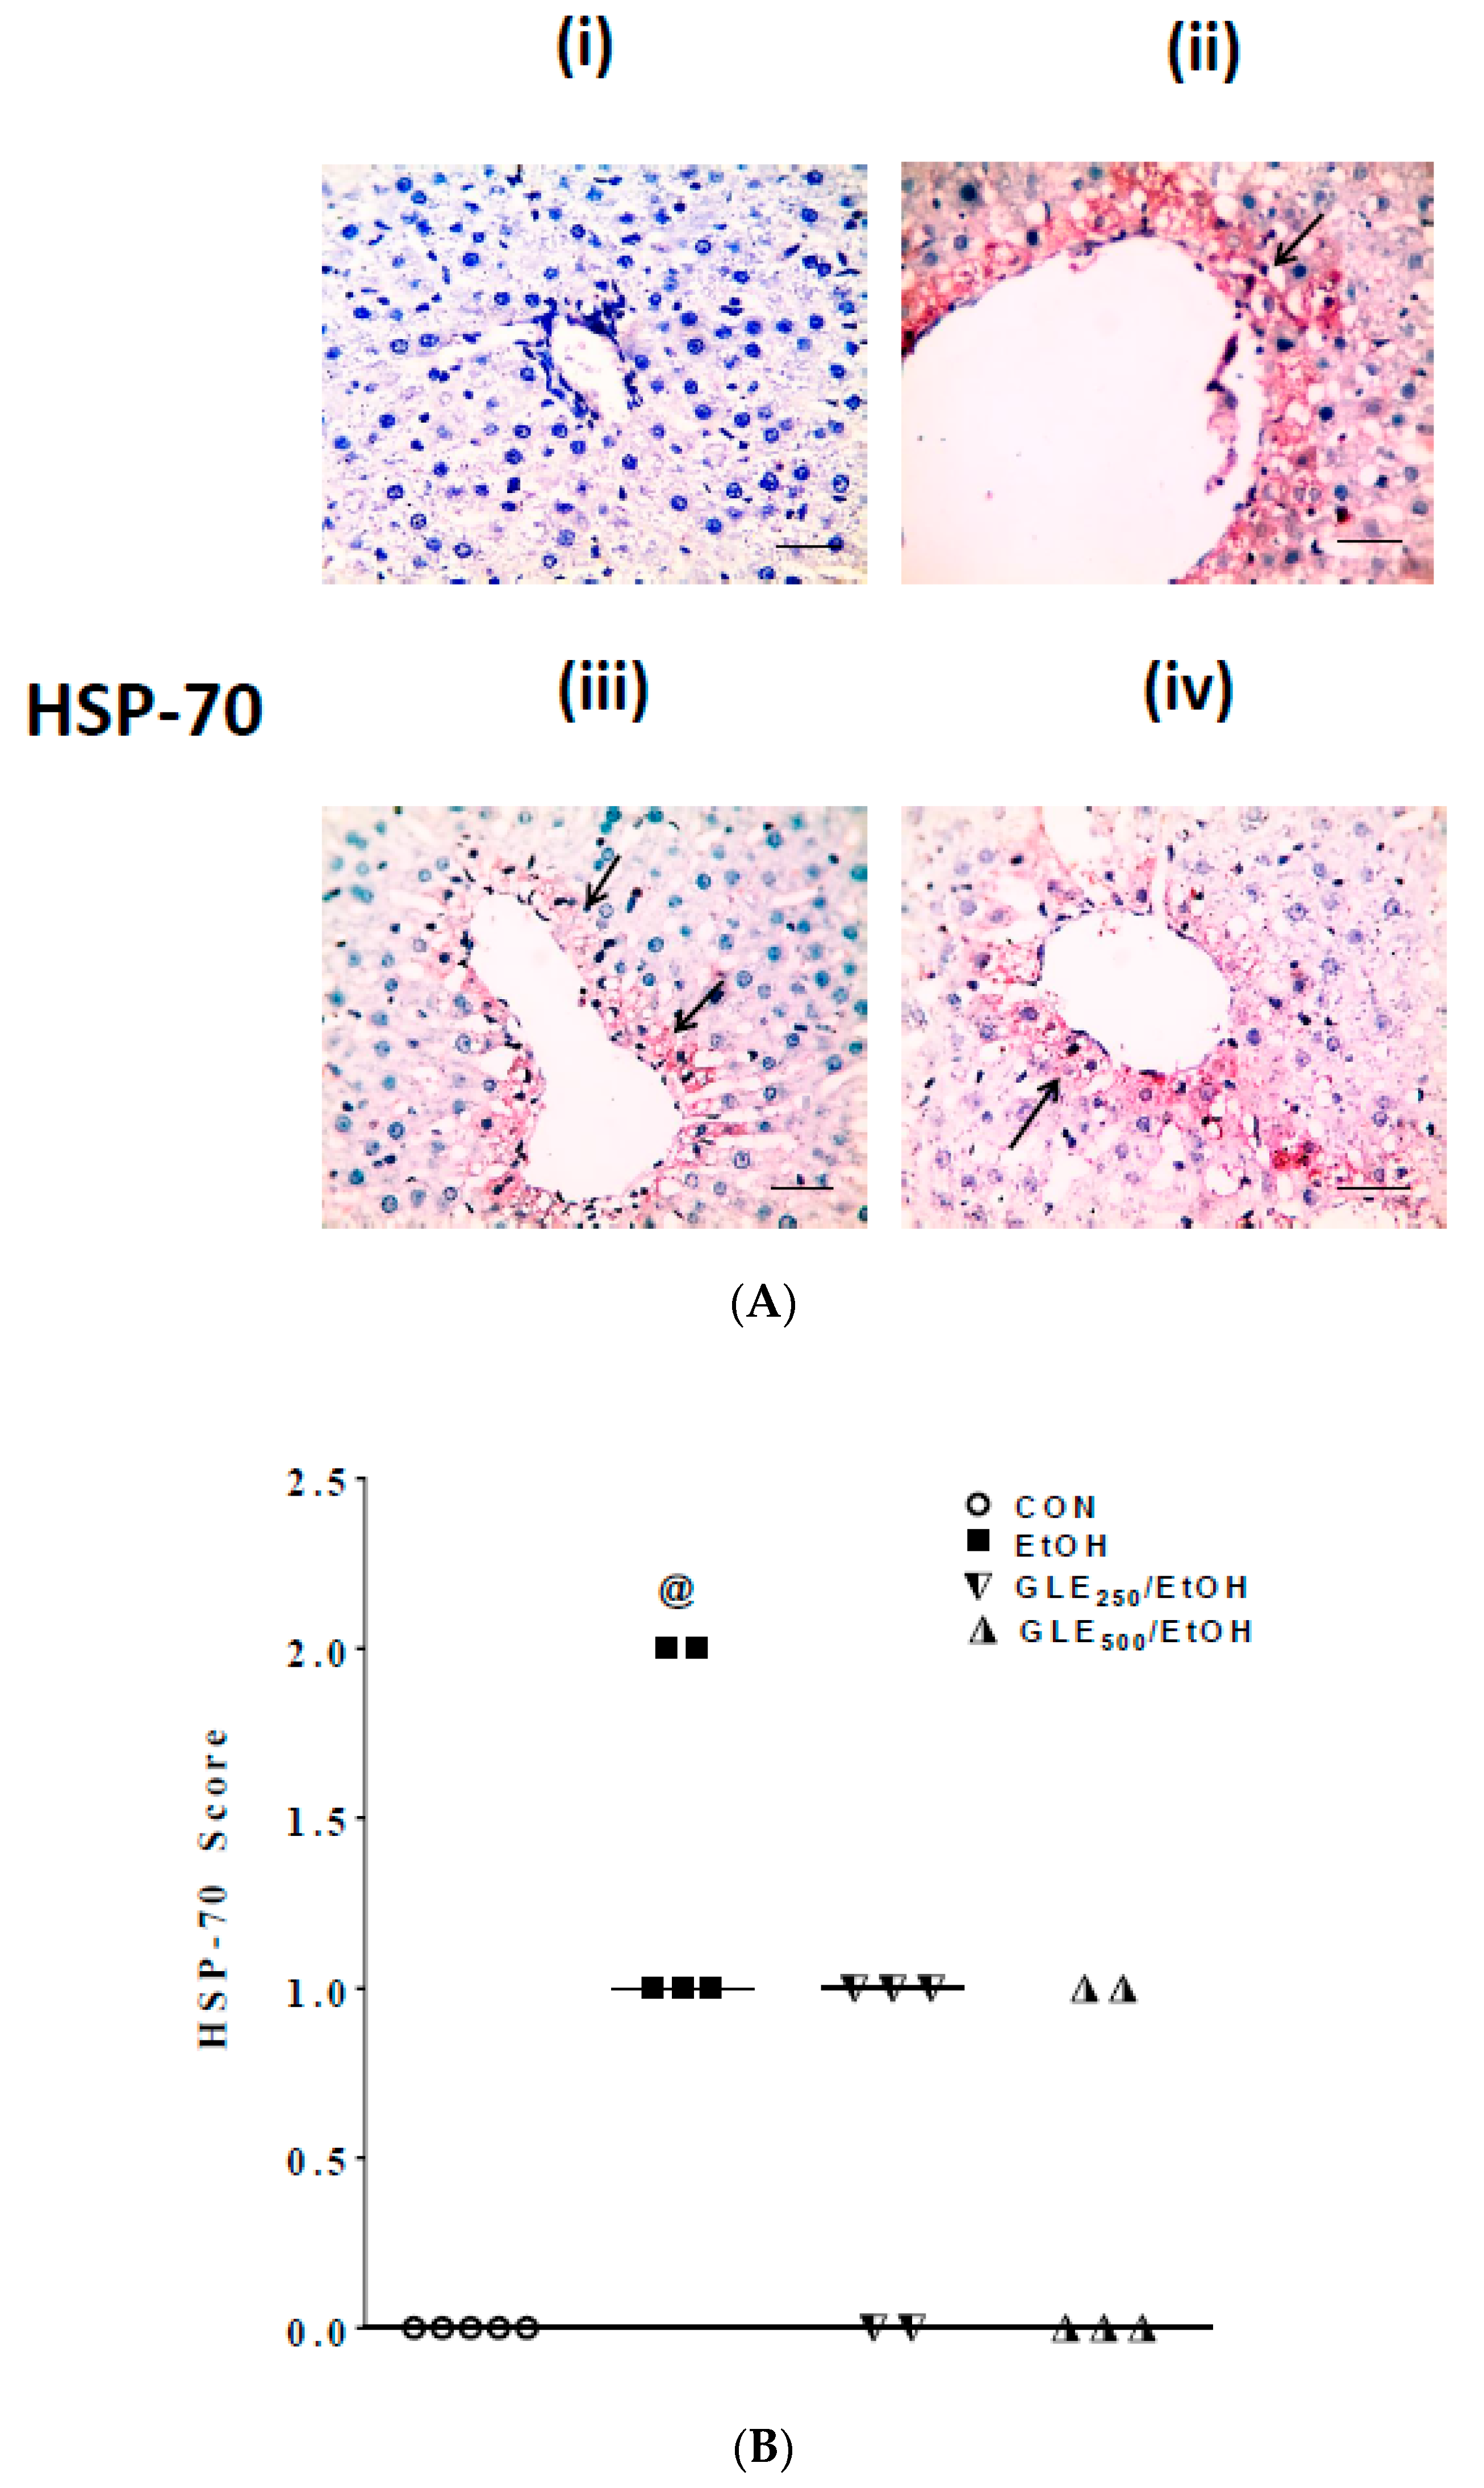
3.5. GLE Decreases HSP-70 Expression in Liver of EtOH-Treated Rats
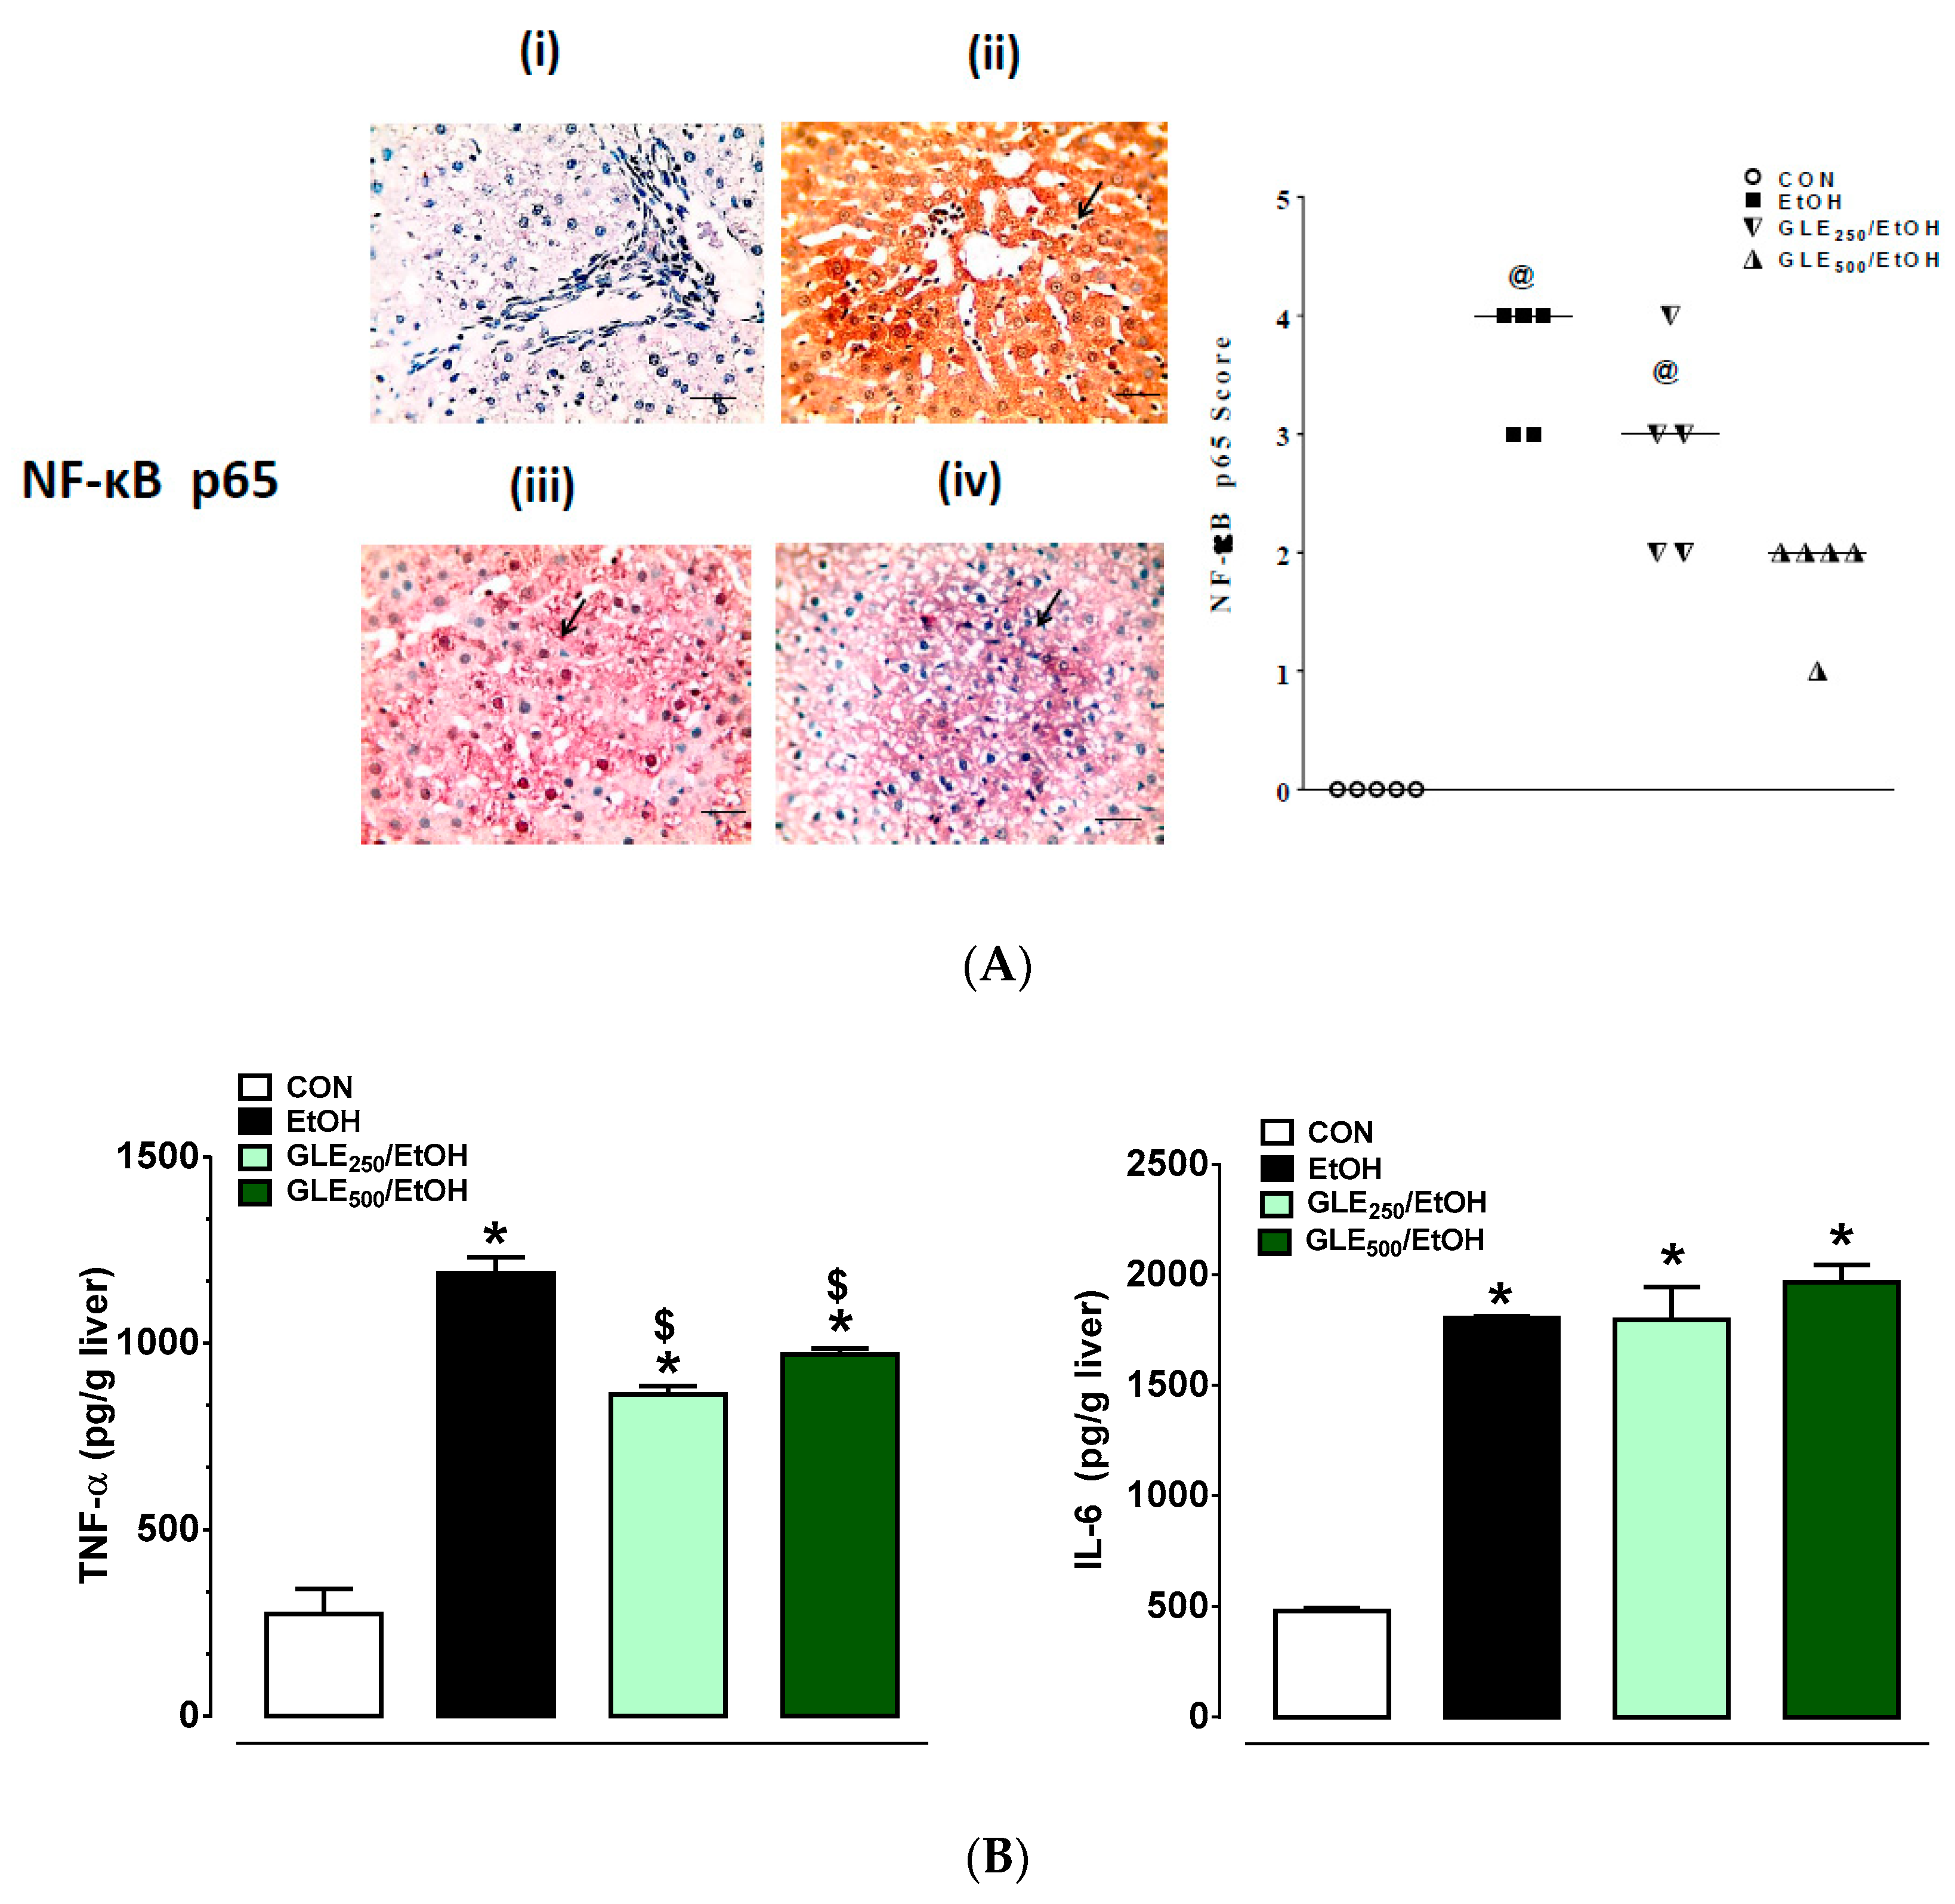
3.6. GLE Enhances Anti-Inflammatory Activity in Liver of EtOH-Treated Rats
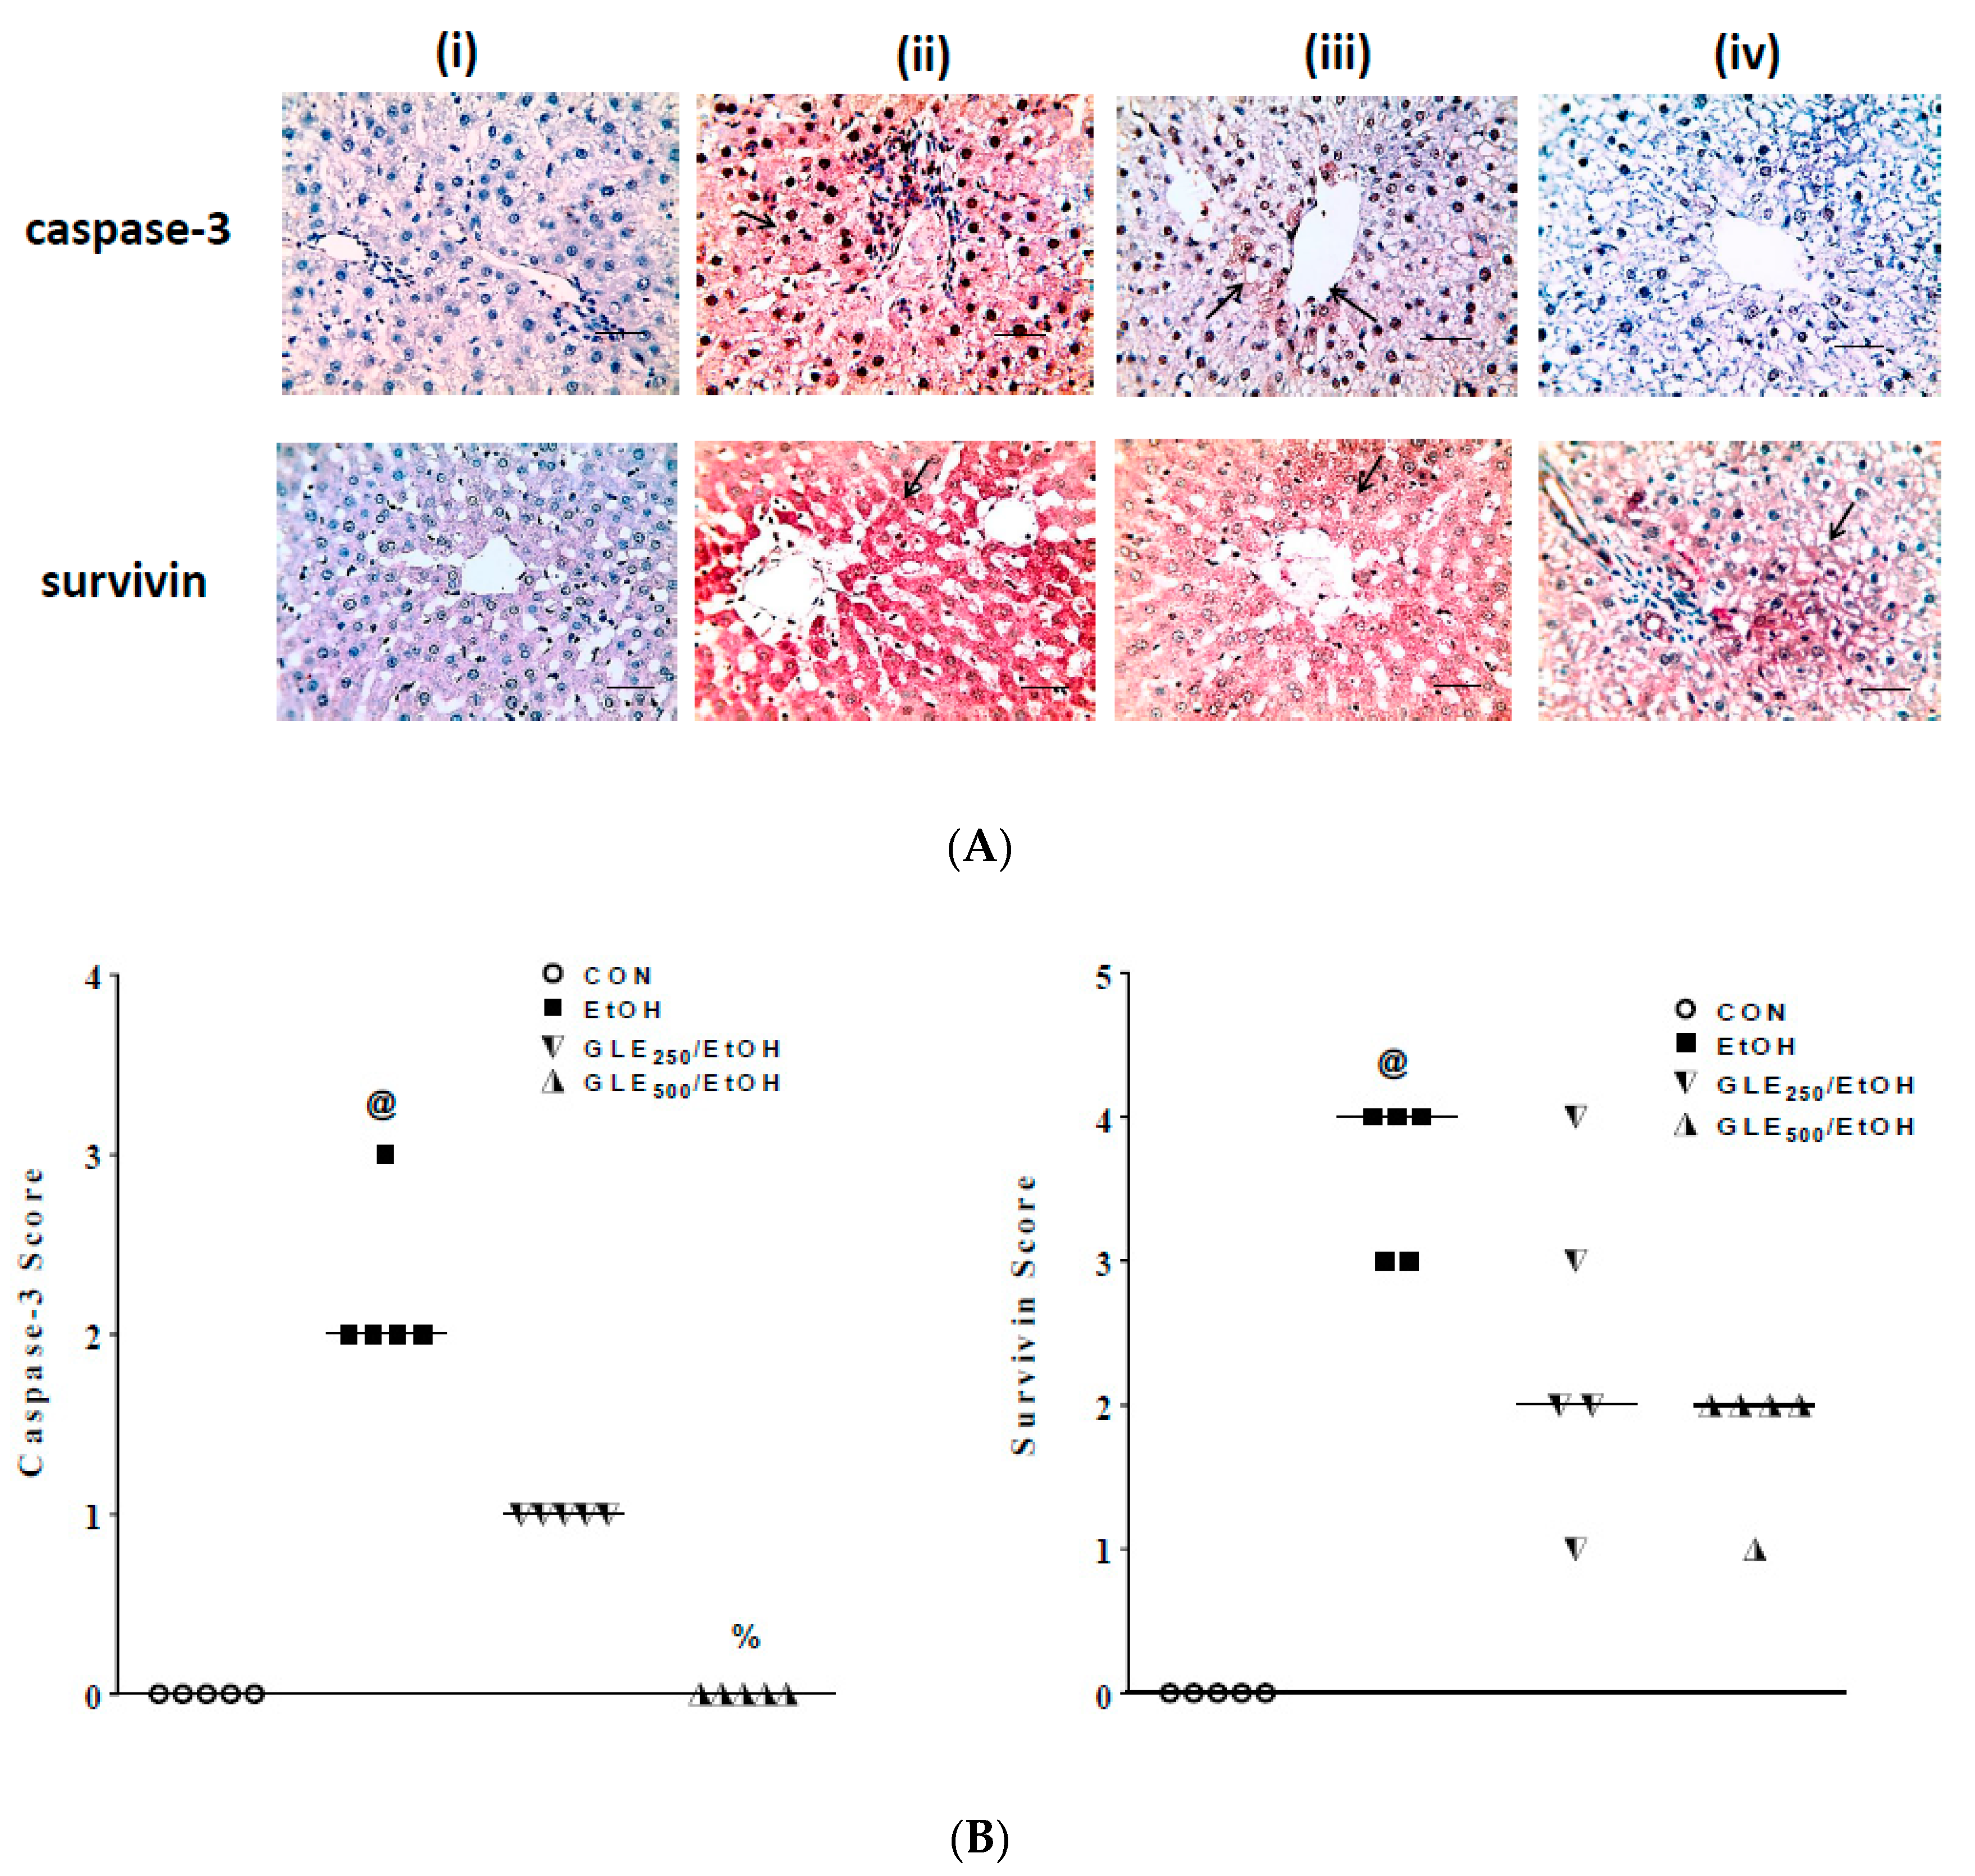
3.7. GLE Enhances Antiapoptotic Activity in Liver of EtOH-Treated Rats
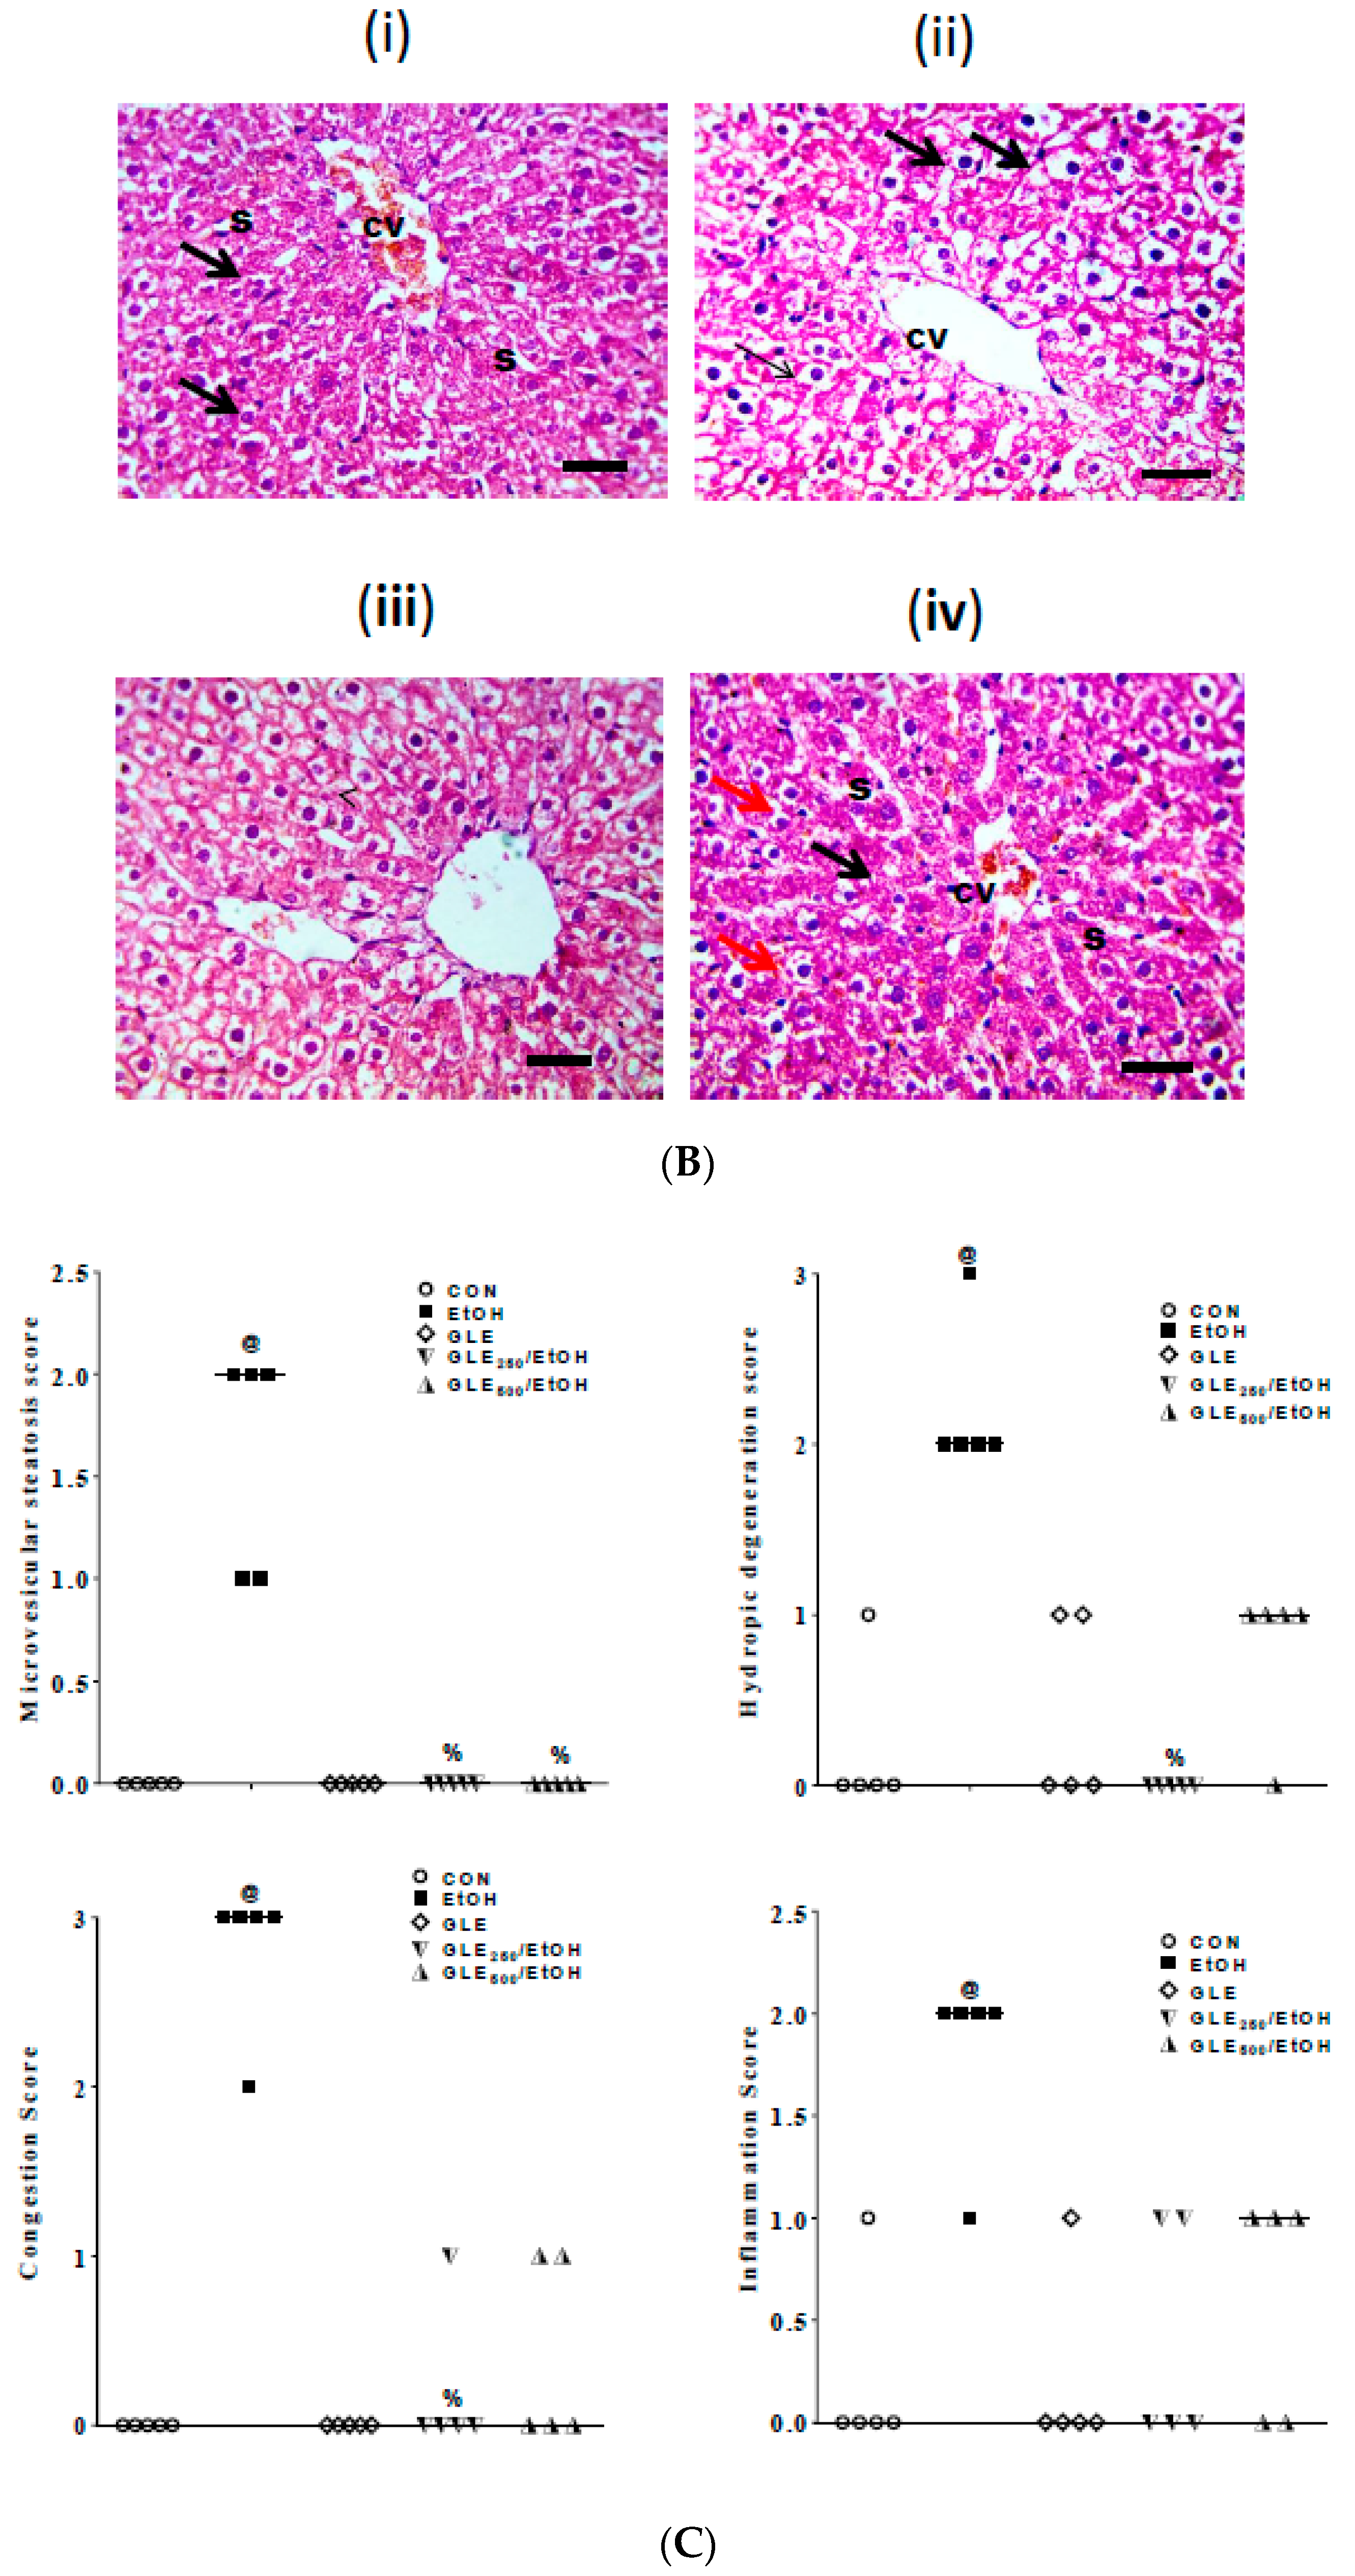
3.8. GLE Diminished EtOH-Induced StructuralLiver Alteration
4. Discussion
5. Conclusions
Supplementary Materials
Author Contributions
Funding
Acknowledgments
Conflicts of Interest
Abbreviations
| HPLC–PDA–ESI-MS | high-performance/pressure liquid chromatography–photodiode-array–electrospray ionization–mass spectrometry |
| ALK-p | alkaline phosphatase |
| ALT | alanine aminotransferase |
| AST | aspartate aminotransferase |
| CON | control |
| EtOH | ethanol |
| GGT | gamma-glutamyl transferase |
| GLE | grape leaf extract |
| GPx | glutathione peroxidase |
| GR | glutathione reductase |
| GSH | reduced glutathione |
| MDA | malondialdehyde |
| NF-κB | nuclear factor-κB |
| NO | nitric oxide |
| RNS | reactive nitrogen species |
| SOD | superoxide dismutase |
| TNF-α | tumor necrosis factor-α |
References
- Orhan, D.D.; Orhan, N.; Ergun, E.; Ergun, F. Hepatoprotective effect of Vitis vinifera L. leaves on carbon tetrachloride-induced acute liver damage in rats. J. Ethnopharmacol. 2007, 112, 145–151. [Google Scholar] [CrossRef]
- Granado-Serrano, A.B.; Martín, M.A.; Haegeman, G.; Goya, L.; Bravo, L.; Ramos, S. Epicatechin induces NF-κB, activator protein-1 (AP-1) and nuclear transcription factor erythroid 2p45-related factor-2 (Nrf2) via phosphatidylinositol-3-kinase/protein kinase B (PI3K/AKT) and extracellular regulated kinase (ERK) signalling in HepG2 cells. Br. J. Nutr. 2010, 103, 168–179. [Google Scholar] [CrossRef] [PubMed]
- Marina, R.; Gonzalez, P.; Carmen Ferreras, M.; Costilla, S.; Barrio, J.P. Hepatic Nrf2 expression is altered by quercetin supplementation in X.irradiated rats. Mol. Med. Rep. 2015, 11, 539–546. [Google Scholar] [CrossRef] [PubMed]
- Yang, J.H.; Kim, S.C.; Kim, K.M.; Jang, C.H.; Cho, S.S.; Kim, S.J.; Ku, S.K.; Cho, I.J.; Ki, S.H. Isorhamnetin attenuates liver fibrosis by inhibiting TGF-β/Smad signaling and relieving oxidative stress. Eur. J. Pharmacol. 2016, 783, 92–102. [Google Scholar] [CrossRef] [PubMed]
- Yang, S.-Y.; Pyo, M.C.; Nam, M.-H.; Lee, K.-W. ERK/Nrf2 pathway activation by caffeic acid in HepG2 cells alleviates its hepatocellular damage caused by t-butylhydroperoxide-induced oxidative stress. BMC Complement. Altern. Med. 2019, 19, 1–13. [Google Scholar] [CrossRef] [PubMed]
- Giribabu, N.; Eswar Kumar, K.; Swapna Rekha, S.; Muniandy, S.; Salleh, N. Vitis vinifera (Muscat Variety) Seed Ethanolic Extract Preserves Activity Levels of Enzymes and Histology of the Liver in Adult Male Rats with Diabetes. Evid. Based Complement. Altern. Med. 2015, 2015, 8. [Google Scholar] [CrossRef] [PubMed]
- Lieber, C.S. Cytochrome P-4502E1: Its physiological and pathological role. Physiol. Rev. 1997, 77, 517–544. [Google Scholar] [CrossRef] [PubMed]
- Enomoto, N.; Ikejima, K.; Bradford, B.U.; Rivera, C.A.; Kono, H.; Goto, M.; Yamashina, S.; Schemmer, P.; Kitamura, T.; Oide, H.; et al. Role of Kupffer cells and gut-derived endotoxins in alcoholic liver injury. J. Gastroenterol. Hepatol. 2000, 15, 20–25. [Google Scholar] [CrossRef]
- Basra, S.; Anand, B.S. Definition, epidemiology and magnitude of alcoholic hepatitis. World J. Hepatol. 2011, 3, 108–113. [Google Scholar] [CrossRef]
- Sobeh, M.; Hassan, S.; El Raey, M.; Khalil, W.; Hassan, M.; Wink, M. Polyphenolics from Albizia harveyi exhibit antioxidant activities and counteract oxidative damage and ultra-structural changes of cryopreserved bull semen. Molecules 2017, 22, 1993. [Google Scholar] [CrossRef]
- Scott, R.B.; Reddy, K.S.; Husain, K.; Schlorff, E.C.; Rybak, L.P.; Somani, S.M. Dose response of ethanol on antioxidant defense system of liver, lung, and kidney in rat. Pathophysiology 2000, 7, 25–32. [Google Scholar] [CrossRef]
- Pari, L.; Suresh, A. Effect of grape (Vitis vinifera L.) leaf extract on alcohol induced oxidative stress in rats. Food Chem. Toxicol. 2008, 46, 1627–1634. [Google Scholar] [CrossRef] [PubMed]
- Piao, Y.; Liu, Y.; Xie, X. Change trends of organ weight background data in sprague dawley rats at different ages. J. Toxicol. Pathol. 2013, 26, 29–34. [Google Scholar] [CrossRef] [PubMed]
- Abdelrahman, R.S.; Abdel-Rahman, N. Dimethyl fumarate ameliorates acetaminophen-induced hepatic injury in mice dependent of Nrf-2/HO-1 pathway. Life Sci. 2019, 217, 251–260. [Google Scholar] [CrossRef]
- Shawky, N.M.; Shehatou, G.S.G.; Suddek, G.M.; Gameil, N.M. Comparison of the effects of sulforaphane and pioglitazone on insulin resistance and associated dyslipidemia, hepatosteatosis, and endothelial dysfunction in fructose-fed rats. Environ. Toxicol. Pharmacol. 2019, 66, 43–54. [Google Scholar] [CrossRef]
- Abdelrahman, R.S. Protective effect of apocynin against gentamicin-induced nephrotoxicity in rats. Hum. Exp. Toxicol. 2018, 37, 27–37. [Google Scholar] [CrossRef]
- Shawky, N.M.; Shehatou, G.S.; Abdel Rahim, M.; Suddek, G.M.; Gameil, N.M. Levocetirizine ameliorates high fructose diet-induced insulin resistance, vascular dysfunction and hepatic steatosis in rats. Eur. J. Pharmacol. 2014, 740, 353–363. [Google Scholar] [CrossRef]
- Kohli, R.; Kirby, M.; Xanthakos, S.A.; Softic, S.; Feldstein, A.E.; Saxena, V.; Tang, P.H.; Miles, L.; Miles, M.V.; Balistreri, W.F.; et al. High-fructose, medium chain trans fat diet induces liver fibrosis and elevates plasma coenzyme Q9 in a novel murine model of obesity and nonalcoholic steatohepatitis. Hepatology 2010, 52, 934–944. [Google Scholar] [CrossRef]
- Guesdon, J.-L.; Ternynck, T.; Avrameas, S. The use of avidin-biotin interaction in immunoenzymatic techniques. J. Histochem. Cytochem. 1979, 27, 1131–1139. [Google Scholar] [CrossRef]
- Hinners, P.; O’Neill, K.C.; Lee, Y.J. Revealing Individual Lifestyles through Mass Spectrometry Imaging of Chemical Compounds in Fingerprints. Sci. Rep. 2018, 8, 1–10. [Google Scholar] [CrossRef]
- Kammerer, D.; Claus, A.; Carle, R.; Schieber, A. Polyphenol screening of Pomace from red and white grape varieties (Vitis vinifera L.) by HPLC-DAD-MS/MS. J. Agric. Food Chem. 2004, 52, 4360–4367. [Google Scholar] [CrossRef] [PubMed]
- Mostafa, I.; Abbas, H.A.; Ashour, M.L.; Yasri, A.; El-Shazly, A.M.; Wink, M.; Sobeh, M. Polyphenols from Salix tetrasperma impair virulence and inhibit Quorum sensing of Pseudomonas aeruginosa. Molecules 2020, 25, 1341. [Google Scholar] [CrossRef] [PubMed]
- Chen, H.-J.; Inbaraj, B.S.; Chen, B.-H. Determination of phenolic acids and flavonoids in Taraxacum formosanum Kitam by liquid chromatography-tandem mass spectrometry coupled with a post-column derivatization technique. Int. J. Mol. Sci. 2012, 13, 260–285. [Google Scholar] [CrossRef] [PubMed]
- Sobeh, M.; ElHawary, E.; Peixoto, H.; Labib, R.M.; Handoussa, H.; Swilam, N.; El-Khatib, A.H.; Sharapov, F.; Mohamed, T.; Krstin, S.; et al. Identification of phenolic secondary metabolites from Schotia brachypetala Sond. (Fabaceae) and demonstration of their antioxidant activities in Caenorhabditis elegans. PeerJ 2016, 4, e2404. [Google Scholar] [CrossRef] [PubMed]
- Rodríguez-Pérez, C.; Gómez-Caravaca, A.M.; Guerra-Hernández, E.; Cerretani, L.; García-Villanova, B.; Verardo, V. Comprehensive metabolite profiling of Solanum tuberosum L. (potato) leaves by HPLC-ESI-QTOF-MS. Food Res. Int. 2018, 112, 390–399. [Google Scholar] [CrossRef] [PubMed]
- Spínola, V.; Castilho, P.C. Evaluation of Asteraceae herbal extracts in the management of diabetes and obesity. Contribution of caffeoylquinic acids on the inhibition of digestive enzymes activity and formation of advanced glycation end-products. Phytochemistry 2017, 143, 29–35. [Google Scholar] [CrossRef]
- Sobeh, M.; Mahmoud, M.F.; Hasan, R.A.; Abdelfattah, M.A.; Sabry, O.M.; Ghareeb, M.A.; El-Shazly, A.M.; Wink, M. Tannin-rich extracts from Lannea stuhlmannii and Lannea humilis (Anacardiaceae) exhibit hepatoprotective activities in vivo via enhancement of the anti-apoptotic protein Bcl-2. Sci. Rep. 2018, 8, 1–6. [Google Scholar] [CrossRef]
- Jaiswal, R.; Jayasinghe, L.; Kuhnert, N. Identification and characterization of proanthocyanidins of 16 members of the Rhododendron genus (Ericaceae) by tandem LC-MS. J. Mass Spectrom. 2012, 47, 502–515. [Google Scholar] [CrossRef]
- Plazonić, A.; Bucar, F.; Maleš, Ž.; Mornar, A.; Nigović, B.; Kujundžić, N. Identification and quantification of flavonoids and phenolic acids in Burr Parsley (Caucalis platycarpos L.), using high-performance liquid chromatography with diode array detection and electrospray ionization mass spectrometry. Molecules 2009, 14, 2466–2490. [Google Scholar] [CrossRef]
- Sobeh, M.; Mahmoud, M.F.; Petruk, G.; Rezq, S.; Ashour, M.L.; Youssef, F.S.; El-Shazly, A.M.; Monti, D.M.; Abdel-Naim, A.B.; Wink, M. Syzygium aqueum: A polyphenol-rich leaf extract exhibits antioxidant, hepatoprotective, pain-killing and anti-inflammatory activities in animal models. Front. Pharmacol. 2018, 5, 566. [Google Scholar] [CrossRef]
- Sobeh, M.; Youssef, F.S.; Esmat, A.; Petruk, G.; El-Khatib, A.H.; Monti, D.M.; Ashour, M.L.; Wink, M. High resolution UPLC-MS/MS profiling of polyphenolics in the methanol extract of Syzygium samarangense leaves and its hepatoprotective activity in rats with CCl4-induced hepatic damage. Food Chem. Toxicol. 2018, 113, 145–153. [Google Scholar] [CrossRef] [PubMed]
- Sobeh, M.; Mahmoud, M.F.; Rezq, S.; Alsemeh, A.E.; Sabry, O.M.; Mostafa, I.; Abdelfattah, M.A.; Ait El-Allem, K.; El-Shazly, A.M.; Yasri, A.; et al. Salix tetrasperma Roxb. extract alleviates neuropathic pain in rats via modulation of the NF-κB/TNF-α/NOX/iNOS pathway. Antioxidants 2019, 10, 482. [Google Scholar] [CrossRef] [PubMed]
- Hofmann, T.; Nebehaj, E.; Albert, L. Antioxidant properties and detailed polyphenol profiling of European hornbeam (Carpinus betulus L.) leaves by multiple antioxidant capacity assays and high-performance liquid chromatography/multistage electrospray mass spectrometry. Ind. Crops Prod. 2016, 87, 340–349. [Google Scholar] [CrossRef]
- Oh, S.I.; Kim, C.I.; Chun, H.J.; Park, S.C. Chronic ethanol consumption affects glutathione status in rat liver. J. Nutr. 1998, 128, 758–763. [Google Scholar] [CrossRef] [PubMed]
- Mandrekar, P. Signaling mechanisms in alcoholic liver injury: Role of transcription factors, kinases and heat shock proteins. World J. Gastroenterol. 2007, 13, 4979–4985. [Google Scholar] [CrossRef] [PubMed]
- Guicciardi, M.E.; Gores, G.J. Apoptosis: A mechanism of acute and chronic liver injury. Gut 2005, 54, 1024–1033. [Google Scholar] [CrossRef] [PubMed]
- Chen, H.-H.; Chiang, W.; Chang, J.-Y.; Chien, Y.-L.; Lee, C.-K.; Liu, K.-J.; Cheng, Y.-T.; Chen, T.-F.; Kuo, Y.-H.; Kuo, C.-C. Antimutagenic constituents of adlay (Coix lachryma-jobi L. var. ma-yuen Stapf) with potential cancer chemopreventive activity. J. Agric. Food Chem. 2011, 59, 6444–6452. [Google Scholar] [CrossRef]
- Oekonomaki, E.; Notas, G.; Mouzas, I.A.; Valatas, V.; Skordilis, P.; Xidakis, C.; Kouroumalis, E.A. Binge drinking and nitric oxide metabolites in chronic liver disease. Alcohol Alcohol. 2004, 39, 106–109. [Google Scholar] [CrossRef][Green Version]
- Samuhasaneeto, S.; Thong-Ngam, D.; Kulaputana, O.; Suyasunanont, D.; Klaikeaw, N. Curcumin decreased oxidative stress, inhibited NF-B activation, and improved liver pathology in ethanol-induced liver injury in rats. J. Biomed. Biotechnol. 2009, 2009, 8. [Google Scholar] [CrossRef]
- Yang, S.-C.; Huang, C.-C.; Chu, J.-S.; Chen, J.-R. Effects of β-carotene on cell viability and antioxidant status of hepatocytes from chronically ethanol-fed rats. Br. J. Nutr. 2007, 92, 209–215. [Google Scholar] [CrossRef]
- Pallauf, K.; Duckstein, N.; Hasler, M.; Klotz, L.O.; Rimbach, G. Flavonoids as putative inducers of the transcription factors Nrf2, FoxO, and PPAR γ. Oxid. Med. Cell. Longev. 2017. [Google Scholar] [CrossRef] [PubMed]
- Kim, C.S.; Choi, H.S.; Joe, Y.; Chung, H.T.; Yu, R. Induction of heme oxygenase-1 with dietary quercetin reduces obesity-induced hepatic inflammation through macrophage phenotype switching. Nutr. Res. Pract. 2016, 10, 623–628. [Google Scholar] [CrossRef] [PubMed]
- Ajiboye, T.O.; Ajala-Lawal, R.A.; Adeyiga, A.B. Caffeic acid abrogates 1,3-dichloro-2-propanol-induced hepatotoxicity by upregulating nuclear erythroid-related factor 2 and downregulating nuclear factor-kappa B. Hum. Exp. Toxicol. 2019, 38, 1092–1101. [Google Scholar] [CrossRef] [PubMed]
- Domitrović, R.; Škoda, M.; Vasiljev Marchesi, V.; Cvijanović, O.; Pernjak Pugel, E.; Štefan, M.B. Rosmarinic acid ameliorates acute liver damage and fibrogenesis in carbon tetrachloride-intoxicated mice. Food Chem. Toxicol. 2013, 51, 370–378. [Google Scholar] [CrossRef]
- Ding, Y.; Zhang, Z.; Yue, Z.; Ding, L.; Zhou, Y.; Huang, Z.; Huang, H. Rosmarinic Acid Ameliorates H2O2-Induced Oxidative Stress in L02 Cells Through MAPK and Nrf2 Pathways. Rejuvenation Res. 2019, 22, 289–298. [Google Scholar] [CrossRef]
- Kim, D.W.; Cho, H.I.; Kim, K.M.; Kim, S.J.; Choi, J.S.; Kim, Y.S.; Lee, S.M. Isorhamnetin-3-O-galactoside protects against CCl4-induced hepatic injury in mice. Biomol. Ther. 2012, 20, 406–412. [Google Scholar] [CrossRef][Green Version]
- Madi Almajwal, A.; Farouk Elsadek, M. Lipid-lowering and hepatoprotective effects of Vitis vinifera dried seeds on paracetamol-induced hepatotoxicity in rats. Nutr. Res. Pract. 2015, 9, 37–42. [Google Scholar] [CrossRef]
- Liu, J. Ethanol and liver: Recent insights into the mechanisms of ethanol-induced fatty liver. World J. Gastroenterol. 2014, 20, 14672–14685. [Google Scholar] [CrossRef]
- Singal, A.K.; Jampana, S.C.; Weinman, S.A. Antioxidants as therapeutic agents for liver disease. Liver Int. 2011, 31, 1432–1448. [Google Scholar] [CrossRef]
- Day, C.P. Treatment of alcoholic liver disease. Liver Transpl. 2007, 13, S69–S75. [Google Scholar] [CrossRef]
- Wang, K.; Brems, J.J.; Gamelli, R.L.; Holterman, A.-X. Survivin signaling is regulated through nuclear factor-kappa B pathway during glycochenodeoxycholate-induced hepatocyte apoptosis. Biochim. Biophys. Acta Mol. Cell Res. 2010, 1803, 1368–1375. [Google Scholar] [CrossRef] [PubMed]
- Wang, K.; Lin, B. Pathophysiological significance of hepatic apoptosis. ISRN Hepatol. 2013, 14. [Google Scholar] [CrossRef] [PubMed]
- Lubos, E.; Loscalzo, J.; Handy, D.E. Glutathione peroxidase-1 in health and disease: From molecular mechanisms to therapeutic opportunities. Antioxid. Redox Signal. 2011, 15, 1957–1997. [Google Scholar] [CrossRef] [PubMed]
- Abdel-Salam, O.M.E.; El-Shamarka, M.E.-S.; Omara, E.A. Grape seed extract exerts an anti-apoptotic effect and attenuates the decrease in striatal tyrosine hydroxylase in rotenone-treated mice. React. Oxyg. Species 2019, 7, 30–46. [Google Scholar] [CrossRef]
- Abdou, H.M.; Wahby, M.M. Neuroprotection of grape seed extract and pyridoxine against triton-induced neurotoxicity. Oxid. Med. Cell. Longev. 2016, 2016, 8. [Google Scholar] [CrossRef] [PubMed]
- Zhao, L.; Zhang, N.; Yang, D.; Yang, M.; Guo, X.; He, J.; Wu, W.; Ji, B.; Cheng, Q.; Zhou, F. Protective effects of five structurally diverse flavonoid subgroups against chronic alcohol-induced hepatic damage in a mouse model. Nutrients 2018, 10, 1754. [Google Scholar] [CrossRef]
- Hu, C.M.; Cao, Q.; Lv, X.W.; Cheng, W.M.; Li, R.; Li, J. Protective effects of total flavonoids from Litsea coreana on alcoholic fatty liver in rats associated with down-regulation adipose differentiation- related protein expression. Am. J. Chin. Med. 2012, 40, 599–610. [Google Scholar] [CrossRef]
- Peres, W.; Tuón, M.J.; Collado, P.S.; Herrmann, S.; Marroni, N.; González-Gallego, J. The flavonoid quercetin ameliorates liver damage in rats with biliary obstruction. J. Hepatol. 2000, 33, 742–750. [Google Scholar] [CrossRef]
- Pavanato, A.; Tuñón, M.J.; Sánchez-Campos, S.; Marroni, C.A.; Llesuy, S.; González-Gallego, J.; Marroni, N. Effects of quercetin on liver damage in rats with carbon tetrachloride-induced cirrhosis. Dig. Dis. Sci. 2003, 48, 824–829. [Google Scholar] [CrossRef]
- Wink, M. Modes of action of herbal medicines and plant secondary metabolites. Medicines 2015, 2, 251–286. [Google Scholar] [CrossRef]


| CON | GLE | EtOH | GLE250/EtOH | GLE500/EtOH | |
|---|---|---|---|---|---|
| Ethanol (6g/kg, orally) | √ | √ | √ | ||
| Distilled water (vehicle for ethanol) | √ | √ | |||
| GLE (250 mg/kg, orally) | √ | ||||
| GLE (500 mg/kg, orally) | √ | √ | |||
| Distilled water containing < 3% absolute ethanol (vehicle for GLE) | √ | √ |
| No. | tR (min) | [M-H]- | MS/MS Fragments | Tentatively Identified Compound | Ref. |
|---|---|---|---|---|---|
| 1 | 1.03 | 149 | 59, 87, 102 | Tartaric acid | [21] |
| 2 | 1.70 | 191 | 111, 173 | Citric acid | [21] |
| 3 | 1.79 | 133 | 115 | Malic acid | [22] |
| 4 | 1.88 | 311 | 149, 179 | Caftaric acid | |
| 5 | 2.69 | 295 | 149, 163 | Coutaric acid | |
| 6 | 2.92 | 325 | 193 | Fertaric acid | |
| 7 | 3.28 | 299 | 137 | p-hydroxybenzoic acid-O-hexoside | |
| 8 | 3.84 | 331 | 125, 169 | Monogalloyl glucose | [23] |
| 9 | 4.94 | 315 | 153 | Protocatechuic acid-O-hexoside | |
| 10 | 5.52 | 341 | 135, 179 | Caffeic acid-O-hexoside | [24] |
| 11 | 5.72 | 164 | 147 | Phenylalanine | [25] |
| 12 | 5.82 | 315 | 153 | Protocatechuic acid-O-hexoside | |
| 13 | 6.18 | 509 | 347 | Unknown | |
| 14 | 7.39 | 503 | 179, 297, 341 | Caffeic acid-O-dihexoside | [26] |
| 15 | 9.74 | 341 | 135, 161, 179 | Caffeic acid-O-hexoside | [24] |
| 16 | 11.29 | 577 | 289, 407, 451 | B-type procyanidin dimer | [23] |
| 17 | 13.68 | 865 | 289, 407, 577 | B-type procyanidin trimer | |
| 18 | 13.90 | 639 | 301, 463, 477 | Quercetin O- glucosyl glucuronide | |
| 19 | 14.17 | 289 | 179, 205, 245 | Catechin | [27] |
| 20 | 14.42 | 865 | 287, 407, 425, 577 | B-type procyanidin trimer | |
| 21 | 15.23 | 289 | 179, 205, 245 | Epicatechin | [27] |
| 22 | 15.65 | 625 | 301, 463 | Quercetin-O-hexoside-O-hexoside | [24] |
| 23 | 17.19 | 625 | 463 | Quercetin-O-hexoside-O-hexoside | [24] |
| 24 | 17.57 | 521 | 359 | Rosmarinic acid-O-hexoside | [28] |
| 25 | 19.45 | 521 | 359 | Rosmarinic acid-O-hexoside | [28] |
| 26 | 20.59 | 477 | 151, 179, 301 | Quercetin glucuronide | [29] |
| 27 | 21.83 | 477 | 151, 179, 301 | Quercetin glucuronide | [29] |
| 28 | 22.94 | 477 | 179, 301, 315 | Isorhamnetin-O-hexoside | [30] |
| 29 | 23.48 | 625 | 463 | Quercetin-O-hexoside-O-hexoside | [24] |
| 30 | 25.85 | 477 | 301, 315 | Isorhamnetin-O-hexoside | [30] |
| 31 | 26.10 | 479 | 179, 316, 317 | Myricetin-O-hexoside | [30] |
| 32 | 26.63 | 477 | 301, 315 | Isorhamnetin-O-hexoside | [30] |
| 33 | 27.49 | 595 | 179, 271, 301 | Quercetin-O-pentoside-O-hexoside | [27] |
| 34 | 27.54 | 505 | 300, 301, 463 | Quercetin-O-(acetyl)hexoside | |
| 35 | 30.88 | 609 | 179, 271, 301, 463 | Quercetin-O-rhamnoside-O-hexoside | [31] |
| 36 | 31.48 | 463 | 179, 255, 271, 301 | Quercetin-O-hexoside | [31] |
| 37 | 32.67 | 463 | 179, 255, 271, 301 | Quercetin-O-hexoside | [31] |
| 38 | 32.79 | 463 | 179, 271, 301 | Quercetin-O-hexoside | [31] |
| 39 | 33.05 | 433 | 151, 179, 301 | Quercetin-O-pentoside | [31] |
| 40 | 33.63 | 447 | 284, 285, 327 | Kaempferol-O-hexoside | [32] |
| 41 | 35.17 | 623 | 300, 315 | Isorhamnetin-O-coumaroyl-O-hexoside | |
| 42 | 35.27 | 447 | 284, 285 | Kaempferol-O-hexoside | |
| 43 | 35.49 | 389 | 227 | Resveratrol hexoside | |
| 44 | 36.53 | 433 | 301 | Quercetin-O-pentoside | |
| 45 | 37.37 | 447 | 284, 300, 301 | Quercetin-O-rhamnoside |
© 2020 by the authors. Licensee MDPI, Basel, Switzerland. This article is an open access article distributed under the terms and conditions of the Creative Commons Attribution (CC BY) license (http://creativecommons.org/licenses/by/4.0/).
Share and Cite
Amen, Y.; Sherif, A.E.; Shawky, N.M.; Abdelrahman, R.S.; Wink, M.; Sobeh, M. Grape-Leaf Extract Attenuates Alcohol-Induced Liver Injury via Interference with NF-κB Signaling Pathway. Biomolecules 2020, 10, 558. https://doi.org/10.3390/biom10040558
Amen Y, Sherif AE, Shawky NM, Abdelrahman RS, Wink M, Sobeh M. Grape-Leaf Extract Attenuates Alcohol-Induced Liver Injury via Interference with NF-κB Signaling Pathway. Biomolecules. 2020; 10(4):558. https://doi.org/10.3390/biom10040558
Chicago/Turabian StyleAmen, Yhiya, Asmaa E. Sherif, Noha M. Shawky, Rehab S. Abdelrahman, Michael Wink, and Mansour Sobeh. 2020. "Grape-Leaf Extract Attenuates Alcohol-Induced Liver Injury via Interference with NF-κB Signaling Pathway" Biomolecules 10, no. 4: 558. https://doi.org/10.3390/biom10040558
APA StyleAmen, Y., Sherif, A. E., Shawky, N. M., Abdelrahman, R. S., Wink, M., & Sobeh, M. (2020). Grape-Leaf Extract Attenuates Alcohol-Induced Liver Injury via Interference with NF-κB Signaling Pathway. Biomolecules, 10(4), 558. https://doi.org/10.3390/biom10040558