Article

Biliverdin Reductase A (BVRA) Knockout in Adipocytes Induces Hypertrophy and Reduces Mitochondria in White Fat of Obese Mice

by
David E. Stec
1,*,
Darren M. Gordon
2,
Andrea L. Nestor-Kalinoski
3,
Matthew C. Donald
1,
Zachary L. Mitchell
1,
Justin F. Creeden
2 and
Terry D. Hinds, Jr.
2,*
1
Center for Excellence in Cardiovascular-Renal Research, Department of Physiology & Biophysics, University of Mississippi Medical Center, 2500 North State St, Jackson, MS 392161, USA
2
Center for Diabetes and Endocrine Research (CeDER), Department of Neurosciences, University of Toledo College of Medicine and Life Sciences, Toledo, OH 43614, USA
3
Advanced Microscopy & Imaging Center, Department of Surgery, University of Toledo College of Medicine and Life Sciences, Toledo, OH 43614, USA
*
Authors to whom correspondence should be addressed.
Biomolecules 2020, 10(3), 387; https://doi.org/10.3390/biom10030387
Submission received: 23 January 2020 / Revised: 25 February 2020 / Accepted: 27 February 2020 / Published: 2 March 2020
(This article belongs to the Special Issue Therapeutic Significance of Heme Oxygenase Induction or Inhibition)

Abstract

:
Biliverdin reductase (BVR) is an enzymatic and signaling protein that has multifaceted roles in physiological systems. Despite the wealth of knowledge about BVR, no data exist regarding its actions in adipocytes. Here, we generated an adipose-specific deletion of biliverdin reductase-A (BVRA) (BlvraFatKO) in mice to determine the function of BVRA in adipocytes and how it may impact adipose tissue expansion. The BlvraFatKO and littermate control (BlvraFlox) mice were placed on a high-fat diet (HFD) for 12 weeks. Body weights were measured weekly and body composition, fasting blood glucose and insulin levels were quantitated at the end of the 12 weeks. The data showed that the percent body fat and body weights did not differ between the groups; however, BlvraFatKO mice had significantly higher visceral fat as compared to the BlvraFlox. The loss of adipocyte BVRA decreased the mitochondrial number in white adipose tissue (WAT), and increased inflammation and adipocyte size, but this was not observed in brown adipose tissue (BAT). There were genes significantly reduced in WAT that induce the browning effect such as Ppara and Adrb3, indicating that BVRA improves mitochondria function and beige-type white adipocytes. The BlvraFatKO mice also had significantly higher fasting blood glucose levels and no changes in plasma insulin levels, which is indicative of decreased insulin signaling in WAT, as evidenced by reduced levels of phosphorylated AKT (pAKT) and Glut4 mRNA. These results demonstrate the essential role of BVRA in WAT in insulin signaling and adipocyte hypertrophy.

1. Introduction

Current estimates put the world’s obese population at one-third; however, that figure may be an underestimate of the global obesity epidemic [1,2,3]. Obesity is a co-morbidity for numerous pathological conditions, including cardiovascular disease, some cancers, increased traumatic injury, and inflammation [4,5,6]. To combat this epidemic, a better understanding of the factors that promote and protect against the harmful effects of obesity are needed.
Obesity increases insulin resistance and adipocyte size and reduces mitochondria number [7,8,9]. Adipocyte hypertrophy in obesity changes the profile of hormones and cytokines released, so-called “adipokines”. Excess fat in obesity is primarily stored in the viscera. The visceral fat releases more harmful adipokines than subcutaneous fat, resulting in worsened insulin resistance and inflammation, promoting complications such as type II diabetes and non-alcoholic fatty liver disease (NAFLD) [10,11]. Recent investigations have shown that biliverdin reductase-A (BVRA) can bind to the insulin receptor and increase sensitivity for glucose uptake [12,13], implicating it may be a potential therapeutic for reversing glucose intolerance.
Biliverdin reductase (BVR) is the enzyme responsible for the reduction of biliverdin to bilirubin [14,15,16,17]. It consists of two isoforms BVRA and biliverdin reductase-B (BVRB), which are expressed at different times in development [17]. BVRB is the main isoform expressed embryonically, and BVRA is expressed after fetal development [17]. In adults, the BVRA isozyme is essential, as it reduces biliverdin IXα to bilirubin IXα, which at this age is the only version present [17]. Recently, BVRA was shown to be significantly lower in peripheral blood mononuclear cells (PBMC) from obese humans compared to matched lean controls [18]. Others have described that BVRA mediates the direction of macrophage chemotaxis and polarization [19,20]. Our studies have shown that the BVRA isoform is essential for protection from hepatic steatosis and insulin resistance through its positive regulation of nuclear receptor peroxisome proliferator-activated receptor-α (PPARα) [21]. PPARɑα regulates fat accumulation by inducing fat-burning genes in the liver [22] and improving mitochondrial function in white adipocytes by stimulating ‘browning’ or ‘beiging,’ which reduces body weight [23]. Drugs that target mitochondrial respiration through upregulation of mitochondrial uncoupling proteins (UCPs) can promote the “browning” of white adipose tissue (WAT), which decreases the storage of fat and increases fat burning within the WAT [24,25]. The role of BVRA in control of adipocyte mitochondrial function or beiging is unknown. Here, we report the characterization of BVRA in adipocytes.

2. Materials and Methods

2.1. Animals

The experimental procedures and protocols of this study conformed to the National Institutes of Health Guide for the Care and Use of Laboratory Animals and were approved by the Institutional Animal Care and Use Committee of the University of Mississippi Medical Center. BVRA conditional knockout mice were generated from gene-targeted embryonic stem cells as previously described [21]. For adipose-specific knockout, homozygous floxed BVRA (BlvraFlox) mice were crossed to mice expressing the Cre recombinase specifically in adipose under the control of the adiponectin promoter (stock # 028020, Jackson Labs, Bar Harbor, ME, USA) to create adipose-specific BVRA knockout mice (BlvraFatKO). Breeding pairs consisted of a homozygous BlvraFlox mouse crossed with a homozygous BlvraFlox mouse heterozygous for the Cre allele. This breeding strategy generated litters containing both BlvraFlox and BlvraFatKO littermates (Figure 1). All mice were on a C57BL/6J genetic background. Studies were performed on separate cohorts of 6-week old male housed under standard conditions with full access to standard mouse chow and water and maintained at an ambient temperature of 24 °C. Mice were house between 2–5 mice per cage. After this time mice were switched to a 60% high-fat diet (diet # D12492, Research Diets, Inc., New Brunswick, NJ, USA) for 12 weeks and allowed access to water. Mice were euthanized and tissues and plasma samples collected after an 8 h fast. White adipose tissue (WAT) was collected from samples of epididymal fat and brown adipose tissue (BAT) was collected from the area between the scapula. Tissues were immediately frozen in liquid nitrogen and stored at −80 °C.

2.2. Body Composition

Body composition (fat mass, free water, and total water) was measured at 4-week intervals throughout the 12-week study using magnetic resonance imaging (EchoMRI-900TM, Echo Medical System, Houston, TX, USA) as previously described [26,27]. Body composition analysis was measured in conscious mice exposed to a low-intensity electromagnetic field. Mice were placed in a thin-walled plastic cylinder with a cylindrical plastic insert that functioned to limit the movement of the mice while they were in the EchoMRI instrument.

2.3. Fasting Glucose and Insulin

Fasting blood glucose and insulin were obtained from plasma samples collected following an 8 h fast. Samples were collected under light isoflurane anesthesia via the orbital sinus. The fasting glucose levels were measured using an Accu-Chek Advantage glucometer (Roche, Mannheim, Germany) and fasting insulin levels were measured by ELISA (Ultrasensitive Mouse Insulin Kit, Crystal Chem, Elk Grove Village, IL, USA) as previously described [22,26,28,29,30,31].

2.4. Quantitative Real-Time PCR Analysis

WAT and BAT specimens from BlvraFatKO and BlvraFlox mice were prepared for RNA extrations by placement of tissues in QIAzol Lysis Reagent (Qiagen, Germantown, MD, USA) using a Qiagen TissueLyser LT (Qiagen, Germantown, MD, USA) with a setting of 50 oscillations per second for 3 min. Samples were then passed through the total RNA extraction column and procedure followed as described for the miRNeasy Mini Kit (Qiagen, Germantown, MD, USA). Total RNA was read on a NanoDrop 2000 spectrophotometer (Thermo Fisher Scientific, Wilmington, DE, USA) and cDNA was synthesized using High Capacity cDNA Reverse Transcription Kit (Applied Biosystems, Wilmington, DE, USA). PCR amplification of the cDNA was performed by quantitative real time PCR using TrueAmp SYBR Green qPCR SuperMix (Advance Bioscience, Edwards, CO, USA). The thermocycling protocol consisted of 3 min at 95 °C, 48 cycles of 15 sec at 95 °C, 30 sec at 60 °C, and based on primer size 0 to 30 sec at 72 °C and finished with a melting curve ranging from 60–95 °C to allow distinction of specific products. Normalization was performed in separate reactions with primers to 36B4, which is an endogenous housekeeping gene previously described in [32,33].

2.5. Gel Electrophoresis and Western Blotting

Tissue lysates were prepared from WAT specimens from BlvraFatKO and BlvraFlox mice were suspended in CelLytic MT Cell Lysis Reagent Buffer for mammalian tissues (Millipore Sigma, St. Louis, MO, USA, Cat No: C3228) that contained protease inhibitor cocktail (Millipore Sigma, St. Louis, MO, USA, Cat No: P2714-1BTL) and Halt phosphatase inhibitor (Thermo Fisher Scientific, Wilmington, DE, USA, product # 1862495) using a Qiagen TissueLyser LT (Qiagen, Germantown, MD, USA) with a setting of 50 oscillations per second for 3 min. As previously described [31,34,35,36,37,38,39], lysates were centrifuged at 100,000× g for 7 min and the supernatant removed and measured for protein concentration by BCA Protein Assay Kit (Thermo Fisher Scientific, Wilmington, DE, USA). Protein specimens were resolved by SDS polyacrylamide gel electrophoresis and electrophoretically transferred to Immobilon FL membranes. Membranes were blocked at room temperature for 1 h in Odyssey Blocking buffer (LI-COR Biosciences, Lincoln, NE, USA) or TBS (TBS; 10 mM Tris HCl (pH 7.4) and 150 mM NaCl) containing 5% BSA or milk. Subsequently, the membrane was incubated overnight at 4 °C with antibodies for BVRA (Enzo, Farmingdale, NY, USA, ADI-OSA-450-E), phospho-Akt (pSer473) (Cell Signaling Technology, Danvers, MA, USA, 4060s), AKT1/2 (Santa Cruz Biotechnology, Dallas, TX, USA, sc-1619) or HSP90 antibodies (Santa Cruz Biotechnology, Dallas, TX, USA, sc-13119). After three washes in TBST (TBS plus 0.1% Tween 20), the membrane was incubated with an infrared anti rabbit (IRDye 800, green) or anti mouse (IRDye 680, red) secondary antibody labeled with IRDye infrared dye (LI COR Biosciences, Lincoln, NE, USA) (1:15,000 dilution in TBS) for 2 h at 4 °C. Following an additional 3 washes in TBST, immunoreactivity was visualized and quantified by infrared scanning in the Odyssey system (LI COR Biosciences, Lincoln, NE, USA).

2.6. Measurement of Mitochondrial Density and Lipid Droplet Sizes

To determine mitochondrial numbers, we used cryopreserved intact native adipose tissue as described by Fuller et al. [40]. WAT and BAT samples from the BlvraFatKO and BlvraFlox mice were thawed at room temperature in prewarmed 37 °C PBS and washed three times for preparation of imaging as we have previously described [41]. Samples were incubated with 100nM Mitotracker® Green FM (M7514, Molecular Probes, Eugene, OR, USA) for 15 min at room temperature. WAT Mitotracker staining was previously described in [42]. The samples were washed once with PBS, then incubated for 5 min with 1 μM of Draq-5 (Cell Signaling Technology, Danvers, MA, USA). Adipose tissue was washed one final time with PBS before imaging using a Leica TSC SP5 laser scanning confocal microscope in 1 µm steps. Samples were imaged using the 488 and 633 laser lines for excitation with peak emission collection at 514 and 647 respectively.
Brightfield images of the lipid droplet sizes were measured as previously described [43]. Tissue sample diameters (d) were quantitated based on the measurement of the lipid droplet’s widest point in LAS AF software (Leica Microsystems, Buffalo Grove, IL, USA). The diameter was used to extrapolate the lipid area for the adipocytes using the formula: πr2 where r = ½ d.

2.7. Statistics

Data are expressed as mean + SEM. Data were analyzed using analysis or variance and a Tukey’s post-test was utilized to compare group means utilizing Prism 7 (GraphPad Software, San Diego, CA, USA). p values of 0.05 or smaller were considered statistically significant.

3. Results

3.1. Selective Deletion of BVRA in Adipose Tissue in Mice

To generate an adipose-specific BVRA knockout (BlvraFatKO), homozygous floxed BVRA (BlvraFlox) mice were crossed with mice expressing Cre recombinase under the control of the adiponectin promoter (Figure 1A). Western blot analysis of the levels of BVRA expressed in various tissues, including spleen, heart, white adipose (WAT), brown adipose (BAT), and kidney showed that BlvraFatKO mice exhibited near-complete loss of BVRA in the WAT (reduced 97.7%) and BAT (reduced 72.7%) as compared to the BlvraFlox mice (Figure 1B). BVRA levels in other tissues such as the spleen, heart, and kidney were not different between the two groups of mice.

3.2. BlvraFatKO Mice Exhibit Greater Levels of Visceral Fat as Compared to Littermate Controls

At the end of the 12-week high-fat diet (HFD) feeding period, body weights (Figure 2A), body fat and lean percentages (Table 1), and non-adipocyte tissue weights (Table 1) were similar between the BlvraFlox and BlvraFatKO mice. Despite these similarities, BlvraFatKO mice exhibited a trend towards increased total fat measured at the time of euthanasia and a significant increase in visceral fat with no difference in epididymal fat between the BlvraFlox and BlvraFatKO mice (Figure 2B–D). Total body fat, as measured by non-invasive echo MRI at the end of the 12-week HFD, was also not different between BlvraFlox and BlvraFatKO mice.

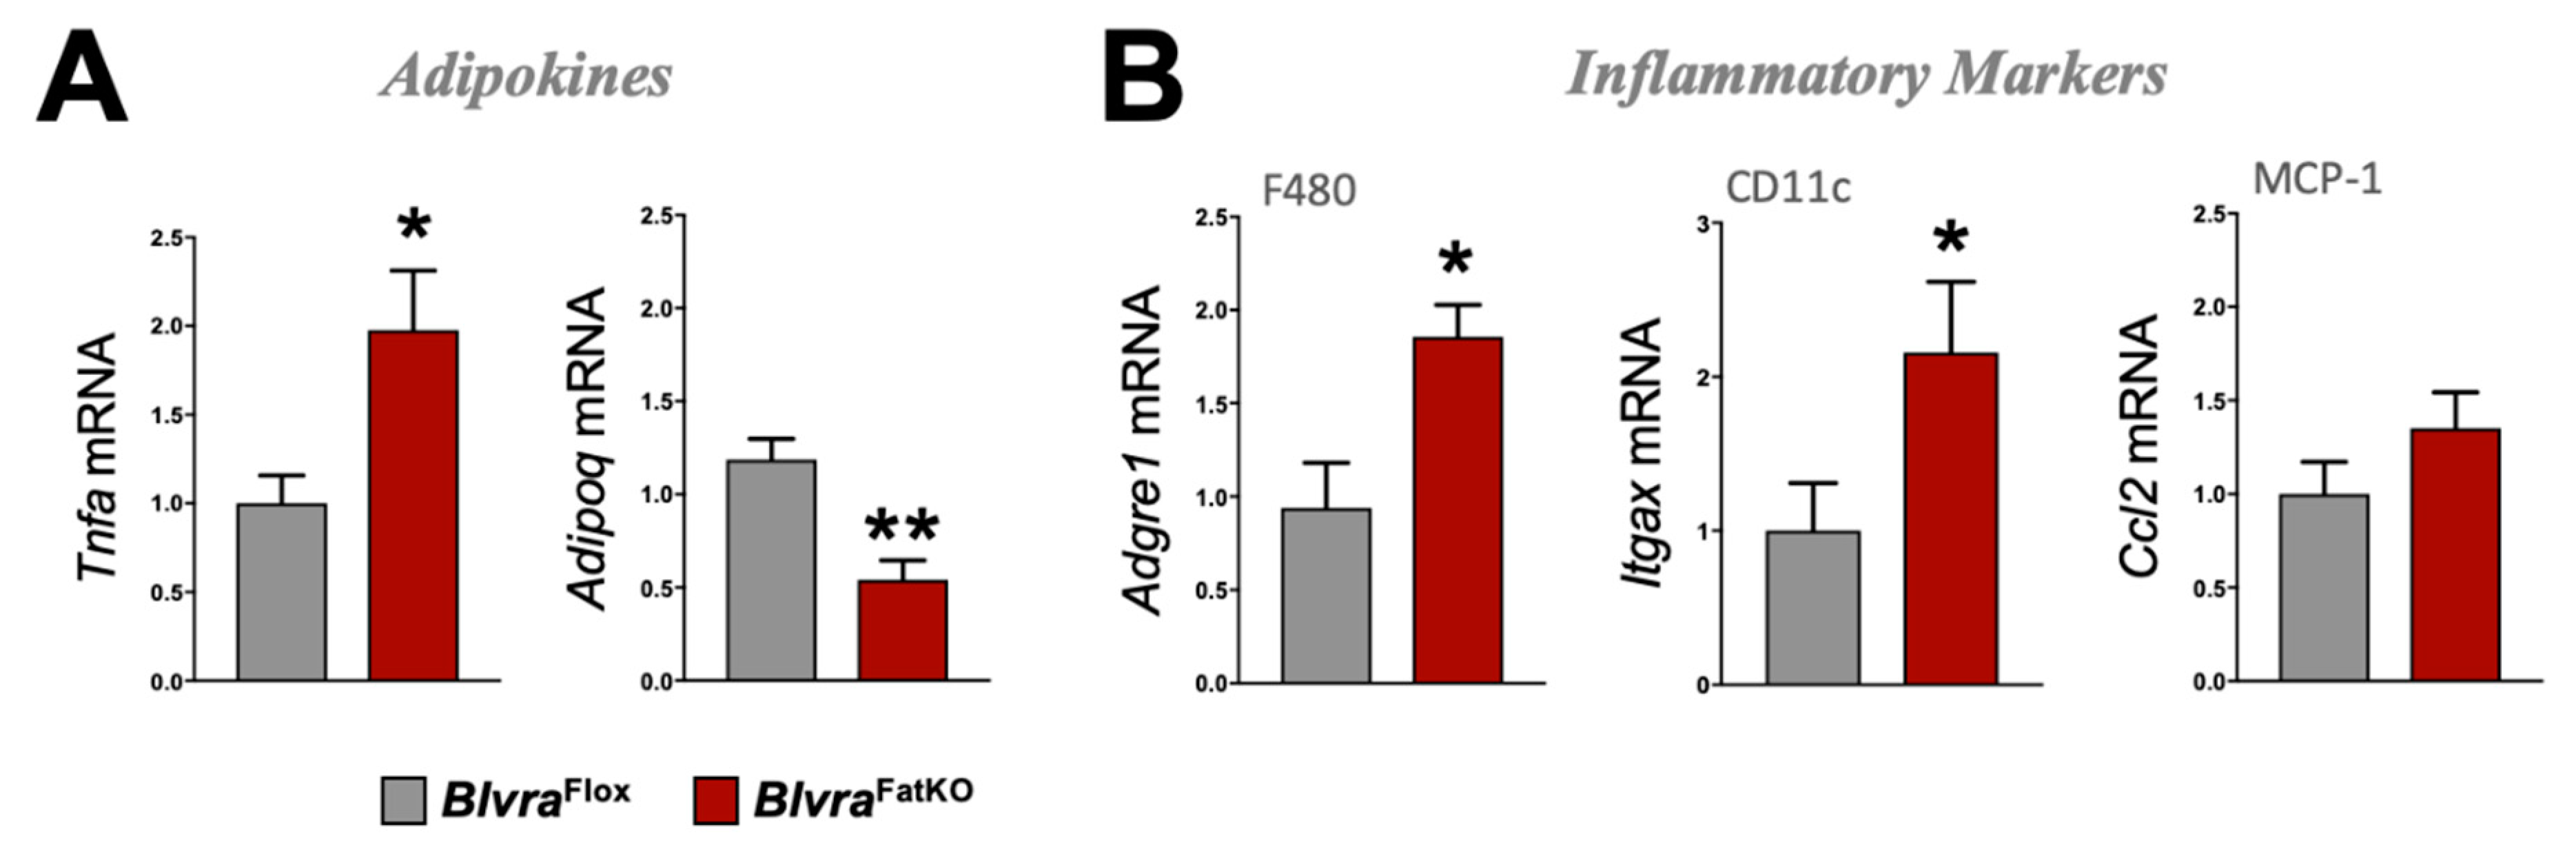
3.3. Loss of Adipose BVRA Decreases Insulin Signaling and Elevates Inflammatory Pathways in White Adipocytes

The deletion of BVRA in the adipose tissue increased fasting blood glucose levels measured at the end of the study in BlvraFatKO as compared to BlvraFlox mice (Figure 3A). The increase in fasting hyperglycemia observed in the BlvraFatKO mice did not correlate with any changes in fasting insulin levels between the groups (Figure 3B). This data demonstrates a decrease in insulin signaling in the BlvraFatKO mice. The phosphoinositide 3-kinase (PI3K)/AKT signaling pathway is required for normal metabolism, and its imbalance leads to the development of obesity and type-2 diabetes mellitus. The PI3K/AKT pathway is critical for insulin signaling; hence, any defect in AKT/PKB pathway along with the downstream molecules may lead to insulin resistance. We measured the levels of phosphorylated AKT (pAKT) and total AKT as well as Glut4 mRNA levels from WAT of BlvraFlox and BlvraFatKO mice. The BlvraFatKO mice exhibit significantly reduced levels of pAKT and Glut4 mRNA as compared to BlvraFlox mice (Figure 3C,D). The loss of BVRA significantly increased proinflammatory TNFɑ (Tnfa) and reduced anti-inflammatory adiponectin (Adipoq) adipokines (Figure 4A). This was pararlleled with significantly higher inflammatory markers F480 (Adgre1) and CD11c (Itgax) (Figure 4B).

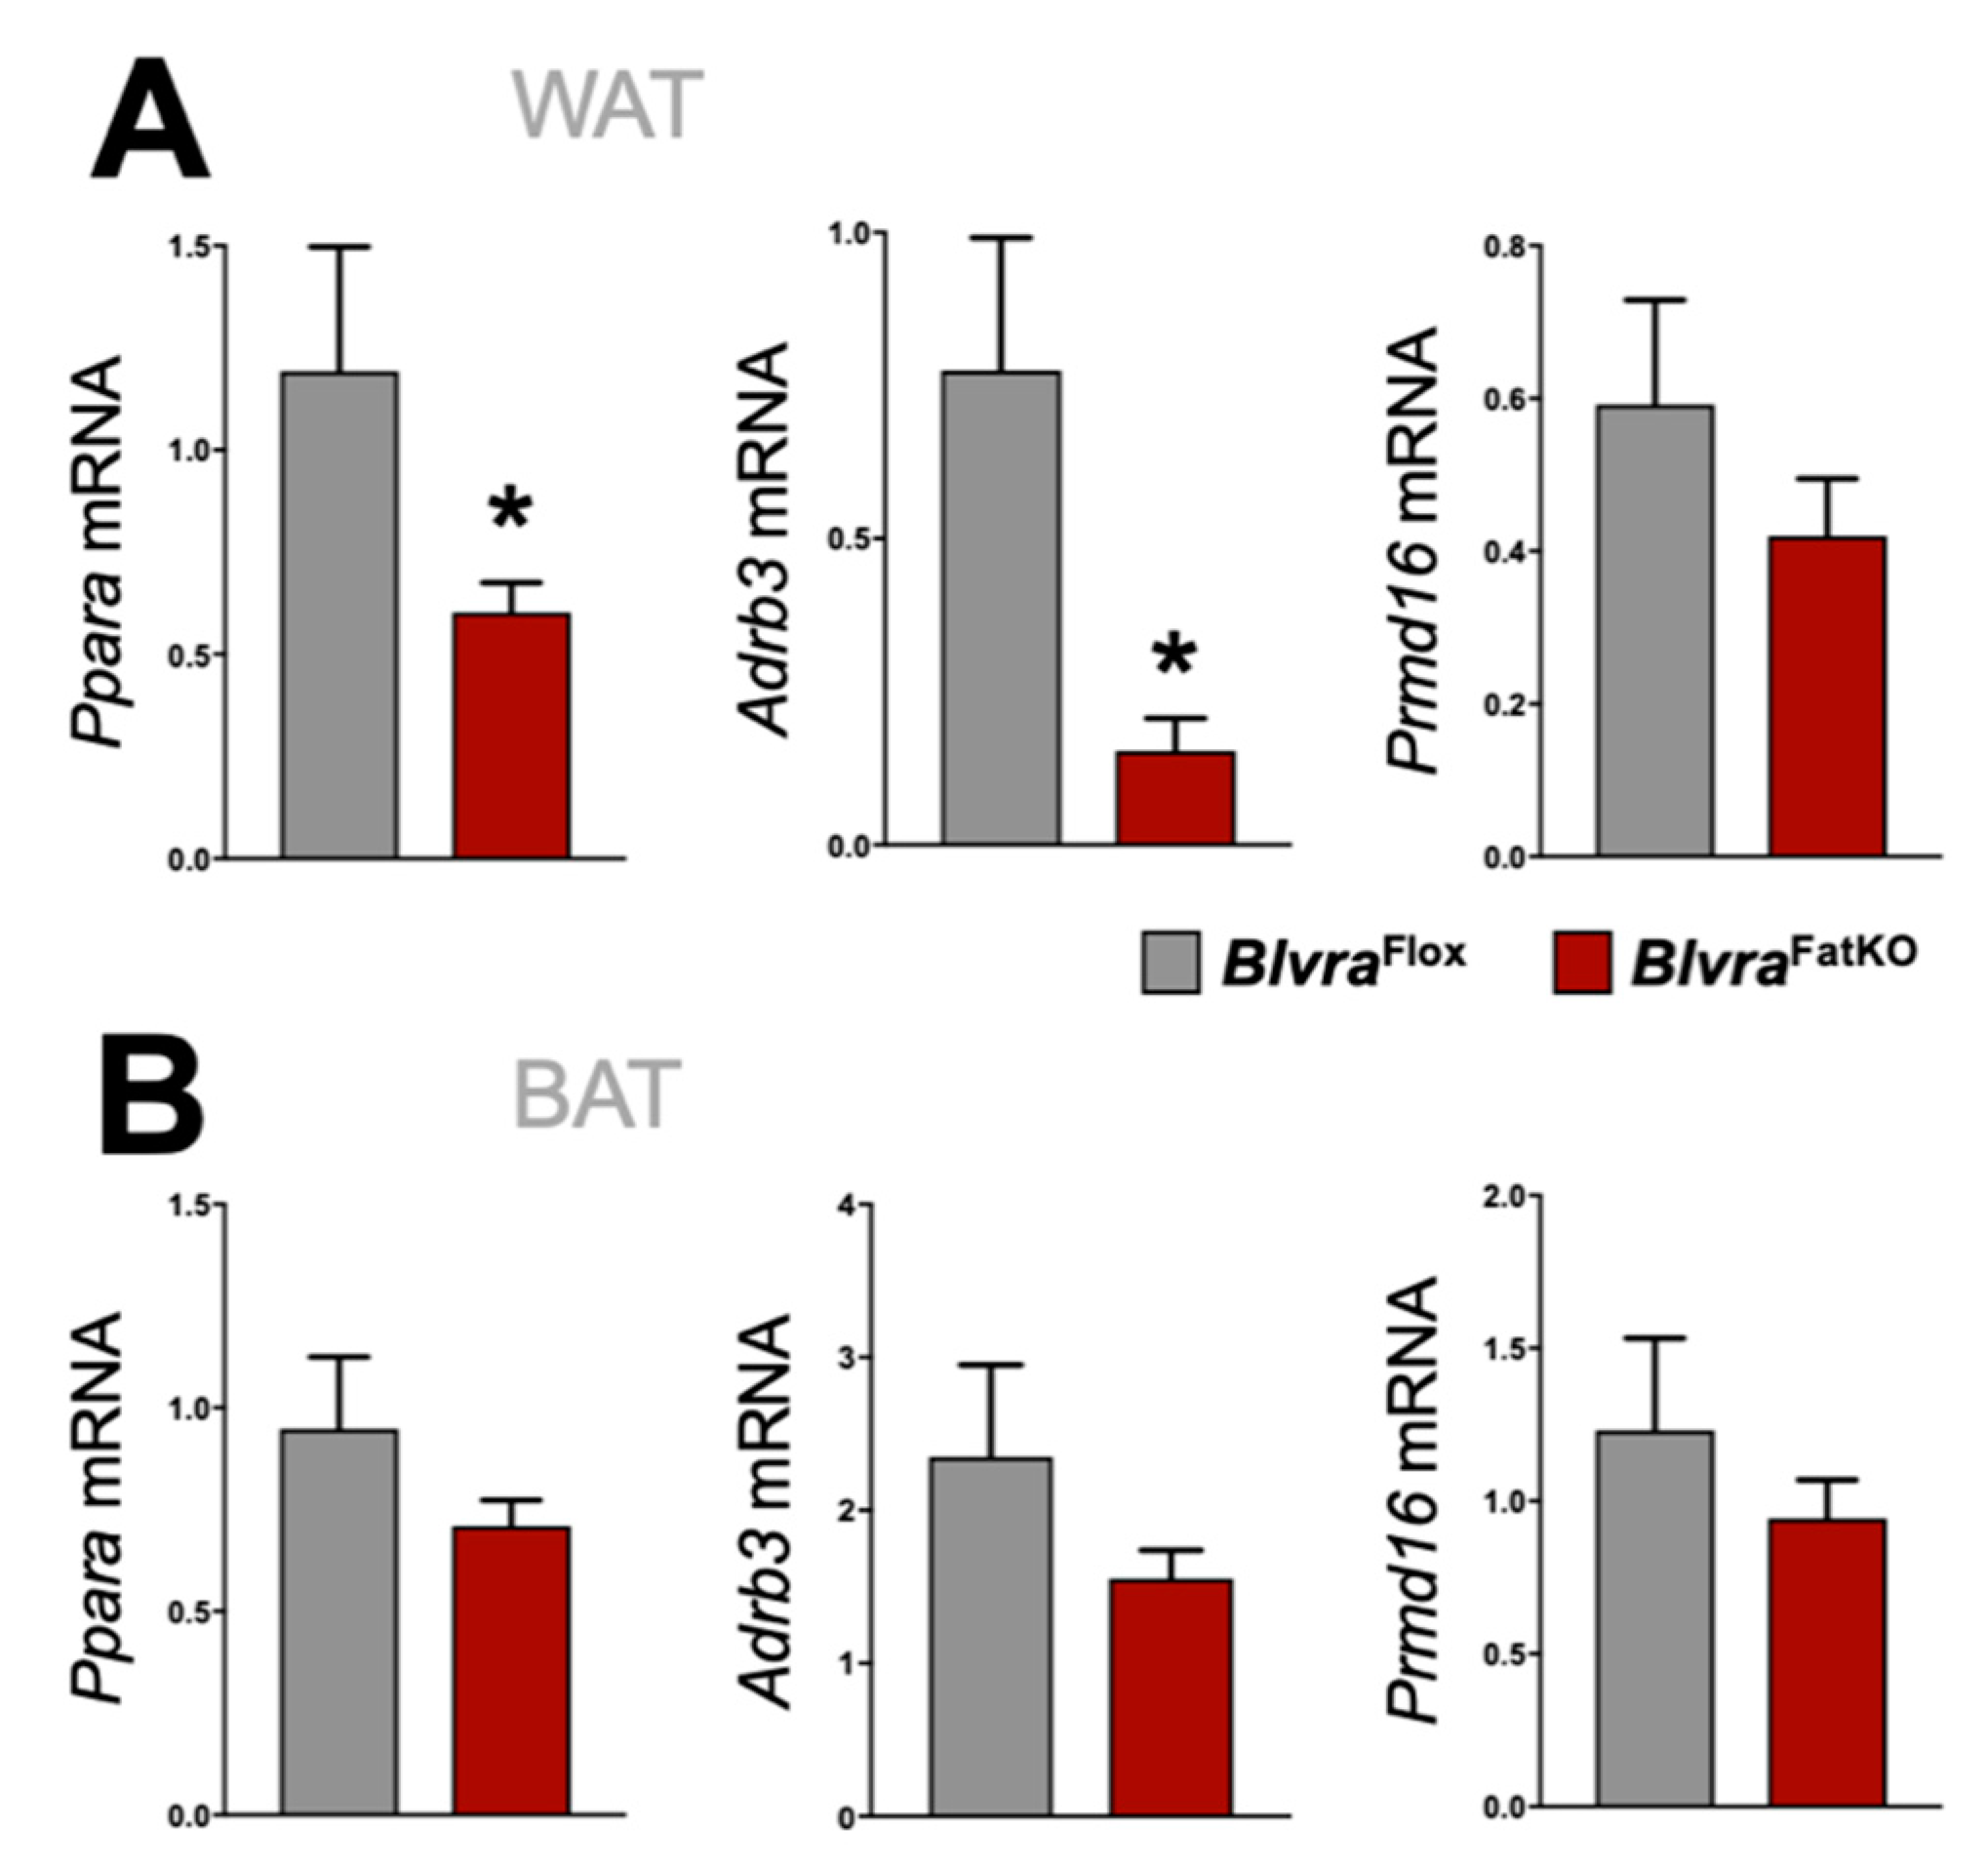
3.4. Adipose Knockout of BVRA Reduces Mitochondrial Number and Beige Fat Markers in WAT But Not BAT

Mitochondria play an important role in the physiology of adipocytes. To determine the effect of the loss of adipose BVRA on mitochondria, we utilized the Mitotracker mitochondrial staining technique to measure the number [42] in the WAT and BAT in BlvraFlox and BlvraFatKO mice. The deletion of BVRA from the adipose tissues resulted in a significant decrease in mitochondrial number in WAT of BlvraFatKO as compared to BlvraFlox mice (Figure 5A). However, the loss of BVRA did not affect the amount of mitochondria in BAT (Figure 5B). The adipocyte size was significantly larger in WAT of the BlvraFatKO as compared to BlvraFlox mice (Figure 5C), but this was not observed in BAT (Figure 5D). Also, Sod2 was significantly increased in WAT, indicating oxidative stress levels were high, which is known to be heightened by inflammatory stimuli [44]. Similar to the mitotracker staining, Cox2, a gene known to control mitochondria in WAT [45], was significantly reduced. These indicate that the loss of BVRA in WAT causes whitening and increased WAT size, reducing mitochondria levels. Further indicators of this are reduced beiging markers Ppara and Adrb3 in WAT of the BlvraFatKO compared to the BlvraFlox (Figure 6A). However, Prmd16, another beige fat marker, was unchanged between the groups. There was no significant difference for Ppara, Adrb3, or Prmd16 in BAT between the groups (Figure 6B).

4. Discussion

Our results demonstrate that while the loss of adipocyte BVRA does not affect the total amount of fat gained in response to a HFD, it does play a role in the distribution of fat, resulting in considerably more visceral fat. Thus, increased expansion of visceral fat in the BlvraFatKO mice may contribute to the higher glucose and lower pAKT-insulin signaling observed in these mice fed a HFD. Visceral fat releases greater amounts of damaging adipokines (TNFα), which can result in insulin resistance and inflammation [10,11,46,47]. In humans, lower BVRA levels are found in obesity and contribute to the metabolic syndrome and visceral adipose tissue inflammation [18]. Not surprisingly, BVRA has anti-inflammatory actions via inhibition of toll-like receptor 4 (TLR4) and NF-κB [48,49,50,51,52]. Weigel et al. showed that BVRA mediates biliverdin-induced anti-inflammatory effects via phosphatidylinositol 3-kinase and AKT (PI3K/AKT). Here, we found a similar finding that the adipocyte-loss of BVRA caused WAT inflammation and reduced pAKT, as well as lowered mitochondria number and increased adipocyte size.
The PI3K/AKT signaling pathway regulates insulin action in many tissues, including adipose and skeletal muscle, where it promotes glucose transport, glycogen synthesis, and protein synthesis [53,54]. Tonks et al. demonstrated that insulin-stimulated AKT phosphorylation at Thr309 and Ser474 highly correlated with whole-body insulin sensitivity in overweight/obese type 2 diabetic patients before and during a hyperinsulinaemic-euglycaemic clamp [55]. Given the importance of this pathway to the actions of insulin, Zhang et al. proposed activation of AKT as a novel strategy to treat insulin resistance [56]. One of the primary regulators of AKT activity and insulin signaling is BVRA [18,57]. Studies by Miralem et al. elegantly demonstrated that BVRA modulates AKT activity by aiding the formation of a complex with phosphatidylinositol-dependent kinase 1 (PDK1) [12]. The interaction of BVRA with AKT increases activity and phosphorylation (pAKT), improving insulin sensitivity [12,21]. Specific peptide sequences within the BVRA protein itself can impact insulin sensitivity through activation or inhibition of the insulin receptor kinase (IRK) domain [58]. The delivery of nanoparticles corresponding to the C-terminal KYCCSRK peptide sequence of human BVR improves glucose clearance in obese ob/ob mice by activation of the pAKT pathway [59]. Thus, it is clear that BVRA can impact insulin signaling through its interactions with AKT. Others have shown that the loss of BVRA in the brain causes insulin-resistance that occurs in Alzheimer’s disease [60,61,62]. However, the loss of BVRA in obesity can result in hyperactivation of insulin signaling [18]. These conflicting results highlight the lack of consensus in the field. Our study is the first to demonstrate that the adipose-specific loss of BVRA decreases the PI3K/AKT pathway. The deletion of WAT BVRA resulted in the attenuation of pAKT, which may contribute to the reduced insulin signaling and higher blood glucose and inflammation exhibited in the BlvraFatKO mice. Further studies in both animal models and humans are needed to understand the complex relationship between BVRA and AKT fully. Limitations of the current study are the lack of comparison to mice fed a normal fat diet, and that food intake was not measured. Thus, the role of adipose BVRA on the adaptive changes that occur in response to high-fat feeding could not be determined in the present study.
Mitochondria play a vital role in the maintenance of adipocyte function. Strategies to increase the “browning” or “beiging” of adipose tissue, are now being considered as potential treatments for obesity [63,64,65]. In the present study, the loss of BVRA from WAT resulted in a reduction of mitochondria number. This result is consistent with previous studies in which the deletion of BVRA in both cultured renal proximal tubule cells, as well as cultured hepatocytes, resulted in the decrease in mitochondrial number, mitochondrial membrane potential, oxygen consumption, and extracellular acidification rate [66,67]. Furthermore, the loss of BVRA was shown to decrease the expression of several mitochondrial complex subunit genes as well as mitochondrial dynamin-like GTPase (Opa1), which codes for a protein of the inner mitochondrial membrane regulating mitochondrial stability and energy output [67]. The results of these studies highlight the important role of BVRA in the maintenance of mitochondrial function, which is surprising given the fact that BVRA does not localize to mitochondria [17]. If BVRA is not found in mitochondria, then why does the loss of BVRA have such a great impact on mitochondrial function? There are several potential mechanisms by which this may occur, including increased reactive oxygen species production in response to BVRA deletion [19,66,68,69]. In the present study, decreases in the metabolite of BVRA, bilirubin, may be responsible for this observed effect on mitochondria number in BlvraFatKO.
We have previously demonstrated that hepatocyte-specific loss of BVRA results in exacerbation of hepatic steatosis and insulin resistance in response to a chronic HFD through alterations in PPARɑ [21]. Activation of heme oxygenase-1 (HO-1) has beneficial effects to prevent fatty liver disease [15,31,70,71], which is most likely mediated by BVRA production of bilirubin [15,21,28,72]. Others have shown that heme-derived metabolic signals dictate immune responses [21]. Bilirubin has strong antioxidant properties, and we have shown that it also signals through the nuclear hormone receptor PPARɑ to up-regulate genes associated with increased fatty acid oxidation and glucose sensitization [72,73]. Bilividen is rapidly converted to bilirubin by BVRA [74], and biliverdin treatment in diabetic [75] or obese [76] mice improves metabolic dysfunction. However, biliverdin treatment in human HepG2 hepatocytes with PPARɑ knockdown attenuates transcriptome responses [73]. PPARɑ associates with peroxisome proliferator-activated receptor gamma coactivator 1-alpha (PGC-1ɑ) to increase mitochondrial biogenesis [77,78]. Here, we found that BVRA in WAT, like liver, also regulates PPARɑ expression (Ppara mRNA) and known beiging target gene Adrb3. It is interesting that while similar mechanisms by which bilirubin regulates mitochondrial function are present in BAT, the deletion of BVRA did not affect mitochondrial numbers in BAT in the BlvraFatKO mice. The exact mechanism by which brown fat escapes this BVRA influence remains unknown. BAT may exhibit redundant pathways (i.e., greater sympathetic input) that are not present in WAT, which serves to preserve mitochondrial numbers and function, or the loss of BVRA in BAT may not have had an impact on inflammatory stimuli such as that observed in WAT. The mechanism(s) that protect mitochondrial numbers in BAT following the deletion of BVRA requires further study.

5. Conclusions

In summary, adipocyte-specific deletion of BVRA caused increased expansion of visceral fat adipocyte size and inflammation, and reduced insulin signaling and mitochondria number. At the same time, this deletion did not have a direct impact on weight gain in response to chronic HFD feeding. The loss of BVRA in WAT decreased pAKT levels, which may contribute to insulin resistance in humans, but this topic requires further study. Our results demonstrate the notable regulatory role of BVRA in WAT and strongly suggest that BVRA may contribute to beiging and increased mitochondrial functionality, and inhibit inflammation. Increasing BVRA in WAT may provide a novel therapeutic target for the improvement of obesity-associated insulin resistance, inflammation, and adipocyte hypertrophy.

Author Contributions

D.E.S. and T.D.H.J. conceived, designed, and performed experiments and drafted the manuscript. M.C.D. and Z.L.M. performed the in vivo experiments and made measurements of tissue weights. D.M.G., A.L.N.-K. and J.F.C. performed tissue and microscopic analyses, and D.M.G. measured transcriptome responses. All authors edited the manuscript and gave the final approval for publication. All authors have read and agreed to the published version of the manuscript.

Funding

This work was supported by the National Institutes of Health L32MD009154 (T.D.H.J.), the National Heart, Lung and Blood Institute [K01HL-125445] (T.D.H.J.) and (P01 HL05197-11), (D.E.S.), and the National Institute of General Medical Sciences (P20GM104357-02) (D.E.S.). The content is solely the responsibility of the authors and does not necessarily represent the official views of the National Institutes of Health.

Acknowledgments

The authors gratefully acknowledge the Analytical and Assay Core Laboratory in the Department of Physiology & Biophysics at the University of Mississippi Medical Center.

Conflicts of Interest

The authors declare no conflict of interest.

References

  1. Bluher, M. Obesity: Global epidemiology and pathogenesis. Nat. Rev. Endocrinol. 2019, 15, 288–298. [Google Scholar] [CrossRef] [PubMed]
  2. Chooi, Y.C.; Ding, C.; Magkos, F. The epidemiology of obesity. Metabolism 2019, 92, 6–10. [Google Scholar] [CrossRef] [PubMed] [Green Version]
  3. Reilly, J.J.; El-Hamdouchi, A.; Diouf, A.; Monyeki, A.; Somda, S.A. Determining the worldwide prevalence of obesity. Lancet 2018, 391, 1773–1774. [Google Scholar] [CrossRef]
  4. Lahey, R.; Khan, S.S. Trends in Obesity and Risk of Cardiovascular Disease. Curr. Epidemiol. Rep. 2018, 5, 243–251. [Google Scholar] [CrossRef]
  5. Abdelaal, M.; le Roux, C.W.; Docherty, N.G. Morbidity and mortality associated with obesity. Ann. Transl. Med. 2017, 5, 161. [Google Scholar] [CrossRef] [Green Version]
  6. Belmont, P.J., Jr.; Garcia, E.J.; Romano, D.; Bader, J.O.; Nelson, K.J.; Schoenfeld, A.J. Risk factors for complications and in-hospital mortality following hip fractures: A study using the National Trauma Data Bank. Arch. Orthop. Trauma Surg. 2014, 134, 597–604. [Google Scholar] [CrossRef]
  7. Choe, S.S.; Huh, J.Y.; Hwang, I.J.; Kim, J.I.; Kim, J.B. Adipose Tissue Remodeling: Its Role in Energy Metabolism and Metabolic Disorders. Front. Endocrinol. (Lausanne) 2016, 7, 30. [Google Scholar] [CrossRef] [Green Version]
  8. Ejarque, M.; Ceperuelo-Mallafre, V.; Serena, C.; Maymo-Masip, E.; Duran, X.; Diaz-Ramos, A.; Millan-Scheiding, M.; Nunez-Alvarez, Y.; Nunez-Roa, C.; Gama, P.; et al. Adipose tissue mitochondrial dysfunction in human obesity is linked to a specific DNA methylation signature in adipose-derived stem cells. Int. J. Obes. (Lond.) 2019, 43, 1256–1268. [Google Scholar] [CrossRef] [Green Version]
  9. Drareni, K.; Ballaire, R.; Barilla, S.; Mathew, M.J.; Toubal, A.; Fan, R.; Liang, N.; Chollet, C.; Huang, Z.; Kondili, M.; et al. GPS2 Deficiency Triggers Maladaptive White Adipose Tissue Expansion in Obesity via HIF1A Activation. Cell Rep. 2018, 24, 2957–2971. [Google Scholar] [CrossRef] [Green Version]
  10. Patel, P.; Abate, N. Body fat distribution and insulin resistance. Nutrients 2013, 5, 2019–2027. [Google Scholar] [CrossRef]
  11. Gaines, J.; Vgontzas, A.N.; Fernandez-Mendoza, J.; Calhoun, S.L.; He, F.; Liao, D.; Sawyer, M.D.; Bixler, E.O. Inflammation mediates the association between visceral adiposity and obstructive sleep apnea in adolescents. Am. J. Physiol. Endocrinol. Metab. 2016, 311, E851–E858. [Google Scholar] [CrossRef] [PubMed]
  12. Miralem, T.; Lerner-Marmarosh, N.; Gibbs, P.E.; Jenkins, J.L.; Heimiller, C.; Maines, M.D. Interaction of human biliverdin reductase with Akt/protein kinase B and phosphatidylinositol-dependent kinase 1 regulates glycogen synthase kinase 3 activity: A novel mechanism of Akt activation. FASEB J. 2016, 30, 2926–2944. [Google Scholar] [CrossRef] [PubMed] [Green Version]
  13. Maines, M.D. Potential application of biliverdin reductase and its fragments to modulate insulin/IGF-1/MAPK/PI3-K signaling pathways in therapeutic settings. Curr. Drug Targets 2010, 11, 1586–1594. [Google Scholar] [CrossRef] [PubMed]
  14. Hinds, T.D., Jr.; Stec, D.E. Bilirubin Safeguards Cardiorenal and Metabolic Diseases: A Protective Role in Health. Curr. Hypertens. Rep. 2019, 21, 87. [Google Scholar] [CrossRef]
  15. Weaver, L.; Hamoud, A.A.; Stec, D.E.; Hinds, T.D. Biliverdin Reductase and Bilirubin in Hepatic Disease. Am. J. Physiol. Gastrointest. Liver Physiol. 2018, 314, G668–G676. [Google Scholar] [CrossRef]
  16. Hinds, T.D., Jr.; Stec, D.E. Bilirubin, a Cardiometabolic Signaling Molecule. Hypertension 2018, 72, 788–795. [Google Scholar] [CrossRef]
  17. O’Brien, L.; Hosick, P.A.; John, K.; Stec, D.E.; Hinds, T.D., Jr. Biliverdin reductase isozymes in metabolism. Trends Endocrinol. Metab. 2015, 26, 212–220. [Google Scholar] [CrossRef] [Green Version]
  18. Cimini, F.A.; Arena, A.; Barchetta, I.; Tramutola, A.; Ceccarelli, V.; Lanzillotta, C.; Fontana, M.; Bertoccini, L.; Leonetti, F.; Capoccia, D.; et al. Reduced biliverdin reductase-A levels are associated with early alterations of insulin signaling in obesity. Biochim. Biophys. Acta Mol. Basis Dis. 2019, 1865, 1490–1501. [Google Scholar] [CrossRef]
  19. Bisht, K.; Canesin, G.; Cheytan, T.; Li, M.; Nemeth, Z.; Csizmadia, E.; Woodruff, T.M.; Stec, D.E.; Bulmer, A.C.; Otterbein, L.E.; et al. Deletion of Biliverdin Reductase A in Myeloid Cells Promotes Chemokine Expression and Chemotaxis in Part via a Complement C5a--C5aR1 Pathway. J. Immunol. 2019, 202, 2982–2990. [Google Scholar] [CrossRef]
  20. Hu, Z.Z.; Pei, G.C.; Wang, P.G.; Yang, J.; Zhu, F.M.; Guo, Y.J.; Wang, M.; Yao, Y.; Zeng, R.; Liao, W.H.; et al. Biliverdin Reductase A (BVRA) Mediates Macrophage Expression of Interleukin-10 in Injured Kidney. Int. J. Mol. Sci. 2015, 16, 22621–22635. [Google Scholar] [CrossRef]
  21. Hinds, T.D., Jr.; Burns, K.A.; Hosick, P.A.; McBeth, L.; Nestor-Kalinoski, A.; Drummond, H.A.; AlAmodi, A.A.; Hankins, M.W.; Vanden Heuvel, J.P.; Stec, D.E. Biliverdin Reductase A Attenuates Hepatic Steatosis by Inhibition of Glycogen Synthase Kinase (GSK) 3beta Phosphorylation of Serine 73 of Peroxisome Proliferator-activated Receptor (PPAR) alpha. J. Biol. Chem. 2016, 291, 25179–25191. [Google Scholar] [CrossRef] [PubMed] [Green Version]
  22. Stec, D.E.; Gordon, D.M.; Hipp, J.A.; Hong, S.; Mitchell, Z.L.; Franco, N.R.; Robison, J.W.; Anderson, C.D.; Stec, D.F.; Hinds, T.D., Jr. The loss of hepatic PPARalpha promotes inflammation and serum hyperlipidemia in diet-induced obesity. Am. J. Physiol. Regul. Integr. Comp. Physiol. 2019, 317, R733–R745. [Google Scholar] [CrossRef] [PubMed]
  23. Rachid, T.L.; Penna-de-Carvalho, A.; Bringhenti, I.; Aguila, M.B.; Mandarim-de-Lacerda, C.A.; Souza-Mello, V. Fenofibrate (PPARalpha agonist) induces beige cell formation in subcutaneous white adipose tissue from diet-induced male obese mice. Mol. Cell. Endocrinol. 2015, 402, 86–94. [Google Scholar] [CrossRef] [PubMed]
  24. Auffret, J.; Viengchareun, S.; Carre, N.; Denis, R.G.; Magnan, C.; Marie, P.Y.; Muscat, A.; Feve, B.; Lombes, M.; Binart, N. Beige differentiation of adipose depots in mice lacking prolactin receptor protects against high-fat-diet-induced obesity. FASEB J. 2012, 26, 3728–3737. [Google Scholar] [CrossRef] [Green Version]
  25. Liu, L.; Puri, N.; Raffaele, M.; Schragenheim, J.; Singh, S.P.; Bradbury, J.A.; Bellner, L.; Vanella, L.; Zeldin, D.C.; Cao, J.; et al. Ablation of soluble epoxide hydrolase reprogram white fat to beige-like fat through an increase in mitochondrial integrity, HO-1-adiponectin in vitro and in vivo. Prostaglandins Other Lipid Mediat. 2018, 138, 1–8. [Google Scholar] [CrossRef]
  26. Hosick, P.A.; Alamodi, A.A.; Storm, M.V.; Gousset, M.U.; Pruett, B.E.; Gray, W., III; Stout, J.; Stec, D.E. Chronic carbon monoxide treatment attenuates development of obesity and remodels adipocytes in mice fed a high-fat diet. Int. J. Obes. (Lond.) 2014, 38, 132–139. [Google Scholar] [CrossRef] [Green Version]
  27. Hosick, P.A.; AlAmodi, A.A.; Hankins, M.W.; Stec, D.E. Chronic treatment with a carbon monoxide releasing molecule reverses dietary induced obesity in mice. Adipocyte 2016, 5, 1–10. [Google Scholar] [CrossRef]
  28. Hinds, T.D., Jr.; Hosick, P.A.; Hankins, M.W.; Nestor-Kalinoski, A.; Stec, D.E. Mice with hyperbilirubinemia due to Gilbert’s Syndrome polymorphism are resistant to hepatic steatosis by decreased serine 73 phosphorylation of PPARalpha. Am. J. Physiol. Endocrinol. Metab. 2017, 312, E244–E252. [Google Scholar] [CrossRef] [Green Version]
  29. Stechschulte, L.A.; Qiu, B.; Warrier, M.; Hinds, T.D., Jr.; Zhang, M.; Gu, H.; Xu, Y.; Khuder, S.S.; Russo, L.; Najjar, S.M.; et al. FKBP51 Null Mice Are Resistant to Diet-Induced Obesity and the PPARgamma Agonist Rosiglitazone. Endocrinology 2016, 157, 3888–3900. [Google Scholar] [CrossRef] [Green Version]
  30. Marino, J.S.; Stechschulte, L.A.; Stec, D.E.; Nestor-Kalinoski, A.; Coleman, S.; Hinds, T.D., Jr. Glucocorticoid receptor beta induces hepatic steatosis by augmenting inflammation and inhibition of the peroxisome proliferator-activated receptor (PPAR) alpha. J. Biol. Chem. 2016, 291, 25776–25788. [Google Scholar] [CrossRef] [Green Version]
  31. Hinds, T.D., Jr.; Sodhi, K.; Meadows, C.; Fedorova, L.; Puri, N.; Kim, D.H.; Peterson, S.J.; Shapiro, J.; Abraham, N.G.; Kappas, A. Increased HO-1 levels ameliorate fatty liver development through a reduction of heme and recruitment of FGF21. Obesity (Silver Spring) 2014, 22, 705–712. [Google Scholar] [CrossRef] [PubMed] [Green Version]
  32. Dempersmier, J.; Sambeat, A.; Gulyaeva, O.; Paul, S.M.; Hudak, C.S.; Raposo, H.F.; Kwan, H.Y.; Kang, C.; Wong, R.H.; Sul, H.S. Cold-inducible Zfp516 activates UCP1 transcription to promote browning of white fat and development of brown fat. Mol. Cell 2015, 57, 235–246. [Google Scholar] [CrossRef] [PubMed] [Green Version]
  33. Zhang, W.X.; Fan, J.; Ma, J.; Rao, Y.S.; Zhang, L.; Yan, Y.E. Selection of Suitable Reference Genes for Quantitative Real-Time PCR Normalization in Three Types of Rat Adipose Tissue. Int. J. Mol. Sci. 2016, 17, 968. [Google Scholar] [CrossRef] [PubMed] [Green Version]
  34. Stechschulte, L.A.; Wuescher, L.; Marino, J.S.; Hill, J.W.; Eng, C.; Hinds, T.D., Jr. Glucocorticoid receptor beta stimulates Akt1 growth pathway by attenuation of PTEN. J. Biol. Chem. 2014, 289, 17885–17894. [Google Scholar] [CrossRef] [Green Version]
  35. Stechschulte, L.A.; Hinds, T.D., Jr.; Khuder, S.S.; Shou, W.; Najjar, S.M.; Sanchez, E.R. FKBP51 controls cellular adipogenesis through p38 kinase-mediated phosphorylation of GRalpha and PPARgamma. Mol. Endocrinol. 2014, 28, 1265–1275. [Google Scholar] [CrossRef] [Green Version]
  36. Stechschulte, L.A.; Hinds, T.D., Jr.; Ghanem, S.S.; Shou, W.; Najjar, S.M.; Sanchez, E.R. FKBP51 Reciprocally Regulates GRalpha and PPARgamma Activation via the Akt-p38 Pathway. Mol. Endocrinol. 2014, 28, 1254–1264. [Google Scholar] [CrossRef] [Green Version]
  37. Hinds, T.D.; Stechschulte, L.A.; Elkhairi, F.; Sanchez, E.R. Analysis of FK506, timcodar (VX-853) and FKBP51 and FKBP52 chaperones in control of glucocorticoid receptor activity and phosphorylation. Pharmacol. Res. Perspect. 2014, 2, e00076. [Google Scholar] [CrossRef] [Green Version]
  38. Hinds, T.D., Jr.; Stechschulte, L.A.; Cash, H.A.; Whisler, D.; Banerjee, A.; Yong, W.; Khuder, S.S.; Kaw, M.K.; Shou, W.; Najjar, S.M.; et al. Protein phosphatase 5 mediates lipid metabolism through reciprocal control of glucocorticoid receptor and peroxisome proliferator-activated receptor-gamma (PPARgamma). J. Biol. Chem. 2011, 286, 42911–42922. [Google Scholar] [CrossRef] [Green Version]
  39. Hinds, T.D., Jr.; Ramakrishnan, S.; Cash, H.A.; Stechschulte, L.A.; Heinrich, G.; Najjar, S.M.; Sanchez, E.R. Discovery of glucocorticoid receptor-beta in mice with a role in metabolism. Mol. Endocrinol. 2010, 24, 1715–1727. [Google Scholar] [CrossRef] [Green Version]
  40. Fuller, B.J.; Rubinacci, A.; Geboes, K.; De Loecker, W. The bioenergetics of mitochondria after cryopreservation. Cryobiology 1989, 26, 333–340. [Google Scholar] [CrossRef]
  41. Ebke, L.A.; Nestor-Kalinoski, A.L.; Slotterbeck, B.D.; Al-Dieri, A.G.; Ghosh-Lester, S.; Russo, L.; Najjar, S.M.; von Grafenstein, H.; McInerney, M.F. Tight association between macrophages and adipocytes in obesity: Implications for adipocyte preparation. Obesity (Silver Spring) 2014, 22, 1246–1255. [Google Scholar] [CrossRef] [PubMed]
  42. Granneman, J.G.; Burnazi, M.; Zhu, Z.; Schwamb, L.A. White adipose tissue contributes to UCP1-independent thermogenesis. Am. J. Physiol. Endocrinol. Metab. 2003, 285, E1230–E1236. [Google Scholar] [CrossRef] [PubMed] [Green Version]
  43. Parlee, S.D.; Lentz, S.I.; Mori, H.; MacDougald, O.A. Quantifying size and number of adipocytes in adipose tissue. Methods Enzymol. 2014, 537, 93–122. [Google Scholar] [CrossRef] [PubMed] [Green Version]
  44. Ishihara, Y.; Takemoto, T.; Itoh, K.; Ishida, A.; Yamazaki, T. Dual role of superoxide dismutase 2 induced in activated microglia: Oxidative stress tolerance and convergence of inflammatory responses. J. Biol. Chem. 2015, 290, 22805–22817. [Google Scholar] [CrossRef] [PubMed] [Green Version]
  45. Madsen, L.; Pedersen, L.M.; Lillefosse, H.H.; Fjaere, E.; Bronstad, I.; Hao, Q.; Petersen, R.K.; Hallenborg, P.; Ma, T.; De Matteis, R.; et al. UCP1 induction during recruitment of brown adipocytes in white adipose tissue is dependent on cyclooxygenase activity. PLoS ONE 2010, 5, e11391. [Google Scholar] [CrossRef] [PubMed] [Green Version]
  46. Tchernof, A.; Despres, J.P. Pathophysiology of human visceral obesity: An update. Physiol. Rev. 2013, 93, 359–404. [Google Scholar] [CrossRef]
  47. Drouet, M.; Dubuquoy, L.; Desreumaux, P.; Bertin, B. Visceral fat and gut inflammation. Nutrition 2012, 28, 113–117. [Google Scholar] [CrossRef]
  48. Zhang, Z.; Amorosa, L.F.; Petrova, A.; Coyle, S.; Macor, M.; Nair, M.; Lee, L.Y.; Haimovich, B. TLR4 counteracts BVRA signaling in human leukocytes via differential regulation of AMPK, mTORC1 and mTORC2. Sci. Rep. 2019, 9, 7020. [Google Scholar] [CrossRef]
  49. Zhang, Y.; Ding, Y.; Lu, T.; Zhang, Y.; Xu, N.; McBride, D.W.; Tang, J.; Zhang, J.H. Biliverdin reductase-A attenuated GMH-induced inflammatory response in the spleen by inhibiting toll-like receptor-4 through eNOS/NO pathway. J. Neuroinflammation 2018, 15, 118. [Google Scholar] [CrossRef] [Green Version]
  50. Wegiel, B.; Gallo, D.; Csizmadia, E.; Roger, T.; Kaczmarek, E.; Harris, C.; Zuckerbraun, B.S.; Otterbein, L.E. Biliverdin inhibits Toll-like receptor-4 (TLR4) expression through nitric oxide-dependent nuclear translocation of biliverdin reductase. Proc. Natl. Acad. Sci. USA 2011, 108, 18849–18854. [Google Scholar] [CrossRef] [Green Version]
  51. Wegiel, B.; Otterbein, L.E. Go green: The anti-inflammatory effects of biliverdin reductase. Front. Pharmacol. 2012, 3, 47. [Google Scholar] [CrossRef] [PubMed] [Green Version]
  52. Kim, H.R.; Kim, D.W.; Jo, H.S.; Cho, S.B.; Park, J.H.; Lee, C.H.; Choi, Y.J.; Yeo, E.J.; Park, S.Y.; Kim, S.T.; et al. Tat-biliverdin reductase A inhibits inflammatory response by regulation of MAPK and NF-kappaB pathways in Raw 264.7 cells and edema mouse model. Mol. Immunol. 2015, 63, 355–366. [Google Scholar] [CrossRef] [PubMed]
  53. Huang, X.; Liu, G.; Guo, J.; Su, Z. The PI3K/AKT pathway in obesity and type 2 diabetes. Int. J. Biol. Sci. 2018, 14, 1483–1496. [Google Scholar] [CrossRef] [PubMed] [Green Version]
  54. Mackenzie, R.W.; Elliott, B.T. Akt/PKB activation and insulin signaling: A novel insulin signaling pathway in the treatment of type 2 diabetes. Diabetes Metab. Syndr. Obes. 2014, 7, 55–64. [Google Scholar] [CrossRef] [PubMed] [Green Version]
  55. Tonks, K.T.; Ng, Y.; Miller, S.; Coster, A.C.; Samocha-Bonet, D.; Iseli, T.J.; Xu, A.; Patrick, E.; Yang, J.Y.; Junutula, J.R.; et al. Impaired Akt phosphorylation in insulin-resistant human muscle is accompanied by selective and heterogeneous downstream defects. Diabetologia 2013, 56, 875–885. [Google Scholar] [CrossRef] [Green Version]
  56. Zhang, Z.; Liu, H.; Liu, J. Akt activation: A potential strategy to ameliorate insulin resistance. Diabetes Res. Clin. Pract. 2019, 156, 107092. [Google Scholar] [CrossRef]
  57. Barone, E.; Di Domenico, F.; Cassano, T.; Arena, A.; Tramutola, A.; Lavecchia, M.A.; Coccia, R.; Butterfield, D.A.; Perluigi, M. Impairment of biliverdin reductase-A promotes brain insulin resistance in Alzheimer disease: A new paradigm. Free Radic. Biol. Med. 2016, 91, 127–142. [Google Scholar] [CrossRef]
  58. Gibbs, P.E.; Lerner-Marmarosh, N.; Poulin, A.; Farah, E.; Maines, M.D. Human biliverdin reductase-based peptides activate and inhibit glucose uptake through direct interaction with the kinase domain of insulin receptor. FASEB J. 2014, 28, 2478–2491. [Google Scholar] [CrossRef] [Green Version]
  59. Gibbs, P.E.; Miralem, T.; Lerner-Marmarosh, N.; Maines, M.D. Nanoparticle Delivered Human Biliverdin Reductase-Based Peptide Increases Glucose Uptake by Activating IRK/Akt/GSK3 Axis: The Peptide Is Effective in the Cell and Wild-Type and Diabetic Ob/Ob Mice. J. Diabetes Res. 2016, 2016, 4712053. [Google Scholar] [CrossRef] [Green Version]
  60. Sharma, N.; Tramutola, A.; Lanzillotta, C.; Arena, A.; Blarzino, C.; Cassano, T.; Butterfield, D.A.; Di Domenico, F.; Perluigi, M.; Barone, E. Loss of biliverdin reductase-A favors Tau hyper-phosphorylation in Alzheimer’s disease. Neurobiol. Dis. 2019, 125, 176–189. [Google Scholar] [CrossRef]
  61. Triani, F.; Tramutola, A.; Di Domenico, F.; Sharma, N.; Butterfield, D.A.; Head, E.; Perluigi, M.; Barone, E. Biliverdin reductase-A impairment links brain insulin resistance with increased Abeta production in an animal model of aging: Implications for Alzheimer disease. Biochim. Biophys. Acta Mol. Basis Dis. 2018, 1864, 3181–3194. [Google Scholar] [CrossRef] [PubMed]
  62. Barone, E.; Tramutola, A.; Triani, F.; Calcagnini, S.; Di Domenico, F.; Ripoli, C.; Gaetani, S.; Grassi, C.; Butterfield, D.A.; Cassano, T.; et al. Biliverdin Reductase-A Mediates the Beneficial Effects of Intranasal Insulin in Alzheimer Disease. Mol. Neurobiol. 2019, 56, 2922–2943. [Google Scholar] [CrossRef] [PubMed]
  63. Brestoff, J.R.; Kim, B.S.; Saenz, S.A.; Stine, R.R.; Monticelli, L.A.; Sonnenberg, G.F.; Thome, J.J.; Farber, D.L.; Lutfy, K.; Seale, P.; et al. Group 2 innate lymphoid cells promote beiging of white adipose tissue and limit obesity. Nature 2015, 519, 242–246. [Google Scholar] [CrossRef] [PubMed] [Green Version]
  64. Lizcano, F. The Beige Adipocyte as a Therapy for Metabolic Diseases. Int. J. Mol. Sci. 2019, 20, 5058. [Google Scholar] [CrossRef] [PubMed] [Green Version]
  65. Warner, A.; Mittag, J. Breaking BAT: Can browning create a better white? J. Endocrinol. 2016, 228, R19–R29. [Google Scholar] [CrossRef] [Green Version]
  66. Adeosun, S.O.; Gordon, D.M.; Weeks, M.F.; Moore, K.H.; Hall, J.E.; Hinds, T.D., Jr.; Stec, D.E. Loss of biliverdin reductase-A promotes lipid accumulation and lipotoxicity in mouse proximal tubule cells. Am. J. Physiol. Renal Physiol. 2018, 315, F323–F331. [Google Scholar] [CrossRef]
  67. Gordon, D.M.; Adeosun, S.O.; Ngwudike, S.I.; Anderson, C.D.; Hall, J.E.; Hinds, T.D., Jr.; Stec, D.E. CRISPR Cas9-mediated deletion of biliverdin reductase A (BVRA) in mouse liver cells induces oxidative stress and lipid accumulation. Arch. Biochem. Biophys. 2019, 672, 108072. [Google Scholar] [CrossRef]
  68. Young, S.C.; Storm, M.V.; Speed, J.S.; Kelsen, S.; Tiller, C.V.; Vera, T.; Drummond, H.A.; Stec, D.E. Inhibition of biliverdin reductase increases ANG II-dependent superoxide levels in cultured renal tubular epithelial cells. Am. J. Physiol. Regul. Integr. Comp. Physiol. 2009, 297, R1546–R1553. [Google Scholar] [CrossRef]
  69. Jansen, T.; Hortmann, M.; Oelze, M.; Opitz, B.; Steven, S.; Schell, R.; Knorr, M.; Karbach, S.; Schuhmacher, S.; Wenzel, P.; et al. Conversion of biliverdin to bilirubin by biliverdin reductase contributes to endothelial cell protection by heme oxygenase-1-evidence for direct and indirect antioxidant actions of bilirubin. J. Mol. Cell. Cardiol. 2010, 49, 186–195. [Google Scholar] [CrossRef]
  70. Raffaele, M.; Bellner, L.; Singh, S.P.; Favero, G.; Rezzani, R.; Rodella, L.F.; Falck, J.R.; Abraham, N.G.; Vanella, L. Epoxyeicosatrienoic intervention improves NAFLD in leptin receptor deficient mice by an increase in PGC1alpha-HO-1-PGC1alpha-mitochondrial signaling. Exp. Cell Res. 2019, 380, 180–187. [Google Scholar] [CrossRef]
  71. Raffaele, M.; Li Volti, G.; Barbagallo, I.A.; Vanella, L. Therapeutic Efficacy of Stem Cells Transplantation in Diabetes: Role of Heme Oxygenase. Front. Cell Dev. Biol. 2016, 4, 80. [Google Scholar] [CrossRef] [PubMed] [Green Version]
  72. Stec, D.E.; John, K.; Trabbic, C.J.; Luniwal, A.; Hankins, M.W.; Baum, J.; Hinds, T.D., Jr. Bilirubin Binding to PPARalpha Inhibits Lipid Accumulation. PLoS ONE 2016, 11, e0153427. [Google Scholar] [CrossRef] [PubMed] [Green Version]
  73. Gordon, D.M.; Blomquist, T.M.; Miruzzi, S.A.; McCullumsmith, R.; Stec, D.E.; Hinds, T.D., Jr. RNA-sequencing in human HepG2 hepatocytes reveals PPARalpha mediates transcriptome responsiveness of bilirubin. Physiol. Genomics 2019, 51, 234–240. [Google Scholar] [CrossRef] [PubMed]
  74. Adeosun, S.O.; Moore, K.H.; Lang, D.M.; Nwaneri, A.C.; Hinds, T.D., Jr.; Stec, D.E. A Novel Fluorescence-Based Assay for the Measurement of Biliverdin Reductase Activity. React. Oxyg. Species (Apex) 2018, 5, 35–45. [Google Scholar] [CrossRef] [Green Version]
  75. Ikeda, N.; Inoguchi, T.; Sonoda, N.; Fujii, M.; Takei, R.; Hirata, E.; Yokomizo, H.; Zheng, J.; Maeda, Y.; Kobayashi, K.; et al. Biliverdin protects against the deterioration of glucose tolerance in db/db mice. Diabetologia 2011, 54, 2183–2191. [Google Scholar] [CrossRef] [Green Version]
  76. Takei, R.; Inoue, T.; Sonoda, N.; Kohjima, M.; Okamoto, M.; Sakamoto, R.; Inoguchi, T.; Ogawa, Y. Bilirubin reduces visceral obesity and insulin resistance by suppression of inflammatory cytokines. PLoS ONE 2019, 14, e0223302. [Google Scholar] [CrossRef]
  77. Duncan, J.G.; Finck, B.N. The PPARalpha-PGC-1alpha Axis Controls Cardiac Energy Metabolism in Healthy and Diseased Myocardium. PPAR Res. 2008, 2008, 253817. [Google Scholar] [CrossRef] [Green Version]
  78. Duncan, J.G. Peroxisome proliferator activated receptor-alpha (PPARalpha) and PPAR gamma coactivator-1alpha (PGC-1alpha) regulation of cardiac metabolism in diabetes. Pediatr. Cardiol. 2011, 32, 323–328. [Google Scholar] [CrossRef] [Green Version]
Figure 1. Adipose-specific knockout of biliverdin reductase-A (BVRA) in mice. (A) Homozygous floxed BVRA (BlvraFlox) mice were crossed to mice expressing the Cre recombinase specifically in adipose under the control of the adiponectin promoter to create adipose-specific BVRA knockout mice (BlvraFatKO). (B) Western blot for biliverdin reductase-A (BVRA) and heat shock protein 90 (HSP90) as a loading control in various tissues from BlvraFlox and BlvraFatKO mice. WAT, white adipose tissue. BAT, brown adipose tissue.
Biomolecules 10 00387 g001
Figure 2. Bodyweight and fat distribution in BlvraFlox and BlvraFatKO mice fed a high-fat diet. (A) Body weights at the end of the 12-week HFD; (B) Total fat at the end of the 12-week HFD; (C) Visceral Fat at the end of the 12-week HFD; (D) Epididymal fat at the end of the 12-week HFD. *, p < 0.05 (vs. BlvraFlox). n = 5/group BlvraFlox; n = 7/group BlvraFatKO.
Biomolecules 10 00387 g002
Figure 3. Insulin signaling pathway in BlvraFlox and BlvraFatKO mice fed a high-fat diet. (A) Fasting blood glucose levels at the end of the 12-week HFD; (B) Fasting blood insulin levels at the end of the 12-week HFD; (C) Representative Western blot of phospho-Akt (pSer473) and total AKT protein levels in the adipose tissue; (D) Slc2a4 mRNA (also known as Glut4) expression. *, p < 0.05 (vs. BlvraFlox). n = 5/group BlvraFlox; n = 7/group BlvraFatKO.
Biomolecules 10 00387 g003
Figure 4. Adipokine and inflammatory marker expression in WAT from BlvraFlox and BlvraFatKO mice fed a high-fat diet. (A) Tnfa and Adipoq, and (B) Adgre1, Itgax, and Ccl2 mRNA expression in WAT. *, p < 0.05 (vs. BlvraFlox). n = 4/group BlvraFlox; n = 5/group BlvraFatKO.
Biomolecules 10 00387 g004
Figure 5. Mitochondrial levels and adipocyte size in white adipose tissue (WAT) and brown adipose tissue (BAT) from BlvraFlox and BlvraFatKO mice fed a high-fat diet. (A) Mitochondrial density (µm2) in WAT; (B) Mitochondrial density (µm2) in BAT. Scale bars, 250 µM; (C) Adipocyte size (µm2/cell) in WAT and mRNA expression of Sod2 and Cox2; (D) Adipocyte size (µm2/cell) in BAT and mRNA expression of Sod2 and Cox2. *, p < 0.05 (vs. BlvraFlox). n = 4/group BlvraFlox; n = 5/group BlvraFatKO.
Biomolecules 10 00387 g005
Figure 6. Beiging gene marker expression in WAT and BAT from BlvraFlox and BlvraFatKO mice fed a high-fat diet. Ppara, Adrb3, and Prmd16 mRNA expression in WAT (A) and BAT (B). *, p < 0.05 (vs. BlvraFlox). n = 4/group BlvraFlox; n = 5/group BlvraFatKO.
Biomolecules 10 00387 g006
Table 1. Fat and lean mass percentage and tissue weights in BlvraFlox and BlvraFatKO.
ParameterBlvraFlox (n = 5)BlvraFatKO (n = 7)p Value
Fat Mass (%)46.5 ± 0.744.7 ± 1.50.2999
Lean Mass (%)51.3 ± 0.853.3 ± 1.40.2556
Body Length (cm)10 ± 0.1510.2 ± 0.150.313
Tibia Length (cm)2.2 ± 0.032.3 ± 0.020.109
Heart Weight (mg)145.1 ± 14.2139.6 ± 7.40.6573
Heart Weight/Body Weight (mg/g)3.3 ± 0.32.9 ± 0.150.2687
Heart Weight/Body Length (mg/cm)14.5 ± 1.313.6 ± 0.60.5
Heart Weight/Tibia Length (mg/cm)62.9 ± 4.359.4 ± 3.40.5126
Kidney Weight (mg)328 ± 15328 ± 120.9945
Kidney Weight/Body Weight (mg/g)7.4 ± 0.56.9 ± 0.30.3070
Kidney Weight/Body Length (mg/cm)32.8 ± 1.431.7 ± 1.10.6650
Kidney Weight/Tibia Length (mg/cm)145.8 ± 6140.1 ± 50.4227
Liver Weight (g)1.8 ± 0.31.7 ± 0.20.7989
Liver Weight/Body Weight (mg/g)0.03 ± 0.0050.03 ± 0.0010.4724
Liver Weight/Body Length (mg/cm)0.17 ± 0.030.16 ± 0.010.6972
Liver Weight/Tibia Length (mg/cm)0.71 ± 0.130.69 ± 0.030.8618

