Article

Emission of Fast Hydrogen Atoms in a Low Density Gas Discharge—The Most “Natural” Mirror Laboratory

Forschungszentrum Jülich GmbH, Institut für Energie- und Klimaforschung–Plasmaphysik, Partner of the Trilateral Euregio Cluster (TEC), 52425 Jülich, Germany
*
Author to whom correspondence should be addressed.
Current address: Max-Planck-Institut für Plasmaphysik Greifswald, Wendelsteinstr. 1, 17491 Greifswald, Germany.
Current address: Laboratory for Plasma Physics, LPP-ERM/KMS, B-1000 Brussels, Belgium.
§
Current address: CEA Cadarache IRFM, 13108 Saint Paul lez Durance–CEDEX, France.
Atoms 2019, 7(3), 81; https://doi.org/10.3390/atoms7030081
Submission received: 30 June 2019 / Revised: 13 August 2019 / Accepted: 15 August 2019 / Published: 19 August 2019

Abstract

:
In this work, we present a new application for the line shapes of emission induced by reflected hydrogen atoms. Optical properties of the solids in contact with the plasma could be effectively measured at the wavelength of Balmer lines: time-resolved measurements of reflectance and polarization properties of mirrors are performed using the wavelength separation of the direct and reflected signals. One uses the Doppler effect of emission of atoms excited by collisions with noble gases, primarily with Ar or with Kr. In spite of a new application of line shapes, the question of the source of the strong signal in the case of Ar exists: the emission observed in the case of the excitation of H or D atoms by Ar exceeds the signal induced by collisions with Kr atoms by a factor of five, and the only available experimental data for the ground state excitation show practically equal cross-sections for both gases in the energy range of 80–200 eV.

1. Introduction

The emission of atomic and ionic lines represents probably the most studied field of plasma spectroscopy. Line intensities, wavelengths’ shift, or line shapes provide us with information on plasmas such as the temperature of atoms, ions and, electrons, the densities of plasma species, the energy distribution of particles, and finally, the strength of an electric or magnetic field. However, can passive plasma spectroscopy provide information on the optical properties of the plasma-exposed surfaces and their modification during plasma–surface interaction? Until now, such data have been obtained using external light sources, prior-, post- or during plasma operation. The new field of application will be at least desirable at conditions of limited access to plasma-facing components. Plasma discharges with the modification of optical properties due to natural processes such as sputtering or deposition could profit from the new diagnostic, as well.
High-resolution spectroscopy of fast atoms at the plasma–surface interface represents the natural mirror laboratory itself. Figure 1 sketches the idea of the measurements of optical properties using an isolated atom.
Figure 1a exemplifies the measurements of the optical properties of the mirror in the laboratory. First, one illuminates the calibrating surface using the light source at time t 0 . By replacing it with the mirror of interest at time t 1 and building the ratio of the two signals, one immediately derives either the total, specular, or diffusive reflectance and polarization properties of the mirror depending on experimental arrangements. Figure 1b shows instead the idealized picture of the emission of one isolated atom moving perpendicular to the mirror surface toward the detector or the spectrometer with velocity v. The latter observes two signals. The blue-shifted one is the emission signal due to photons propagating in the direction of the front optics and accepted by the spectrometer. The shift Δ λ = λ λ 0 is established via the Doppler effect: Δ λ / λ = v / c , where λ is the detected wavelength, λ 0 is the unshifted wavelength of the transition, and c is the speed of light. One assumes here that the distance between the spectrometer and the mirror L is considerably larger than the characteristic size of the mirror D, L > > D . One also assumes that during the emission, the atoms pass a distance Δ L v τ much less than the size of the mirror, where τ is the lifetime of the upper level of the observed transition. In addition to the blue-shifted signal, one also detects the red-shifted one. With the assumption of isotropic emission of the atom and the absence of photo absorption, the photons moving toward the mirror will be reflected back toward the front optics and detected as well. In the condition:
Δ L < < D < < L
the difference in the intensity and/or shape of emission between the red- and the blue-shifted signal is determined by the optical properties of the mirror. Without loss of generality, we postulate that the optical properties of the mirror could be derived using the ratio between the red- and the blue-shifted signal of emission [1,2]. Instead of the timely-resolved measurements for the standard calibrating surface and the mirror outside of the plasma, one performs a simultaneous observation using the Doppler effect during plasma operation.

2. Fast Atoms at the Plasma–Solid Interface

In order to realize the measurements proposed above, two following problems have to be solved. The first one is to identify the source of fast atoms at the mirror surface, and the second one is to define the emission channel.

2.1. Source of Fast Atoms at the Mirror

In steady-state plasma operation, two sorts of atoms with kinetic energy well above the thermal one exist. The first group of fast atoms is created as a result of charge exchange between the ions accelerated in the pre-sheath and sheath and the background gas. The kinetic energy of the ion achieves the value E 0 m c s 2 / 2 according to the Bohm criterion (M 1 , where M is the Mach number) on the scale of a few Debye lengths λ D ( c m ) = 743 T e ( e V ) / n e ( c m 3 ) at the entrance to the sheath [3,4]. Here, m is the mass of ions, c s = ( T e + T i ) / m is the speed of ions, T e and T i are the electron and ion temperature, respectively, and n e is the electron density. Taking into account that T e > T i , the velocity of these atoms allows separating their emission from the background one by considering the Doppler effect at the gas temperature T g < T i . However, the strong drop of plasma potential across the sheath width s λ D and the resulting electric field 3 T e / λ D induce the impact of the Stark effect on spectral lines. The emission of beam-like atoms as a result of charge exchange provides the measurements of the electric field and the sheath width. However, the measurements of optical properties using these atoms are hardly possible [5]. One looks first for the plasma condition that suppresses the emission induced by such atoms in the sheath, e.g., the mean free-path of the ions must be considerably larger than the Debye length:
s / λ c x < < 1 ,
where λ c x = 1 / ( n g σ c x ) is the mean free path of ions, n g is the neutral gas density, and σ c x is the charge exchange cross-section. The condition (2) can be realized in collisionless or low density gas discharges as s / λ c x n g / ζ , where ζ = n e / n g is the ionization degree.
The second type of fast atoms is the so-called reflected or the backscattered ones. These atoms are created as a result of the neutralization of fast ions at the surface. At kinetic energy below ≈1 keV, the neutral fraction dominates the process of particle reflection [6]. The maximal energy of the reflected atoms E m with the atomic mass m 1 at the surface with the atomic mass m 2 is determined from the binary collisional formula [6,7]:
E m E 0 = c o s Θ + m 2 2 m 1 2 s i n 2 Θ m 1 + m 2 2 ,
where Θ is the scattering angle of the particle m 1 in the laboratory coordinate system and m 1 < m 2 . The energy distribution of these particles varies from zero to values close to E 0 according to (3), and also, the beam-like distribution of the ions is replaced with the angular distribution taken in the form of cos b θ , where θ is the polar angle measured from the surface normal ( Θ = π θ ) and b is the power of the cosine law [8]. Obviously, the emission profile induced by such atoms could be hardly symmetrical, as proposed in Figure 1. However, as the optical properties are defined from the ratio between the red- and the blue-shifted emission only, it is of minor importance. Furthermore for the reflected atoms, the emission in the sheath s must be suppressed and should take place in the pre-sheath zone:
s < < Δ L .
Conditions (1), (2), and (4) represent the minimal set of requirements for reflectance measurements in plasmas.

2.2. Source of Emission of Fast Atoms

The realization of the Doppler-Shifted Reflectance Measurements (DSRM) approach relies crucially on the strong excitation channel of such atoms; that is, the reflected atoms must be made visible even at low plasma density. By considering the excitation of atoms by the electron, ion, or atom impacts only, atom–atom collisions represents the most promising option. Firstly, the ionization degree ζ at the surfaces is low, so that the signal generated by atom collisions is at least 10–100-times higher compared with the corresponding cross-sections by ion or electron impact excitation. Secondly, the excitation by electron impact does not allow any control of measurements as the intensity is determined by the velocity of electrons and not by fast atoms. The emission cross-sections of H atoms excited by collisions with Ar or Kr are ideally suited for such measurements, as exemplified in Figure 2.
The emission cross-section for the Lyman- α and Balmer- α lines in the case of excitation by Ar and Kr demonstrates a rapid growth starting from 50–60 eV, reaches its maximum around 80–100 eV, and decays slowly for higher energies. Above energies of ≈ 1 keV, the cross-section decreases (Figure 7, [9]). Take into account that the net emission, e.g., the integral over the line shape of fast atoms, equals:
I R N ( E 0 ) N H + N A r 0 E m f ( E ) σ ( E ) E d E ,
0 E m f ( E ) d E = 1 ,
where N H + and N A r are the density of hydrogen ions and argon atoms, respectively, R N ( E 0 ) is the particle reflection coefficient [14], and f ( E ) is the energy distribution function of reflected atoms [8]. The most efficient operational window of the DSRM approach is in the energy range of ions of 80–200 eV. The last value must match also the material of the mirror according to (3). Moreover, in the low-density limit, the Balmer- α emission rate coefficient (neglecting cascades) equals:
κ ( H α ) κ 3 s + 0.12 κ 3 p + κ 3 d .
In the case of H-Ar collisions, the rate coefficient exceeds electron excitation at the electron temperature of 3–4 eV by a factor of 5–10. They become equal at the electron temperature of 10–15 eV, as shown in Figure 3.
Thus, excitation of fast H atoms by Ar or Kr gas is 100–1000-times more effective as by electrons ( T e 5 eV, ζ = 0.01–0.1). In addition, H atoms demonstrate the most pronounced Doppler shift among all other elements at the same conditions. The kinetic energy of ions on the order of 100 eV could be routinely achieved by applying a negative potential to the surface. The Child–Langmuir sheath thickness s increases in this case by e U / T e , where U < 0 is the applied negative potential to the target and e is the electron charge [16].

3. Experimental Setup at the Linear Plasma Device PSI-2

The approach was tested and the optical properties of mirrors were measured at the linear plasma device PSI-2described in detail elsewhere [17]. The spectroscopic setup is sketched in Figure 4.
Here, the plasma generated at the hollow cathode is being driven by the pressure gradient toward the target chamber. The plasma profiles reproduce the form induced by the hollow cathode. The applied magnetic field confines the plasma in a cylindrical geometry with a radius of about 5 cm. At the position of spectroscopic measurements, the value of the magnetic field is about 0.1 T [19]. The mirrors (1.3 × 1.3 cm 2 ) were installed in the target chamber using either the cooled axial or side manipulator. The side manipulator (SM) was used for measurements of emission at the angles of 35 and 90 relative to the surface normal. The axial manipulator (AM) was installed to measure the signals at the angle of 70 using a polarization cube (PC) (this angle is close to the pseudo-Brewster angle for many metals). Unfortunately, the measurements strictly to the normal through the hollow cathode were not possible, as strong emission of H 2 and D 2 molecular lines exist there.

4. Emission of Fast Reflected Atoms and Measurements of Reflectance
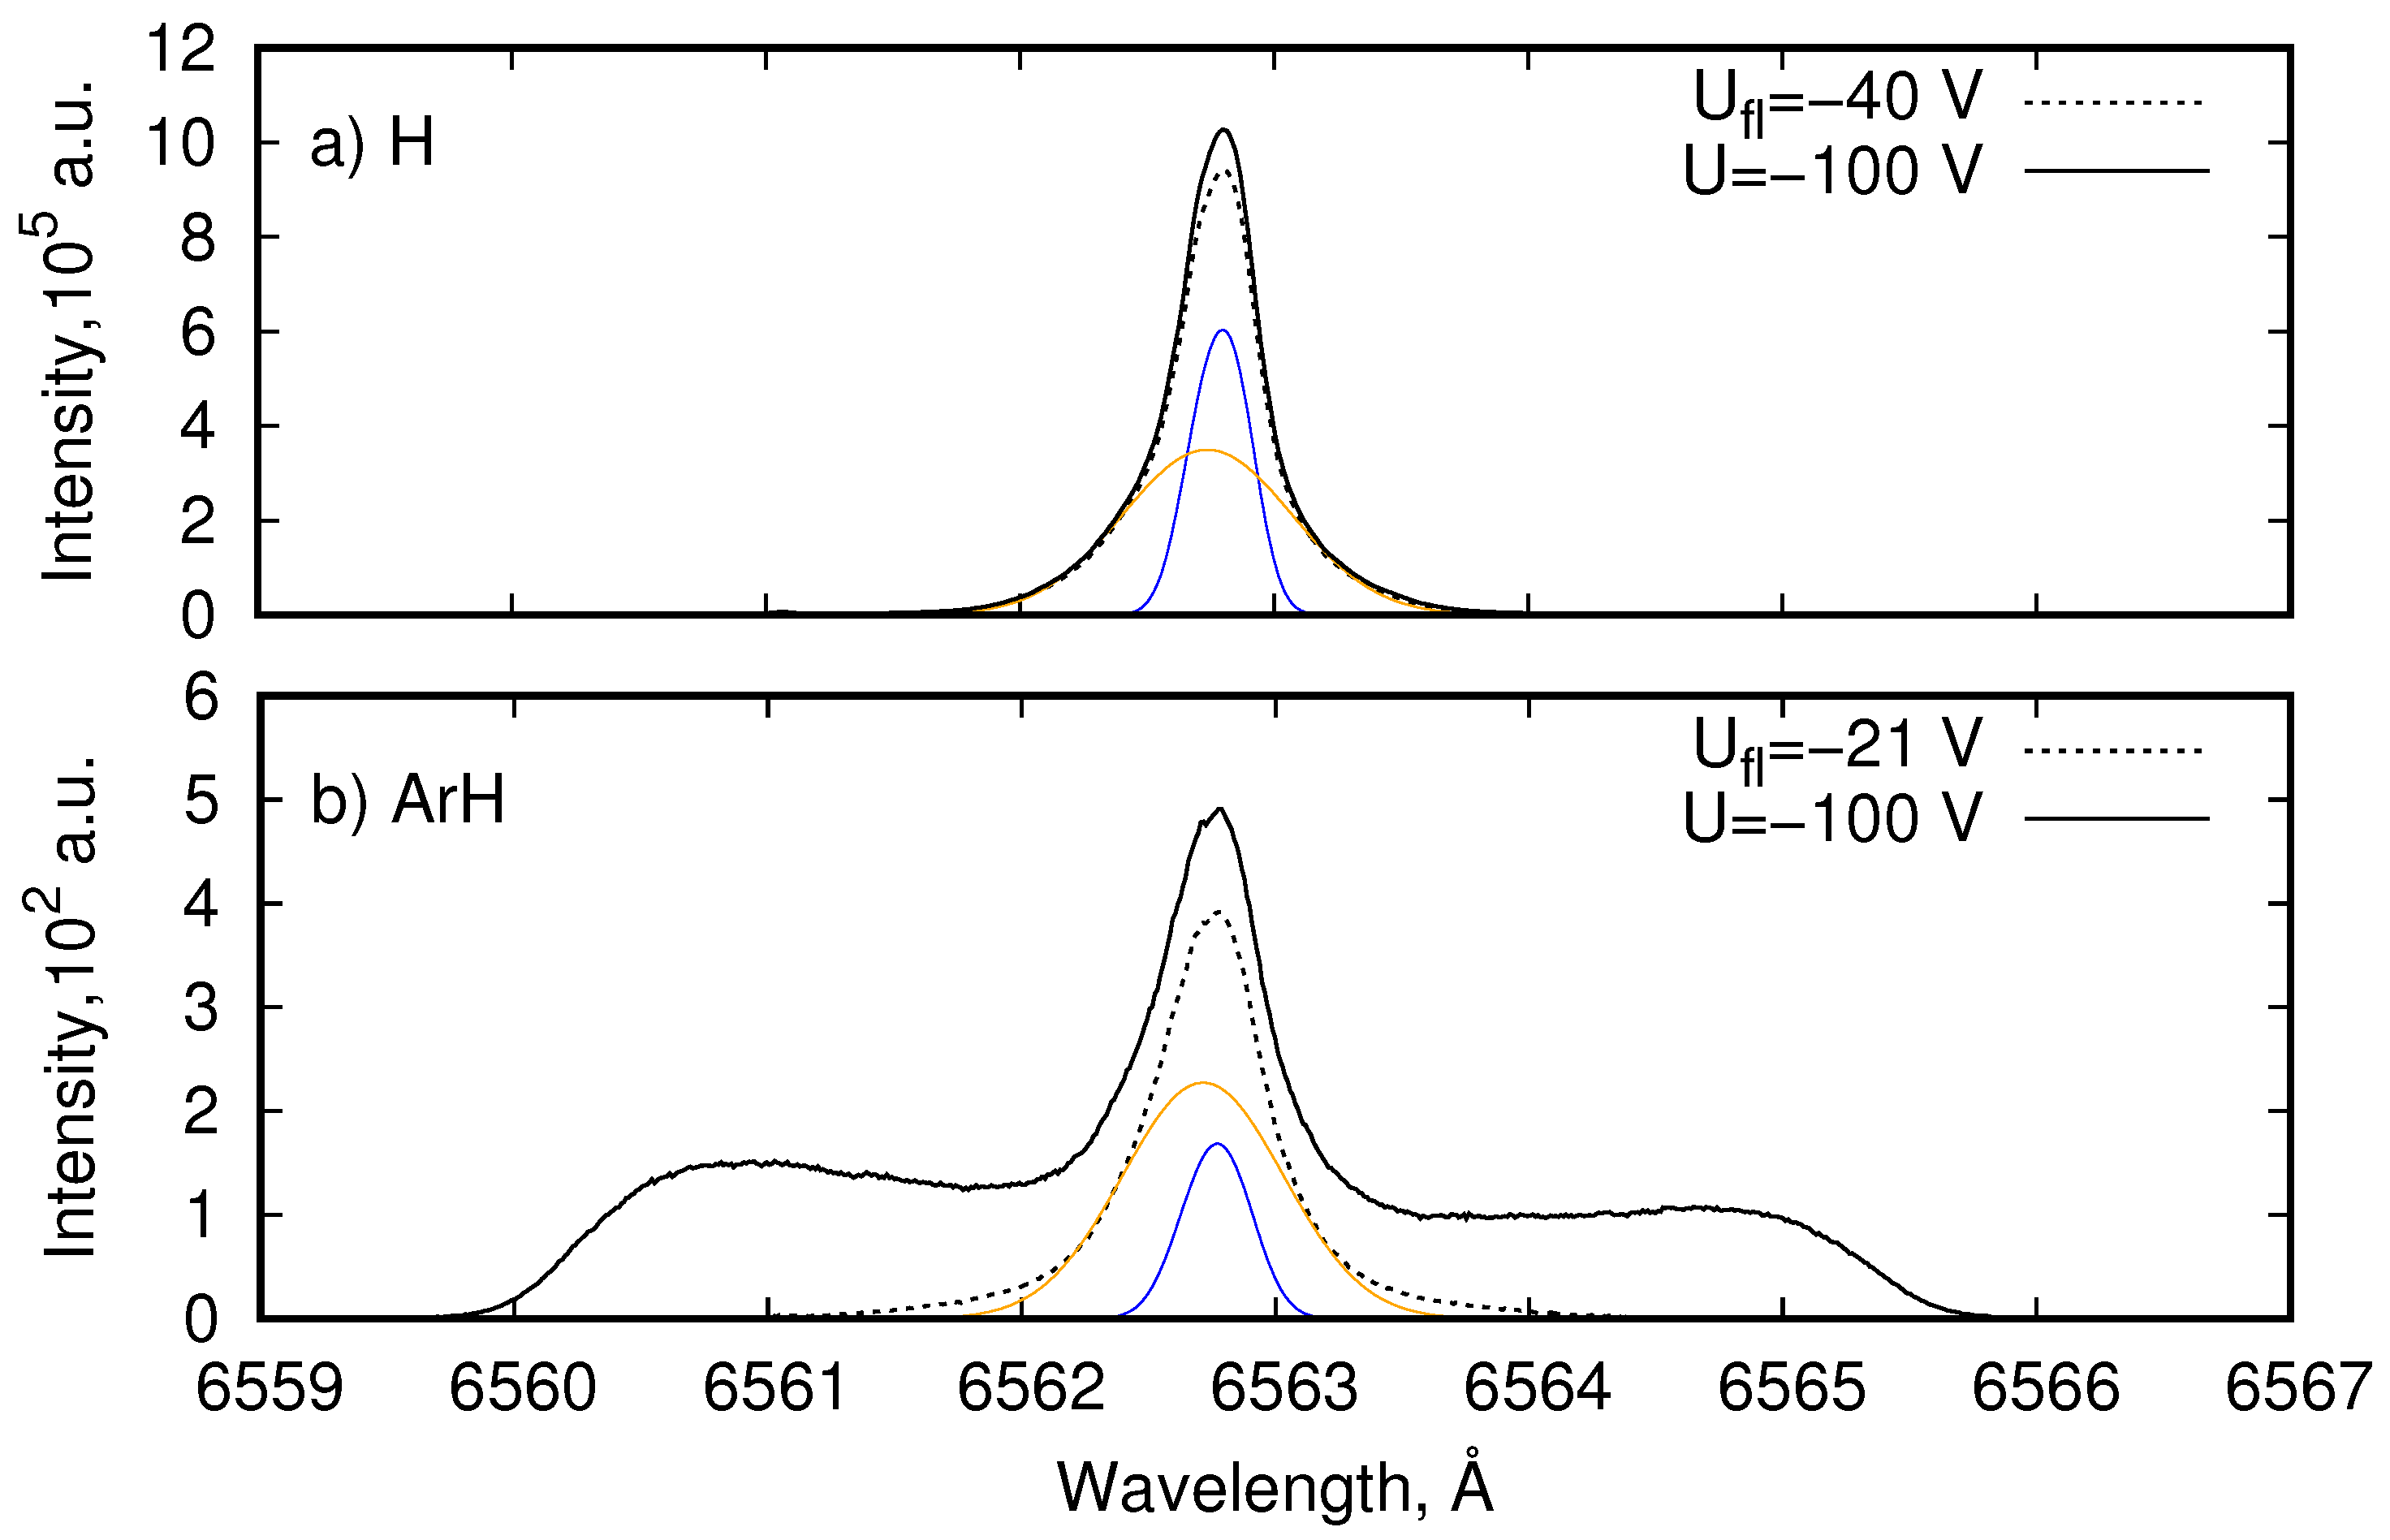
We demonstrate first that plasma conditions of PSI-2 match the requirements for reflectance measurements. Here, the mirror size D was 1.3 cm; the distance from the mirror to the front optics L was about 50 cm; the energy of ions E 0 was 100 eV; gas pressure p was 0.05 Pa; gas temperature T g (H) was about 0.1 eV; electron temperature T e was about 5 eV; and electron density n e was 10 11 cm 3 . Using these values, the sheath dimensions were ≈ 0.02 cm, Δ L ( H α ) = 2 E / m τ 3 d 0.22 cm, and λ c x 10 cm. The conditions (1), (2), and (4) were fulfilled at PSI-2. Moreover, the initially low- and later high-resolution data of the spatial propagation of the emission [20,21] validated the condition (4) at PSI-2 experimentally.

4.1. Balmer- α Line Emission in H and ArH Plasmas

In pure H plasma, the emission of reflected atoms at PSI-2 is difficult to detect (Figure 5a). Though the electron temperature achieved the value of 10 eV and approached the maximum of the Balmer- α emission rate coefficient by electron impact according to Figure 3, one could hardly separate the emission of fast atoms as the passive (background) line fully dominated the spectrum. The fraction of reflected fast atoms was negligibly small compared to the slow hydrogen atoms at the edge of PSI-2. In the case of PSI-2 plasma, the background line consisted of two components [22]. One of them was a result of the dissociation of molecules and excitation of atoms by electron impact, and the second one was the result of charge-exchange between hydrogen ions and atoms. Both components are shown in Figure 5 using the blue and the orange line, respectively. By mixing the flows of Ar and H 2 in approximately equal ratio, a considerable increase of the emission of reflected atoms was detected, whereas a dramatic decrease of the emission of the passive components was observed.
We explain it by a drop of the electron temperature from the values of 10–3 eV, the reduction of electron density, but also the reduced concentration of hydrogen atoms. The profiles of electron temperature and density in H and ArH plasmas measured using the Langmuir probe are shown in Figure 6. We should note, nevertheless, that the measurements of electron density and temperature using the Langmuir probe in the mixed plasmas were unreliable due to the different masses of Ar and H ions. Here, as the ratio of ions was not available in the experiment, the averaged mass of incident ions was derived from the relative flow of the atoms (Ar) or molecules ( H 2 ). More accurate approximations, for instance including the impact of ionization, were used in other works [23].
The signal induced by reflected atoms in the case of ArH mixed plasma at the applied potential of −100 V was indeed comparable with the integral of the passive component. In fact, one could detect the fast atoms in ArH plasma already at the floating potential of −21 V as the orange curve could not describe the emission at the blue and red shifted wings of emission. In general, the emission profile depended on the energy and the angular distribution of reflected atoms, the emission rate coefficient of the Balmer lines, and the observation angle relative to the normal θ 0 . In all cases, however, the spectral interval of the blue- and red-shifted components was limited by the observation angle and the maximal energy of the atoms.
The sketch of the profiles is shown in Figure 7. The emission of reflected atoms was observed in the spectral interval [ λ 0 Δ λ m , λ 0 + Δ λ m s i n θ 0 ], and the photons reflected at the surface were detected in the spectral interval [ λ 0 Δ λ m s i n θ 0 , λ 0 + Δ λ m ]1. Here, Δ λ m is the maximal Doppler-shift at the kinetic energy E m and velocity v m . Exactly this picture is observed in Figure 5b. The red-shifted emission reproduced the behavior of the blue-shifted one, but the amplitude was reduced. For the mirror-like surfaces, the value of reflectance could be defined as the ratio between the signal in the non-overlapping parts shown as filled regions in Figure 7a. Only the knowledge of the applied potential and the observation angle was required. Especially the last condition made the emission of reflected atoms attractive in the application for the challenges of fusion plasmas [24]. The impact of the angular distribution of atoms on the emission profiles is exemplified in Figure 7b. For the beam-like distribution of atoms (cf. §2.1 b = 10), the emission profile was narrow, whereas for the distribution with b = 0, the emission profile broadened considerably.

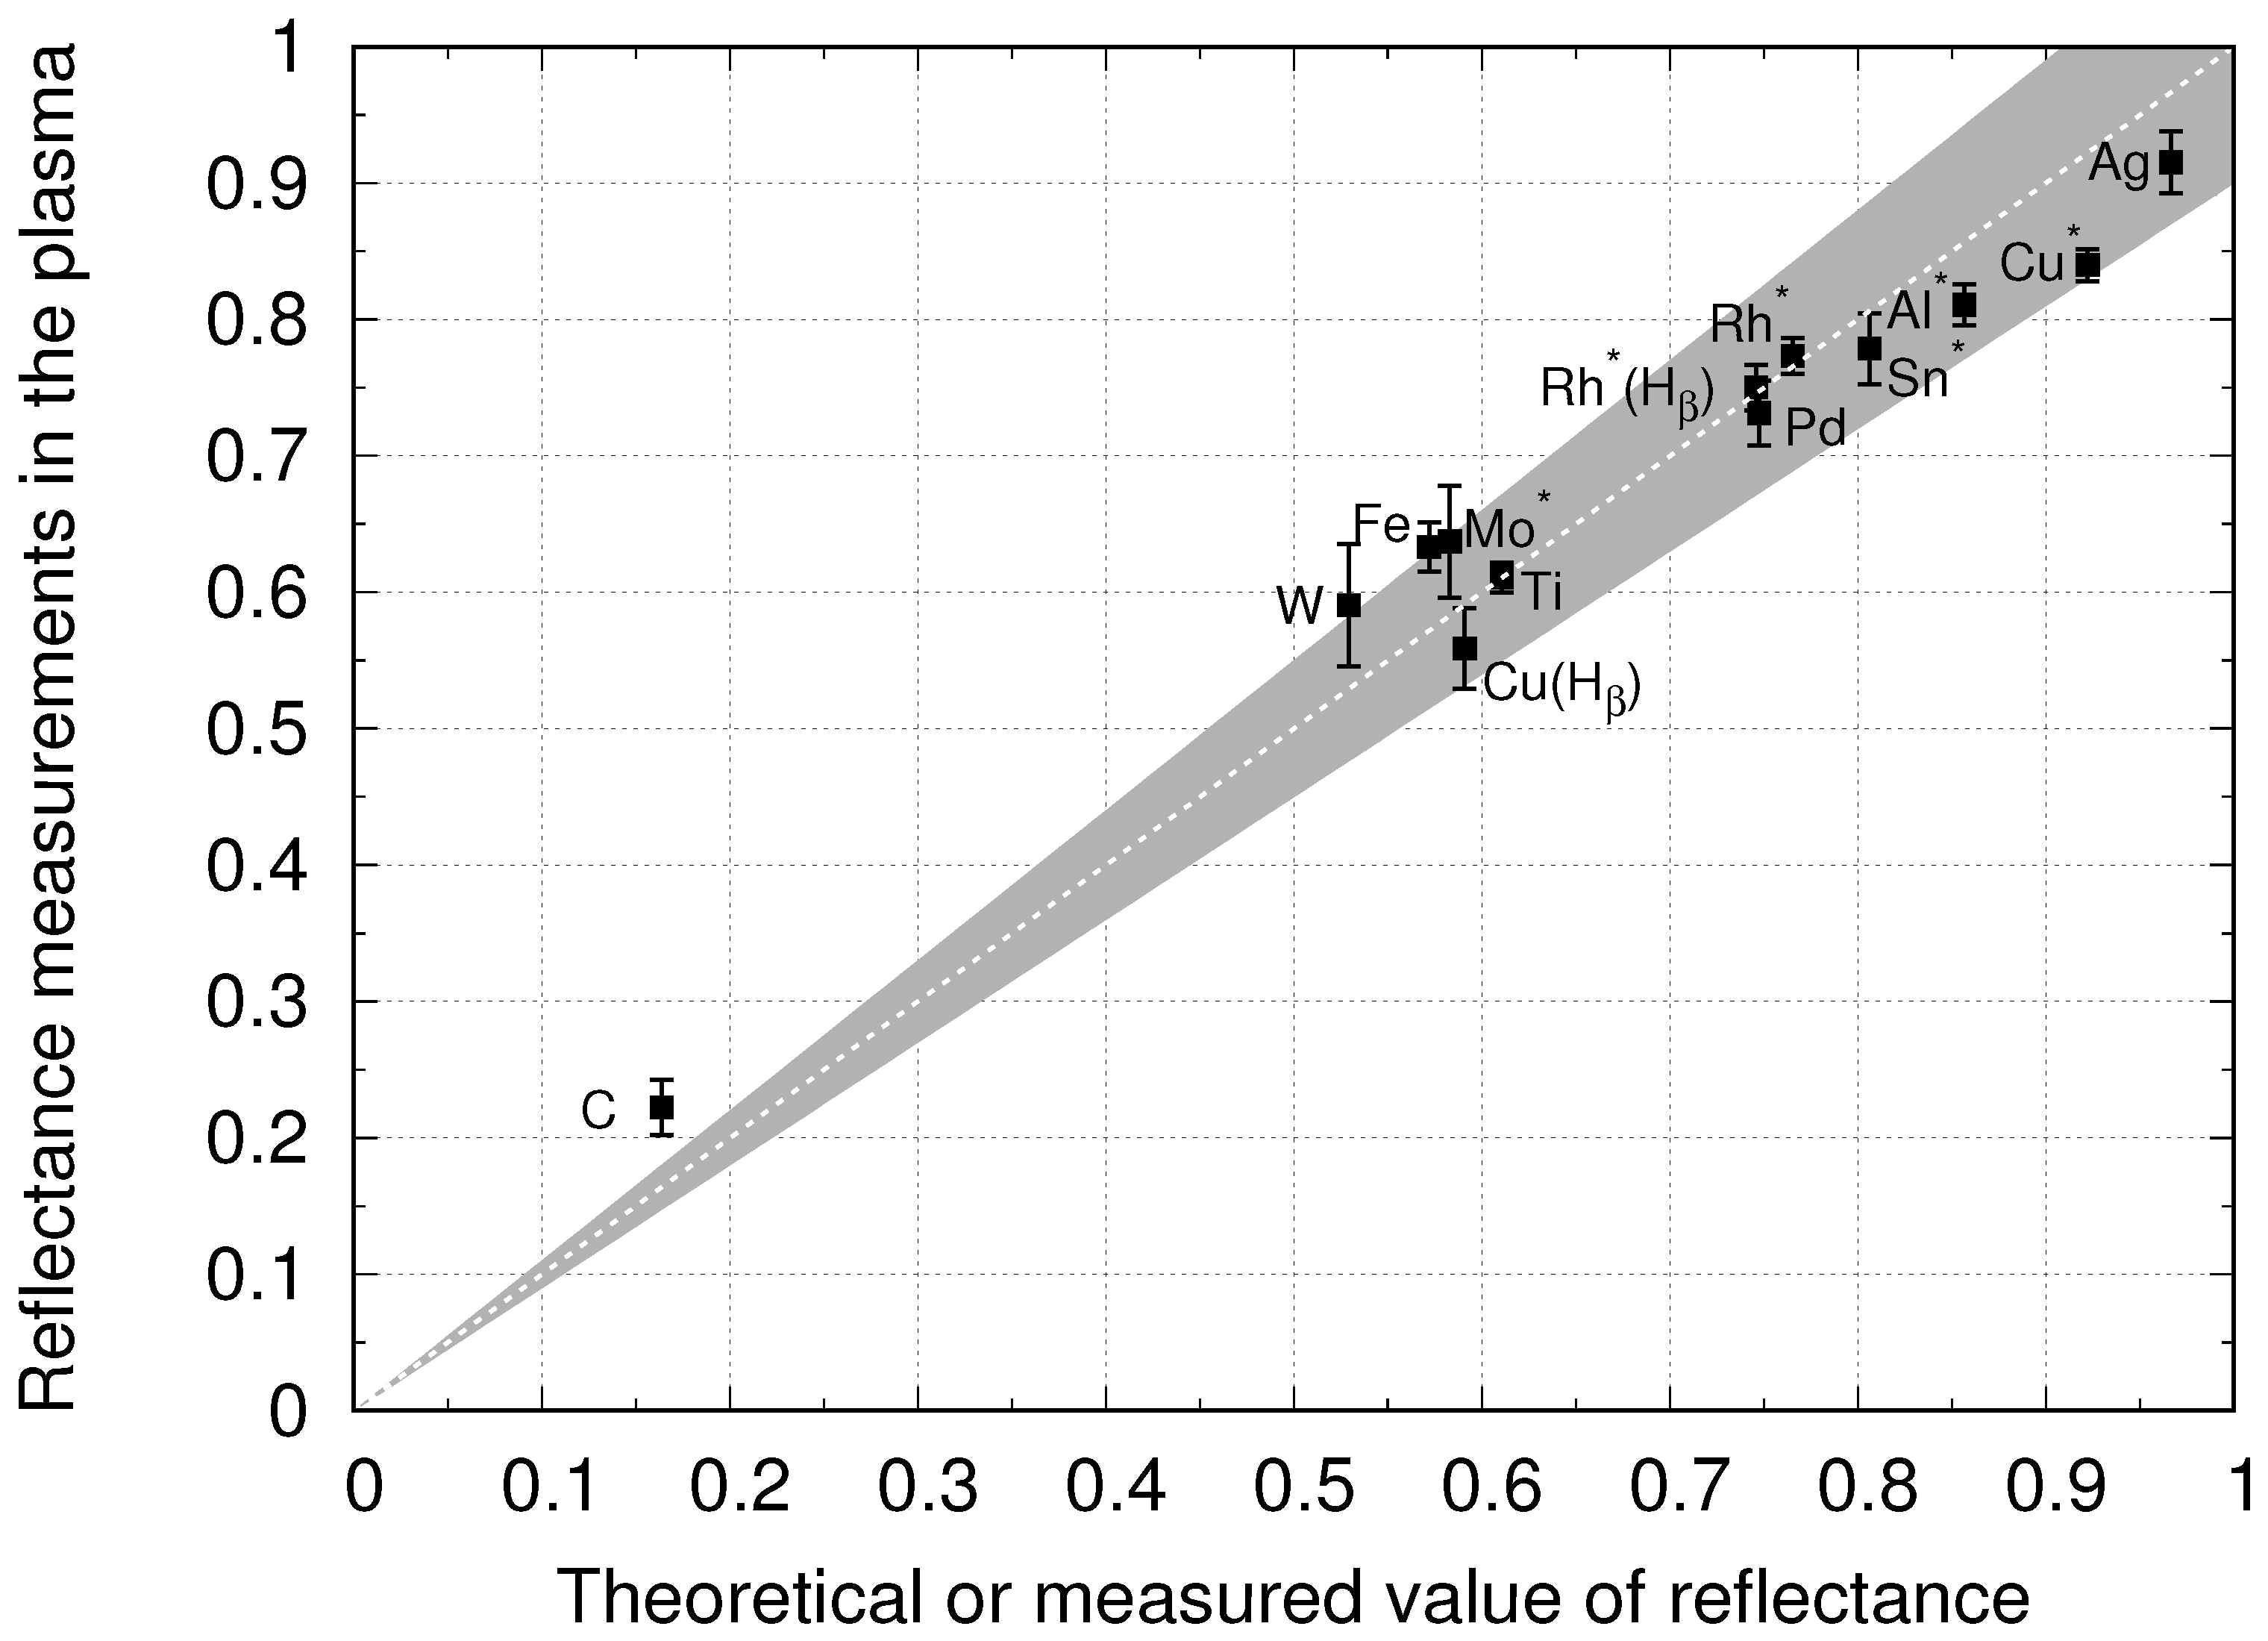
4.2. Reflectance Measurements at PSI-2

The measurements were performed at PSI-2 for polished targets. In all cases, a very good agreement with the theoretical values or the measurements prior to experiments was detected. The experimental spectra for the applied voltage of −100 V are exemplified in Figure 8 for C, Al, Fe, Mo, Pd, Ag, Sn, and W. The data are shown for the observation angle of 35 .
The following picture is observed for the transition from C to W. The spectral interval where the emission was observed shrunk for the low Z material and extended for the higher Z elements such as W. Whereas the blue-shifted shape of the emission was similar for all the elements, the red-shifted part varied from one element to another considerably. The reason for this difference was the optical properties of the elements, which can be found for instance in [25]. For C, the value of reflectivity, being the theoretical limit of reflectance, was around 0.2; for Al and Ag, it was about 0.91 or 0.97. For other materials such as W, Mo, or Pd, the values were equal to 0.53, 0.58, or 0.75, respectively [26]. In the case of C, the red-shifted part of emission was indeed suppressed considerably, for Al and Ag, the intensity of the red-shifted part was quite close to the blue-shifted one, and for W, the red-shifted emission was close to half of the blue-shifted one. The values of reflectance were found as follows. First, we determined the maximal energy of reflected atoms using the 3 σ rule, where σ is the standard deviation of the photon noise at the blue-shifted part. For this reason, the standard deviation σ was found in the interval free of emission. The onset of emission, e.g., the maximal energy E m of the atoms, was found as soon as the signal exceeded the 3 σ level. We point out that this approach did not include the energy loss of atoms by excitation of H atoms with collisions with Ar or the instrumental and fine-structure broadening. The experimentally-found value E m was compared to Equation (3) in Figure 6 of [2]. For instance, for C the value of onset of emission equaled 63 eV, being lower as required for the optimal emission signal. For W, however, the energy was found to be 96 eV. Using the experimentally-found value E m and the value for the observation angle, the integrals and the value of reflectance could be found immediately. Weak variations in the blue-shifted signal from target to target were explained by the different energy distributions of reflected particles convoluted with the emission rate coefficient.
In Figure 9, we plot the ratio of the red- to the blue-shifted integral against the theoretical values of reflectance for the Balmer- α line. For some of the targets (Rh, Al, Mo, and Sn), the measurements in the laboratory were performed prior to the experiment. The error bar of these values we estimated on the order of 3–5%.
For Rh and Cu the data for the Balmer- β line emission [27] are also included in this plot. A very good agreement with the theoretical or the measured results in the laboratory was obtained for all targets. The exception showed only C; however, as discussed above, the applied negative potential must be increased for this target, which resulted in a reduction of the ratio of corresponding integrals [2]. For all other targets, the applied potential of −100…−120 V showed the optimal condition for measurements of reflectance. We should point out that for some elements, the theoretical values of reflectance differed on the order of 10 % or more. For instance, the most recent values for W demonstrated the reflectance of about 0.55, whereas the previous measurements showed values of 0.5 [28]. For Rh or Cu, the deviations between the different models of reflectivity were even more pronounced.

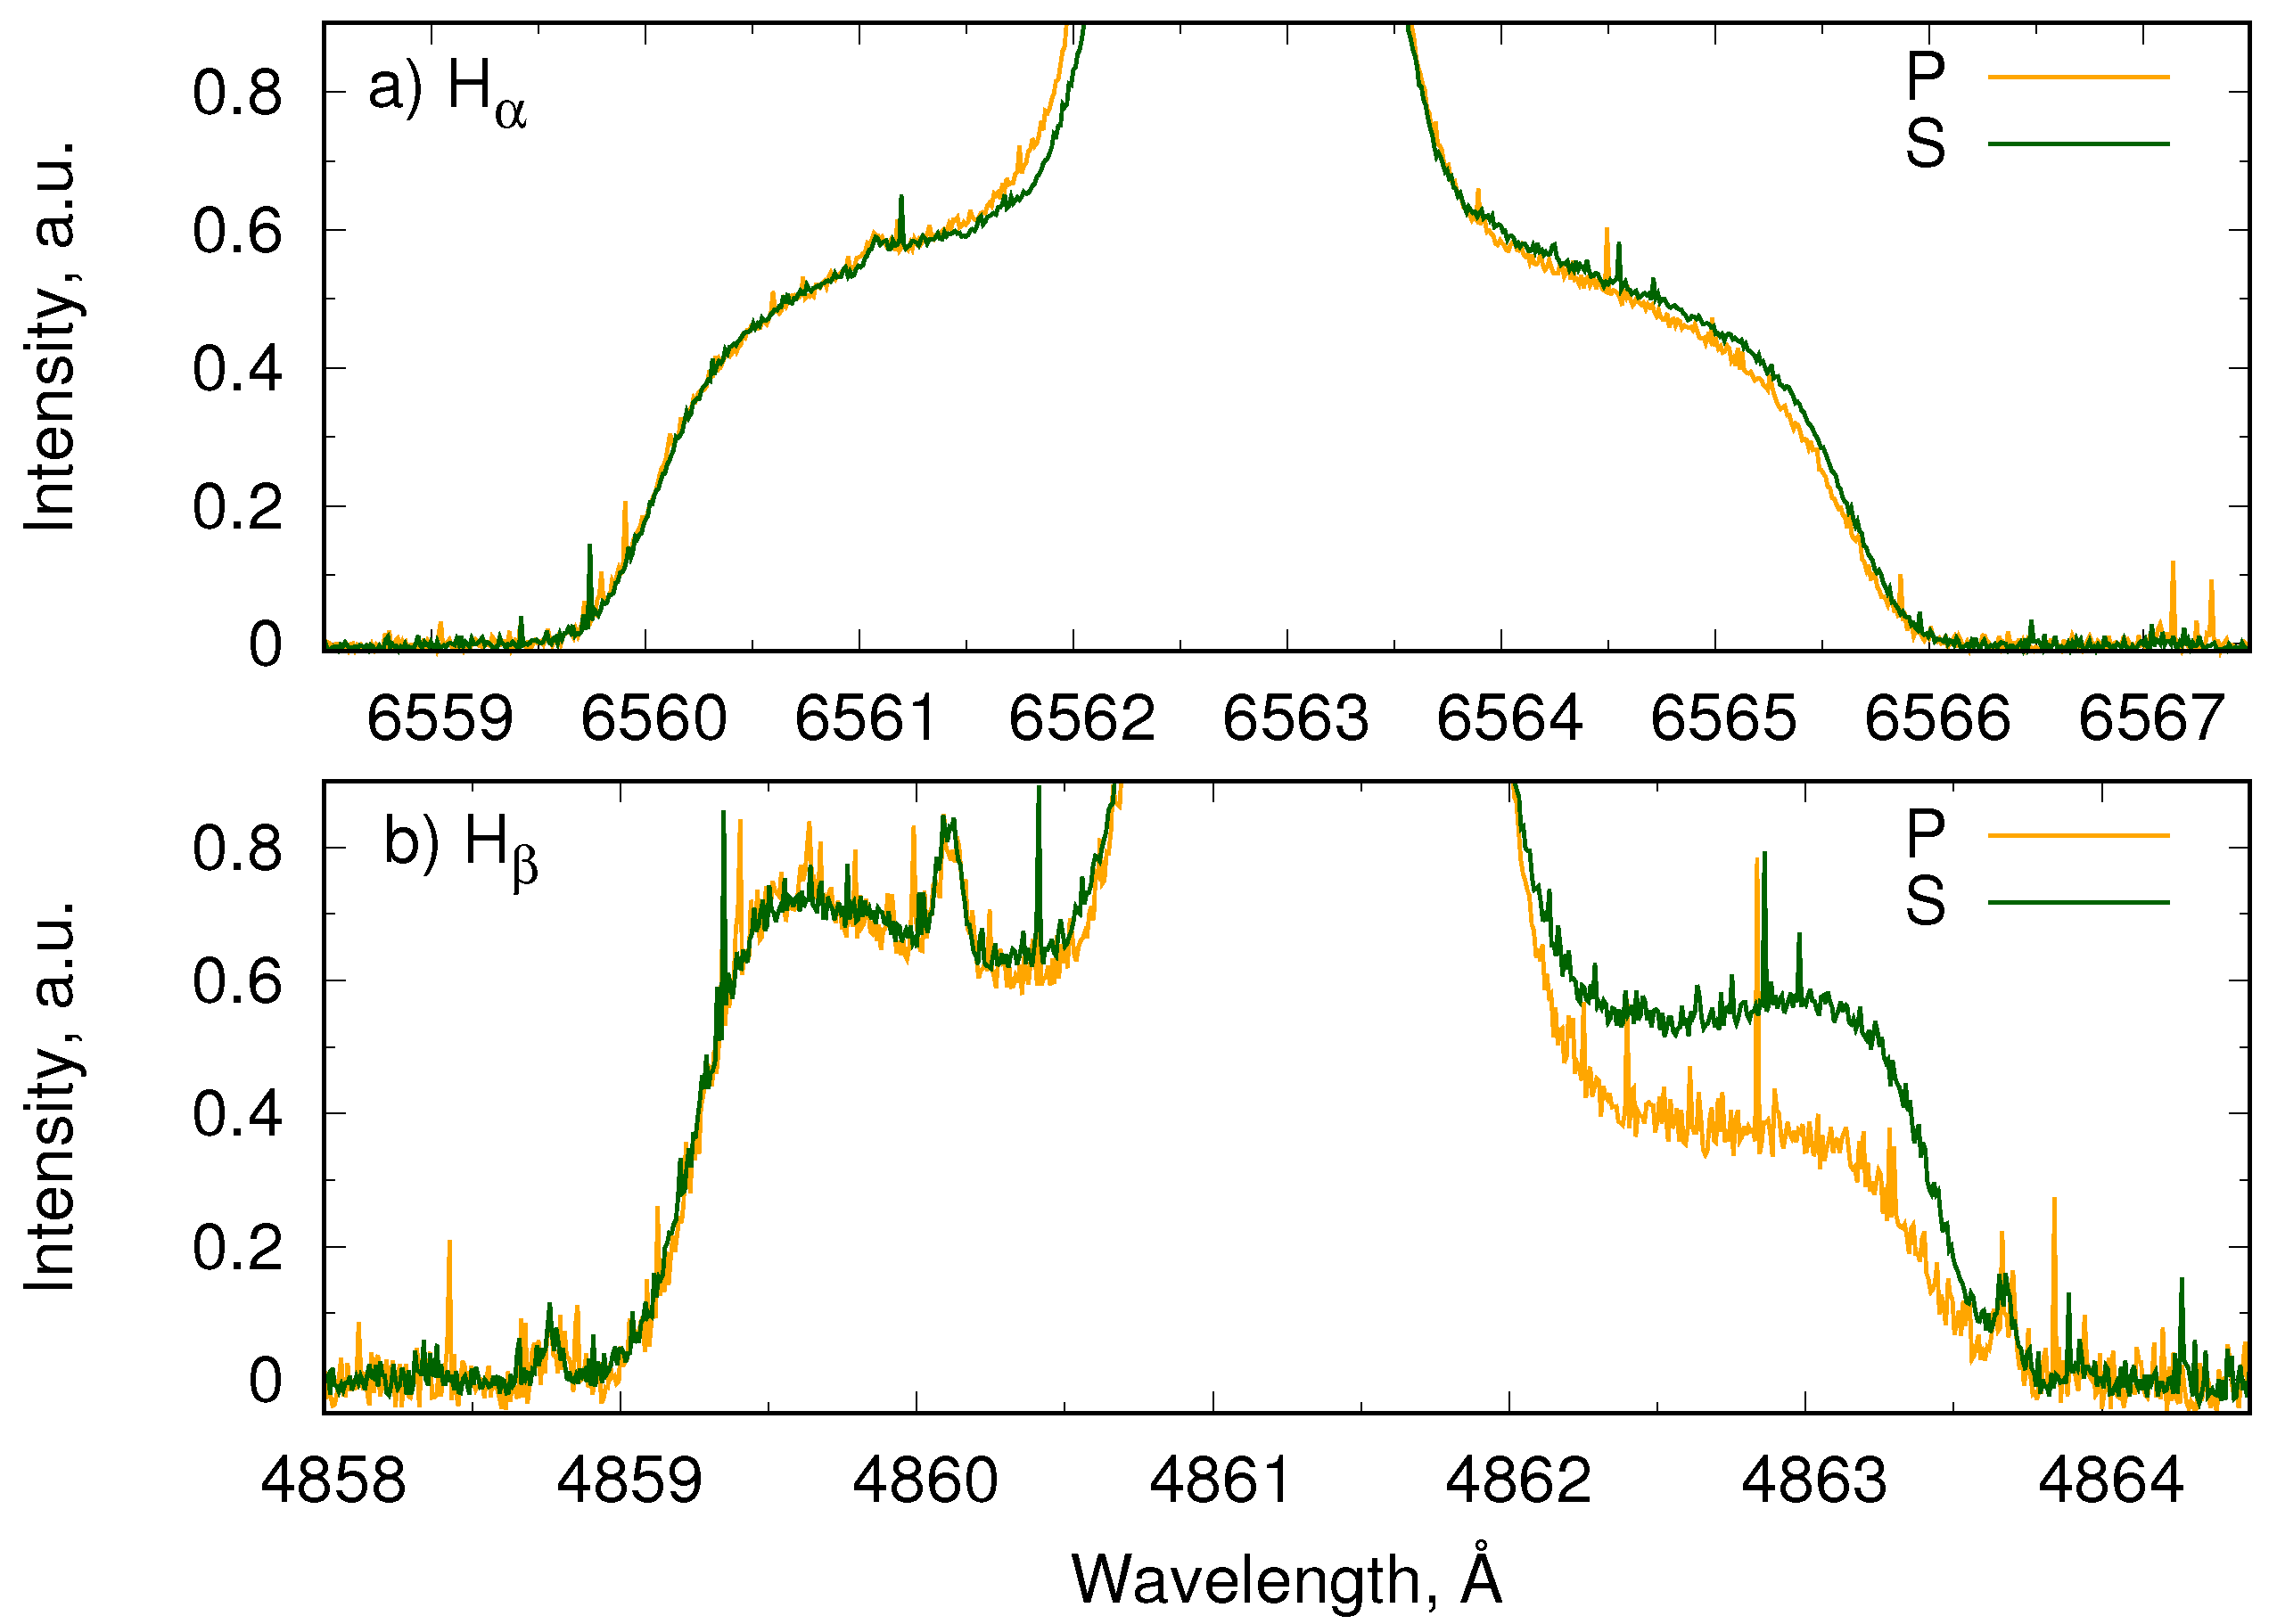
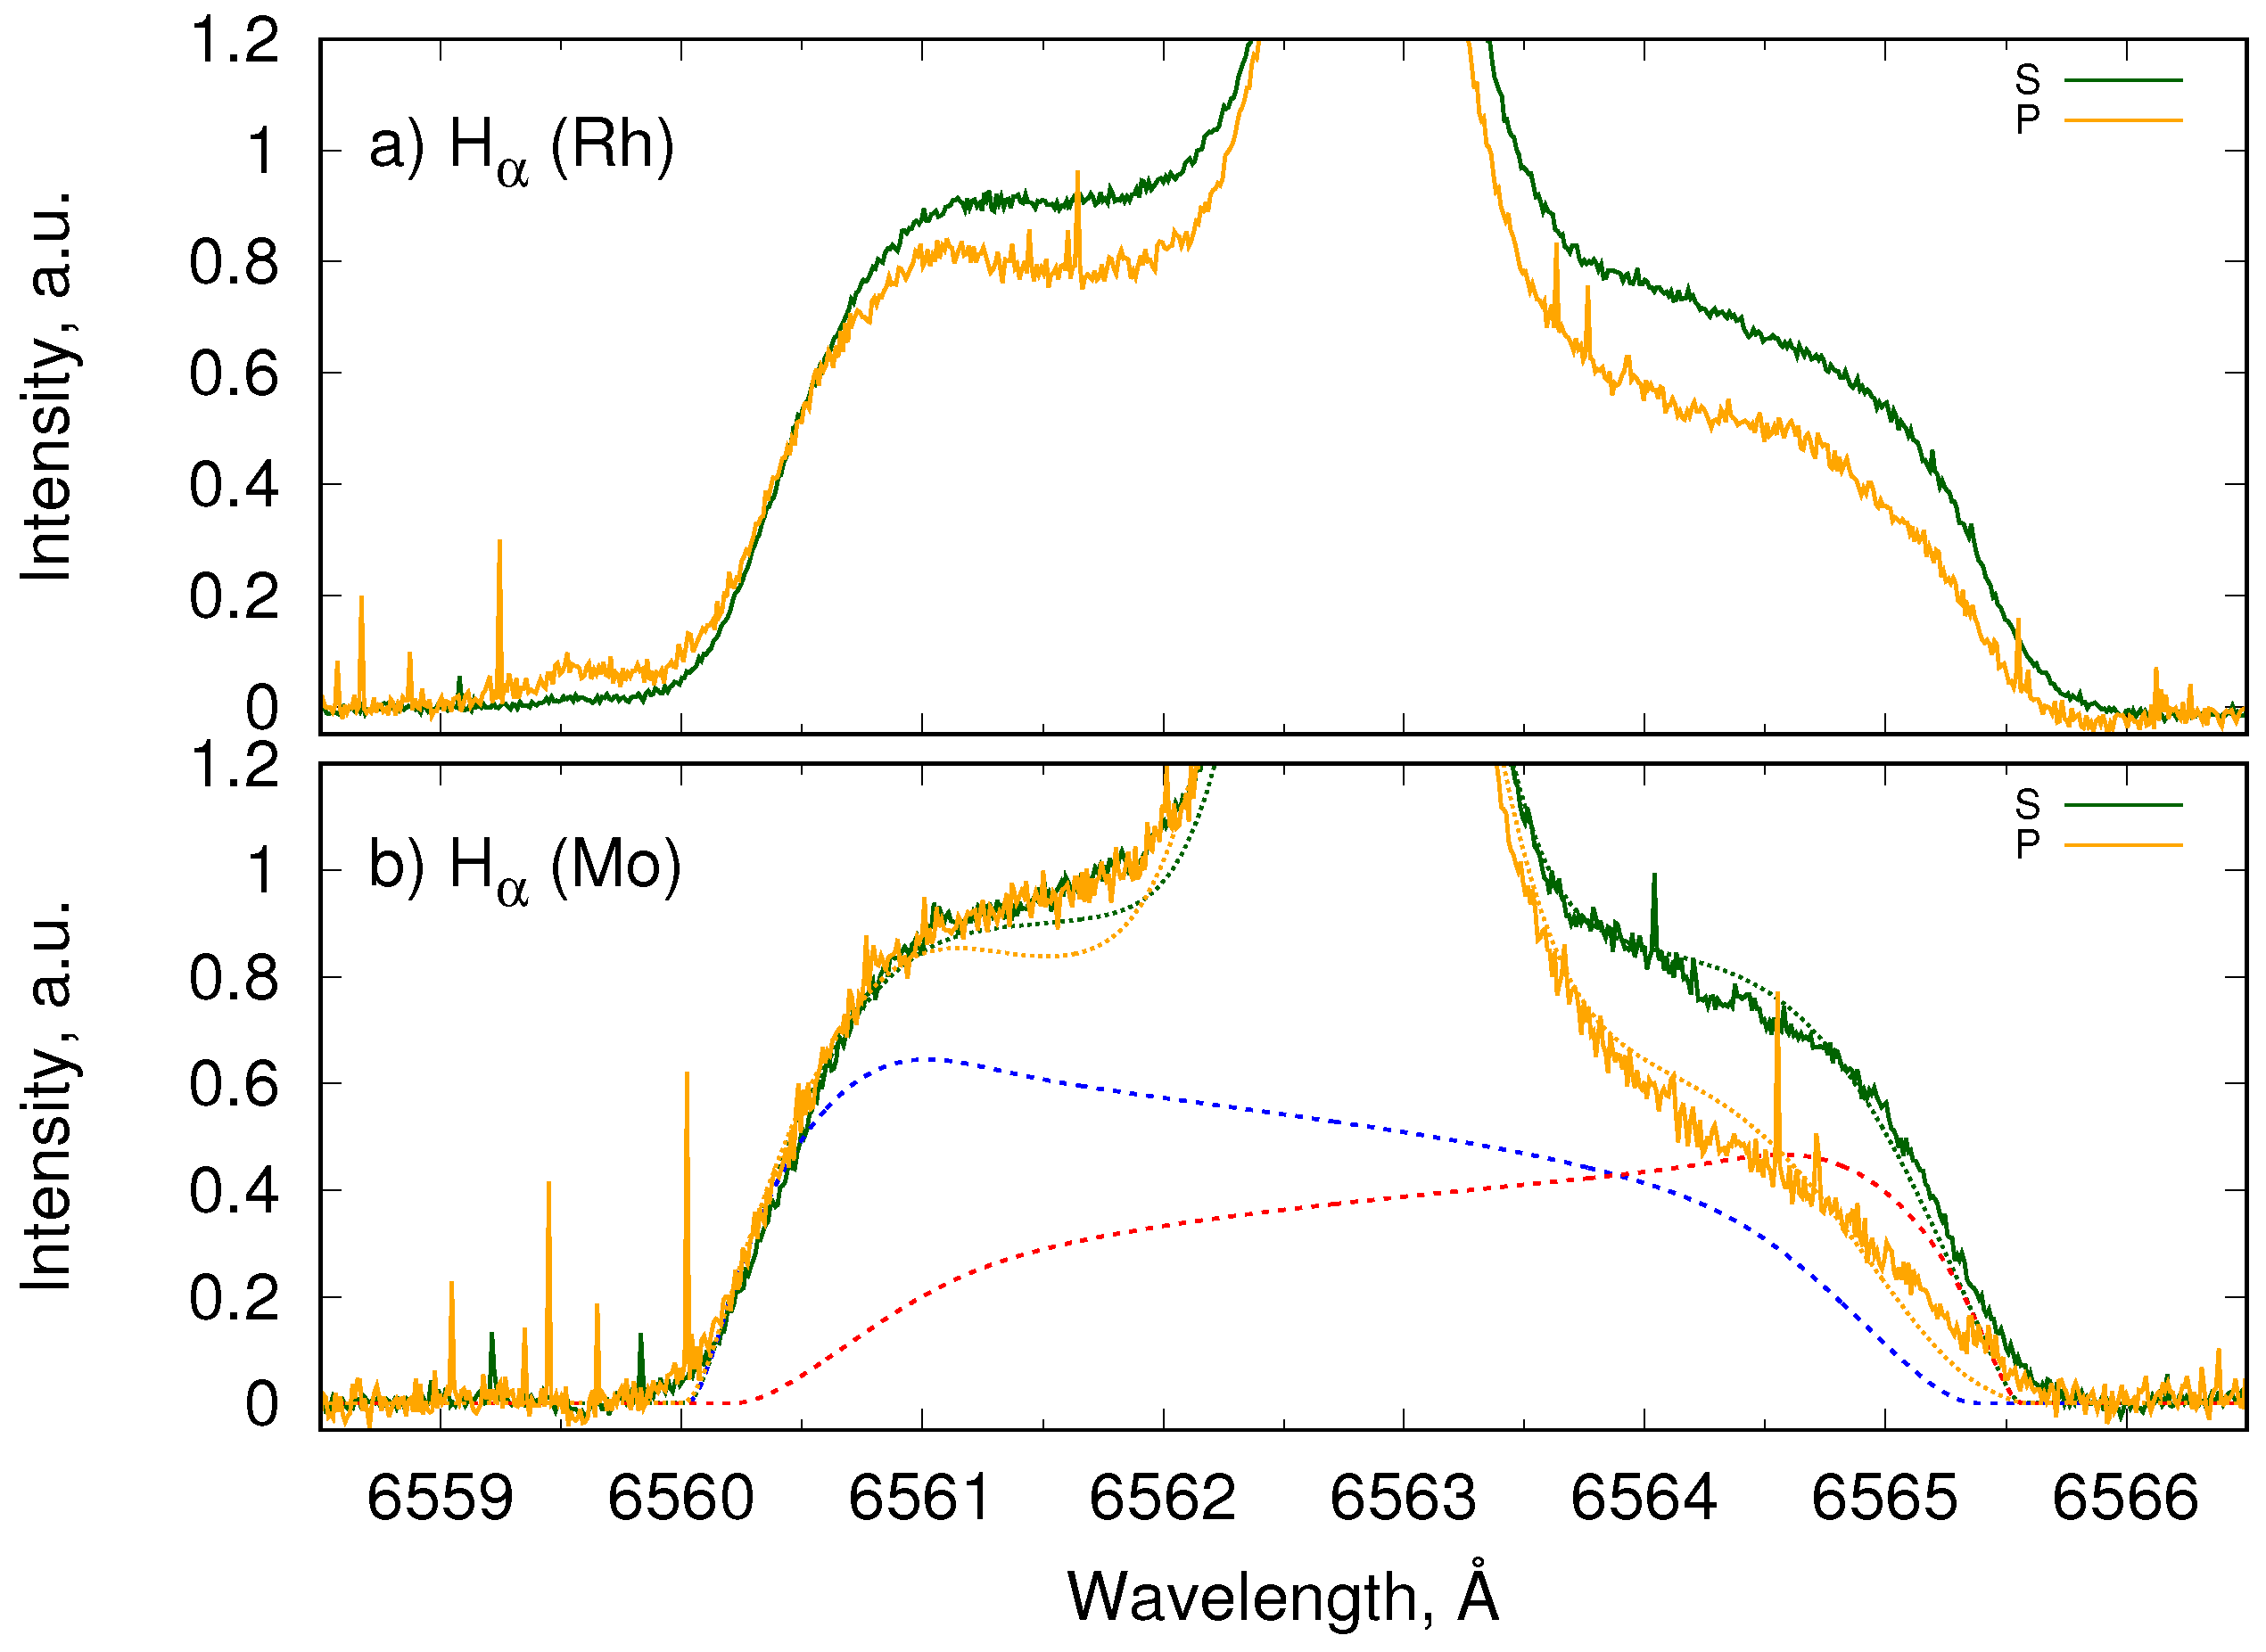
4.3. Polarization of Balmer Lines by Reflection on Metallic Surfaces

The measurements of light reflectance at metallic surfaces using the line shapes brought, however, a new question to the field related to many applications. Could one also detect the polarization properties of metallic surfaces using the line-shape of Balmer lines? Polarization plasma spectroscopy deals with the impact of the electric and magnetic field on the emission or the anisotropic excitation of atoms or ions [29]. Here, instead, we tried to detect the polarization properties of mirror-like surfaces. The measurements of emission close to the pseudo-Brewster angle should provide a clear answer to this question. For this reason, the measurements at 70 were performed for Cu, Rh, Mo, and W using a polarization cube. The experimental spectra for Cu are shown for the Balmer- α and Balmer- β lines and for Rh and Mo for the Balmer- α line.
The following effects were observed for Cu in Figure 10. First, the shape of emission was different by going from the Balmer- α (Figure 10a) to the Balmer- β (Figure 10b) line. Whereas the intensity increased by going toward the unshifted component in the Balmer- α line, the Balmer- β line showed a dip in the profiles at the red and the blue-shifted wavelengths. The S and P spectra for the Balmer- α line emission were practically symmetrical, and only a very weak difference was observed. It represents the qualitative agreement with the expectation. The S- and P-polarization of light reflection at 656 nm was equal to 0.97 and 0.91 according to [30]. The situation changes for the Balmer- β line as not only the red-shifted part reduced, but also a drop on the order of 30–40% was detected between the S and the P polarization. It is again what one expects qualitatively from the optical properties of Cu: polarized reflectivity equal to 0.83 and 0.4. The polarization by light reflection provides probably the final and the most convincing evidence of the impact of reflected photons on the observed spectra in front of the targets: the origin of the red-shifted emission was different from high-density plasma discharges [31,32]. It is obvious, however, that the spectra observed at large angles were less sensitive to the polarization of metallic surfaces as one initially would expect: the strong overlap between the direct and reflected signal resulted in reduced sensitivity of the approach. The red-shifted signal was also generated by the atoms moving practically parallel to the target, making the interpretation of spectra more difficult. The modeling of emission is required to derive the coefficients of reflectance at such angles.
Figure 11 shows the experimental data (Rh and Mo) and first results of the Doppler-shifted emission model (Mo) by considering the emission rate coefficient of H atoms by collisions with Ar in the ground state only. The difference between S and P spectra was less for Rh compared to Mo, being in agreement with the optical properties of both elements. The dotted curves show the modeling of the full spectra and red- and blue-shifted dashed lines the corresponding components induced by the emission of fast atoms. For instance, the coefficient of reflectance was equal to 0.83 and 0.17 compared to the theoretical values of 0.72 and 0.23. More details on the modeling of the emission of reflected atoms can be found in [18].

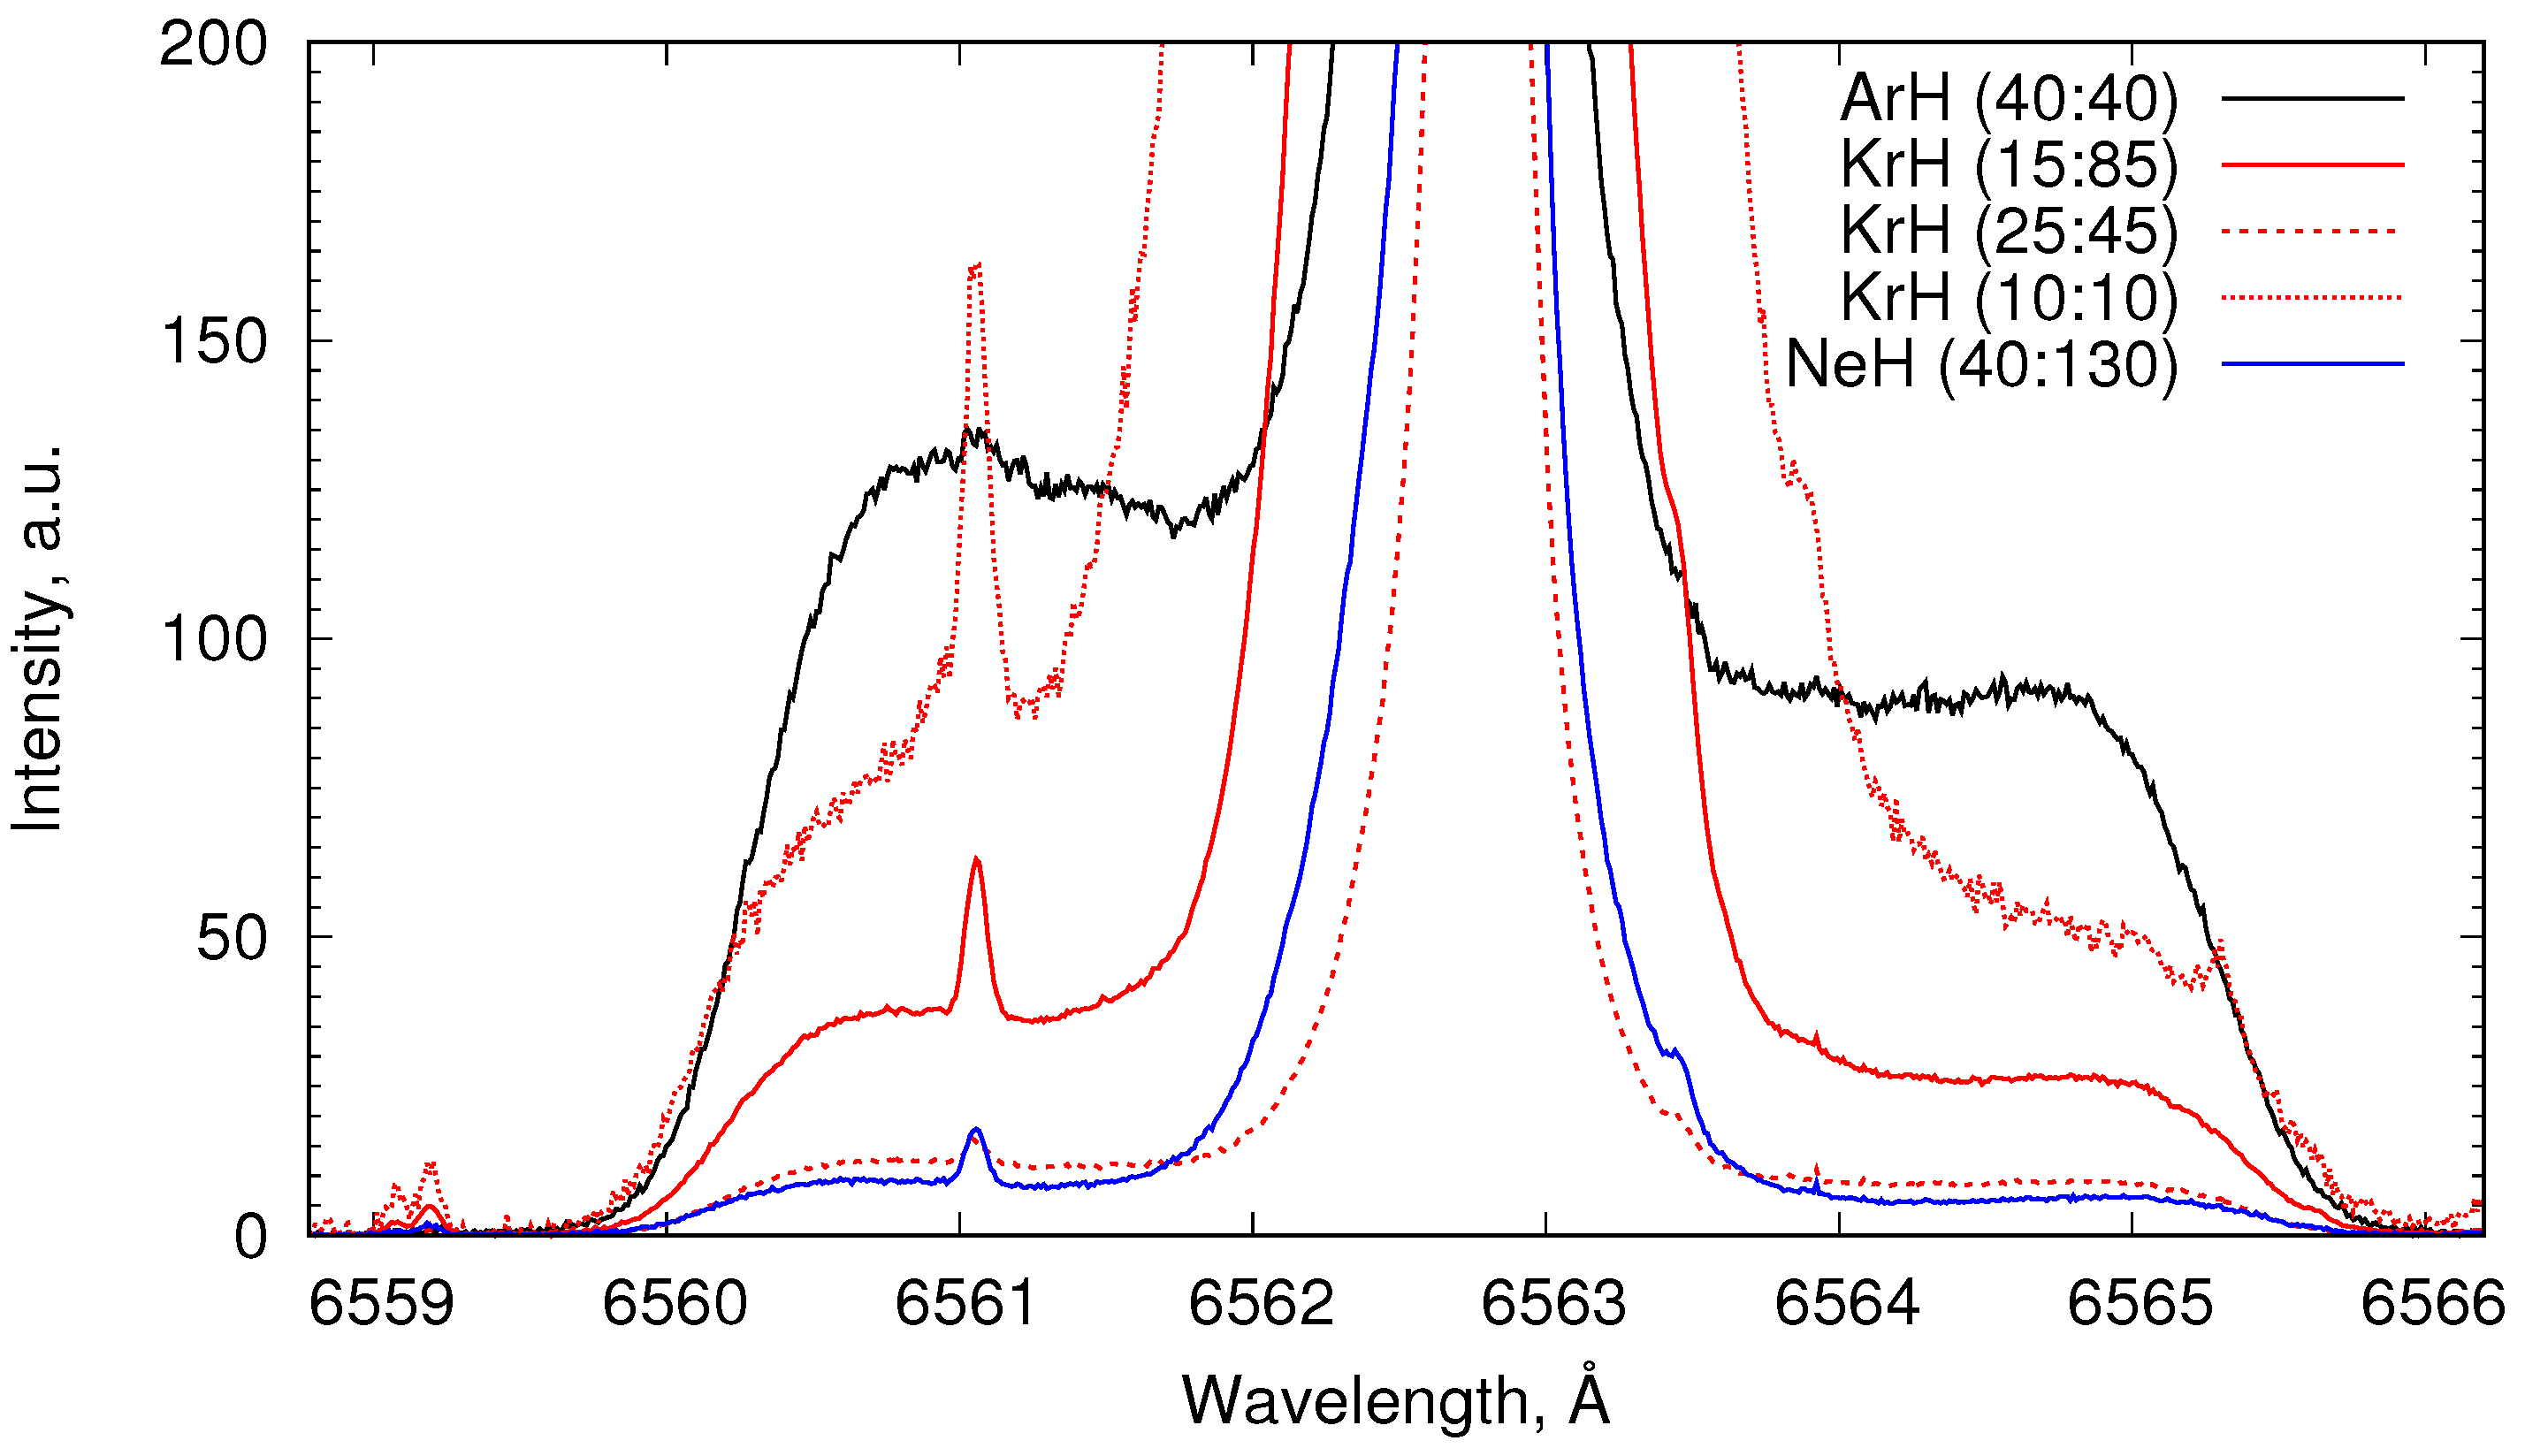
4.4. Comparison of Emission in ArH, KrH, and NeH Plasma

The measurements of emission of reflected atoms in ArH plasma at PSI-2 stimulated in the last few years a relatively new application of the high-resolution measurements of the line shapes of hydrogen lines. In addition for instance to the in situ measurements of the optical properties of metallic surfaces in low-density plasmas with low ionization degree, also the angular and energy distribution of reflected atoms could be detected. Nevertheless, one of the problem remains unsolved. It is not clear, until now, why the DSRM diagnostic operates much more successfully only in ArH plasmas, but not in the KrH ones. Figure 12 shows the example of emission also in KrH or NeH plasmas.
The emission was observed first in Ar, then by changing the gas from Ar to Kr, the emission was observed again. By all combinations of relative flows between Kr and H, the emission level of ArH plasma could not be achieved at the same pressure. The emission in case of Ar was a factor of 3–5 larger than in the case of KrH mixed plasma. By varying the relative concentration between Kr and H, the background component could be increased or reduced. However, the signal from reflected atoms was a few times weaker compared to ArH plasma. The Balmer- α emission cross-section according to [9,12] were within of 20% only. We are not aware of other measurements of the cross-section or theoretical calculations in the energy range of interest. Ionization of Kr by electron impact at the electron density of 10 11 cm 3 and plasma radius of 5 cm could hardly lead to such variation of emission as observed. Similar results were reported in a hollow cathode discharge [33]. One of the mechanism that could potentially stimulate the emission in case of Ar was the endothermal excitation or energy transfer between the metastable levels of Ar (Ar m ) and H. The energy defect between the n = 3 of H and Ar m was the lowest one, compared to other noble gases. The broadening of the Lyman- α line due to exothermic energy transfer between Ar m and H(n = 2) was reported by Clyne [34]. We hope that the newly-installed Tunable Diode Laser Absorption Spectroscopy (TDLAS) diagnostic [19], which measures the metastable fraction of Ar, combined with the emission measurements of fast atoms, will provide new insights into this excitation mechanism in the near future.

5. Discussion and Conclusions

Light reflectance at metallic surfaces is a natural phenomena, which was observed in many kinds of laboratory plasmas, including fusion, Grimm-type, or rf-plasma discharges [35,36,37]. Until now, however, this effect has been associated with the negative role by preventing the accurate derivation of plasma parameters from spectroscopic measurements [38,39]. In this paper, we tried to formulate the plasma conditions at which the light reflectance became so dominant that the emission of atoms could approximate the mirror laboratory with the aim to derive the optical properties of the surface in the absence of additional light sources.
It was shown that the Doppler effect and atom–atom collisions (Ar + H) could provide excellent in situ reflectance measurements for Conditions (1), (2), and (4). Other limitations such as gradients of plasma parameters along the mirror surface or plasma chemical reactions [40] should be also considered in future applications. The measurements of the linear plasma PSI-2 with a set of mirror-like surfaces demonstrated a very good agreement within 10%. Only for materials with a very low value of reflectance, it was more difficult to obtain precise values. By biasing the surface to the kinetic energy of hydrogen ions of 80–120 eV, one probably obtains the optimal condition for elements with Z > 10, where Z is the atomic number of the element assuming that the H + ion is the dominant fraction. Otherwise, the energy of the ions has to be increased. The DSRM diagnostics remains sensitive to the polarization properties of the materials so that the degradation or the recovery of optical properties of plasma–surface components could be traced. We already reported the degradation of Al mirror at elevated temperatures [41].
In spite of unexploited applications of DSRM diagnostics, including the cleaning of surfaces by Ar + , one of the principal questions remains: it is not understood why the excitation of reflected H atoms by Ar atoms is much more efficient compared to Kr. We hope that with this study will stimulate further theoretical calculations of atom–atom collisions in the energy range of 10–100 eV.

Author Contributions

Conceptualization, O.M., S.D., and P.M.; methodology, C.B. and S.D.; software, A.K. and C.B.; validation, S.D., S.E., and C.B.; formal analysis, S.D. and S.E.; investigation, Y.K., A.G., and M.I.; resources, P.M., S.B., and C.L.; data curation, A.K., S.D., and S.E.; preparation of the samples, B.G.; writing, O.M. and P.M.; review and editing, C.B., P.M., and S.B., S.D., and S.E.; supervision, O.M.; project administration, P.M. and S.B.; funding acquisition, S.B., P.M., and C.L.

Funding

This research was funded by the Program-oriented Funding (PoF) of the Helmholtz-Gemeinschaft Deutscher Forschungszentren (HGF).

Acknowledgments

This work was carried out within the framework of the EUROfusion Consortium and has received funding from the Euratom research and training program 2014–2018 and 2019–2020 under Grant agreement No. 633053. The views and opinions expressed herein do not necessarily reflect those of the European Commission.

Conflicts of Interest

The authors declare no conflict of interest.

References

  1. Marchuk, O.; Brandt, C.; Pospieszczyk, A. Verfahren zur Bestimmung der Oberflächeneigenschaften von Targets. German Patent DE102016002270B3, 10 August 2017. [Google Scholar]
  2. Dickheuer, S.; Marchuk, O.; Brandt, C.; Pospieszczyk, A.; Goriaev, A.; Ialovega, M.; Göths, B.; Krasikov, Y.; Krimmer, A.; Mertens, P.; et al. In-situ measurements of the spectral reflectance of metallic mirrors at the Hα line in a low density Ar-H plasma. Rev. Sci. Instrum. 2018, 89, 063112. [Google Scholar] [CrossRef] [PubMed]
  3. NRL Plasma Formulary; NRL/PU/6790-18-640; Plasma Physics Division, Naval Research Laboratory: Washington, DC, USA, 2018.
  4. Stangeby, P.C. The Plasma Boundary of Magnetic Fusion Devices; IoP Publishing Ltd.: Bristol, UK; Philadelphia, PA, USA, 2000; p. 73. [Google Scholar]
  5. Videnović, I.R.; Konjević, N.; Kuraica, M.M. Spectroscopic investigations of a cathode fall region of the Grimm-type glow discharge. Spectrochim. Acta Part B 1996, 51, 1707–1731. [Google Scholar] [CrossRef]
  6. Verbeek, H. Backscattering of light ions from metal surfaces. In Symposium on Radiation Effects on Solid Surfaces; Kaminsky, M., Ed.; American Chemical Society: Washington, DC, USA, 1976; pp. 245–261. [Google Scholar]
  7. Smith, D.P. Analysis of surface composition with low-energy backscattered ions. Surf. Sci. 1976, 25, 171–191. [Google Scholar] [CrossRef]
  8. Aratari, R.; Eckstein, W. Backscattering of atomic and molecular hydrogen from nickel and carbon. Nucl. Instrum. Methods Phys. Res. B 1989, 42, 11–18. [Google Scholar] [CrossRef]
  9. Van Zyl, B.; Neumann, H.; Rothwell, H.L.; Amme, R.C. Balmer-α and Balmer-β emission cross-sections for H+Ar collisions. Phys. Rev. A 1980, 21, 716. [Google Scholar] [CrossRef]
  10. Van Zyl, B.; Gealy, M.W.; Neumann, H. Balmer-α and Balmer-β emission cross-sections for low-energy H collisions with He and H2. Phys. Rev. A 1983, 28, 176. [Google Scholar] [CrossRef]
  11. Van Zyl, B.; Gealy, M.W.; Neumann, H. Excitation of low-energy H atoms in H + Ne collisions. Phys. Rev. A 1985, 31, 2922. [Google Scholar] [CrossRef]
  12. Van Zyl, B.; Neumann, H.; Gealy, M.W. Balmer-line emission from low-energy H impact on Kr and Xe. Phys. Rev. A 1986, 33, 2093. [Google Scholar] [CrossRef]
  13. Van Zyl, B.; Gealy, M.W. Lyman-α emission from low-energy H impact on rare-gas atoms. Phys. Rev. A 1987, 35, 3741. [Google Scholar] [CrossRef]
  14. Eckstein, W. Reflection (Backscattering). Garching: Max-Planck-Institut für Plasmaphysik, 2009. Available online: https://pure.mpg.de/rest/items/item_2141005_1/component/file_2141004/content (accessed on 11 November 2014).
  15. Bray, I.; Ralchenko, Y. CCC Data Base. 1997. Available online: http://atom.curtin.edu.au/CCC-WWW/ (accessed on 11 November 2014).
  16. Herschkowitz, N. Sheaths: More complicated than you think. Phys. Plasma 2005, 12, 055502. [Google Scholar] [CrossRef]
  17. Kreter, A.; Brandt, C.; Huber, A.; Kraus, S.; Möller, S.; Reinhart, M.; Schweer, B.; Sergienko, G.; Unterberg, B. Linear plasma device PSI-2 for plasma-material interaction studies. Fusion Sci. Technol. 2015, 68, 8–14. [Google Scholar] [CrossRef]
  18. Dickheuer, S.; Marchuk, O.; Krasikov, Y.; Mertens, P.; Brandt, C.; Ertmer, S.; Börner, P.; Reiter, D.; Göths, B.; von Bovert, K.; et al. Polarization by light reflection at metallic surfaces observed in the shape of the Balmer-α line of low density plasmas. Phys. Plasma 2019, 26, 073513. [Google Scholar] [CrossRef]
  19. Dickheuer, S.; Marchuk, O.; Tsankov, T.V.; Luggenhølscher, D.; Czarnetzki, U.; Gromelski, W.; Ertmer, S.; Kreter, A. Measurement of the Magnetic Field in a Linear Magnetized Plasma by Tunable Diode Laser Absorption Spectroscopy. Atoms 2019, 7, 48. [Google Scholar] [CrossRef]
  20. Brandt, C.; Marchuk, O.; Pospieszczyk, A.; Dickheuer, S. Emission of fast non-Maxwellian hydrogen atoms in low-density laboratory plasma. AIP Conf. Proc. 2017, 1811, 130001. [Google Scholar]
  21. Marchuk, O.; Brandt, C.; Pospieszczyk, A.; Reinhart, M.; Brezinsek, S.; Unterberg, B.; Dickheuer, S. Emission of fast hydrogen atoms at a plasma-solid interface in a low density plasma containing noble gases. J. Phys. B At. Mol. Opt. Phys. 2018, 51, 025702. [Google Scholar] [CrossRef]
  22. Waldmann, O.; Meyer, H.; Fussmann, G. Anomalous diffusion in a linear plasma generator. Contrib. Plasma Phys. 2007, 47, 691–702. [Google Scholar] [CrossRef]
  23. Severn, G.; Yip, C.-S.; Hershkowitz, N.; Baalrud, S.D. Experimental studies of ion flow near the sheath edge in multiple ion species plasma including argon, xenon and neon. Plasma Sources Sci. Technol. 2017, 26, 055021. [Google Scholar] [CrossRef]
  24. Mertens, P. The Core-Plasma CXRS Diagnostic for ITER: An Introduction to the Current Design. J. Fusion Energy 2019, 38, 264–282. [Google Scholar] [CrossRef]
  25. Polyanskiy, M.N. Refractive Index Database. Available online: https://refractiveindex.info (accessed on 26 June 2019).
  26. Werner, W.S.M.; Glantschnig, K.; Ambrosch-Draxl, C. Optical constants and inelastic electron-scattering data for 17 elemental metals. J. Phys. Chem. Ref. Data 2009, 38, 1013–1092. [Google Scholar] [CrossRef]
  27. Merten, P.; Boman, R.; Dickheuer, S.; Krasikov, Y.; Krimmer, A.; Leichtle, D.; Liegeois, K.; Linsmeier, C.; Litnovsky, A.; Marchuk, O.; et al. On the use of rhodium mirrors for optical diagnostics in ITER. Fusion Eng. Des. 2019. [Google Scholar] [CrossRef]
  28. Minissale, M.; Pardanaud, C.; Bisson, R.; Gallais, L. The temperature dependence of optical properties of tungsten in the visible and near-infrared domains: An experimental and theoretical study. J. Phys. D Appl. Phys. 2017, 50, 455601. [Google Scholar] [CrossRef]
  29. Fujimoto, T.; Iwamae, A. Plasma Polarization Spectroscopy; Springer: Heidelberg, Germany, 2008. [Google Scholar]
  30. Rakic, A.D.; Djurišic, A.B.; Elazar, J.M.; Majewski, M.L. Optical properties of metallic films for vertical-cavity optoelectronic devices. Appl. Opt. 1998, 37, 5271–5283. [Google Scholar] [CrossRef]
  31. Phelps, A.V. Energetic ion, atom, and molecule reactions and excitation in low-current H2 discharges: Model. Phys. Rev. E 2009, 79, 066401. [Google Scholar] [CrossRef]
  32. Phelps, A.V. Collisional kinetics of non-uniform electric field, low-pressure, direct-current discharges in H2. Plasma Sources Sci. Technol. 2011, 20, 043001. [Google Scholar] [CrossRef]
  33. Lavrov, B.P.; Melnikov, A.S. Observation of charge-exchange effects from the Doppler profiles of Balmer lines in H2+Ne, Ar and Kr hollow-cathode discharges. Optika i Spektroskopiya 1993, 75, 1152–1163. [Google Scholar]
  34. Clyne, M.A.A.; Heaven, M.C.; Bayes, K.D.; Monkhouse, P. Energy transfer in collisions of excited Ar(3P0,2) metastable atoms with H(2S) atoms. II. Lyman-α emission profile. Chem. Phys. 1980, 47, 179–188. [Google Scholar] [CrossRef]
  35. Brooks, N.H.; Isler, R.C.; Whyte, D.G.; Fenstermacher, M.E.; Groebner, R.J.; Stangeby, P.C.; Heidbrink, W.W.; Jackson, G.L.; Mahdavi, M.A.; West, W.P.; et al. Measured signatures of low energy, physical sputtering in the line shape of neutral carbon emission. J. Nucl. Mater. 2005, 337–339, 227–231. [Google Scholar] [CrossRef]
  36. Šišović, N.M.; Majstorović, G.L.; Konjević, N. Excessive Doppler broadening of the Hα line in a hollow cathode glow discharge. Eur. Phys. J. D 2007, 41, 143–150. [Google Scholar] [CrossRef]
  37. Babkina, T.; Gans, T.; Czarnetzki, U. Energy analysis of hyperthermal hydrogen atoms generated through surface neutralisation of ions. Europhys. Lett. 2005, 72, 235. [Google Scholar] [CrossRef]
  38. Banerjee, S.; Vasu, P.; von Hellermann, M.; Jaspers, R.J.E. Wall reflection modeling for charge exchange recombination spectroscopy (CXRS) measurements on Textor and ITER. Plasma Phys. Contr. Fusion 2010, 52, 125006. [Google Scholar] [CrossRef]
  39. Schunke, B.; Huysmans, G.; Thomas, P. Evidence of the influence of reflections on the Zeff profile measurements and their mitigation. In Proceedings of the 31st EPS Conference on Plasma Physics, London, UK, 28 June–2 July 2004. [Google Scholar]
  40. Hjartarson, A.T.; Thorsteinsson, E.G.; Gudmundsson, J.T. Low pressure hydrogen discharges diluted with argon explored using a global model. Plasma Sources Sci. Technol. 2010, 19, 065008. [Google Scholar] [CrossRef]
  41. Dickheuer, S.; Marchuk, O.; Ertmer, S.; Goriaev, A.; Ialovega, M.; Göths, B.; Krasikov, Y.; Mertens, P.; Kreter, A. In-situ measurement of the spectral reflectance of mirror-like metallic surfaces during plasma exposition. Nucl. Mater. Energy 2018, 17, 302–306. [Google Scholar] [CrossRef]
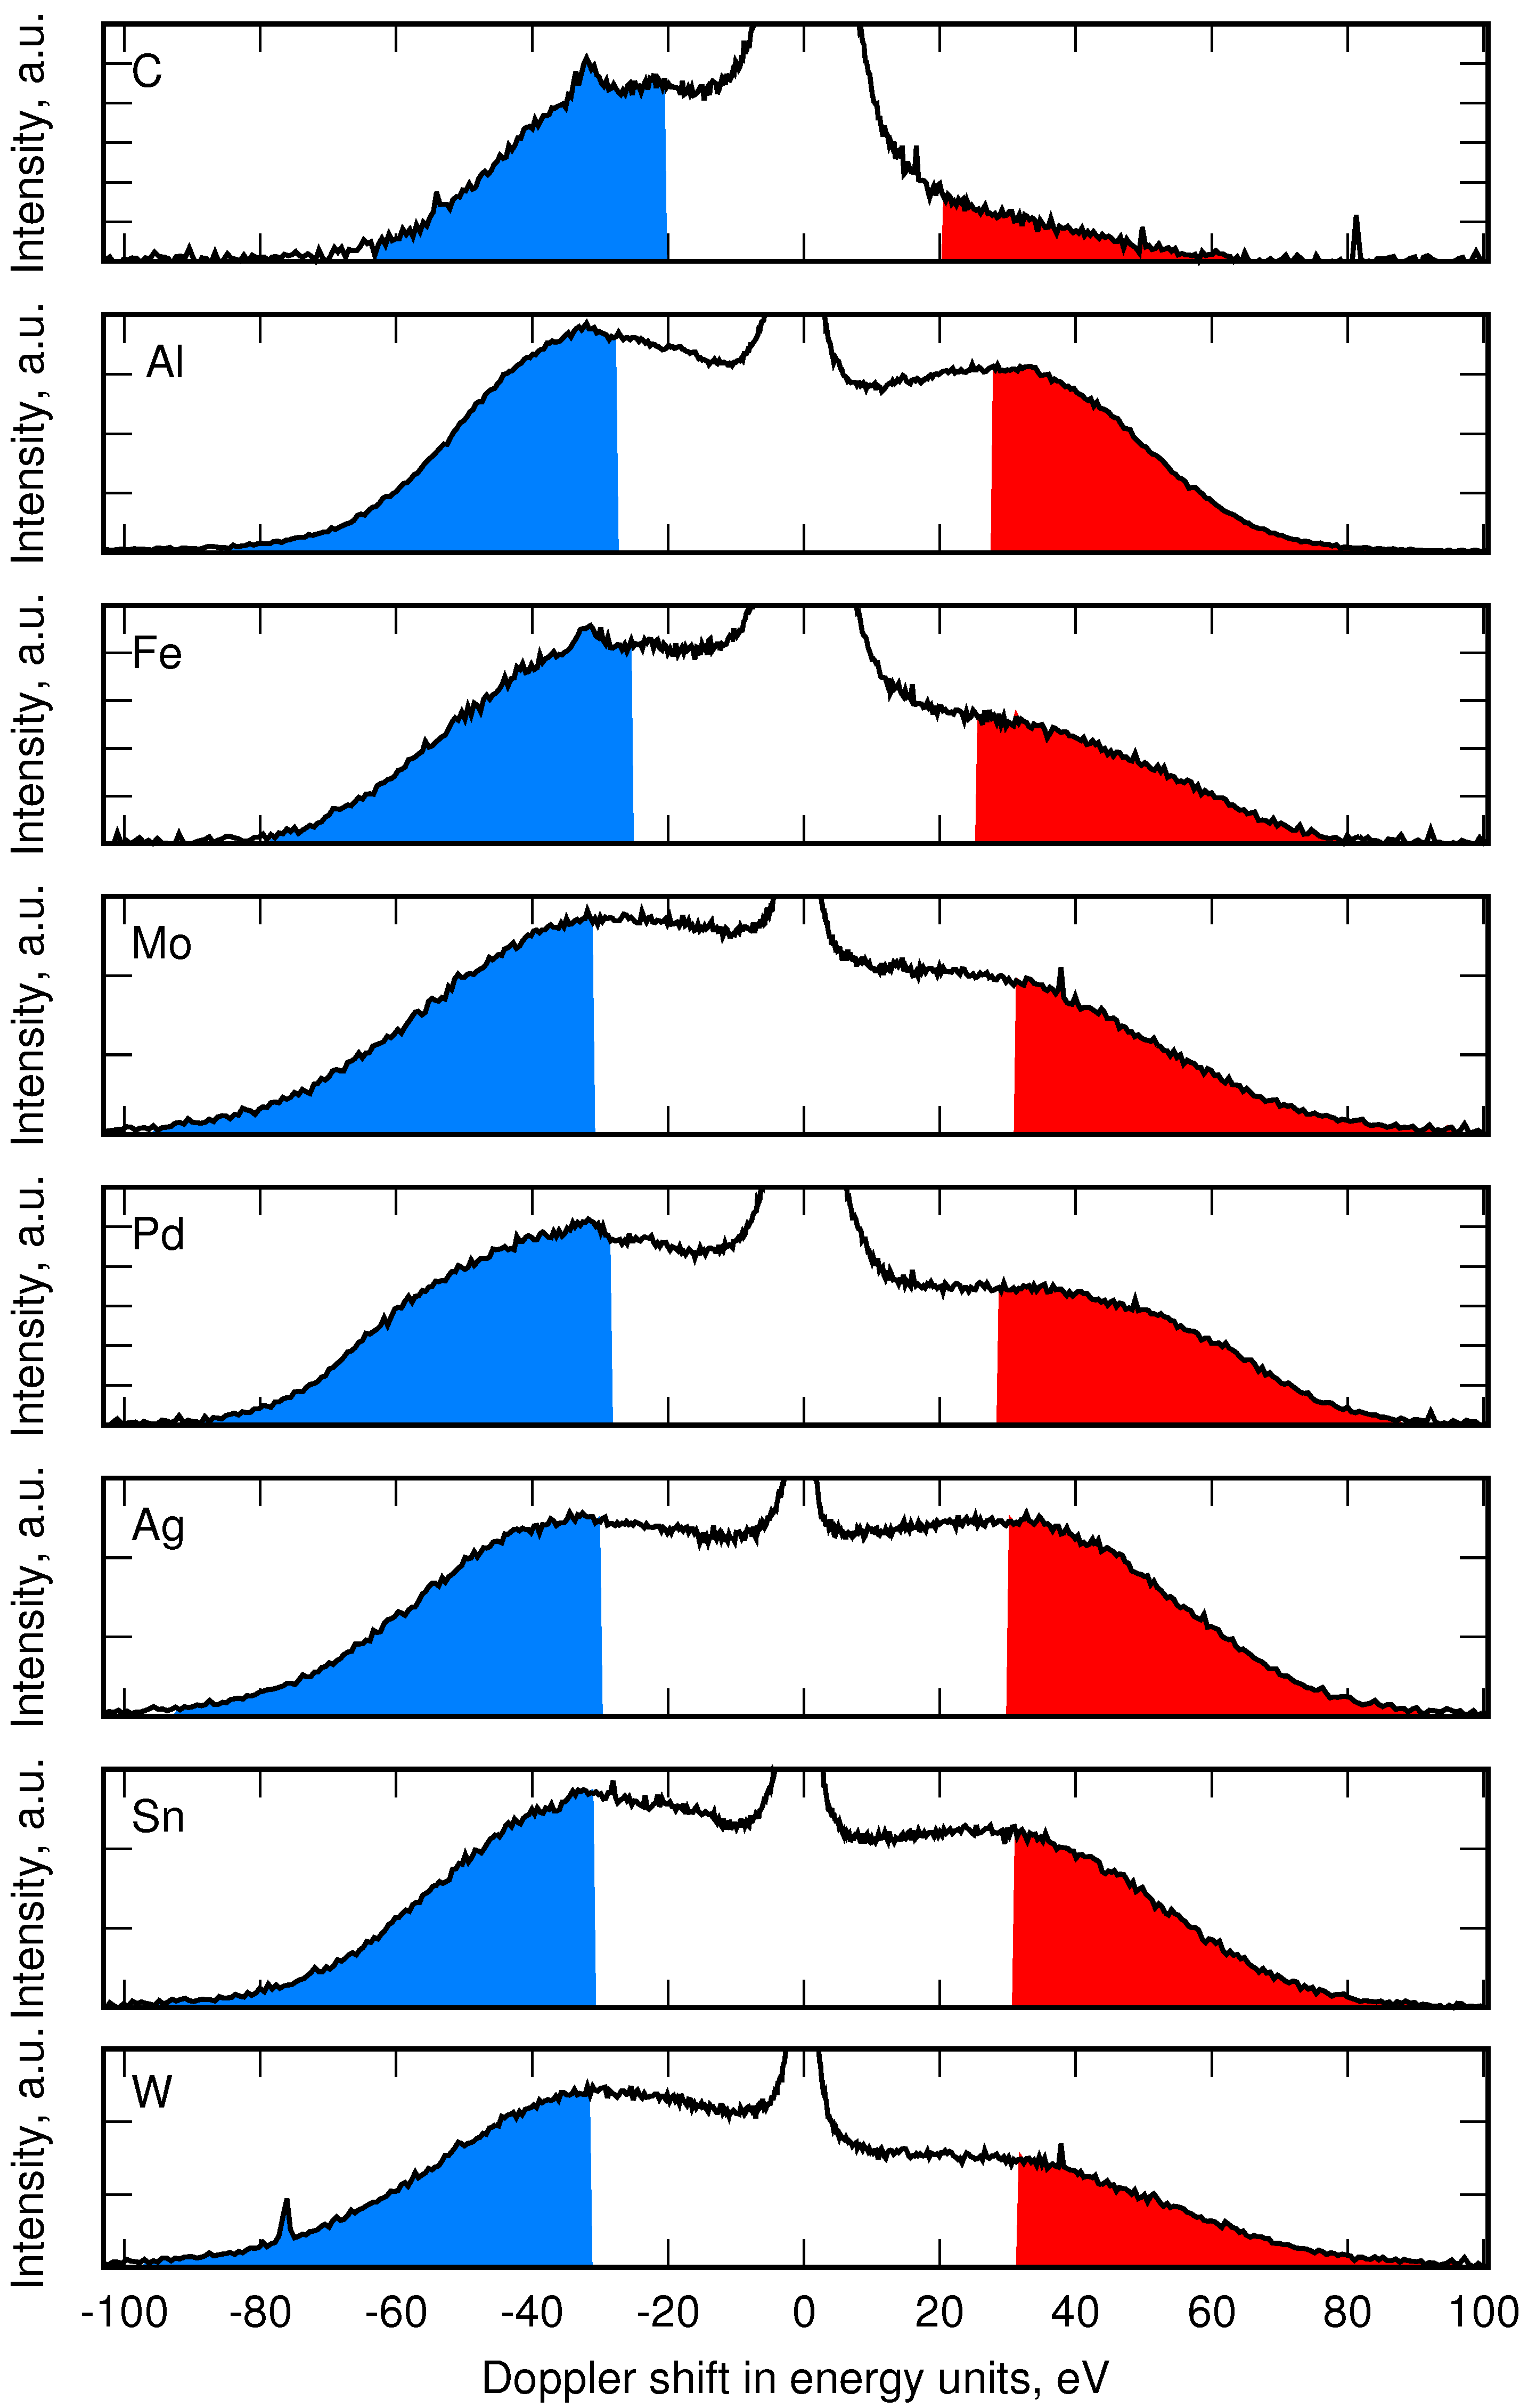
1
The emission of reflected atoms appeared also at the red-shifted wavelength and vice versa for all angles with 90 > θ 0 > 0 ; however, we refer to the blue-shifted emission for the direct signal and to the red-shifted one for the light reflectance
Figure 1. Principles of the Doppler-Shifted Reflectance Measurements (DSRM) in a plasma [1,2]. (a) Schematic picture of measurements in the laboratory using a light source and detector. (b) Schematic picture of measurements using the Doppler effect in front of the mirror using a high-resolution spectrometer.
Atoms 07 00081 g001
Figure 2. Experimental data on the emission cross-section of the Lyman- α (a) and Balmer- α lines (b) excited by collision of H atoms with noble gases. Data are digitalized from [9,10,11,12,13].
Atoms 07 00081 g002
Figure 3. Emission rate coefficient of the Balmer- α line as a function of electron temperature. The electron impact l-resolved excitation rate coefficients κ n l , where n is the principal and l is the orbital quantum number, were obtained by fitting and Maxwellian averaging of cross-sections from close-coupling calculations [15]. The thick red line shows the value of rate coefficients in the case of H-Ar collision at the energy of H atoms of 100 eV; the thick blue line shows the emission rate coefficient due to electron impact according to (7). The thermal motion of Ar atoms was neglected here. The redistribution among the l levels must increase the electron emission rate and decrease the emission rate induced by Ar or Kr.
Atoms 07 00081 g003
Figure 4. Top view of the optical emission measurements at the linear plasma PSI-2 [18]. Plasma is generated at the hollow cathode HC, and the target T is positioned in one of the maxima of the plasma profile using either the axial manipulator AM or the side manipulator SM. Line-of-Sight 1 observes the target at 35 ; Lines-of-Sight 2 and 3 observe the target at the angle of 70 and Line-of-sight 4 at the angle of 90 . For the polarization measurements, the polarization plate PP is installed at 1, and the polarization cube PC is used at Lines-of-Sight 2 and 3.
Atoms 07 00081 g004
Figure 5. Emission of the Balmer- α line measured at PSI-2. The angle of observation to the Pd mirror is 35 . (a) Emission in the case of pure H plasma. Gas flow of H, F H 2 = 85 sccm, the gas pressure p = 4.7×10 2 Pa. (b) Emission in the case of ArH plasma. The gas flow of Ar, F A r = 50 sccm, and the gas flow of H, F H 2 = 30 sccm; the gas pressure p = 4.1×10 2 Pa. The dashed line corresponds to the measurements at floating potential and the solid black line to the measurements at the applied voltage of −100 V. The blue and the orange curves are the components of the passive line obtained according to [21].
Atoms 07 00081 g005
Figure 6. Electron density and temperature profiles in pure H and mixed ArH plasmas. In the evaluation of the current-voltage characteristics of Langmuir probe measurements, the effective ion mass μ = ( m A r F A r + m H F H 2 ) / ( F A r + F H 2 ) was used. Electron density is shown in (a) and electron temperature in (b). The data for H plasma are shown using the red color, and the data for ArH mixed plasma are shown using the blue color. The probe is moved in the vertical position at PSI-2 at a distance of 50 cm from the targets from the top toward the z axis and back. The probe characteristics obtained during the motion toward the axis are distinguished from another set using negative values for probe position.
Atoms 07 00081 g006
Figure 7. (a) Schematic picture of the emission of reflected atoms and light reflectance at the mirror surface ( θ 0 < 90 ). The emission of reflected atoms is shown using the blue curve and the signal caused by light reflectance at the mirror using the red curve. In case of specular reflectance the profiles must be symmetrical, and only the amplitude is reduced. (b) Simulated emission of reflected atoms (blue-shifted signal) at the observation angle of θ 0 = 45 as a function of the projection of normalized velocity on the line-of-sight, E m = m v m 2 / 2 . Here, the energy distribution function f ( E ) and the emission rate coefficient κ were assumed constant. The integral over the emission is independent on the parameter of angular distribution function b, but it also remains constant for different observation angles.
Atoms 07 00081 g007
Figure 8. Emission of reflected atoms at the Balmer- α line in front of C, Al, Fe, Mo, Pd, Ag, Sn, and W. The applied potential is −100 V for all targets. The spectra measured in front of C, Al, Fe, Ag, Sn, and W are taken from [2].
Atoms 07 00081 g008
Figure 9. Comparison between the measured values of reflectance in the plasma and theoretical data or measurements in the laboratory. The last values are marked with * . The gray zone shows the region of deviation within 10%. The measured values of reflectance at the Balmer- α for C, Al, Fe, Ag, Sn, and W are taken from [2].
Atoms 07 00081 g009
Figure 10. Polarization by light reflection in the line shapes of the Balmer- α (a) and Balmer- β lines (b) in front of a Cu mirror. The applied potential was −120 V, and the spectra were measured at the angle of 70 as shown in Figure 4. The spectra measured with the direction of polarization perpendicular to the plane of incidence are shown using the green line (S) and with direction of polarization parallel to it as the orange line (P). The Balmer- α spectrum was taken from [18].
Atoms 07 00081 g010
Figure 11. Polarization by light reflection in the line shapes of Balmer- α in front of Rh (a) and Mo (b) mirrors. The applied potential was −100 V, and the spectra were measured at the angle of 70 , as shown in Figure 4. The spectra measured with the direction of polarization perpendicular to the plane of incidence are shown using the green line (S) and with the direction of polarization parallel to it as the orange line (P). The modeling of the Mo spectra is shown using the dotted green (S polarization) and orange (P-polarization) lines. The blue- and red-shifted components of the S-polarization spectrum are shown using the dashed blue- and red-shifted lines. The experimental data and results of the modeling for Mo are taken from [18]. The constant background was subtracted from the spectra, and normalization factors were introduced to show the spectra in the same scale.
Atoms 07 00081 g011
Figure 12. Example of the emission of reflected atoms in ArH, KrH, or NeH plasmas. black curve: ArH ( F A r = 40 sccm, F H 2 = 40 sccm, p = 0.039 Pa); red curve: KrH( F K r = 15 sccm, F H 2 = 55 sccm, p = 0.041 Pa); dashed red curve: KrH( F K r = 25 sccm, F H 2 = 45 sccm, p = 0.043 Pa); dot-dot red curve: KrH( F K r = 10 sccm, F H 2 = 10 sccm, p = 0.039 Pa); blue curve: NeH(( F N e = 40 sccm, F H 2 = 130 sccm, p = 0.025 Pa). The D α line emission at 656.1 nm is due to residual D gas.
Atoms 07 00081 g012

