
Atomic Structure Calculations and Study of Plasma Parameters of Al-Like Ions

Abstract
:1. Introduction
2. Theoretical Method
2.1. Computational Procedure
2.2. Calculation Procedure
3. Results and Discussion
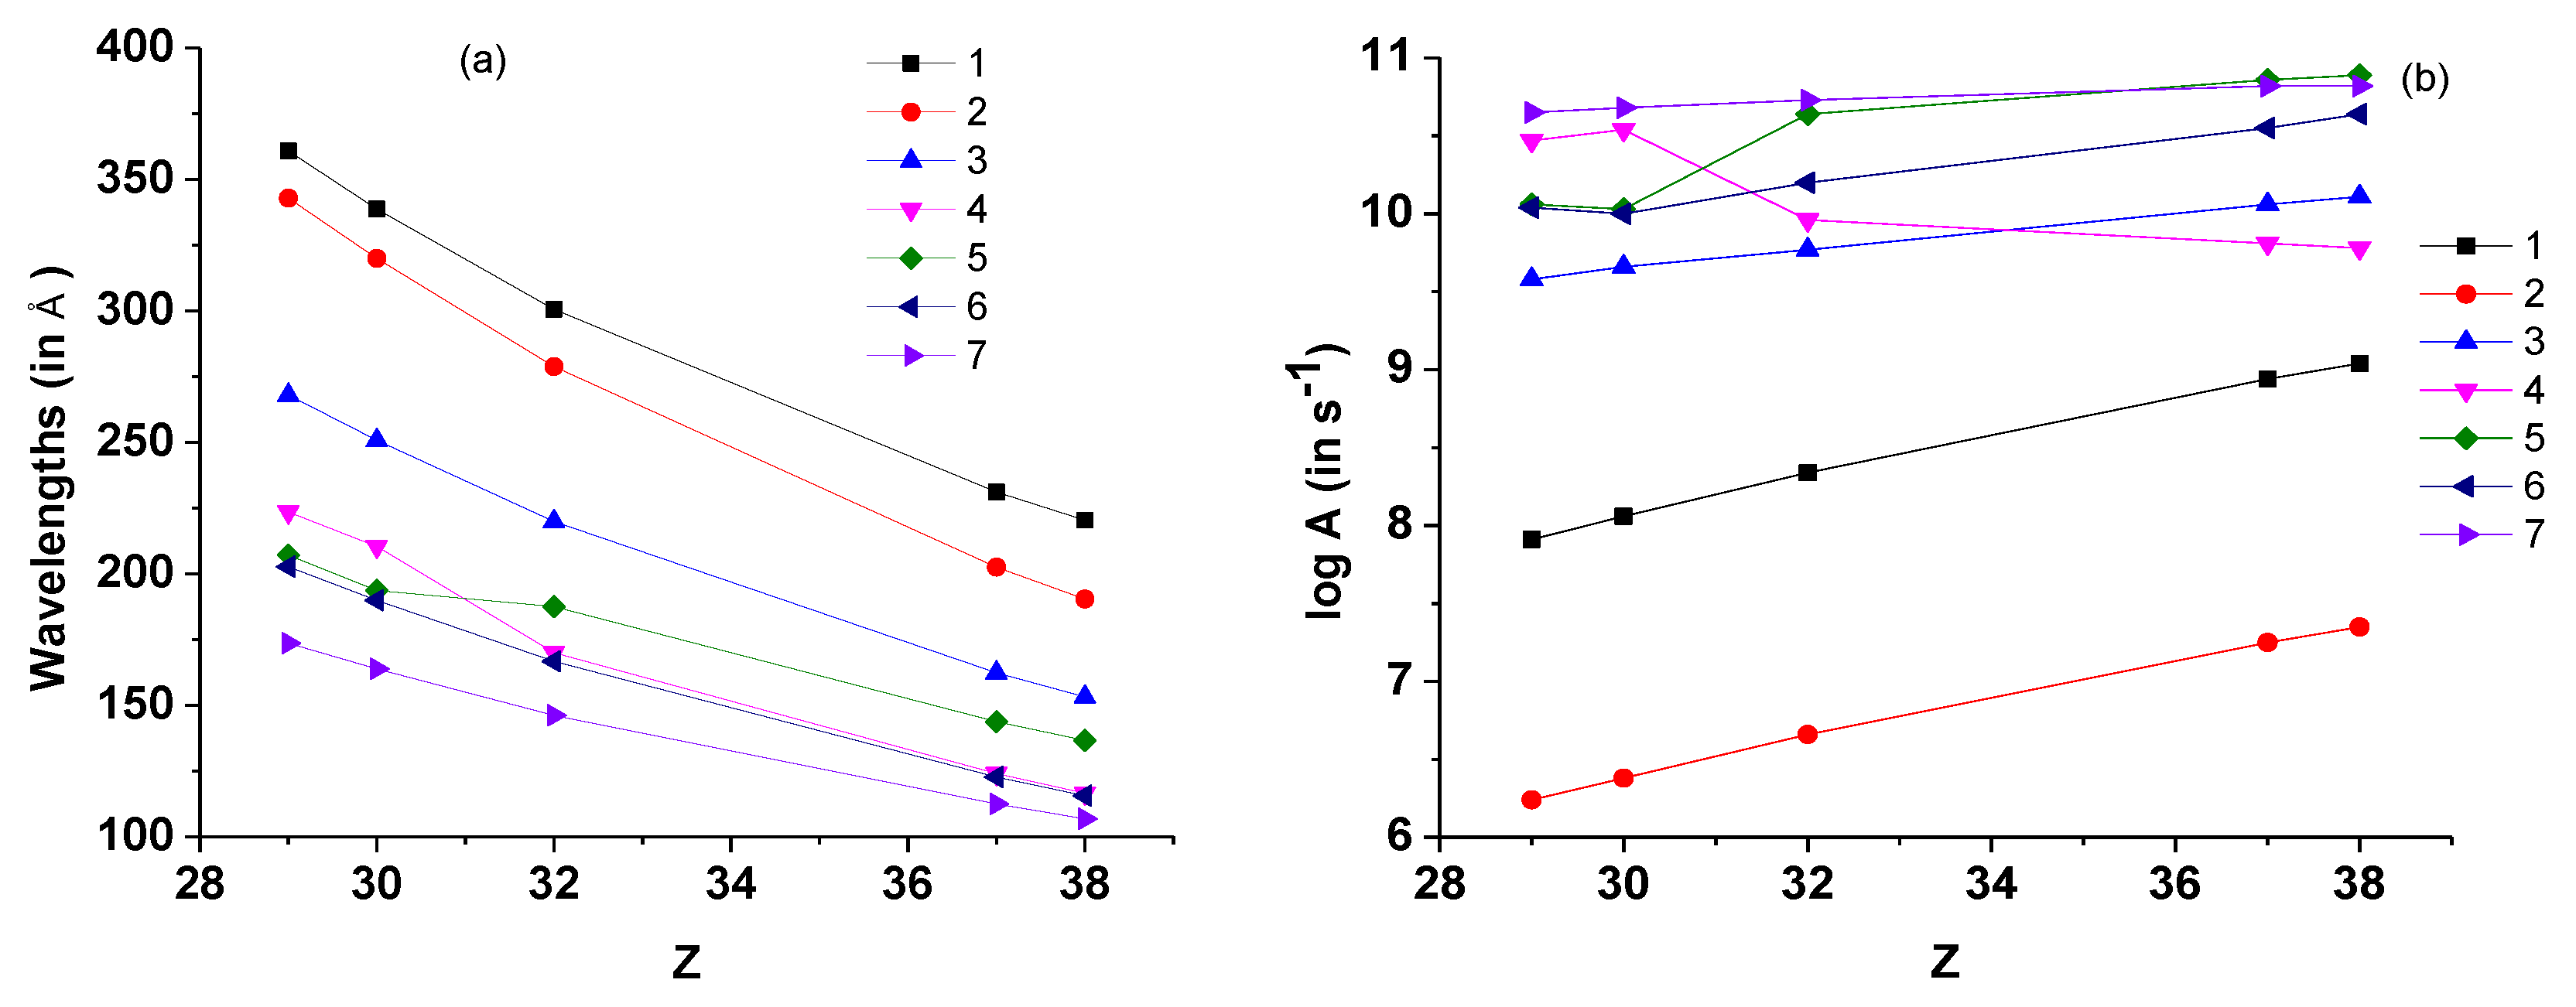
3.1. Energy Levels and Radiative Data
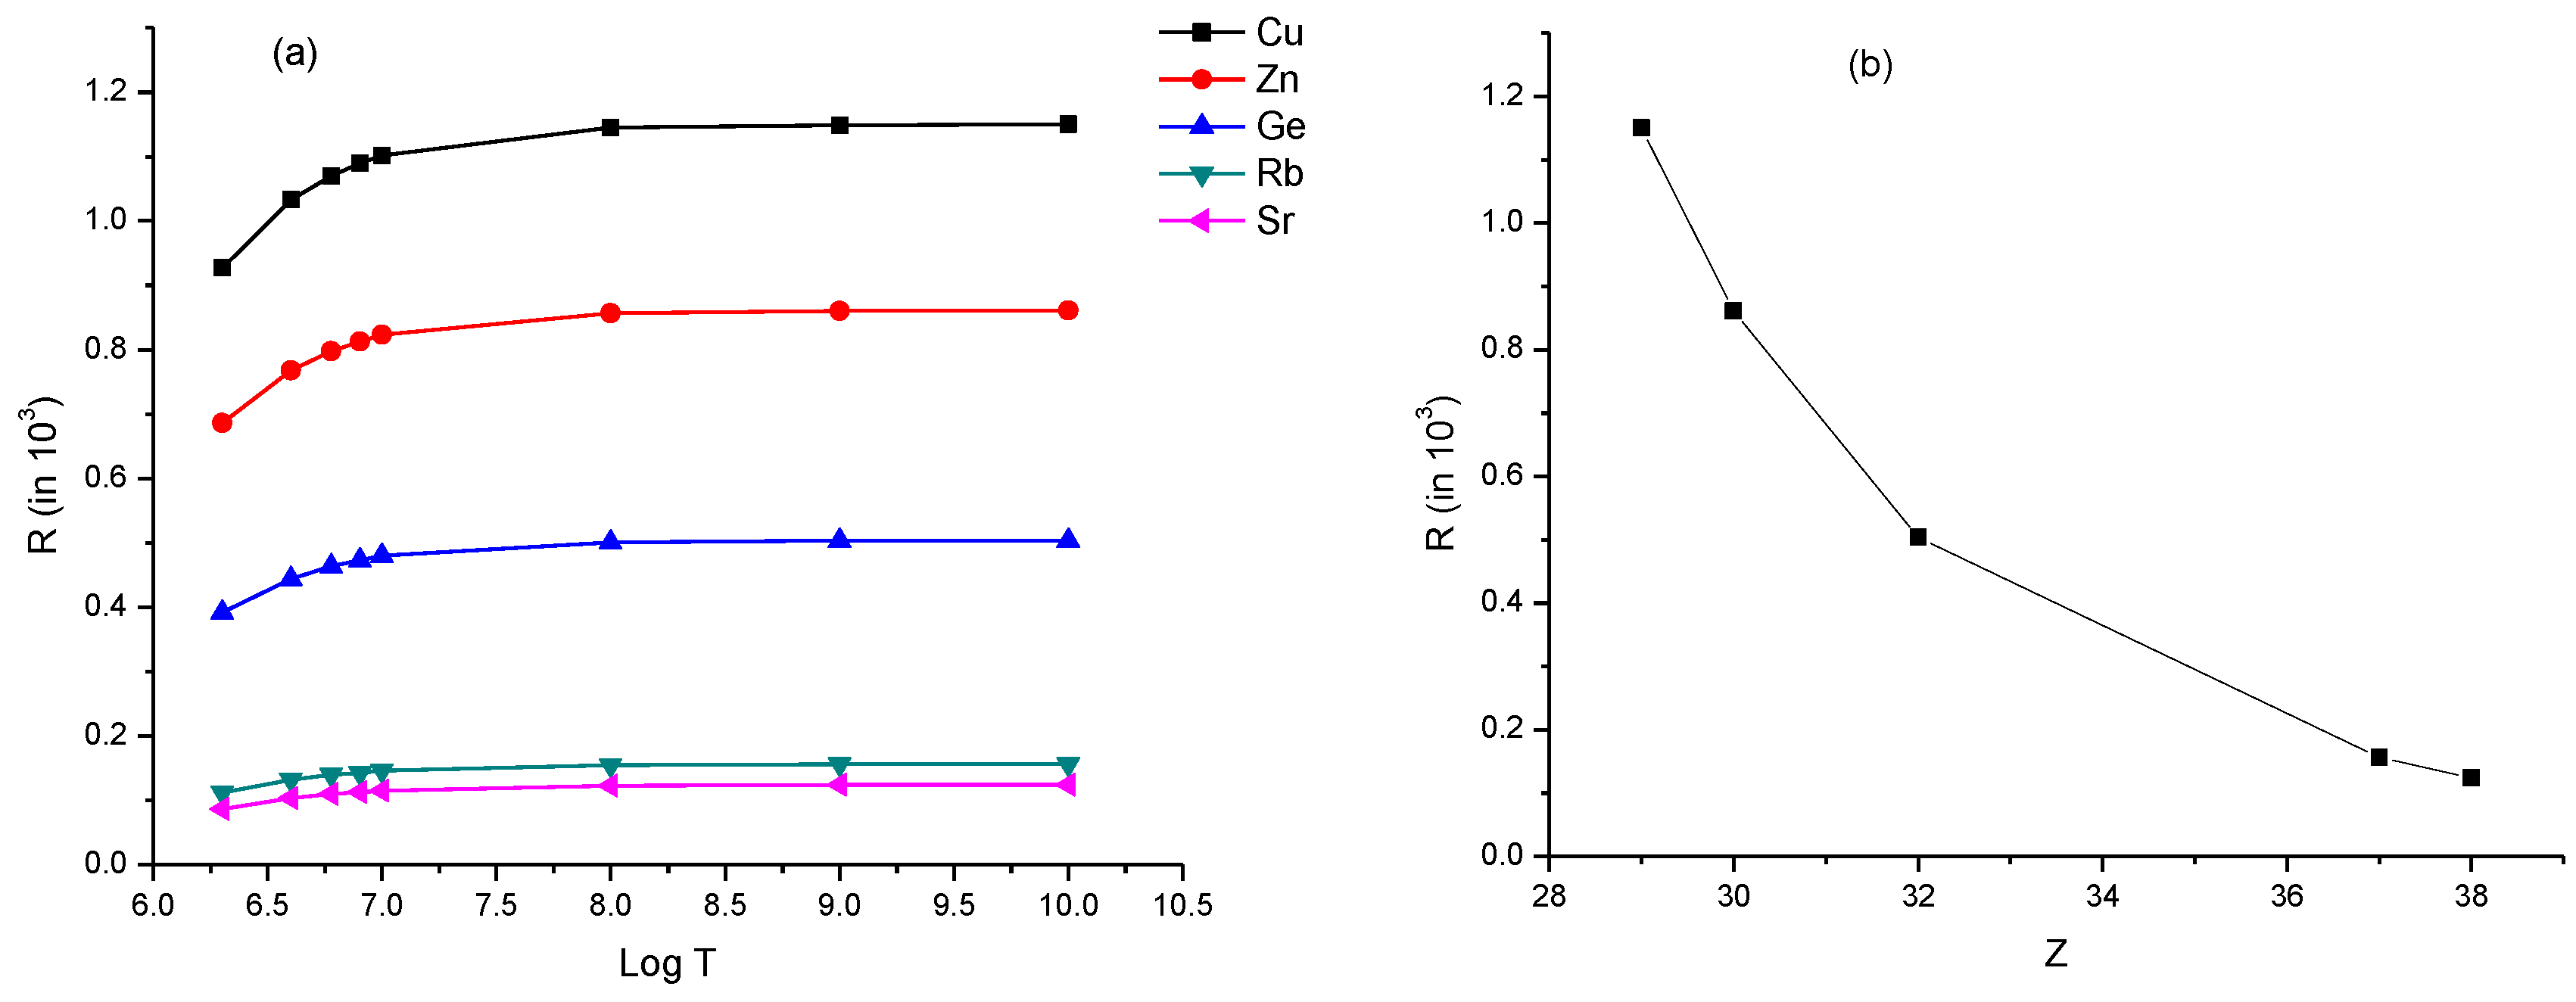
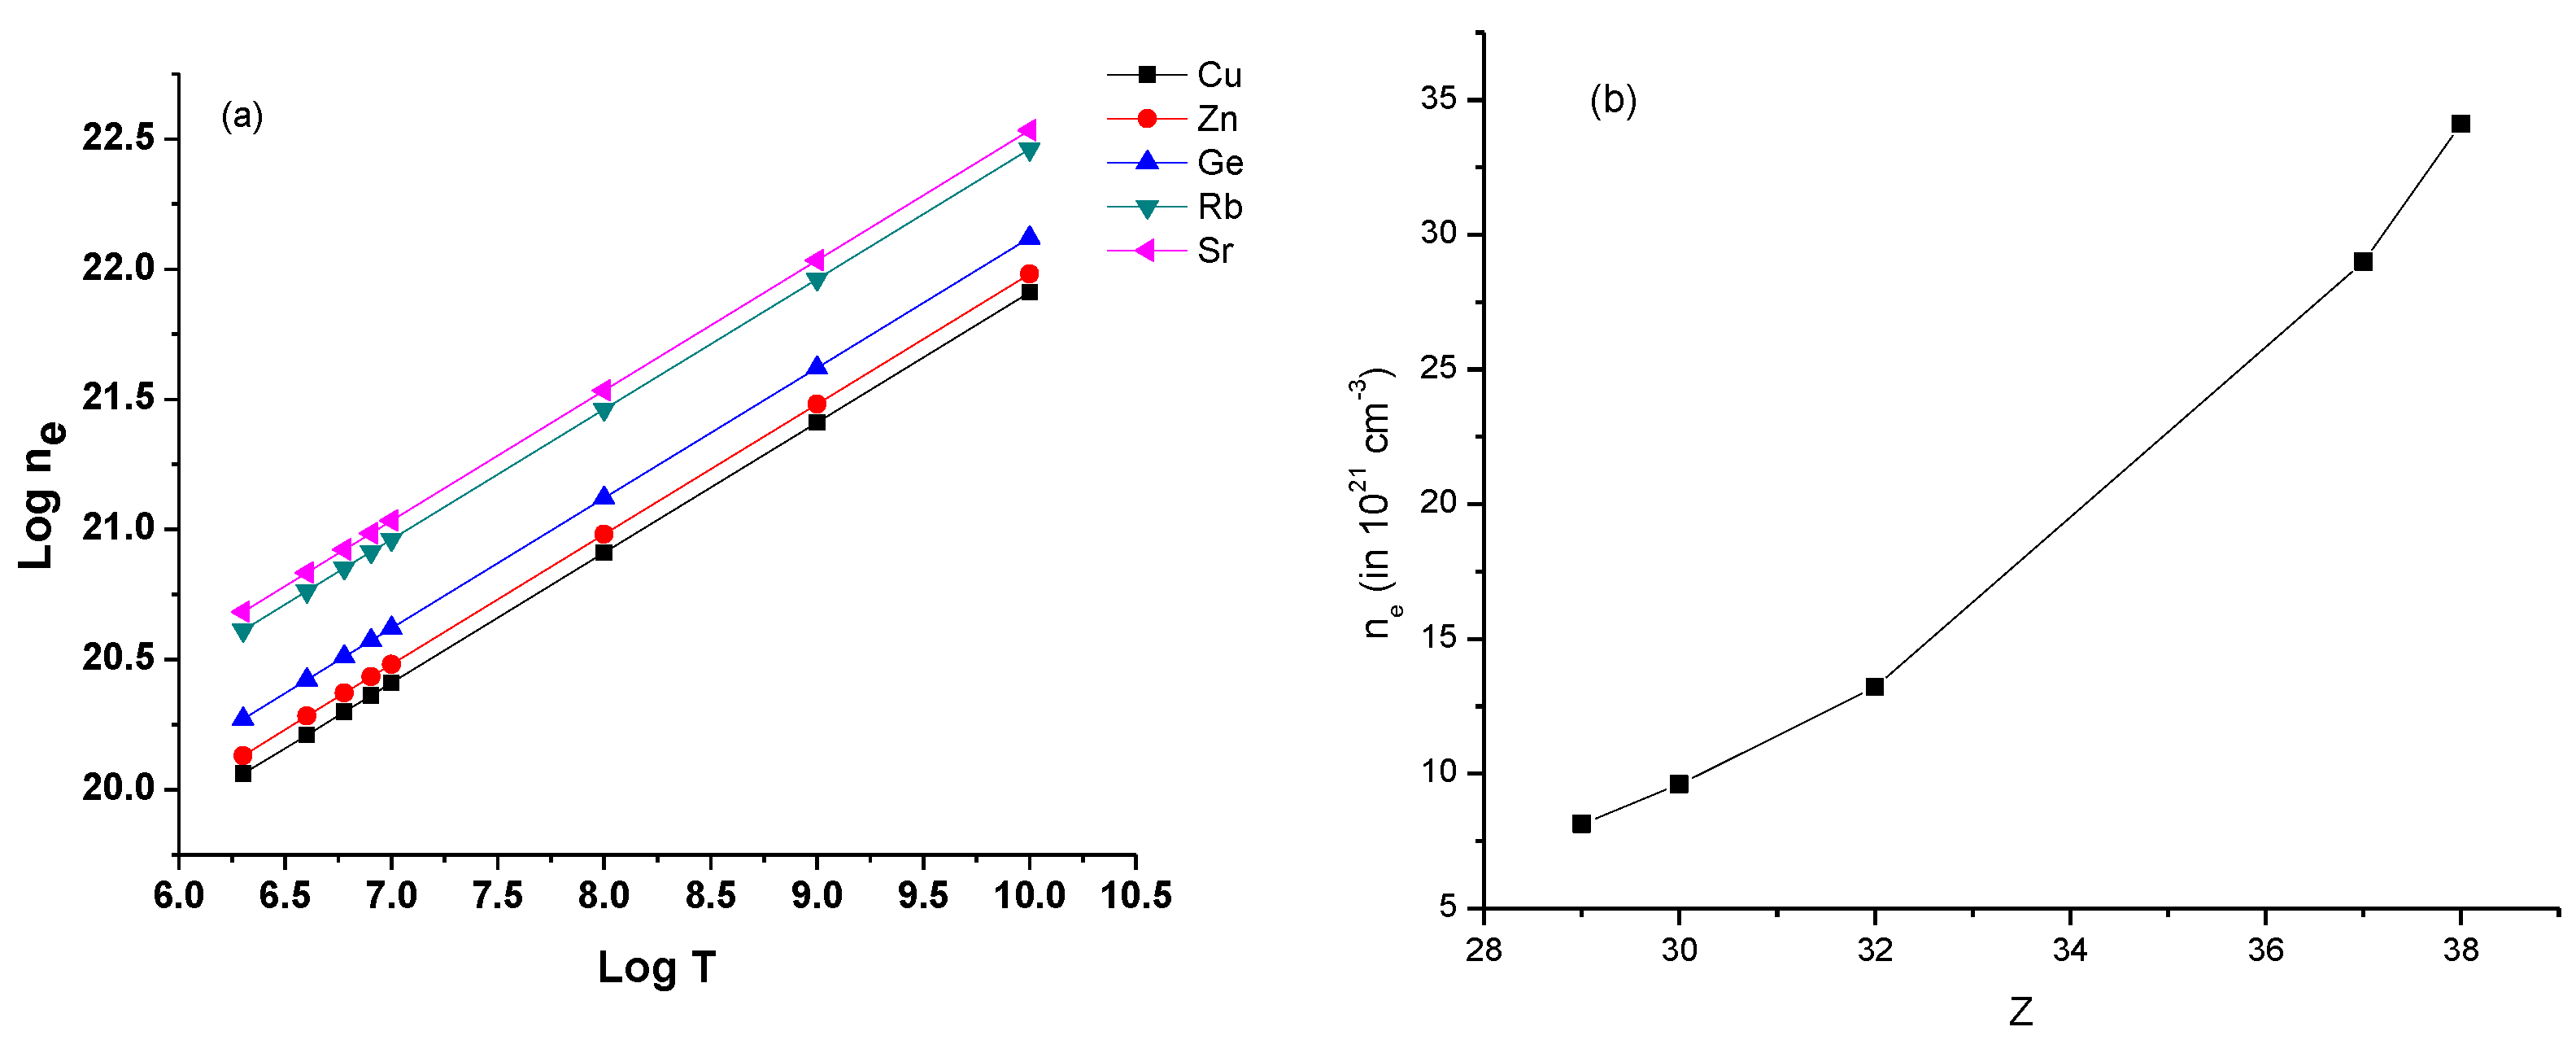
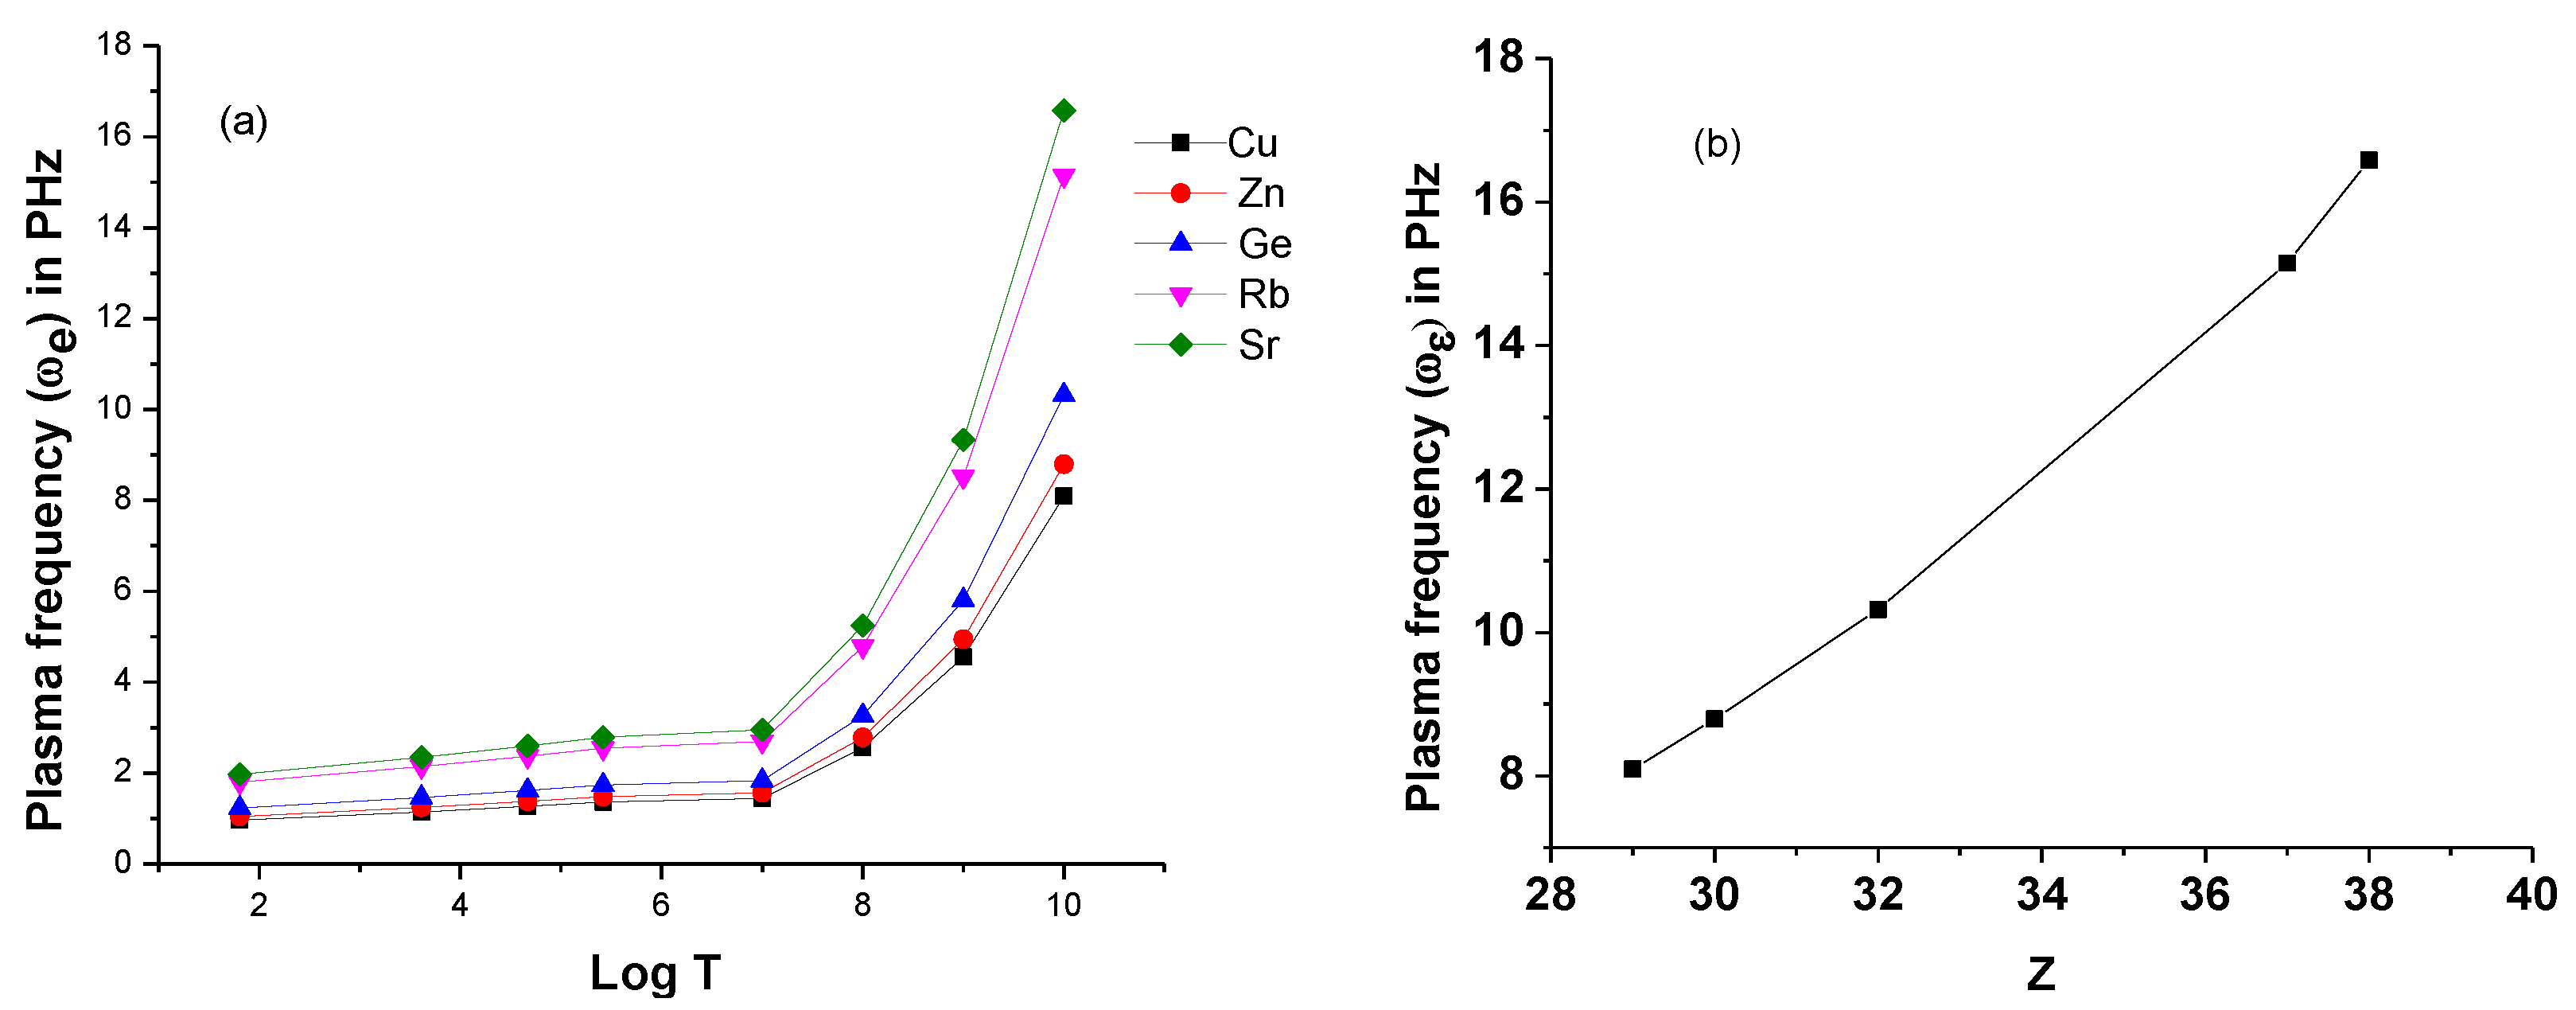
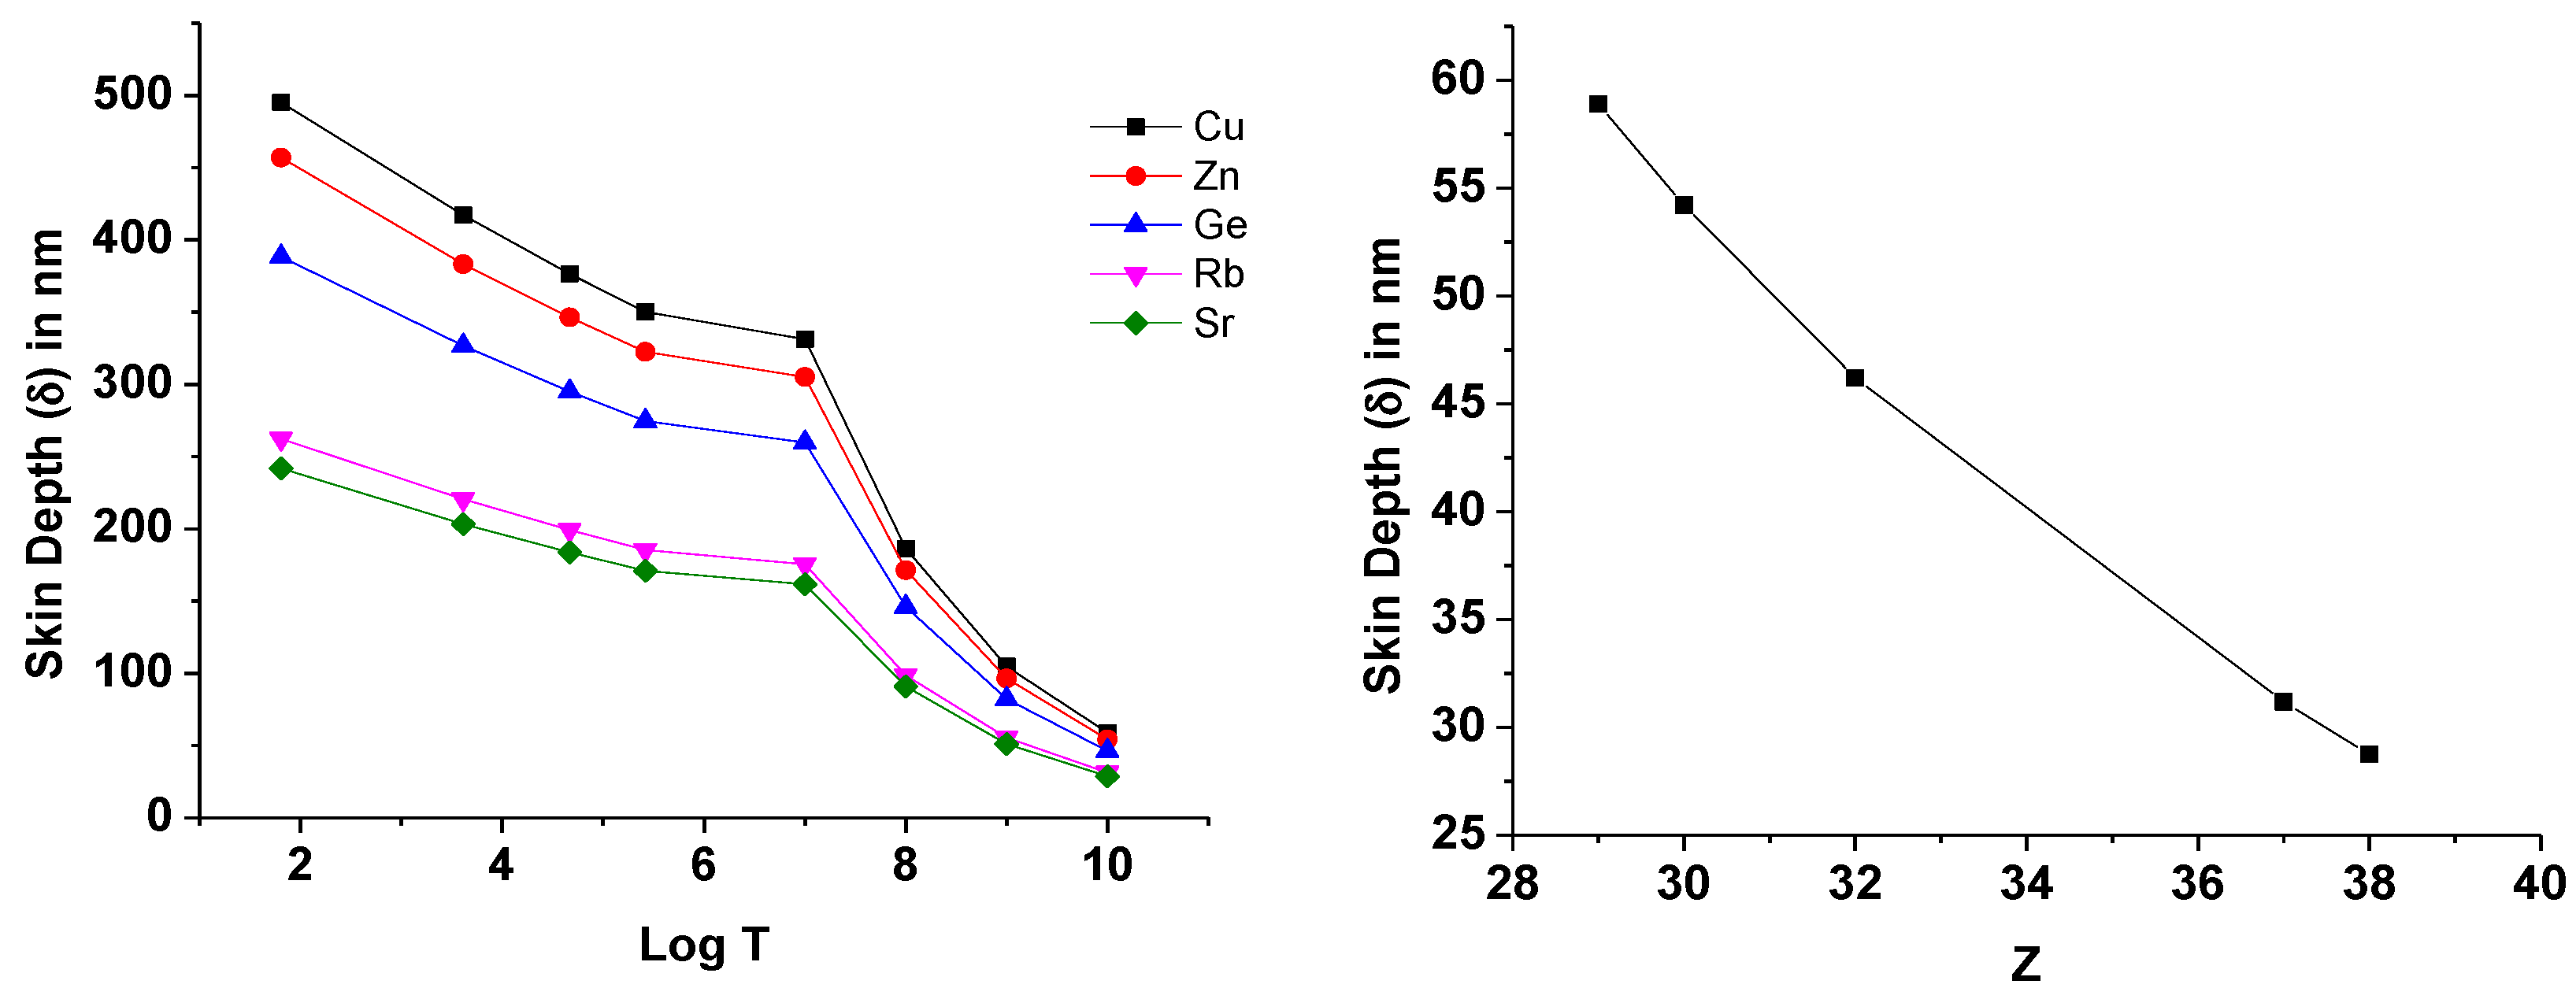
3.2. Line Intensity Ratio and Plasma Parameters
4. Conclusions
Acknowledgments
Author Contributions
Conflicts of Interest
References
- Masoudnia, L.; Bleiner, D. Optimum Pump Pulse Duration for X-Ray Ar-Plasma Lasing. Photonics 2015, 2, 164–183. [Google Scholar] [CrossRef]
- Porquet, D.; Dubau, J.; Grosso, N. He-like Ions as Practical Astrophysical Plasma Diagnostics: From Stellar Coronae to Active Galactic Nuclei. Space Sci. Rev. 2010, 157, 103–134. [Google Scholar] [CrossRef]
- Salik, M.; Hanif, M.; Wang, J.; Zhang, X. Plasma properties of nano-second laser ablated iron target in air. Int. J. Phys. Sci. 2013, 8, 1738–1745. [Google Scholar]
- Esaulov, A.A.; Johnson, W.R.; Safronova, A.S.; Safronova, U.I.; Kantsyrev, V.L.; Weller, M.E.; Ouart, N.D. Plasma ionization and resistivity models for low-, mid- and higher-atomic number plasmas and their applications to radiative properties of z-pinches. High Energy Density Phys. 2012, 8, 217–223. [Google Scholar] [CrossRef]
- Li, C.-Y.; Wang, T.-T.; Zhen, J.-F.; Chen, Y. Line-profile analysis of excitation spectroscopy in the even 4p5 (2P1/2)nl′ [K′] J (l′ = 1,3) autoionizing resonances of Kr. Sci. China Chem. 2013, 56, 1623–1632. [Google Scholar] [CrossRef]
- Lundeen, S.R.; Fehrenbach, C.W. Polarizability of Kr6+ from high-L Kr5+ fine-structure measurements. Phys. Rev. A 2007, 75, 032523. [Google Scholar] [CrossRef]
- Santana, J.A.; Lepson, J.K.; Träbert, E.; Beiersdorfer, P. Electron-correlation effects on the 3C to 3D line-intensity ratio in the Ne-like ions Ar8+ to Kr26+. Phys. Rev. A 2015, 91, 012502. [Google Scholar] [CrossRef]
- Kink, I.; Laming, J.M.; Takacs, E.; Porto, J.V.; Gillaspy, J.D.; Silver, E.; Schnopper, H.; Bandler, S.R.; Barbera, M.; Brickhouse, N.; et al. Analysis of broadband x-ray spectra of highly charged krypton from a microcalorimeter detector of an electron-beam ion trap. Phys. Rev. E 2001, 63, 046409. [Google Scholar] [CrossRef] [PubMed]
- Kukla, K.W.; Livingston, A.E.; Vogt, C.M.V.; Berry, H.G.; Dunford, R.W.; Curtis, L.J.; Cheng, S. Extreme-ultraviolet wavelength and lifetime measurements in highly ionized krypton. Can. J. Phys. 2005, 83, 1127–1139. [Google Scholar] [CrossRef]
- Rice, J.E.; Fournier, K.B.; Goetz, J.A.; Marmar, E.S.; Terry, J.L. X-ray observations of 2l-nl' transitions and configuration-interaction effects from Kr, Mo, Nb and Zr in near neon-like charge states from tokamak plasmas. J. Phys. B 2000, 33, 5435–5462. [Google Scholar] [CrossRef]
- Farrag, A.; Koenig, E.L.; Sinzelle, J. Systematic trends of the relativistic energy levels and oscillator strengths for electric dipole transitions within the ground complex of aluminium-like ions. J. Phys. B 1981, 14, 3325–3344. [Google Scholar] [CrossRef]
- Sugar, J.; Kaufman, V. Wavelengths and Energy Levels of Zn XII to Zn XX. Phys. Scr. 1986, 34, 797–804. [Google Scholar] [CrossRef]
- Huang, K.-N. Energy-level scheme and transition probabilities of Al-like ions. At. Data Nucl. Data Tables 1986, 34, 1–77. [Google Scholar] [CrossRef]
- Träbert, E.; Hutton, R.; Martinson, I. Intercombination lines of Mg I-, Al I- and Si I-like ions in the beam foil spectra of Ti, Fe, Ni and Cu. Z. Phys. D 1987, 5, 125–131. [Google Scholar] [CrossRef]
- Träbert, E.; Heckmann, P.H.; Wiese, W.L. Wavelength and lifetime measurements on intercombination transitions in 12- to 14-electron ions of Zn. Z. Phys. D 1988, 8, 209–210. [Google Scholar] [CrossRef]
- Shirai, T.; Nakagaki, T.; Nakai, Y.; Sugar, J.; Ishii, K.; Mori, K. Spectral Data and Grotrian Diagrams for Highly Ionized Copper, Cu X-Cu XXIX. J. Phys. Chem. Ref. Data 1991, 20, 1–81. [Google Scholar] [CrossRef]
- Wyart, J.F.; Gautheir, J.C.; Geindre, J.P.; Tragin, N.; Monier, P.; Klisnick, A.; Carillon, A. Interpretation of a spectrum of laser irradiated strontium in the range 115-208 Å. Phys. Scr. 1987, 36, 227. [Google Scholar] [CrossRef]
- TFR Group; Wyart, J.F. On the spectra of highly-ionized krypton, strontium, zirconium and rhodium excited in the plasma of the TFR tokamak. Phys. Scr. 1988, 37, 66. [Google Scholar] [CrossRef]
- Kaufman, J.R.; Kaufman, V.; Sugar, J.; Pittman, T.L. Magnetic-dipole transitions observed in highly ionized Ga, Ge, As, and Kr. Phys. Rev. A 1983, 27, 1721–1723. [Google Scholar] [CrossRef]
- Burrell, K.H.; Groebner, R.J.; Brooks, N.H.; Rottler, L. Magnetic dipole transitions in the n=3 level of highly ionized zinc, germanium, and selenium. Phys. Rev. A 1984, 29, 1343–1347. [Google Scholar] [CrossRef]
- Sugar, J.; Musgrove, A. Energy Levels of Zinc, Zn I through Zn XXX. J. Phys. Chem. Ref. Data 1995, 24, 1803–1872. [Google Scholar] [CrossRef]
- Lavin, C.; Alvarez, A.B.; Martin, I. Systematic in the relativistic oscillator strengths for fine-structure transitions in the aluminium isoelectronic sequence. J. Quant. Spectrosc. Radiat. Transf. 1997, 57, 831–845. [Google Scholar] [CrossRef]
- Litzen, U.; Redfros, A. Fine structure splitting of the term 3s3p2 4P in Al-like ions. Phys. Lett. A 1988, 127, 88–91. [Google Scholar] [CrossRef]
- Ekberg, J.O.; Redfros, A.; Brown, C.M.; Feldman, U.; Seely, J.F. Transitions and energy levels in Al-like Ge XX, Se XXII, Sr XXVI, Y XXVII and Zr XXVIII. Phys. Scr. 1991, 44, 539. [Google Scholar] [CrossRef]
- Jupen, C.; Curtis, L.J. Isoelectronic comparison of the Al-like 3s2 3p 2P–3s3p2 4P transitions in the ions P III-Mo XXX. Phys. Scr. 1996, 53, 312. [Google Scholar] [CrossRef]
- Biemont, E.; Fremat, Y.; Quinet, P. Ionization potentials of atoms and ions from lithium to tin (z= 50). At. Data Nucl. Data Tables 1999, 71, 117–146. [Google Scholar] [CrossRef]
- Sugar, J.; Musgrove, A. Energy Levels of Copper, Cu I through Cu XXIX. J. Phys. Chem. Ref. Data 1990, 19, 527. [Google Scholar] [CrossRef]
- Wouters, A.; Schwob, J.L.; Suckewer, S.; Seely, J.F.; Feldman, U.; Davѐ, J.H. Spectra in the 60345-Å wavelength region of the elements Fe, Ni, Zn, Ge, Se, and Mo injected into the Princeton Large Torus tokamak. J. Opt. Soc. Am. B 1988, 5, 1520–1527. [Google Scholar] [CrossRef]
- Hinnov, E.; Boody, F.; Cohen, S.; Feldman, U.; Hosea, J.; Sato, K.; Schwob, J.L.; Suckewer, S.; Wouters, A. Spectrum lines of highly ionized zinc, germanium, selenium, zirconium, molybdenum, and silver injected into Princeton Large Torus and Tokamak Fusion Test Reactor tokamak discharges. J. Opt. Soc. Am. B 1986, 3, 1288–1294. [Google Scholar] [CrossRef]
- Sugar, J.; Kaufmann, V. Predicted wavelengths and transition rates for magnetic-dipole transitions within 3s2 3pn ground configurations of ionized Cu to Mo. J. Opt. Soc. Am. B 1984, 1, 218–223. [Google Scholar] [CrossRef]
- Sugar, J.; Kaufmann, V. Copper spectra in a laser-generated plasma: measurements and classifications of Cu xii to Cu xxi. J. Opt. Soc. Am. B 1986, 3, 704–710. [Google Scholar] [CrossRef]
- Träbert, E.; Heckmann, P.H.; Hutton, R.; Martinson, I. Intercombination lines in delayed beam-foil spectra. J. Opt. Soc. Am. B 1988, 5, 2173–2182. [Google Scholar] [CrossRef]
- Sugar, J.; Kaufman, V.; Rowan, W.L. Aluminum like spectra of copper through molybdenum. J. Opt. Soc. Am. B 1988, 5, 2183–2189. [Google Scholar] [CrossRef]
- Kim, Y.-K.; Sugar, J.; Kaufman, V.; Ali, M.A. Quantum-electrodynamic contributions to Spin–orbit splitting in the ground state of aluminum like ions. J. Opt. Soc. Am. B 1988, 5, 2225–2229. [Google Scholar] [CrossRef]
- Träbert, E.; Wagner, C.; Heckmann, P.H.; Brage, T. A beam-foil study of the 3s3p3d 4F levels in the Al-like ions of Ti, Fe and Ni. Phys. Scr. 1993, 48, 593. [Google Scholar] [CrossRef]
- Gaardsted, J.U.; Brage, T.; Fischer, C.F.; Sonnek, D. Experimental and theoretical study of core-excited states of Al III. Phys. Scr. 1990, 42, 543. [Google Scholar] [CrossRef]
- Thornbury, J.F.; Hibbert, A.; Träbert, E. The lifetimes of the 3s24s 2S states in the aluminium sequence. Phys. Scr. 1989, 40, 472. [Google Scholar] [CrossRef]
- Safronova, U.I.; Namba, C.; Abritton, J.R.; Johnson, W.R.; Safronova, M.S. Relativistic many-body calculations of energies of n=3 states in aluminum like ions. Phys. Rev. A 2002, 65, 022507. [Google Scholar] [CrossRef]
- Safronova, U.I.; Sataka, M.; Abritton, J.R.; Johnson, W.R.; Safronova, M.S. Relativistic many-body calculations of electric-dipole lifetimes, transition rates, and oscillator strengths for n=3 states in Al-like ions. At. Data Nucl. Data Tables 2003, 84, 1–83. [Google Scholar] [CrossRef]
- Wei, H.L.; Zhang, H.; Ma, C.W.; Zhang, J.Y.; Cheng, X.L. The MCDF calculations of n=3–4 transitions in some Al-like ions (Fe13+–Ga18+). Phys. Scr. 2008, 77, 035301. [Google Scholar] [CrossRef]
- Gupta, G.P.; Msezane, A.Z. Large-scale CIV3 calculations of fine-structure energy levels and radiative rates in Al-like copper. Can. J. Phys. 2009, 87, 895–907. [Google Scholar] [CrossRef]
- Sansonetti, J.E. Wavelengths, Transition Probabilities, and Energy Levels for the Spectra of Strontium Ions (Sr II through Sr XXXVIII). J. Phys. Chem. Ref. Data 2012, 41, 013102. [Google Scholar] [CrossRef]
- Sansonetti, J.E. Wavelengths, Transition Probabilities, and Energy Levels for the Spectra of Rubidium (RbI through RbXXXVII). J. Phys. Chem. Ref. Data 2006, 35, 301–402. [Google Scholar] [CrossRef]
- Dong, C.Z.; Kato, T.; Fritzsche, S.; Koike, F. Lifetimes and branching fractions of the high angular momentum states of aluminium-like iron group elements. Mon. Not. R. Astron. Soc. 2006, 369, 1735–1740. [Google Scholar] [CrossRef]
- Rodrigues, G.C.; Indelicato, P.; Santos, J.P.; Patte, P.; Parente, F. Systematic calculation of total atomic energies of ground state configurations. At. Data Nucl. Data Tables 2004, 86, 117–233. [Google Scholar] [CrossRef]
- Santana, J.A.; Ishikawa, Y.; Träbert, E. Multireference Møller–Plesset perturbation theory results on levels and transition rates in Al-like ions of iron group elements. Phys. Scr. 2009, 79, 065301. [Google Scholar] [CrossRef]
- Argamam, U.; Makov, G. Higher ionization energies of atoms in density-functional theory. Phys. Rev. A 2013, 88, 042504. [Google Scholar] [CrossRef]
- Kumar, S.T.A.; Hartog, D.J.D.; Chapman, B.E.; Mullane, M.O.; Nornberg, M.; Craig, D.; Eilerman, S.; Fiksel, G.; Parke, E.; Reusch, J. High resolution charge-exchange spectroscopic measurements of aluminum impurity ions in a high temperature plasma. Plasma Phys. Control. Fusion 2012, 54, 012002. [Google Scholar] [CrossRef]
- Surmick, D.M.; Parriger, C.G. Electron density determination of aluminium laser-induced plasma. J. Phys. B 2015, 48, 115701. [Google Scholar] [CrossRef]
- Surmick, D.M.; Parriger, C.G. Time-resolved aluminium laser-induced plasma temperature measurements. J. Phys. Conf. Ser. 2014, 548, 012046. [Google Scholar] [CrossRef]
- Vinko, S.M.; Ciricosta, O.; Preston, T.R.; Rackstraw, D.S.; Brown, C.R.D.; Burian, T.; Chalupsky, J.; Cho, B.I.; Chung, H.-K.; Englehorn, K.; et al. Investigation of femtosecond collisional ionization rates in a solid. Nat. Commun. 2015, 6, 6397. [Google Scholar] [CrossRef] [PubMed]
- Saber, M.G.; Sagor, R.H. Design and study of nano-plasmonic couplers using aluminium arsenide and alumina. IET Optoelectron 2015, 9, 125–130. [Google Scholar] [CrossRef]
- Martin, J.; Plain, J. Fabrication of aluminium nanostructures for plasmonics. J. Phys. D Appl. Phys. 2015, 48, 184002. [Google Scholar] [CrossRef]
- Fang, Y.; Sun, M. Nanoplasmonic waveguides: towards applications in integrated nanophotonic circuits. Light Sci. Appl. 2015, 4, e294. [Google Scholar] [CrossRef]
- Boriskina, S.V.; Ghasemi, H.; Chen, G. Plasmonic materials for energy: From physics to applications. Mater. Today 2013, 16, 375–386. [Google Scholar] [CrossRef]
- Stockman, M.I. Nanoplasmonics: past, present, and glimpse into future. Phys. Today 2011, 64, 39–44. [Google Scholar] [CrossRef]
- Shahbazyan, T.V.; Stockman, M.I. Plasmonics: Theory and Applications; Springe: Heidelberg, Germany, 2013. [Google Scholar]
- Klimov, V. Nanoplasmonics; CRC Press: New York, NY, USA, 2014. [Google Scholar]
- Chon, J.W.M.; Iniewski, K. Nanoplasmonics: Advanced Device Applications; CRC Press: New York, NY, USA, 2013. [Google Scholar]
- Grant, I.P. Relativistic Quantum Theory of Atoms and Molecules: Theory and Computation; Springer: New York, NY, USA, 2007. [Google Scholar]
- Jonsson, P.; He, X.; Fischer, C.F.; Grant, I.P. New version: Grasp2K relativistic atomic structure package. Comput. Phys. Commun. 2007, 177, 597–622. [Google Scholar] [CrossRef]
- Parpia, F.A.; Fischer, C.F.; Grant, I.P. GRASP92: A package for large-scale relativistic atomic structure calculations. Comput. Phys. Commun. 1996, 94, 249–271. [Google Scholar] [CrossRef]
- Olsen, J.; Godefroid, M.R.; Jonsson, P.A.; Malmquist, P.A.; Froese, F.C. Transition probability calculations for atoms using nonorthogonal orbitals. Phys. Rev. E 1995, 52, 4499–4508. [Google Scholar] [CrossRef]
- Aragon, C.; Aguilera, J.A. Characterization of laser induced plasmas by optical emission spectroscopy: A review of experiments and methods. Spectrochim. Acta Part B 2008, 63, 893–916. [Google Scholar] [CrossRef]
- Fantoni, R.; Caneve, L.; Colao, F.; Fornarini, L.; Lazic, V.; Spizzichino, V. Advances in Spectroscopy for Lasers and Sensing; Springer: New York, NY, USA, 2006; pp. 229–254. [Google Scholar]
- Griem, H.R. Principles of Plasma Spectroscopy; Cambridge University Press: Cambridge, UK, 1997. [Google Scholar]
- Hutchinson, I.H. Principles of Plasma Diagnostics, 2nd ed.; Cambridge University Press: New York, NY, USA, 2005. [Google Scholar]
- Kunze, H.J. Introduction to Plasma Spectroscopy; Springer Series on Atomic, Optical and Plasma Physics: London, UK; New York, NY, USA, 2009. [Google Scholar]
- ITER Homepage. Available online: https://www.iter.org/sci/plasmaheating (accessed on 1 July 2016).
- McWhirter, R.W.P. Plasma Diagnostic Techniques; Huddleston, R.H., Leonard, S.L., Eds.; Academic Press: New York, NY, USA, 1965. [Google Scholar]
- Vinko, S.M.; Ciricosta, O.; Cho, B.I.; Engelhorn, K.; Chung, H.-K.; Brown, C.R.; Chalupsky, K.; Falcone, R.W.; Graves, C.; et al. Creation and diagnosis of a solid-density plasma with an X-ray free-electron laser. Nature 2012, 482, 59–62. [Google Scholar] [CrossRef] [PubMed]
- Lindl, J. Development of the indirect-drive approach to inertial confinement fusion and the target physics basis for ignition and gain. Phys. Plasmas 1995, 2, 3933–4024. [Google Scholar] [CrossRef]
- Velarde, G.; Ronen, Y.; Martinez-Val, J.M. Nuclear Fusion by Inertial Confinement: A Comprehensive Treatise; CRC Press: New York, NY, USA, 1993. [Google Scholar]
- Fitzpatrick, R. Plasma Physics: An Introduction; CRC Press: New York, NY, USA, 2014. [Google Scholar]


| Cu | |||||||||||
|---|---|---|---|---|---|---|---|---|---|---|---|
| Configurations | VV | CV | NIST | Ref. [41] | Diff. | Diff.ref | |||||
| n = 4 | n = 5 | n = 6 | n = 7 | n = 4 | n = 5 | n = 6 | |||||
| 3s23p 2 | 0 | 0 | 0 | 0 | 0 | 0 | 0 | 0 | 0 | 0 | 0 |
| 3s23p 2 | 33,012 | 33,103 | 33,117 | 33,121 | 33,215 | 33,021 | 33,233 | 33,239 | 33,231 | 6 | 2 |
| 3s3p2 4P1/2 | 275,539 | 276,003 | 276,098 | 276,121 | 276,393 | 276,507 | 277,136 | 277,231 | 277,018 | 95 | 118 |
| 3s3p2 4P3/2 | 290,024 | 290,481 | 290,577 | 290,602 | 290,854 | 291,014 | 291,649 | 291,810 | 291,749 | 161 | 100 |
| 3s3p2 4P5/2 | 305,982 | 306,418 | 306,512 | 306,535 | 306,764 | 306,961 | 307,584 | 307,708 | 307,482 | 124 | 102 |
| 3s3p2 2D3/2 | 372,211 | 372,306 | 372,353 | 372,358 | 373,159 | 372,845 | 373,184 | 372,236 | 371,135 | 948 | 2049 |
| 3s3p2 2D5/2 | 377,646 | 377,742 | 377,790 | 377,795 | 378,581 | 378,293 | 378,648 | 377,783 | 376,849 | 865 | 1799 |
| 3s3p2 2S1/2 | 448,218 | 447,924 | 447,922 | 447,904 | 448,298 | 447,345 | 447,383 | 444,759 | 444,858 | 2624 | 2525 |
| 3s3p2 2P1/2 | 484,224 | 483,980 | 483,986 | 483,973 | 483,784 | 482,863 | 482,937 | 480,016 | 480,269 | 2921 | 2668 |
| 3s3p2 2P3/2 | 495,323 | 495,091 | 495,102 | 495,094 | 494,167 | 493,288 | 493,397 | 490,467 | 490,612 | 2930 | 2785 |
| 3s23d 2D3/2 | 578,586 | 577,747 | 577,748 | 577,742 | 577,777 | 576,221 | 576,056 | 574,180 | 575,511 | 1876 | 545 |
| 3s23d 2D5/2 | 582,476 | 581,641 | 581,648 | 581,642 | 581,821 | 580,260 | 580,102 | 578,243 | 579,601 | 1859 | 501 |
| Zn | |||||||||||
| Configurations | VV | CV | NIST | Ref. [12,38] | Diff. | Diff.ref | |||||
| n = 4 | n = 5 | n = 6 | n = 7 | n = 4 | n = 5 | n = 6 | |||||
| 3s23p 2 | 0 | 0 | 0 | 0 | 0 | 0 | 0 | 0 | 0 | 0 | 0 |
| 3s23p 2 | 39,252 | 39,332 | 39,352 | 39,356 | 39,467 | 39,247 | 39,346 | 39,483 | 39,482 a 39,441 b | 137 | 136 a 95 b |
| 3s3p2 4P1/2 | 293,690 | 294,143 | 294,240 | 294,262 | 294,565 | 294,650 | 295,273 | 295200 | 295,565 b | 73 | 292 b |
| 3s3p2 4P3/2 | 311,359 | 311,812 | 311,911 | 311,935 | 312,214 | 312,358 | 312,990 | 312,993 | 313,401 b | 3 | 411 b |
| 3s3p2 4P5/2 | 329,845 | 330,275 | 330,370 | 330,394 | 330,647 | 330,828 | 331,445 | 331,359 | 331,743 b | 86 | 298 b |
| 3s3p2 2D3/2 | 398,396 | 398,483 | 398,534 | 398,539 | 399,352 | 399,004 | 399,347 | 398,390 | 401,063 a 398,202 b | 957 | 1716 a 1145 b |
| 3s3p2 2D5/2 | 405,589 | 405,684 | 405,737 | 405,743 | 406,541 | 406,229 | 406,592 | 405,760 | 407,005 a 405,567 b | 832 | 413 a 1025 b |
| 3s3p2 2S1/2 | 476,279 | 475,983 | 475,990 | 475,974 | 476,211 | 475,232 | 475,293 | 472,601 | 472,583 a 472,400 b | 2692 | 2710 a 2893 b |
| 3s3p2 2P1/2 | 517,541 | 517,277 | 517,288 | 517,274 | 517,162 | 516,197 | 516,278 | 513373 | 513,350 a 513,114 b | 2905 | 2928 a 3164 b |
| 3s3p2 2P3/2 | 529,352 | 529,111 | 529,129 | 529,121 | 528,134 | 527,222 | 527,339 | 524,382 | 524,354 a 524,114 b | 2957 | 2985 a 3225 b |
| 3s23d 2D3/2 | 613,765 | 612,920 | 612,925 | 612,918 | 612,900 | 611,308 | 611,167 | 609,252 | 609,219 a 608,425 b | 1915 | 1948 a 2742 b |
| 3s23d 2D5/2 | 618,568 | 617,725 | 617,735 | 617,729 | 617,874 | 616,275 | 616,141 | 614,272 | 614,214 a 613,395 b | 1869 | 1927 a 2746 b |
| Ge | |||||||||||
| Configurations | VV | CV | NIST | Diff. | |||||||
| n = 4 | n = 5 | n = 6 | n = 7 | n = 4 | n = 5 | n = 6 | |||||
| 3s23p 2 | 0 | 0 | 0 | 0 | 0 | 0 | 0 | 0 | 0 | ||
| 3s23p 2 | 54,325 | 54,374 | 54,417 | 54,422 | 54,568 | 542,98 | 54,572 | 54,564 | 8 | ||
| 3s3p2 4P1/2 | 331,139 | 331,559 | 331,668 | 331,692 | 332,052 | 332,079 | 332,689 | ||||
| 3s3p2 4P3/2 | 356,988 | 357,425 | 357,538 | 357,564 | 357,895 | 358,004 | 358,630 | ||||
| 3s3p2 4P5/2 | 381,052 | 381,453 | 381,562 | 381,586 | 381,895 | 382,033 | 382,635 | ||||
| 3s3p2 2D3/2 | 453,950 | 454,013 | 454,080 | 454,087 | 454,922 | 454,513 | 454,858 | 453,869 | 989 | ||
| 3s3p2 2D5/2 | 466,163 | 466,252 | 466,324 | 466,332 | 467,154 | 466,808 | 467,185 | 466,407 | 778 | ||
| 3s3p2 2P1/2 | 534,573 | 534,269 | 534,300 | 534,287 | 534,241 | 533,224 | 533,314 | 530,521 | 2793 | ||
| 3s3p2 2S1/2 | 589,387 | 589,081 | 589,111 | 589,098 | 589,143 | 588,103 | 588,190 | 585,257 | 2933 | ||
| 3s3p2 2P3/2 | 602,113 | 601,848 | 601,888 | 601,881 | 600,802 | 599,833 | 599,958 | 597,020 | 2938 | ||
| 3s23d 2D3/2 | 686,908 | 686,054 | 686,070 | 686,062 | 685,949 | 684,312 | 684,193 | 682,246 | 1947 | ||
| 3s23d 2D5/2 | 693,914 | 693,062 | 693,082 | 693,076 | 693,164 | 691,518 | 691,408 | 689,533 | 1875 | ||
| Rb | |||||||||||
| Configurations | VV | CV | NIST | Diff. | |||||||
| n = 4 | n = 5 | n = 6 | n = 7 | n = 4 | n = 5 | n = 6 | |||||
| 3s23p 2 | 0 | 0 | 0 | 0 | 0 | 0 | 0 | 0 | 0 | ||
| 3s23p 2 | 110,871 | 110,922 | 110,947 | 110,962 | 111,202 | 110,804 | 110,952 | 111,140 | 188 | ||
| 3s3p2 4P1/2 | 431,229 | 431,578 | 431,694 | 431,728 | 432,222 | 432,068 | 432,657 | ||||
| 3s3p2 4P3/2 | 492,049 | 492,464 | 492,589 | 492,626 | 493,091 | 493,100 | 493,730 | ||||
| 3s3p2 4P5/2 | 532,051 | 532,378 | 532,494 | 532,527 | 532,436 | 532,976 | 533,550 | ||||
| 3s3p2 2D3/2 | 615,166 | 615,202 | 615,278 | 615,295 | 616,172 | 615,618 | 615,968 | 614,900 | 1068 | ||
| 3s3p2 2D5/2 | 653,652 | 653,781 | 653,868 | 653,890 | 654,237 | 654,394 | 654,824 | 654,160 | 664 | ||
| 3s3p2 2P1/2 | 697,265 | 696,970 | 697029 | 697,032 | 696,475 | 695,384 | 695,519 | 692,660 | 2859 | ||
| 3s3p2 2S1/2 | 807,338 | 806,983 | 807,035 | 807,034 | 807,429 | 806,248 | 806,353 | 803,460 | 2893 | ||
| 3s3p2 2P3/2 | 817,637 | 817,345 | 817,405 | 817,410 | 816,252 | 815,150 | 815,286 | 812,510 | 2776 | ||
| 3s23d 2D3/2 | 892,285 | 891,474 | 891,470 | 891,465 | 891,150 | 889,467 | 889,357 | 887,290 | 2067 | ||
| 3s23d 2D5/2 | 906,272 | 905,468 | 905,460 | 905,457 | 905,395 | 903,767 | 903,662 | 901,780 | 1882 | ||
| Sr | |||||||||||
| Configurations | VV | CV | NIST | Diff. | |||||||
| n = 4 | n = 5 | n = 6 | n = 7 | n = 4 | n = 5 | n = 6 | |||||
| 3s23p 2 | 0 | 0 | 0 | 0 | 0 | 0 | 0 | 0 | 0 | ||
| 3s23p 2 | 126,134 | 126,200 | 126,215 | 126,231 | 126,484 | 126,054 | 126,211 | 126,410 | 199 | ||
| 3s3p2 4P1/2 | 452,427 | 452,799 | 452,880 | 452,914 | 453,304 | 453,345 | 453,759 | 453,140 | 619 | ||
| 3s3p2 4P3/2 | 523,935 | 524,036 | 524,127 | 524,165 | 524,529 | 524,751 | 525,212 | 525,050 | 162 | ||
| 3s3p2 4P5/2 | 566,888 | 567,248 | 567,319 | 567,352 | 567,184 | 567,905 | 568,303 | 568,030 | 273 | ||
| 3s3p2 2D3/2 | 652,579 | 652,194 | 652,229 | 652,248 | 653,000 | 652,654 | 652,833 | 651,640 | 1193 | ||
| 3s3p2 2D5/2 | 699,145 | 699,350 | 699,379 | 699,402 | 699,591 | 700,025 | 700,297 | 699,540 | 757 | ||
| 3s3p2 2P1/2 | 733,800 | 733,548 | 733,575 | 733,580 | 732,821 | 731,952 | 731,924 | 728,900 | 3024 | ||
| 3s3p2 2S1/2 | 859,193 | 858,873 | 858,892 | 858,892 | 859,219 | 858,251 | 858,189 | 855,010 | 3179 | ||
| 3s3p2 2P3/2 | 867,966 | 867,223 | 867,243 | 867,249 | 865,973 | 865,077 | 865,040 | 862,070 | 2970 | ||
| 3s23d 2D3/2 | 939,073 | 938,203 | 938,169 | 938,162 | 937,675 | 936,228 | 935,948 | 933,830 | 2118 | ||
| 3s23d 2D5/2 | 954,081 | 953,288 | 953,279 | 953,273 | 953,083 | 951,677 | 951,397 | 949,440 | 1957 | ||
| Transition No. | Cu | ||||||||||
|---|---|---|---|---|---|---|---|---|---|---|---|
| Transition | λc (in Å) | λ (in Å) | A | gf | S | dT | |||||
| i | j | B | C | B | C | B | C | ||||
| 1 | 3s23p 2 | 3s3p2 4P1/2 | 361.00 d 361.00 g 361.16 h | 360.83 | 8.08E +07 | 9.33E +07 | 3.15E − 03 | 3.64E − 03 | 3.75E − 03 | 4.33E − 03 | 0.134 |
| 2 | 3s23p 2 | 3s3p2 4P3/2 | 342.80 d 342.80 g 342.70 h | 342.88 | 1.73E +06 | 1.72E +06 | 1.22E − 04 | 1.21E − 04 | 1.38E − 04 | 1.37E − 04 | 0.006 |
| 3 | 3s23p 2 | 3s3p2 2D3/2 | 269.40 g 268.65 h | 267.96 | 3.84E +09 | 3.93E +09 | 1.65E −01 | 1.69E −01 | 1.46E −01 | 1.49E −01 | 0.022 |
| 4 | 3s23p 2 | 3s3p2 2S1/2 | 224.80 g 224.84 h | 223.52 | 2.99E +10 | 3.13E +10 | 4.48E −01 | 4.70E −01 | 3.29E −01 | 3.46E −01 | 0.047 |
| 5 | 3s23p 2 | 3s3p2 2P1/2 | 208.20 g 208.33 h | 207.07 | 1.16E +10 | 1.16E +10 | 1.49E −01 | 1.49E −01 | 1.02E −01 | 1.02E −01 | 0.001 |
| 6 | 3s23p 2 | 3s3p2 2P3/2 | 203.80 g 203.88 h | 202.68 | 1.09E +10 | 1.11E +10 | 2.69E −01 | 2.75E −01 | 1.79E −01 | 1.83E −01 | 0.023 |
| 7 | 3s23p 2 | 3s23d 2D3/2 | 173.54 f 173.80 g 174.17 h | 173.59 | 4.47E +10 | 4.48E +10 | 8.07E −01 | 8.09E −01 | 4.61E −01 | 4.62E −01 | 0.002 |
| Transition No. | Zn | ||||||||||
| Transition | λc (inÅ) | λ (in Å) | A | gf | S | dT | |||||
| i | j | B | C | B | C | B | C | ||||
| 1 | 3s23p 2 | 3s3p2 4P1/2 | 338.50 e | 338.67 | 1.15E +08 | 1.32E +08 | 3.95E −03 | 4.54E −03 | 4.40E −03 | 5.07E −03 | 0.131 |
| 2 | 3s23p 2 | 3s3p2 4P3/2 | 319.20 e | 319.93 | 2.41E +06 | 2.42E +06 | 1.47E −04 | 1.48E −04 | 1.55E −04 | 1.55E −04 | 0.006 |
| 3 | 3s23p 2 | 3s3p2 2D3/2 | 250.75 | 4.55E +09 | 4.43E +09 | 1.71E −01 | 1.66E −01 | 1.41E −01 | 1.37E −01 | 0.023 | |
| 4 | 3s23p 2 | 3s3p2 2S1/2 | 211.60 a | 210.40 | 3.44E +10 | 3.61E +10 | 4.57E −01 | 4.80E −01 | 3.17E −01 | 3.32E −01 | 0.047 |
| 5 | 3s23p 2 | 3s3p2 2P1/2 | 194.79 a | 193.69 | 1.07E +10 | 1.07E +10 | 1.20E −01 | 1.20E −01 | 7.67E −02 | 7.68E −02 | 0.002 |
| 6 | 3s23p 2 | 3s3p2 2P3/2 | 190.71 a | 189.89 | 1.26E +10 | 1.23E +10 | 2.71E −01 | 2.65E −01 | 1.69E −01 | 1.65E −01 | 0.023 |
| 7 | 3s23p 2 | 3s23d 2D3/2 | 164.14 a 163.60 f | 163.84 | 4.79E +10 | 4.78E +10 | 7.69E −01 | 7.67E −01 | 4.14E −01 | 4.13E −01 | 0.002 |
| Transition No. | Ge | ||||||||||
| Transition | λc (inÅ) | λ (in Å) | A | gf | S | dT | |||||
| i | j | B | C | B | C | B | C | ||||
| 1 | 3s23p 2 | 3s3p2 4P1/2 | 300.58 | 2.21E +08 | 2.53E +08 | 5.98E −03 | 6.86E −03 | 5.92E −03 | 6.78E −03 | 0.127 | |
| 2 | 3s23p 2 | 3s3p2 4P3/2 | 278.84 | 4.52E +06 | 4.54E +06 | 2.11E −04 | 2.12E −04 | 1.93E −04 | 1.94E −04 | 0.005 | |
| 3 | 3s23p 2 | 3s3p2 2D3/2 | 219.85 | 5.85E +09 | 6.04E +09 | 1.70E −01 | 1.75E −01 | 1.23E −01 | 1.27E −01 | 0.031 | |
| 4 | 3s23p 2 | 3s3p2 2S1/2 | 170.01 | 9.06E +09 | 9.08E +09 | 7.85E −02 | 7.87E −02 | 4.39E −02 | 4.40E −02 | 0.002 | |
| 5 | 3s23p 2 | 3s3p2 2P1/2 | 187.51 | 4.40E +10 | 4.62E +10 | 4.64E −01 | 4.87E −01 | 2.86E −01 | 3.01E −01 | 0.047 | |
| 6 | 3s23p 2 | 3s3p2 2P3/2 | 166.68 | 1.57E +10 | 1.62E +10 | 2.62E −01 | 2.69E −01 | 1.44E −01 | 1.48E −01 | 0.027 | |
| 7 | 3s23p 2 | 3s23d 2D3/2 | 146.16 | 5.42E +10 | 5.43E +10 | 6.94E −01 | 6.96E −01 | 3.34E −01 | 3.35E −01 | 0.003 | |
| Transition No. | Rb | ||||||||||
| Transition | λc (inÅ) | λ (in Å) | A | gf | S | dT | |||||
| i | j | B | C | B | C | B | C | ||||
| 1 | 3s23p 2 | 3s3p2 4P1/2 | 231.13 | 8.76E +08 | 9.95E +08 | 1.40E −02 | 1.59E −02 | 1.07E −02 | 1.21E −02 | 0.120 | |
| 2 | 3s23p 2 | 3s3p2 4P3/2 | 202.54 | 1.77E +07 | 1.80E +07 | 4.35E −04 | 4.44E −04 | 2.90E −04 | 2.96E −04 | 0.021 | |
| 3 | 3s23p 2 | 3s3p2 2D3/2 | 162.63 h | 162.35 | 1.14E +10 | 1.19E +10 | 1.80E −01 | 1.88E −01 | 0.96E −01 | 1.00E −01 | 0.042 |
| 4 | 3s23p 2 | 3s3p2 2S1/2 | 124.46 h | 124.02 | 6.43E +09 | 6.46E +09 | 2.97E −02 | 2.98E −02 | 1.21E −02 | 1.22E −02 | 0.004 |
| 5 | 3s23p 2 | 3s3p2 2P1/2 | 144.37 h | 143.78 | 7.19E +10 | 7.56E +10 | 4.45E −01 | 4.69E −01 | 2.11E −01 | 2.22E −01 | 0.049 |
| 6 | 3s23p 2 | 3s3p2 2P3/2 | 123.07 h | 122.66 | 3.56E +10 | 3.66E +10 | 3.21E −01 | 3.30E −01 | 1.30E −01 | 1.33E −01 | 0.026 |
| 7 | 3s23p 2 | 3s23d 2D3/2 | 112.71 h | 112.44 | 6.64E +10 | 6.66E +10 | 5.03E −01 | 5.05E −01 | 1.86E −01 | 1.87E −01 | 0.003 |
| Transition No. | Sr | ||||||||||
| Transition | λc (inÅ) | λ (in Å) | A | gf | S | dT | |||||
| i | j | B | C | B | C | B | C | ||||
| 1 | 3s23p 2 | 3s3p2 4P1/2 | 220.38 | 1.10E +09 | 1.26E +09 | 1.61E −02 | 1.83E −02 | 1.17E −02 | 1.33E −02 | 0.118 | |
| 2 | 3s23p 2 | 3s3p2 4P3/2 | 190.40 | 2.26E +07 | 2.32E +07 | 4.91E −04 | 5.04E −04 | 3.08E −04 | 3.16E −04 | 0.024 | |
| 3 | 3s23p 2 | 3s3p2 2D3/2 | 153.47 h | 153.18 | 1.29E +10 | 1.35E +10 | 1.82E −02 | 1.90E −01 | 9.18E −02 | 9.60E −02 | 0.043 |
| 4 | 3s23p 2 | 3s3p2 2S1/2 | 116.92 h | 116.52 | 6.10E +09 | 6.12E +09 | 2.48E −02 | 2.49E −02 | 9.53E −03 | 9.56E −03 | 0.003 |
| 5 | 3s23p 2 | 3s3p2 2P1/2 | 137.19 h | 136.63 | 7.85E +10 | 8.26E +10 | 4.39E −01 | 4.62E −01 | 1.98E −01 | 2.08E −01 | 0.049 |
| 6 | 3s23p 2 | 3s3p2 2P3/2 | 115.98 h | 115.60 | 4.42E +10 | 4.53E +10 | 3.54E −01 | 3.63E −01 | 1.35E −01 | 1.38E −01 | 0.024 |
| 7 | 3s23p 2 | 3s23d 2D3/2 | 107.10 h | 106.84 | 6.60E +10 | 6.61E +10 | 4.52E −01 | 4.52E −01 | 1.59E −01 | 1.59E −01 | 0.001 |
| Cu | |||||
|---|---|---|---|---|---|
| T (in K) | R | ne | nfit | δ | |
| 2 × 10⁶ | 0.927 | 0.115 | 0.115 | 0.96289 | 495.1601 |
| 4 × 10⁶ | 1.033 | 0.162 | 0.162 | 1.14284 | 417.193 |
| 6 × 10⁶ | 1.070 | 0.199 | 0.199 | 1.266644 | 376.4159 |
| 8 × 10⁶ | 1.090 | 0.230 | 0.230 | 1.361733 | 350.131 |
| 1 × 10⁷ | 1.102 | 0.257 | 0.257 | 1.439443 | 331.2287 |
| 1 × 10⁸ | 1.145 | 0.813 | 0.813 | 2.560196 | 186.2298 |
| 1 × 10⁹ | 1.149 | 2.570 | 2.570 | 4.551919 | 104.7437 |
| 1 × 10¹⁰ | 1.150 | 8.128 | 8.129 | 8.095055 | 58.89829 |
| Zn | |||||
| T (in K) | R | ne | nfit | δ | |
| 2 × 10⁶ | 0.686 | 0.135 | 0.135 | 1.043266 | 457.012 |
| 4 × 10⁶ | 0.768 | 0.192 | 0.192 | 1.244167 | 383.2162 |
| 6 × 10⁶ | 0.798 | 0.235 | 0.235 | 1.376455 | 346.3862 |
| 8 × 10⁶ | 0.813 | 0.271 | 0.271 | 1.47813 | 322.5595 |
| 1 × 10⁷ | 0.823 | 0.303 | 0.303 | 1.562965 | 305.0515 |
| 1 × 10⁸ | 0.857 | 0.959 | 0.959 | 2.780592 | 171.4688 |
| 1 × 10⁹ | 0.860 | 3.033 | 3.034 | 4.944976 | 96.41804 |
| 1 × 10¹⁰ | 0.861 | 9.593 | 9.598 | 8.794379 | 54.21473 |
| Ge | |||||
| T (in K) | R | ne | nfit | δ | |
| 2 × 10⁶ | 0.392 | 0.187 | 0.187 | 1.22786 | 388.3057 |
| 4 × 10⁶ | 0.444 | 0.264 | 0.264 | 1.458915 | 326.8079 |
| 6 × 10⁶ | 0.464 | 0.324 | 0.324 | 1.61622 | 295.0000 |
| 8 × 10⁶ | 0.473 | 0.374 | 0.374 | 1.736456 | 274.5736 |
| 1 × 10⁷ | 0.480 | 0.418 | 0.418 | 1.835761 | 259.7206 |
| 1 × 10⁸ | 0.501 | 1.321 | 1.322 | 3.263468 | 146.0976 |
| 1 × 10⁹ | 0.504 | 4.179 | 4.178 | 5.804491 | 82.14069 |
| 1 × 10¹⁰ | 0.504 | 13.210 | 13.211 | 10.31999 | 46.20012 |
| Rb | |||||
| T (in K) | R | ne | nfit | δ | |
| 2 × 10⁶ | 0.112 | 0.410 | 0.410 | 1.801505 | 262.2422 |
| 4 × 10⁶ | 0.132 | 0.580 | 0.580 | 2.142681 | 220.4857 |
| 6 × 10⁶ | 0.140 | 0.710 | 0.710 | 2.370679 | 199.2807 |
| 8 × 10⁶ | 0.143 | 0.820 | 0.820 | 2.547713 | 185.4332 |
| 1 × 10⁷ | 0.146 | 0.916 | 0.917 | 2.692721 | 175.4473 |
| 1 × 10⁸ | 0.155 | 2.899 | 2.899 | 4.790355 | 98.62123 |
| 1 × 10⁹ | 0.156 | 9.167 | 9.166 | 8.518384 | 55.46013 |
| 1 × 10¹⁰ | 0.156 | 28.990 | 28.986 | 15.14843 | 31.18677 |
| Sr | |||||
| T (in K) | R | ne | nfit | δ | |
| 2 × 10⁶ | 0.087 | 0.482 | 0.482 | 1.971294 | 241.8639 |
| 4 × 10⁶ | 0.104 | 0.682 | 0.682 | 2.344877 | 203.3304 |
| 6 × 10⁶ | 0.110 | 0.835 | 0.835 | 2.594605 | 183.7601 |
| 8 × 10⁶ | 0.113 | 0.965 | 0.964 | 2.789277 | 170.9349 |
| 1 × 10⁷ | 0.115 | 1.079 | 1.078 | 2.949434 | 161.653 |
| 1 × 10⁸ | 0.123 | 3.411 | 3.411 | 5.244074 | 90.91879 |
| 1 × 10⁹ | 0.124 | 10.789 | 10.786 | 9.326497 | 51.12154 |
| 1 × 10¹⁰ | 0.124 | 34.110 | 34.115 | 16.58322 | 28.75105 |
| Z | K | C |
|---|---|---|
| 29 | 0.500 | 16.909 |
| 30 | 0.500 | 16.979 |
| 32 | 0.499 | 17.121 |
| 37 | 0.500 | 17.462 |
| 38 | 0.500 | 17.532 |
© 2016 by the authors; licensee MDPI, Basel, Switzerland. This article is an open access article distributed under the terms and conditions of the Creative Commons Attribution (CC-BY) license (http://creativecommons.org/licenses/by/4.0/).
Share and Cite
Goyal, A.; Khatri, I.; Singh, A.K.; Mohan, M.; Sharma, R.; Singh, N. Atomic Structure Calculations and Study of Plasma Parameters of Al-Like Ions. Atoms 2016, 4, 22. https://doi.org/10.3390/atoms4030022
Goyal A, Khatri I, Singh AK, Mohan M, Sharma R, Singh N. Atomic Structure Calculations and Study of Plasma Parameters of Al-Like Ions. Atoms. 2016; 4(3):22. https://doi.org/10.3390/atoms4030022
Chicago/Turabian StyleGoyal, Arun, Indu Khatri, Avnindra Kumar Singh, Man Mohan, Rinku Sharma, and Narendra Singh. 2016. "Atomic Structure Calculations and Study of Plasma Parameters of Al-Like Ions" Atoms 4, no. 3: 22. https://doi.org/10.3390/atoms4030022
APA StyleGoyal, A., Khatri, I., Singh, A. K., Mohan, M., Sharma, R., & Singh, N. (2016). Atomic Structure Calculations and Study of Plasma Parameters of Al-Like Ions. Atoms, 4(3), 22. https://doi.org/10.3390/atoms4030022