Spectral Line Shapes of He I Line 3889 Å


Abstract
:1. Introduction
2. Experiment
3. Theoretical Approaches
3.1. Quantum Statistical Approach
3.1.1. T-Matrix Approach
3.1.2. Microfield Distribution Function
3.1.3. Frequency Fluctuation Model
3.2. Classical Molecular Dynamics Simulations
4. Results and Discussions


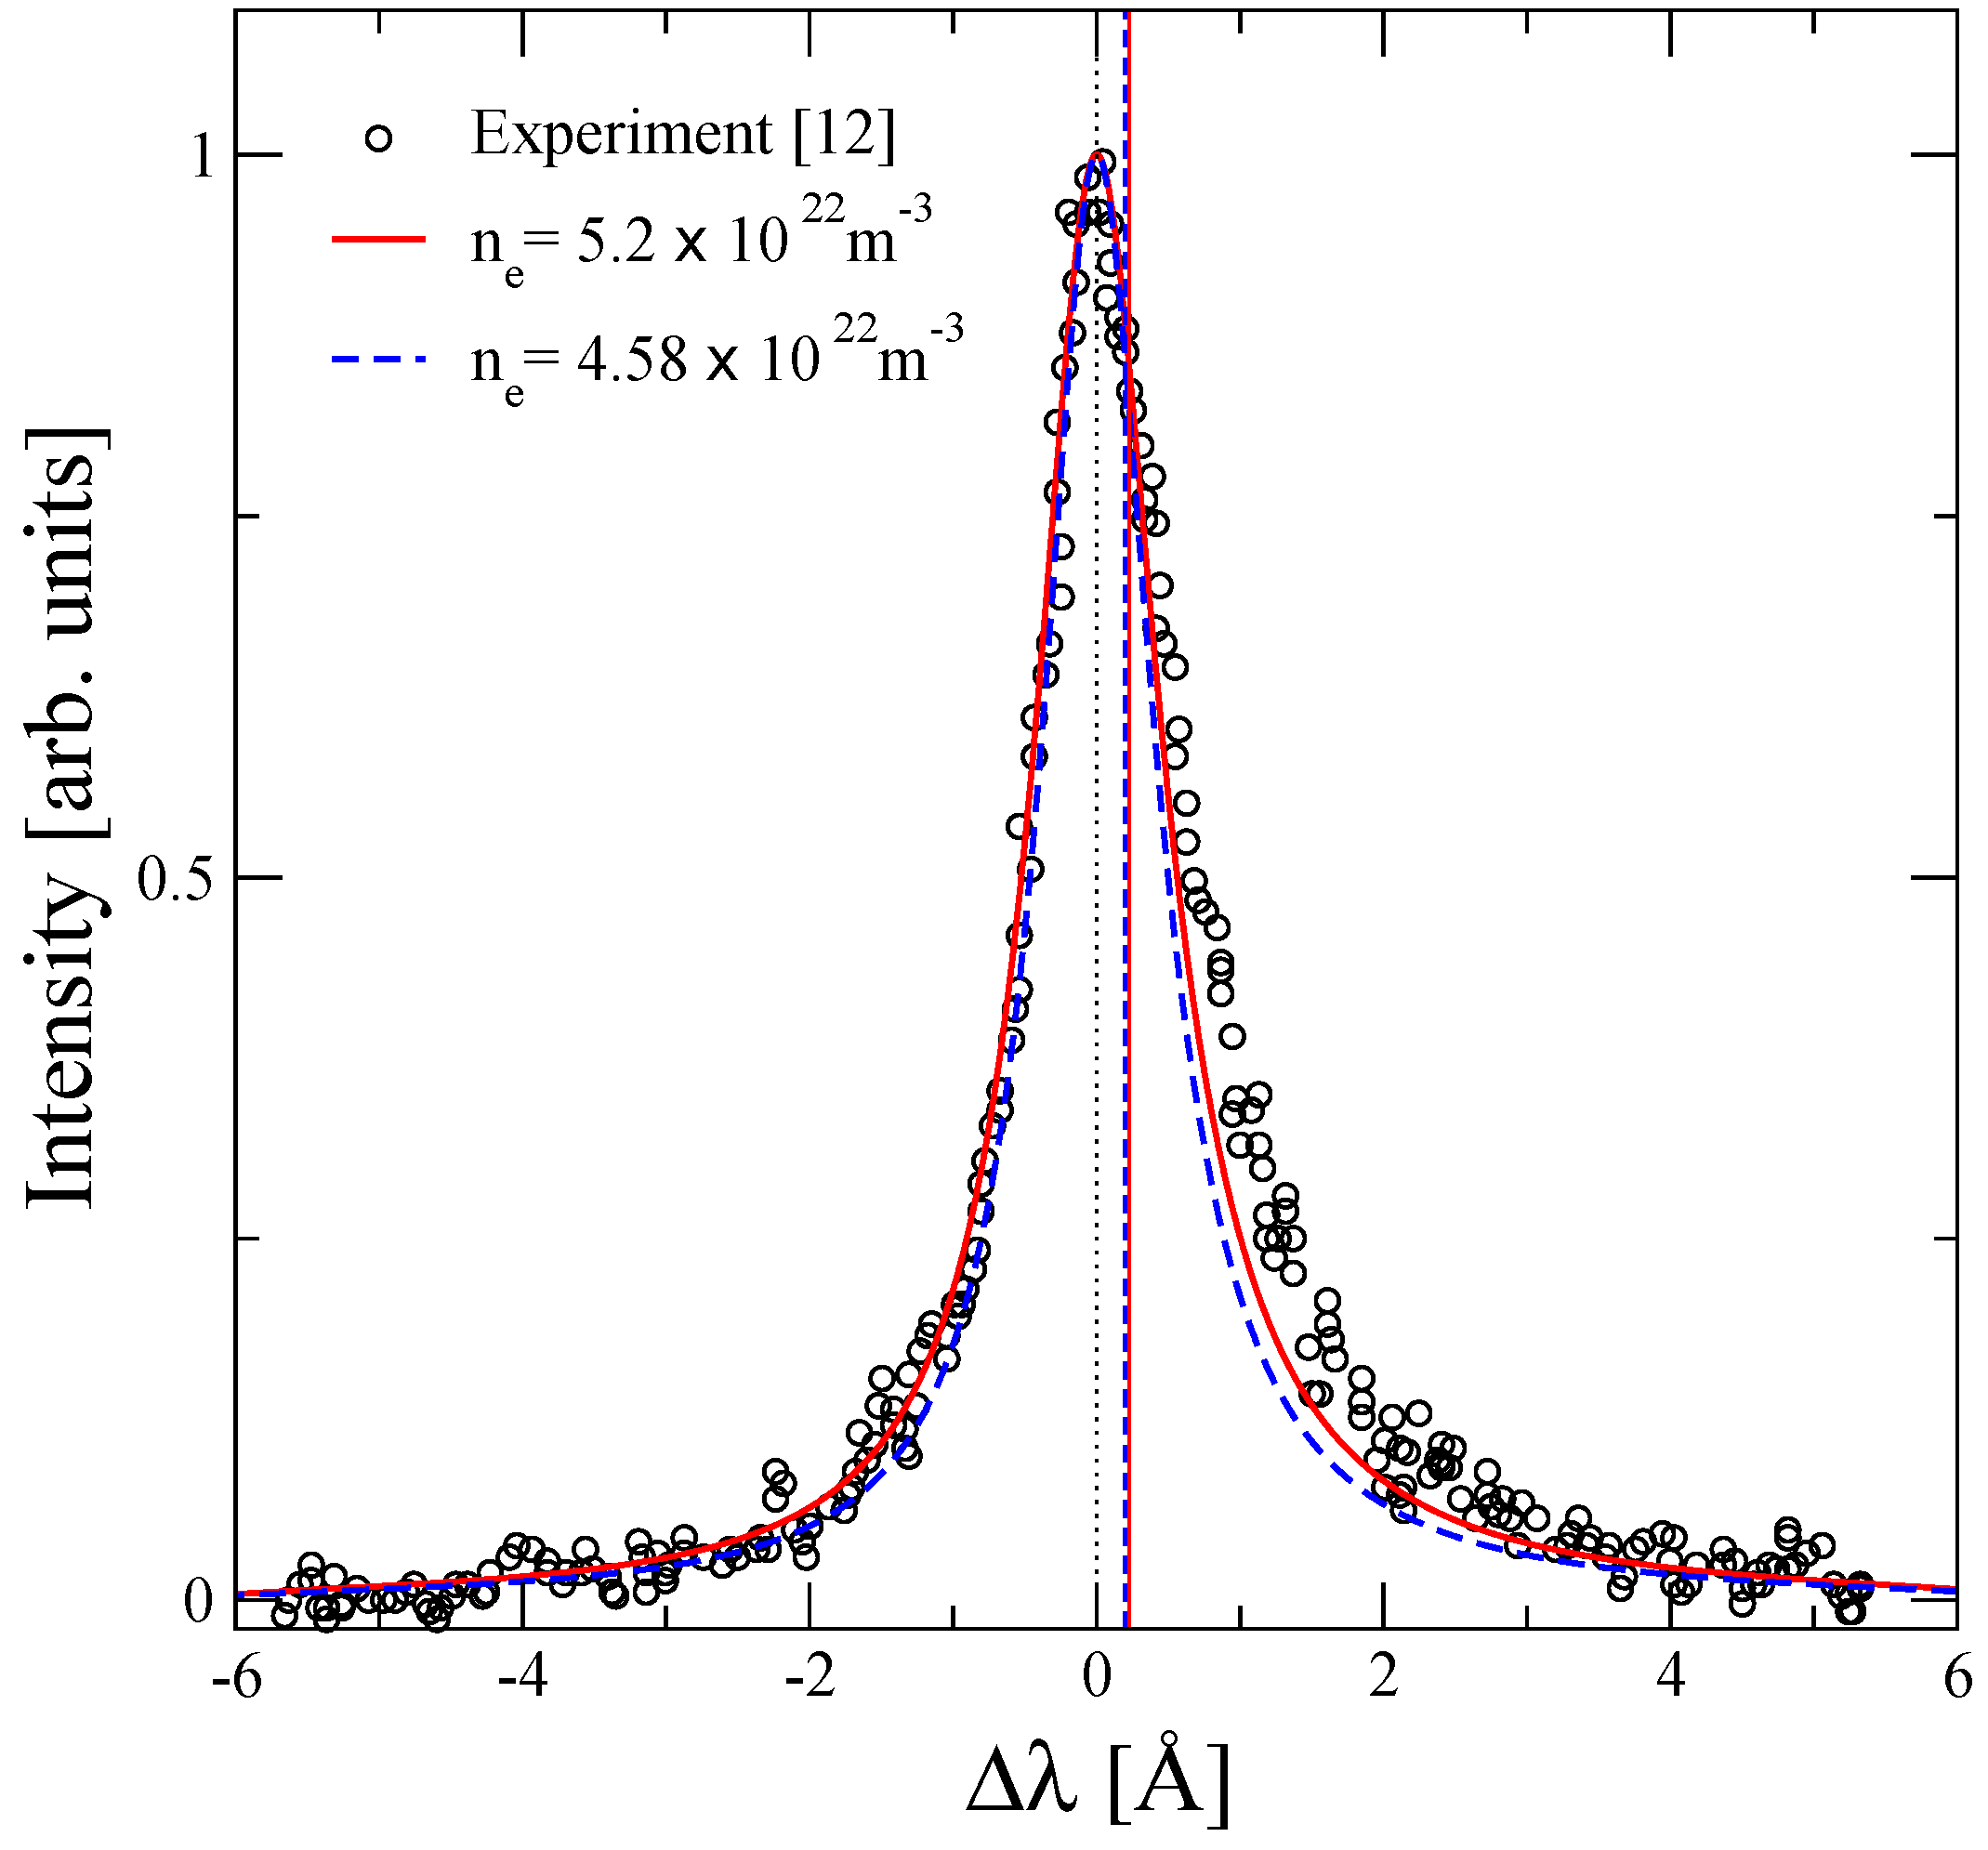
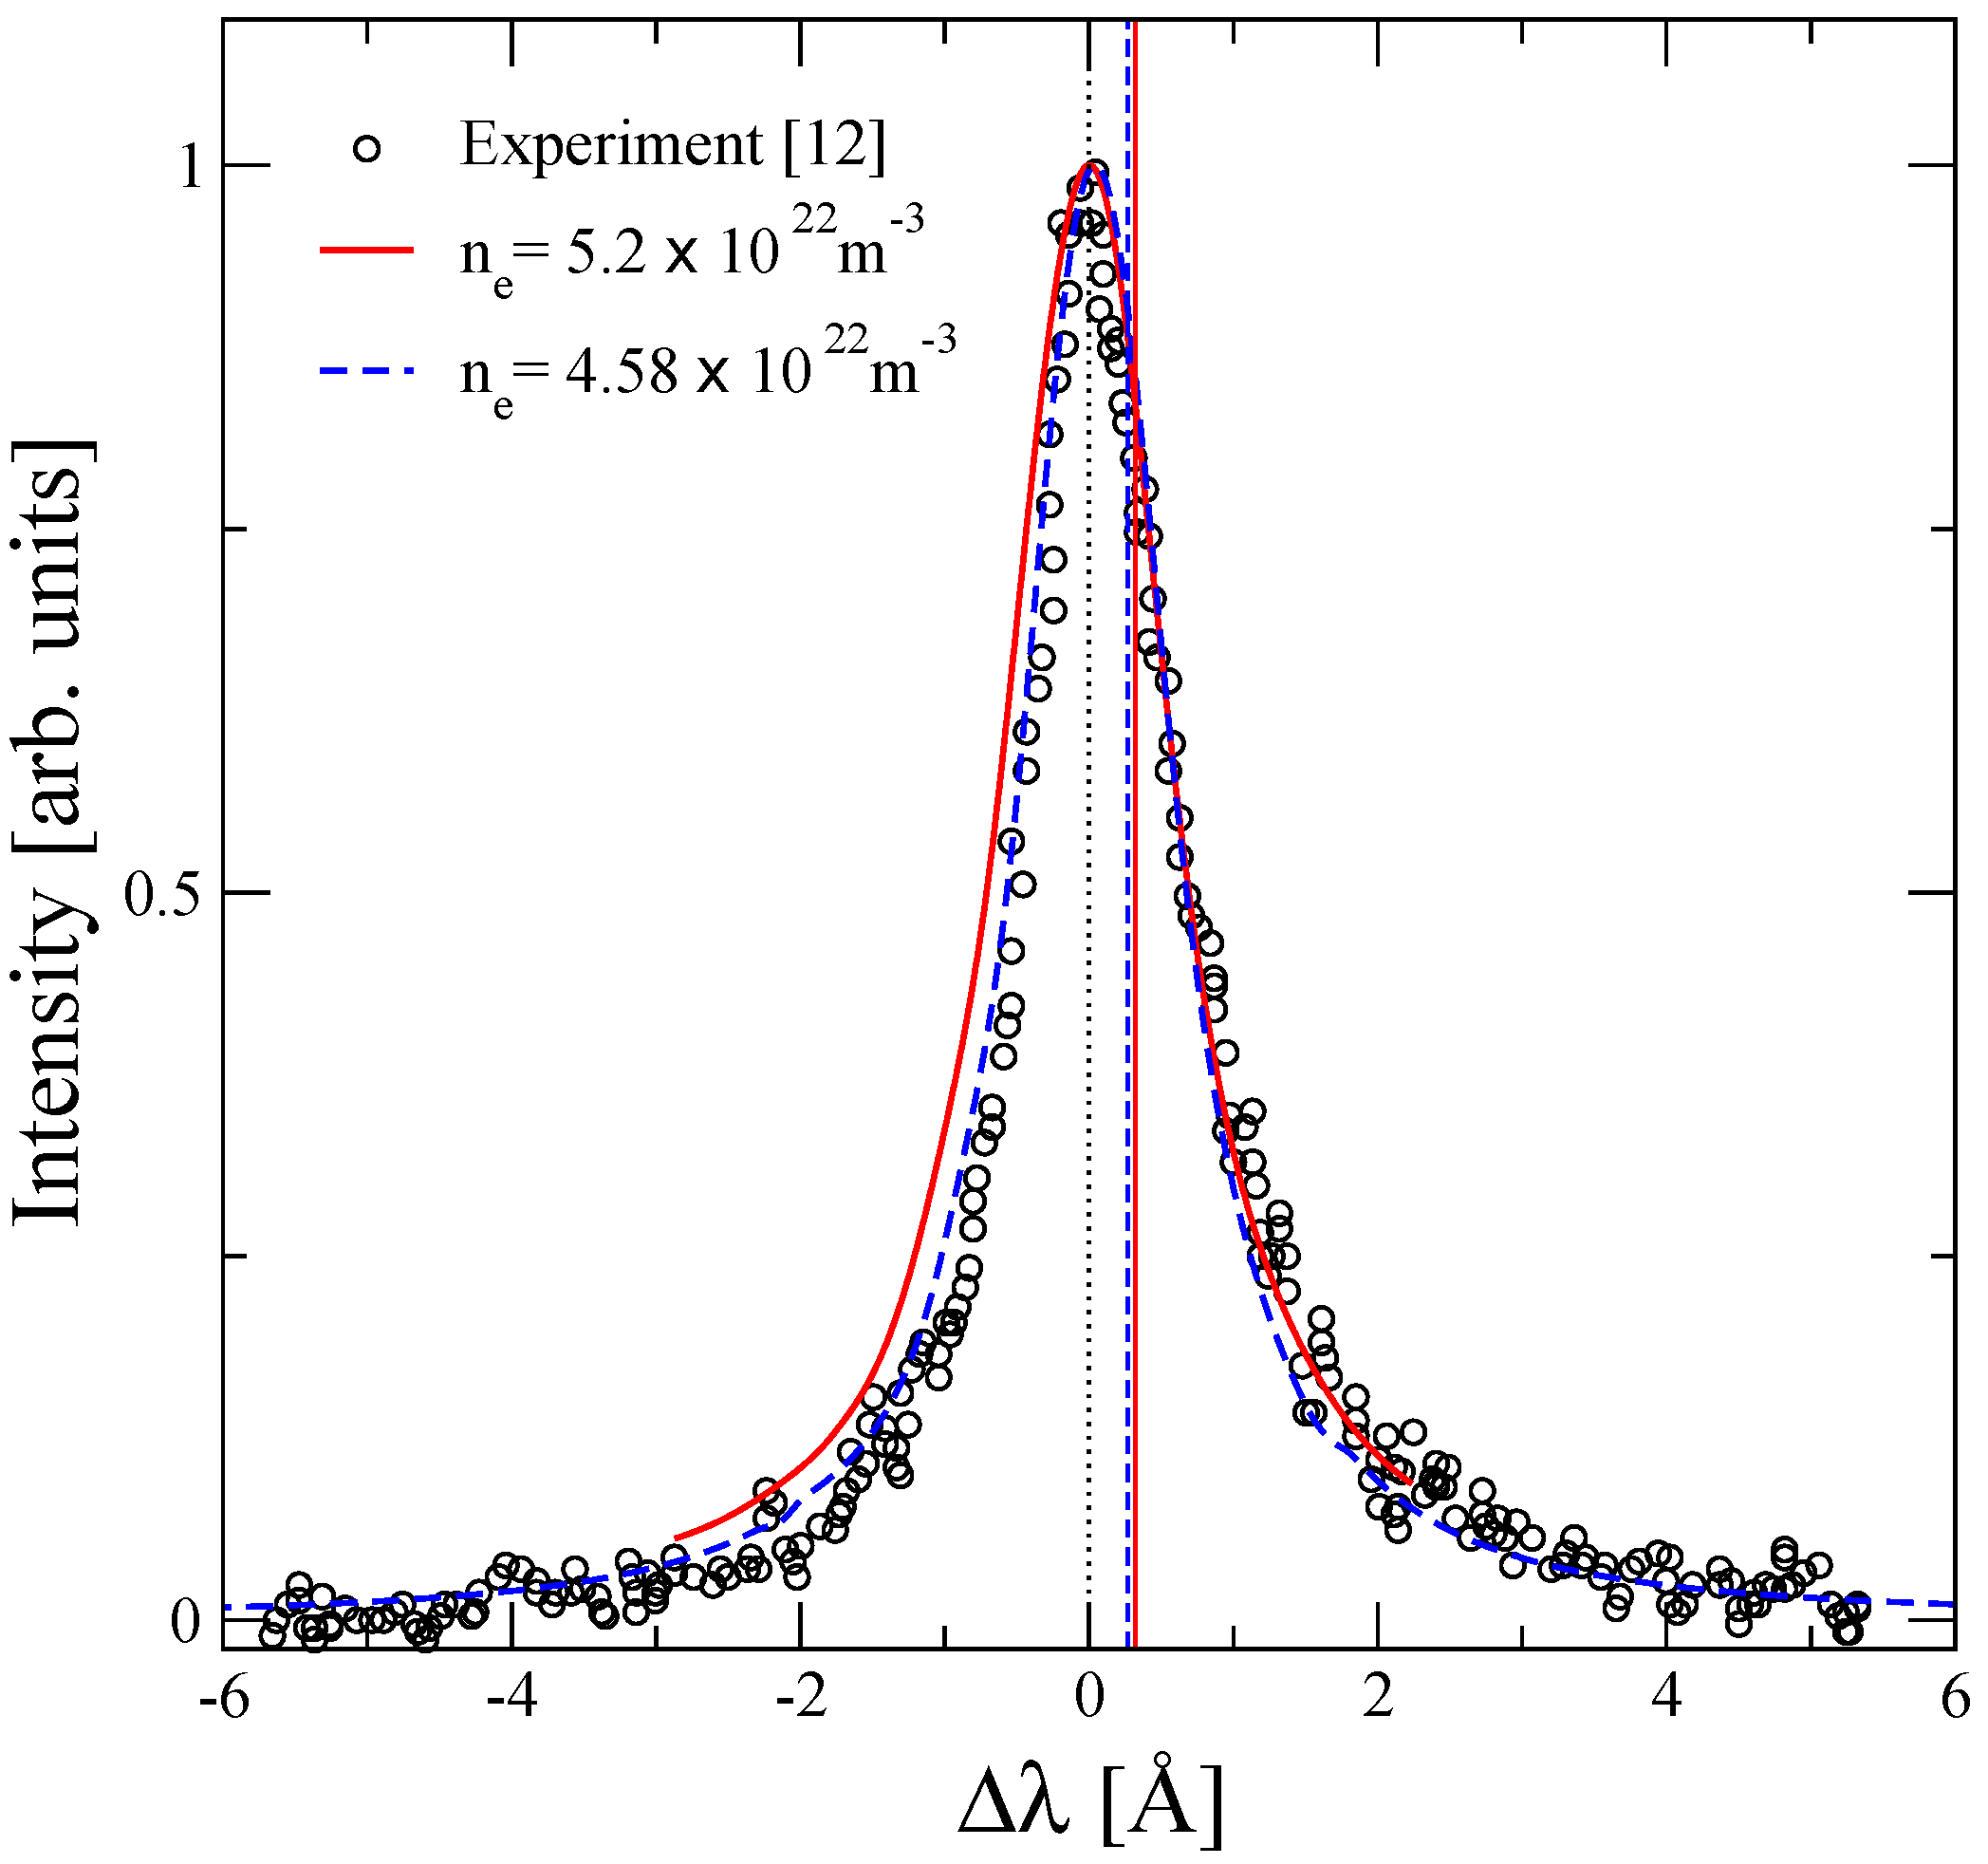
| Shift [Å] | FWHM [Å] | |||||
|---|---|---|---|---|---|---|
| Born | T-Matrix | MD | Born | T-Matrix | MD | |
| 5.2 | 0.483/0.523 | 0.178/0.228 | 0.32 | 1.245/1.278 | 1.038/1.087 | 1.402 |
| 4.58 | 0.427/0.462 | 0.147/0.197 | 0.269 | 1.094/1.123 | 0.914/0.965 | 1.245 |
5. Conclusions
Acknowledgments
Author Contributions
Appendix A: Spectral Line Profile
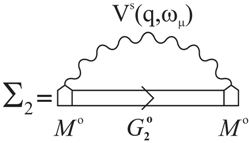
Appendix B: Electronic Self-energy
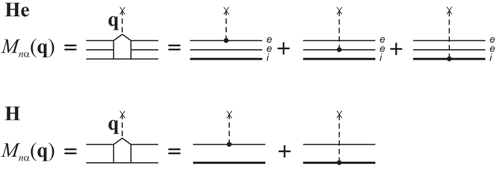
Appendix C: Matrix-Element
Conflicts of Interest
References
- Griem, H.R. Spectral Line Broadening by Plasmas; Academic Press: New York, NY, USA, 1974. [Google Scholar]
- Günter, S.; Hitzschke, L.; Röpke, G. Hydrogen spectral lines with the inclusion of dense-plasma effects. Phys. Rev. A 1991, 44, 6834–6844. [Google Scholar] [CrossRef] [PubMed]
- Frisch, U.; Brissaud, A. Theory of Stark broadening soluble scalar model as a test. J. Quant. Spectrosc. Radiat. Transf. 1971, 11, 1753–1766. [Google Scholar] [CrossRef]
- Seidel, J. Hydrogen Stark Broadening by Model Electronic Microfields. Z. Naturforschung A 1977, 32a, 1195–1206. [Google Scholar] [CrossRef]
- Seidel, J. Effects of Ion Motion on Hydrogen Stark Profiles. Z. Naturforschung A 1977, 32a, 1207–1214. [Google Scholar] [CrossRef]
- Stehlé, C.; Hutcheon, R. Extensive tabulations of Stark broadened hydrogen line profiles. Astron. Astrophys. Suppl. Ser. 1999, 140, 93–97. [Google Scholar] [CrossRef]
- Talin, B.; Calisti, A.; Godbert, L.; Stamm, R.; Lee, R.W.; Klein, L. Frequency-fluctuation model for line-shape calculations in plasma spectroscopy. Phys. Rev. A 1995, 51, 1918–1928. [Google Scholar] [CrossRef] [PubMed]
- Stamm, R.; Smith, E.W.; Talin, B. Study of hydrogen Stark profiles by means of computer simulation. Phys. Rev. A 1984, 30, 2039–2046. [Google Scholar] [CrossRef]
- Gigosos, M.A.; Cardeñoso, V. New plasma diagnosis tables of hydrogen Stark broadening including ion-dynamics. J. Phys. B Atom. Mol. Opt. Phys. 1996, 29, 4795–4838. [Google Scholar] [CrossRef]
- Gigosos, M.A.; González, M.A. Stark broadening tables for the helium I 447.1 line. Application to weakly coupled plasmas diagnostics. Astron. Astrophys. 2009, 503, 293–299. [Google Scholar] [CrossRef]
- Gigosos, M.A.; Djurovic, S.; Savic, I.; González-Herrero, D.; Mijatovic, Z.; Kobilarov, R. Stark broadening of lines from transition between states n = 3 to n = 2 in neutral helium. An experimental and computer-simulation study. Astron. Astrophys. 2014, 561, A135:1–A135:13. [Google Scholar]
- Jovićević, S.; Ivković, M.; Zikic, R.; Konjević, N. On the Stark broadening of Ne I lines and static vs. ion impact approximation. J. Phys. B Atom. Mol. Opt. Phys. 2005, 38, 1249–1259. [Google Scholar] [CrossRef]
- Hitzschke, L.; Röpke, G.; Seifert, T.; Zimmermann, R. Green’s function approach to the electron shift and broadening of spectral lines in non-ideal plasmas. J. Phys. B Atom. Mol. Opt. Phys. 1986, 19, 2443–2456. [Google Scholar] [CrossRef]
- Günter, S. Optische Eigenschaften Dichter Plasmen. Habilitation thesis, Rostock University, Rostock, Germany, 1995. [Google Scholar]
- Sorge, S.; Wierling, A.; Röpke, G.; Theobald, W.; Sauerbrey, R.; Wilhein, T. Diagnostics of a laser-induced dense plasma by Hydrogen-like Carbon spectra. J. Phys. B Atom. Mol. Opt. Phys. 2000, 33, 2983–3000. [Google Scholar] [CrossRef]
- Omar, B.; Günter, S.; Wierling, A.; Röpke, G. Neutral helium spectral lines in dense plasmas. Phys. Rev. E 2006, 73, 056405:1–056405:13. [Google Scholar] [CrossRef]
- Günter, S.; Könies, A. Shifts and asymmetry parameters of hydrogen Balmer lines in dense plasmas. Phys. Rev. E 1997, 55, 907–911. [Google Scholar] [CrossRef]
- Calisti, A.; Mossé, C.; Ferri, S.; Talin, B.; Rosmej, F.; Bureyeva, L.A.; Lisitsa, V.S. Dynamic Stark broadening as the Dicke narrowing effect. Phys. Rev. E 2010, 81, 016406:1–016406:6. [Google Scholar] [CrossRef]
- Lorenzen, S.; Omar, B.; Zammit, M.C.; Fursa, D.V.; Bray, I. Plasma pressure broadening forfew-electron emitters including strong electron collisions within a quantum-statistical theory. Phys. Rev. E 2014, 89, 023106:1–023106:13. [Google Scholar] [CrossRef]
- Hitzschke, L.; Günter, S. The influence of many-particle effects beyond the Debye approximation on spectral line shapes in dense plasmas. J. Quant. Spectrosc. Radiat. Transf. 1996, 56, 423–441. [Google Scholar] [CrossRef]
- Beauchamp, A.; Wesemael, F.; Bergeron, P. Spectroscopicstudies of tudies DB white dwarfs: Improved Stark profiles for optical transitions of neutral helium. Astrophys. J. Suppl. Ser. 1997, 108, 559–573. [Google Scholar] [CrossRef]
- Bates, D.R.; Damgaard, A. The calculation of the absolute strengths of spectral lines. Phil. Trans. Roy. Soc. Lond. A 1949, 242, 101–122. [Google Scholar] [CrossRef]
- Griem, H.R.; Baranger, M.; Kolb, A.C.; Oertel, G. Stark broadening of neutral helium lines in a plasma. Phys. Rev. 1962, 125, 177–195. [Google Scholar] [CrossRef]
- Halenka, J. Asymmetry of hydrogen lines in plasmas utilizing a statistical description of ion-quadruple interaction in Mozer-Baranger limit. Z. Phys. D 1990, 16, 1–8. [Google Scholar] [CrossRef]
- Kraeft, W.-D.; Kremp, D.; Ebeling, W.; Röpke, G. Quantum Statistics of Charged Particle Systems; Akademie-Verlag: Berlin, Germany, 1986. [Google Scholar]
- Günter, S. Contributions of strong collisions in the theory of spectral lines. Phys. Rev. E 1993, 48, 500–505. [Google Scholar] [CrossRef]
- Baranger, M. General impact theory of pressure broadening. Phys. Rev. 1958, 112, 855–865. [Google Scholar] [CrossRef]
- Bray, I.; Stelbovics, A.T. Convergent close-coupling calculations of electron-hydrogen scattering. Phys. Rev. A 1992, 46, 6995–7011. [Google Scholar] [CrossRef] [PubMed]
- Fursa, D.V.; Dmitry, V.; Bray, I. Calculation of electron-helium scattering. Phys. Rev. A 1995, 52, 1279–1297. [Google Scholar] [CrossRef] [PubMed]
- Bray, I.; Fursa, D.V.; Kadyrov, A.S.; Stelbovics, A.T.; Kheifets, A.S.; Mukhamedzhanov, A.M. Electron- and photon-impact atomic ionisation. Phys. Rep. 2012, 520, 135–174. [Google Scholar] [CrossRef]
- Debye, P.; Hückel, E. Phys. Zeitschrift 1923, 24, 185–206.
- Kardar, M. Statistical Physics of Particles; Cambridge University Press: Cambridge, UK, 2007; pp. 268–273. [Google Scholar]
- Zammit, M.C.; Fursa, D.V.; Bray, I. Convergent-close-coupling calculations for excitation and ionization processes of electron-hydrogen collisions in Debye plasmas. Phys. Rev. A 2010, 82, 052705:1–052705:7. [Google Scholar] [CrossRef]
- Zammit, M.C.; Fursa, D.V.; Bray, I.; Janev, R.K. Electron-helium scattering in Debye plasmas. Phys. Rev. E 2011, 84, 052705:1–052705:15. [Google Scholar] [CrossRef]
- Bray, I.; Fursa, D.V. Benchmark cross sections for electron-impact total single ionization of helium. J. Phys. B Atom. Mol. Opt. Phys. 2011, 44(6), 061001:1–061001:3. [Google Scholar] [CrossRef]
- Griaznov, V.K. Thermophysical Properties of the Working Gas of the Gas-Phase Nuclear Reactors; Atomizdat: Moscow, Russia, 1980. [Google Scholar]
- Kudrin, L.P. Statistical Plasma Physics; Atomizdat: Moscow, Russia, 1974. [Google Scholar]
- Ecker, G.; Müller, K.G. Plasmapolarisation und Trägerwechselwirkung. Z. Phys. 1958, 153, 317–330. [Google Scholar] [CrossRef]
- Iglesias, C.A.; Hooper, C.F. Quantum corrections to the low-frequency-component microfield distributions. Phys. Rev. A 1982, 25, 1049–1059. [Google Scholar] [CrossRef]
- Iglesias, C.A. Integral-equation method for electric microfield distribution. Phys. Rev. A 1983, 27, 2705–2709. [Google Scholar] [CrossRef]
- Ramazanov, T.S.; Dzhumagulova, K.N. Effective screened potentials of strongly coupled semiclassical plasma. Phys. Plasmas 2002, 9, 3758–3761. [Google Scholar] [CrossRef]
- Anderson, P.W. Pressure broadening in the microwave and infra-red regions. Phys. Rev. 1949, 76, 647–661. [Google Scholar] [CrossRef]
- Gigosos, M.A.; González, M.A.; Cardeñoso, V. Computersimulated Balmer-alpha, -beta and -gamma Stark line profiles for non-equilibrium plasmas diagnostics. Spectrochim. Acta Part B 2003, 58, 1489–1504. [Google Scholar] [CrossRef]
- Seidel, J.; Stamm, R. Effects of radiator motion on plasma-broadened hydrogen Lyman-β. J. Quant. Spectrosc. Radiat. Transfer 1982, 27, 499–503. [Google Scholar] [CrossRef]
- González, M.A.; Gigosos, M.A. Analysis of Stark line profiles for non-equilibrium plasma diagnosis. Plasma Sourc. Sci. Technol. 2009, 18(3), 034001:1–034001:5. [Google Scholar] [CrossRef]
- Bruggeman, P.; Schram, D.; González, M.A.; Rego, R.; Kong, M.G.; Leys, C. Characterization of a direct dc-excited discharge in water by optical emission spectroscopy. Plasma Sourc. Sci. Technol. 2009, 18(2), 025017:1–025017:13. [Google Scholar] [CrossRef]
- Xiong, Q.; Nikiforov, A.Y.; González, M.A.; Leys, C.; Lu, X.P. Characterization of an atmospheric helium plasma jet by relative and absolute optical emission spectroscopy. Plasma Sourc. Sci. Technol. 2013, 22(1), 015011:1–025017:13. [Google Scholar] [CrossRef]
- Dufour, E.; Calisti, A.; Talin, B.; Gigosos, A.M.; González, M.A.; Dufty, J.W. Charge correlation effects in electron broadening of ion emitters in hot and dense plasmas. J. Quant. Spectros. Radiat. Transf. 2003, 81, 125–132. [Google Scholar] [CrossRef]
- Dufour, E.; Calisti, A.; Talin, B.; Gigosos, M.A.; González, M.A.; del Rio Gaztelurrutia, T.; Dufty, J.W. Charge-charge coupling effects on dipole emitter relaxation within a classicalelectron-ion plasma description. Phys. Rev. E 2005, 71, 066409:1–066409:9. [Google Scholar] [CrossRef]
- Konjević, N.; Ivković, M.; Jovićević, S. Spectroscopic diagnostics of laser-induced plasmas. Spectrochim. Acta Part B: Atom. Spectrosc. 2010, 65, 593–602. [Google Scholar] [CrossRef]
- Hooper, C.F., Jr. Low-frequency component electric microfield distributions in plasmas. Phys. Rev. 1968, 165, 215–222. [Google Scholar] [CrossRef]
- Potekhin, A.Y.; Chabrier, G.; Gilles, D. Electric microfield distributions in electron-ion plasmas. Phys. Rev. E 2002, 65, 036412:1–036412:12. [Google Scholar] [CrossRef]
- Omar, B.; Wierling, A.; Günter, S.; Röpke, G. Analysing brilliance spectra of a laser-induced carbon Plasma. J. Phys. A: Math. Gen. 2006, 39, 4731–4737. [Google Scholar] [CrossRef]
- Pérez, C.; Santamarta, R.; de la Rosa, M.I.; Mar, S. Stark broadening of neutral helium lines and spectroscopic diagnostics of pulsed helium plasma. Eur. Phys. J. D 2003, 27, 73–75. [Google Scholar]
- Kelleher, D.E. Stark broadening of visible neutral helium lines in a plasma. J. Quantit. Spectrosc. Radiat. Transf. 1981, 25, 191–220. [Google Scholar] [CrossRef]
- Gao, H.M.; Ma, S.L.; Xu, C.M.; Wu, L. Measurements of electron density and Stark width of neutral helium lines in a helium arc plasma. Eur. Phys. J. D 2008, 47, 191–196. [Google Scholar] [CrossRef]
- Kobilarov, R.; Konjević, N.; Popović, M.V. Influence of ion dynamics on the width and shift of isolated He I lines in plasmas. Phys. Rev. A 1989, 40, 3871–3879. [Google Scholar] [CrossRef] [PubMed]
- Morris, R.N.; Cooper, J. Stark Shifts of He I 3889, He I 4713, and He I 5016. Can. J. Phys. 1973, 51, 1746–1751. [Google Scholar] [CrossRef]
- Berg, H.F.; Ali, A.W.; Lincke, R.; Griem, H.R. Measurement of stark profiles of neutral and ionized helium and hydrogen lines from shock-heated plasmas in electromagnetic T tubes. Phys. Rev. 1962, 125, 199–206. [Google Scholar] [CrossRef]
- Milosavljević, V.; Djeniže, S. Ion contribution to the astrophysical important 388.86, 471.32 and 501.56 nm He I spectral lines broadening. New Astron. 2002, 7, 543–551. [Google Scholar] [CrossRef]
- Soltwisch, H.; Kusch, H.J. Experimental Stark profile Determination of some Plasma Broadened He I- and He II Lines. Z. Naturforsch. A 1979, 34a, 300–309. [Google Scholar] [CrossRef]
- Omar, B.; Wierling, A.; Reinholz, H.; Röpke, G. Diagnostic of laser induced Li II plasma. Phys. Rev. Res. Int. 2013, 3, 218–227. [Google Scholar]
- Röpke, G.; Seifert, T.; Kilimann, K. A Green’s function approach to the shift of spectral lines in dense. Ann. Phys. (Leipzig) 1981, 38, 381–460. [Google Scholar] [CrossRef]
- Kobzev, G.A.; Iakubov, I.T.; Popovich, M.M. Transport and Optical Properties of Nonideal Plasmas; Plenum Press: New York, NY, USA & London, UK, 1995. [Google Scholar]
- Redmer, R. Physical properties of dense, low-temperature plasmas. Phys. Rep. 1997, 282, 35–157. [Google Scholar] [CrossRef]
- Günter, S. Stark shift and broadening of hydrogen spectral lines. Contrib. Plasma Phys. 1989, 29, 479–487. [Google Scholar] [CrossRef]
- Kadanoff, L.P.; Baym, G. Quantum Statistical Mechanics: Green’s Function Methods in Equilibrium and Nonequilibrium Problems; Addison-Wesley Publishing Co., Inc.: New York, NY, USA, 1989. [Google Scholar]
- Zimmermann, R. Many Particle Theory of Highly Excited Semiconductors; BSB Teubner: Leipzig, Germany, 1987. [Google Scholar]
- Zimmermann, R.; Kilimann, K.; Kraeft, W.-D.; Kremp, D.; Röpke, G. Dynamical screening and self energy of excitons in the electron-hole plasma. Phys. Stat. Sol. (B) 1978, 90, 175–187. [Google Scholar] [CrossRef]
- Omar, B. Spectral line broadening in dense plasmas. J. Atom. Mol. Opt. Phys. 2011, 2011, 850807:1–850807:8. [Google Scholar] [CrossRef]
- Edmonds, A.R. Angular Momentum in Quantum Mechanics; Princeton University Press: Princeton, NJ, USA, 1960. [Google Scholar]
© 2014 by the authors; licensee MDPI, Basel, Switzerland. This article is an open access article distributed under the terms and conditions of the Creative Commons Attribution license (http://creativecommons.org/licenses/by/3.0/).
Share and Cite
Omar, B.; González, M.Á.; Gigosos, M.A.; Ramazanov, T.S.; Jelbuldina, M.C.; Dzhumagulova, K.N.; Zammit, M.C.; Fursa, D.V.; Bray, I. Spectral Line Shapes of He I Line 3889 Å. Atoms 2014, 2, 277-298. https://doi.org/10.3390/atoms2020277
Omar B, González MÁ, Gigosos MA, Ramazanov TS, Jelbuldina MC, Dzhumagulova KN, Zammit MC, Fursa DV, Bray I. Spectral Line Shapes of He I Line 3889 Å. Atoms. 2014; 2(2):277-298. https://doi.org/10.3390/atoms2020277
Chicago/Turabian StyleOmar, Banaz, Manuel Á. González, Marco A. Gigosos, Tlekkabul S. Ramazanov, Madina C. Jelbuldina, Karlygash N. Dzhumagulova, Mark C. Zammit, Dmitry V. Fursa, and Igor Bray. 2014. "Spectral Line Shapes of He I Line 3889 Å" Atoms 2, no. 2: 277-298. https://doi.org/10.3390/atoms2020277
APA StyleOmar, B., González, M. Á., Gigosos, M. A., Ramazanov, T. S., Jelbuldina, M. C., Dzhumagulova, K. N., Zammit, M. C., Fursa, D. V., & Bray, I. (2014). Spectral Line Shapes of He I Line 3889 Å. Atoms, 2(2), 277-298. https://doi.org/10.3390/atoms2020277