Review

Review of Langmuir-Wave-Caused Dips and Charge-Exchange-Caused Dips in Spectral Lines from Plasmas and their Applications

1
Sorbonne Universités Pierre et Marie Curie, 75252 Paris CEDEX 5, France
2
Ecole Polytechnique, LULI, F-91128 Palaiseau CEDEX, France
3
Physics Department, 206 Allison Lab, Auburn University, Auburn, AL 36849, USA
4
Institute of Physics v.v.i., Academy of Sciences CR, 18221 Prague, Czech Republic
*
Author to whom correspondence should be addressed.
Atoms 2014, 2(2), 178-194; https://doi.org/10.3390/atoms2020178
Submission received: 22 January 2014 / Revised: 25 March 2014 / Accepted: 30 April 2014 / Published: 13 May 2014
(This article belongs to the Special Issue Spectral Line Shapes in Plasmas)

Abstract

:
We review studies of two kinds of dips in spectral line profiles emitted by plasmas—dips that have been predicted theoretically and observed experimentally: Langmuir-wave-caused dips (L-dips) and charge-exchange-caused dips (X-dips). There is a principal difference with respect to positions of L-dips and X-dips relative to the unperturbed wavelength of a spectral line: positions of L-dips scale with the electron density Ne roughly as Ne1/2, while positions of X-dips are almost independent of Ne (the dependence is much weaker than for L-dips). L-dips and X-dips phenomena are important, both fundamentally and practically. The fundamental importance is due to a rich physics behind each of these phenomena. L-dips are a multi-frequency resonance phenomenon caused by a single-frequency (monochromatic) electric field. X-dips are due to charge exchange at anticrossings of terms of a diatomic quasi-molecule, whose nuclei have different charges. As for important practical applications, they are as follows: observations of L-dips constitute a very accurate method to measure the electron density in plasmas—a method that does not require knowledge of the electron temperature. L-dips also allow measuring the amplitude of the electric field of Langmuir waves—the only spectroscopic method available for this purpose. Observations of X-dips provide an opportunity to determine rate coefficient of charge exchange between multi-charged ions. This is an important reference data, virtually inaccessible by other experimental methods. The rate coefficients of charge exchange are important for magnetic fusion in Tokamaks, for population inversion in the soft x-ray and VUV ranges, for ion storage devices, as well as for astrophysics (e.g., for the solar plasma and for determining the physical state of planetary nebulae).

1. Langmuir-Wave-Caused Dips

Langmuir-wave-caused dips (L-dips) in profiles of spectral lines in plasmas were discovered experimentally and explained theoretically for dense plasmas, where one of the electric fields F experienced by hydrogenic radiators is quasi-static. This field can be the ion micro-field and (or) a low frequency electrostatic turbulence.
There is a rich physics behind each of these phenomena. L-dips result from a resonance between the Stark splitting ωF = 3nħF/(2Zrmee) of hydrogenic energy levels, caused by a quasistatic field F in a plasma, and the frequency ωL of the Langmuir waves, which practically coincides with the plasma electron frequency ωp(Ne) = (4πe2Ne/me)1/2 ≈ 5.641 × 10⁴ [Ne(cm−3)]1/2:
ωF = s ωp(Ne), s = 1, 2, …
Even for the most common case of s = 1, it is actually a multi-frequency resonance phenomenon despite the fact that the electric field of the Langmuir wave is considered to be single-frequency (monochromatic): E0 cosωpt . Its multi-quantum nature has been revealed in paper [1]: it is a resonance between many quasienergy harmonics of the combined system “radiator + oscillatory field”, caused simultaneously by all harmonics of the total electric field E(t) = F + E0 cosωpt; where vectors F and E0 are not collinear.
The history of dips covers a long period from 1977 to 2013, during which they have been studied experimentally in different plasma sources, such as gas-liner pinch, laser-produced plasmas, and Z-pinch plasmas. These experiments, performed by various groups, required specific configurations and improved high-resolution X-ray spectrometers. The theory of L-dips provided a diagnostic tool for measuring the electric field amplitude E0 of the Langmuir waves and an independent method for measuring the electron density Ne.

1.1. Theory of L-dips

We present here a summary of the theoretical results from [2,3,4,5]. The resonance condition (1) is controlled by the principal quantum number n of the upper level involved in the radiative transition, the nuclear charge of the radiating ion Zr, the electron density Ne and the quasi-static micro-field F. As the quasi-static field F has a broad distribution ΔF over the ensemble of radiators, there would always be a fraction of radiators for which the resonance condition (1) is satisfied. These radiators are subjected simultaneously to the resonance value Fres of the quasi-static field (defined by Equation (1)) and to the Langmuir wave field E0 cosωpt. The L-dips are possible only as long as E0 < Fres. This imposes an upper limit on the ratio of the energy density of the Langmuir waves to the thermal energy density: E02/(8πNeTe) < 4Uion/(9n2Te), where Uion is the ionization potential of the radiating ion.
The resonance condition translates to specific locations of L-dips in spectral line profiles, depending on Ne; the distance of a L-dip from the unperturbed wavelength is given by:
Δλdip = aNe1/2 + bNe3/4
where coefficients a and b are controlled by quantum numbers and by the charges of the radiating and perturbing ions.
The primary term in Equation (2) reflects the dipole interaction with the ion micro-field. The second, much smaller term, takes into account—via the quadrupole interaction—a spatial non-uniformity of the ion micro-field.
Figure 1. The theoretically-expected structure of the L-dip.
Atoms 02 00178 g001
Each L-dip represents a structure consisting of the dip itself (the primary minimum of intensity) and two surrounding bumps (Figure 1). The bumps are due to a partial transfer of the intensity from the wavelength of the dip to adjacent wavelengths. The total structure can lead to a secondary dip (or a small shoulder).
The half-width of the L-dip, controlled by the amplitude E0 of the electric field of the Langmuir wave, is given by:
δλ1/2 ≈ (3/2)1/2λ02n2 E0/(8πmeecZr),
where λ0 is the unperturbed wavelength of the spectral line. Thus, by measuring the experimental half-width of L-dips, the amplitude E0 of the Langmuir wave can be determined.

1.2. Experimental Observations of L-dips

Gas-Liner Pinch Experiments in Kunze’s Group (1980-1990). The first observations of L-dips were made in a gas-liner pinch [6]—a modified z-pinch with a special gas inlet system—which is injected concentrically along the pinch wall and accelerated into the center of the discharge chamber to form the plasma. The plasma is mostly the driver gas plasma. It is characterized by a density (1–3) × 1018 cm−3, a relatively low temperature 10–13 eV, and a quasi-monochromatic field E0 cos(ωpt + ϕ) (Langmuir wave) of the same order as the average ion micro-field F*. With the injection of hydrogen, the Stark broadened profiles of Lyα were observed along the z axis at different times after the compression using a concave grating spectrometer [6].
The spectra (Figure 2) were taken 110 ns (top) and 200 ns (bottom) after the maximum compression. The electron densities were obtained by an independent diagnostic, i.e., coherent Thomson scattering. The first-order dips (due to the one-quantum resonance ωF = ωp) and the second-order dips (due to the two-quantum resonance ωF = 2ωp) were observed and their positions were in agreement with the theory. The shift of the dips with increasing densities was also visible and consistent with Equation (2); the effect of the spatial non-uniformity of the ion micro-field on the L-dip positions was revealed experimentally for the first time. Moreover, the detailed bump-dip-bump structure in the profile of each Stark component was also revealed for the first time (Figure 3).
Figure 2. Comparison of the experimental and theoretical positions of the dips in the profiles of the hydrogen Lyα line in the gas-liner pinch. The theoretical positions are shown by vertical solid lines connected by dashed lines.
Atoms 02 00178 g002
The gas-liner pinch experiments allowed two important diagnostics: the electron density from the location of the dips, using Equation (2), and the Langmuir wave amplitude from the half-width of the L-dips, using Equation (3). Figure 4 shows the electron densities calculated from the separation of the first-order dips vs. the electron density obtained by coherent Thomson scattering; the agreement is very good.
Laser Produced Plasma Experiments at LULI (Laboratoire pour l’Utilisation des Lasers Intenses, O. Renner et al 2006). The experiment was performed at the nanosecond Nd:glass laser facility at LULI. A single laser beam with an intensity of 2 × 10¹⁴ W/cm 2 was focused onto a structured target; an Al strip sandwiched between magnesium substrate [7,8]. The Al plasma was well confined and the transverse emission was optimized. The plasma parameters Ne = 5 × 1022 cm−3 and Te = 300 eV were estimated by hydrodynamic simulations. They confirm a resonant coupling between the ion micro-field F and the Langmuir field E. A Vertical-geometry Johann Spectrometer VJS with high spectral (4200) and spatial resolution was specially designed for the assessment of fine structures in the red wing of the Al XIII Lyγ line (Figure 5).
Figure 3. Zoom on the observed bump-dip-bump structure from the top part of Figure 2, the farthest dip in the blue wing.
Atoms 02 00178 g003
Figure 4. Comparison of the electron density deduced from coherent Thomson scattering and from the first-order dips, i.e., the dips like the pairs of dips closest to the line center in Figure 2.
Atoms 02 00178 g004
Figure 5. Experimental setup showing the structured target (CH/Al4C3/CH or Mg/Al/Mg), the Vertical-geometry Johann Spectrometer (VJS), and a sample experimental record consisting of two identical (except for noise) sets of spatially resolved spectra, symmetrically located with respect to the central wavelength.
Atoms 02 00178 g005
Theoretically expected L-dip positions (Figure 6) were confirmed by the experiment (Figure 7). The simultaneous production of a pair of symmetric spectra with this spectroscopic setup provides a reference point for the computational reconstruction of raw data, thus increasing the confidence in the identification of the dips.
Figure 6. Theoretically expected positions of L-dips in profiles of the Al XIII Lyγ line vs. the electron density.
Atoms 02 00178 g006
Figure 7. L-dips in the experimental profiles of the Al XIII Lyγ line from a plasma produced by the LULI laser. Only the red dips (corresponding to q = 1 in Figure 6) are visible, the blue dips (q = –1) are merged with the noise. The different spectra correspond to the emission from different distances from the target (i.e., different densities).
Atoms 02 00178 g007
This experiment in a laser-produced plasma confirms the dependence of the dips positions on the density, thus allowing a density diagnostic. The densities can be compared to the ones obtained from line broadening simulations (IDEFIX code at LULI and PIM PAM POUM code at PIIM-Marseille).
The latest experimental application of the theory of L-dips in Z-pinch plasma at Chongqing University, China (Jian et al 2013). At the Yang accelerator Z-pinch aluminum plasmas, characterized by a density Ne = 5 × 1021 cm−3, the electron temperature Te = 500 eV and the ion temperature Ti = 10 keV, were obtained by an imploding aluminum wire-array [9]. These conditions were favorable to a resonant coupling between the ion micro-field F and the Langmuir field E. The experimental Stark broadened profiles of the Al XIII Lyα and Al XIII Lyγ lines were recorded with a high spectral resolution (2,500) on a “Uniform Dispersion mica Crystal Spectrograph” UDCS [9]. These lines, emitted from different regions, exhibit bump-dip-bump first-order resonance structures, as shown in Figure 8. They correspond to slightly different densities and to different radial temperature gradients. The relationship between the positions from the line center of red Langmuir dips and electron density was studied. The electron densities deduced from the fine spectral features (the red dips) were compared to those derived from measurements of the Plasma Polarization Shift (PPS) of the entire spectral line. There was a 5% difference in electron density obtained by the two methods, which was due to the uncertainty of determining the average Te required for the PPS method (but not required by the method based on the L-dips).
Figure 8. The experimental red dips L+ and L in the profiles of the Al XIII Lyα and Al XIII Lyγ lines, observed at a Z-pinch facility in China, are compared to the theoretical predictions. The blue dips merge in the noise.
Atoms 02 00178 g008

2. Charge-Exchange-Caused Dips

The charge-exchange-caused-dips (X-dips) in profiles of spectral lines from dense plasmas are due to the Charge Exchange (CE) atomic process inside the plasma—distinct from L-dips caused by a resonant coupling between the plasma micro-field and Langmuir waves. Up to now, the process and its spectroscopic manifestation was studied in H-like radiating ions of the nuclear charge Z, exchanging an electron with a perturbing fully-stripped ion of a different nuclear charge Z’≠ Z. The history of X-dips covers a long period from 1995 to 2012. These dips represent signatures of the CE process in spectral line profiles emitted from dense plasmas. Observations of X-dips allow measuring rate coefficients of CE between multi-charged ions in dense plasmas.

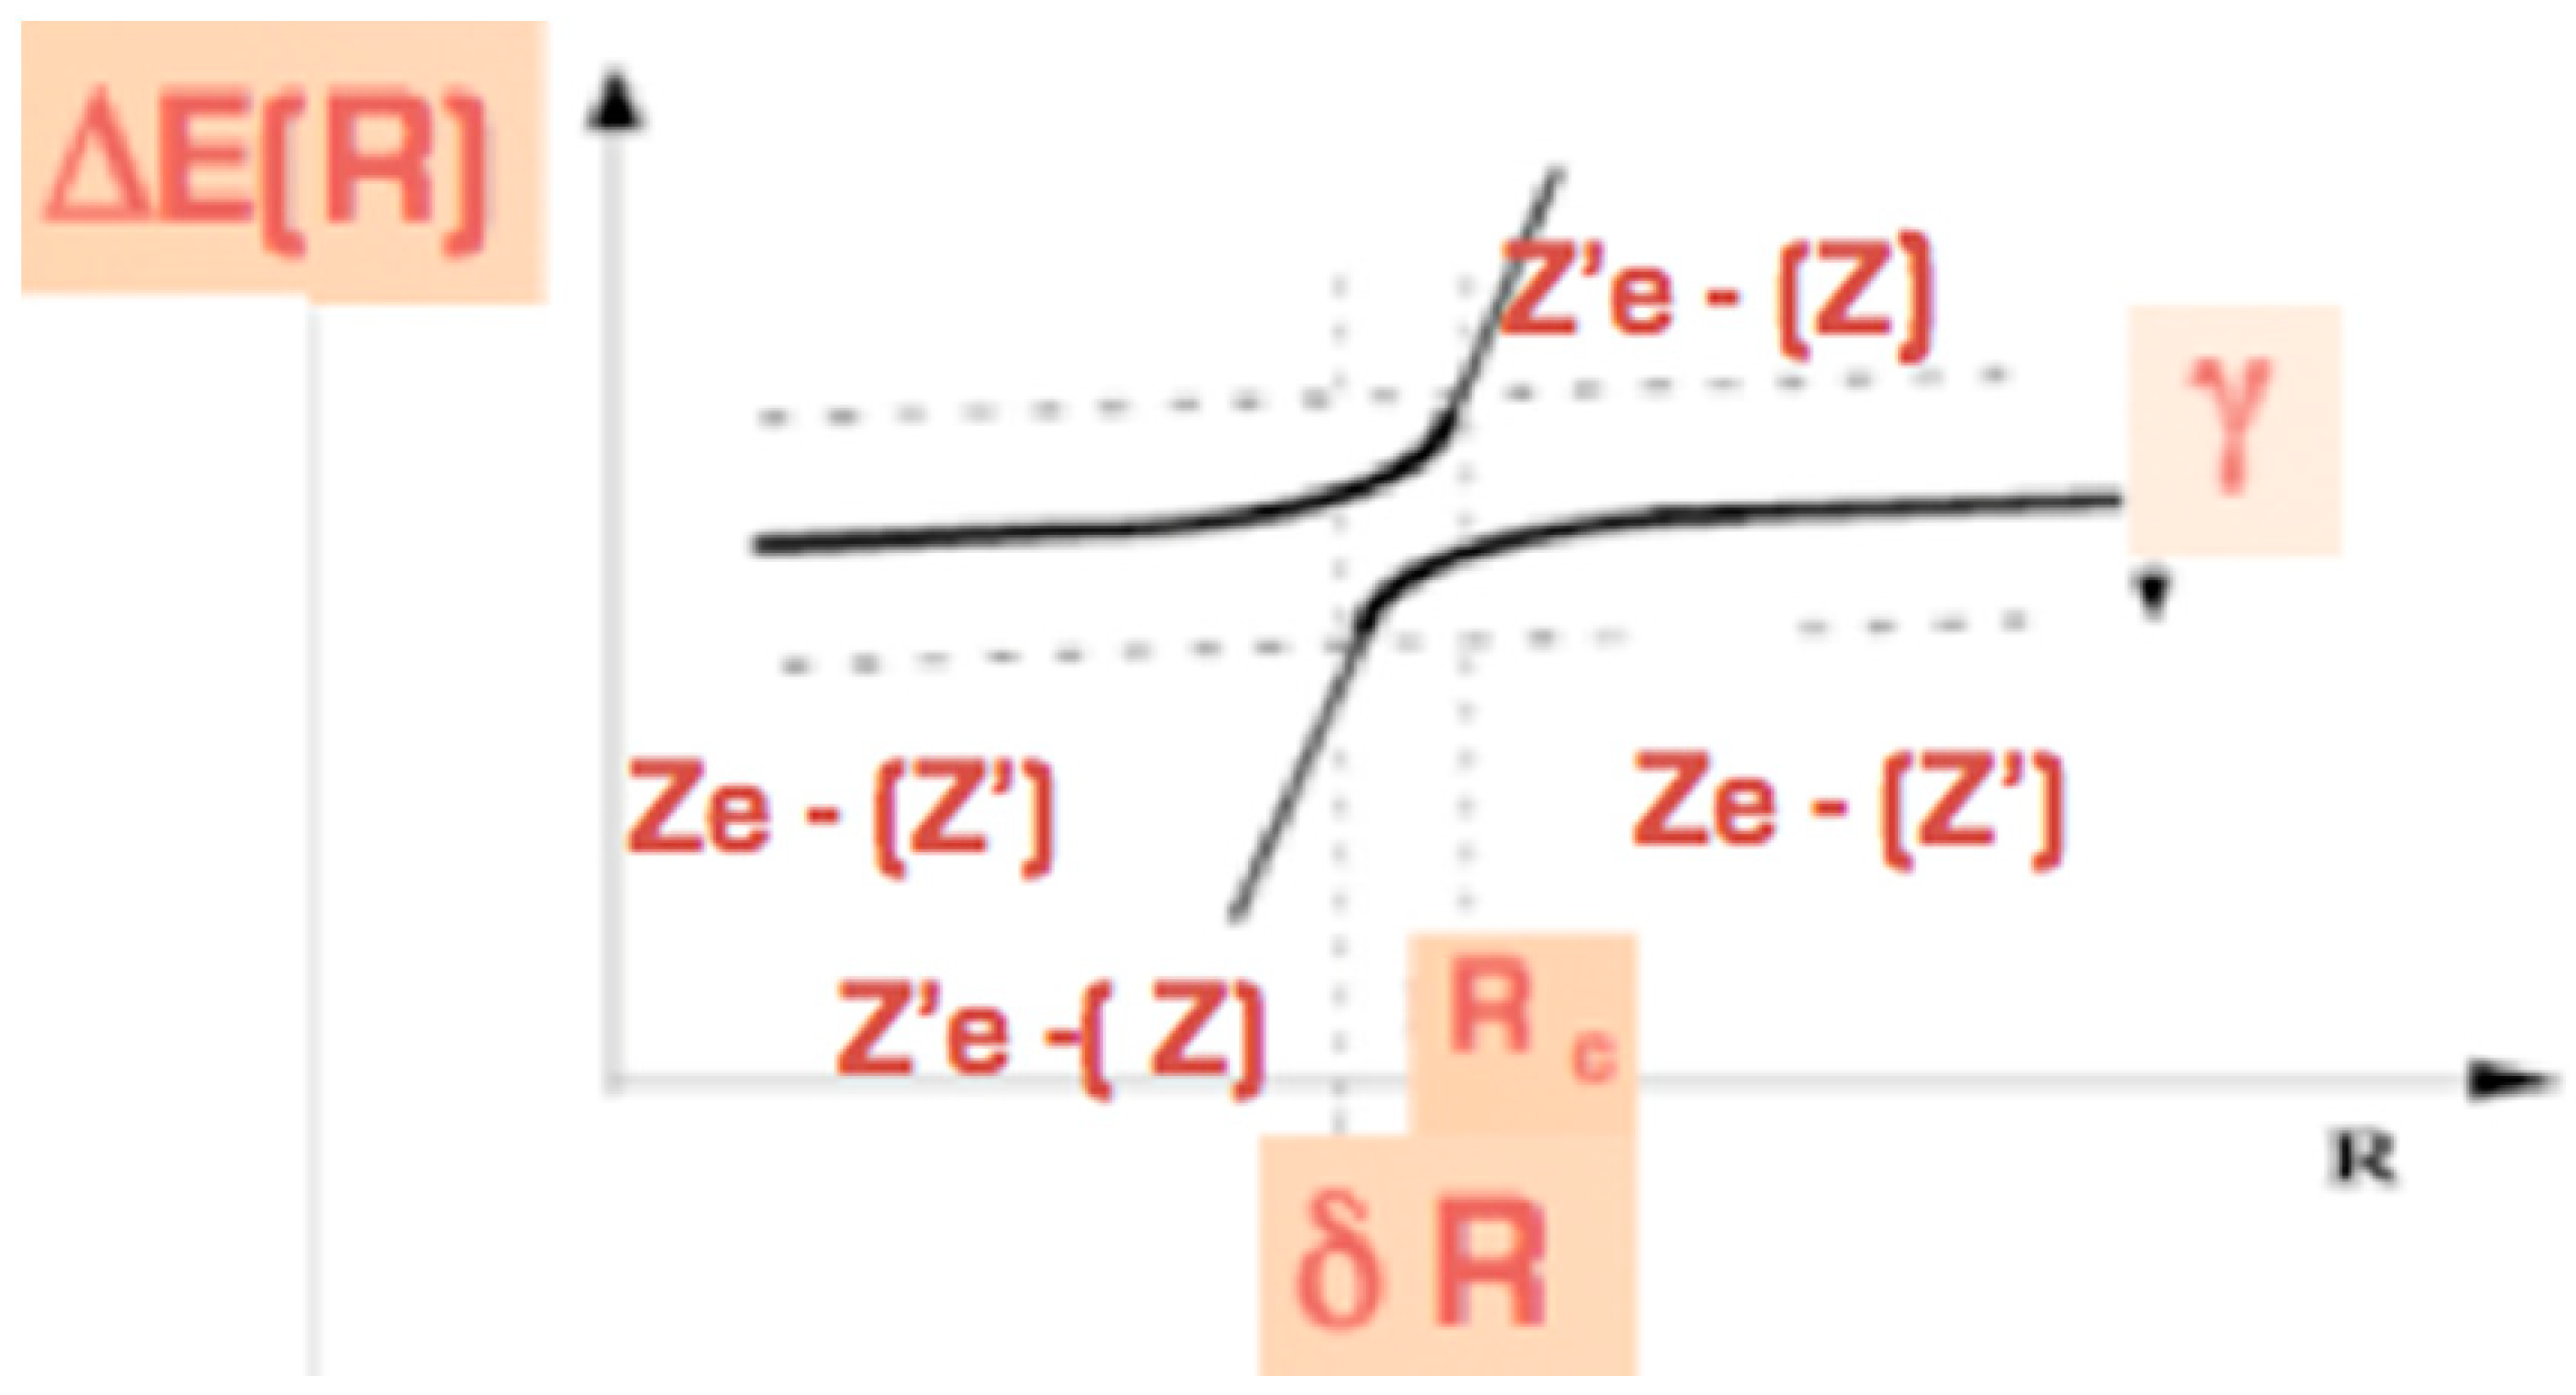
2.1 Theory of X-dips

We present here a summary of theoretical results from [10,11,12,13,14,15]. The X-dips are caused by CE at quasi-crossings of the energy terms E(R) of the quasi-molecule Z-e-Z’, made up of a H-like radiating ion Z and a perturbing fully stripped ion Z’. Here, R stands for the interionic distance. It is worth noting that there is a theorem by Neumann-Wigner [10] stating that terms “of the same symmetry” cannot cross, where “the same symmetry” means that the terms are characterized by the same projection M of the angular momentum on the inter-nuclear axis. However, this theorem is not valid for the Z–e–Z’ quasi-molecule [11], because this systems has a higher than geometric symmetry and therefore possesses an additional conserved quantity. The extra conserved quantity is the projection on the inter-nuclear axis of the super-generalized Runge-Lenz vector [12], i.e.:
A = p × M – M2/R ez – Zr/r – Z' (Rr)/|Rr| + Z' ez ,  ez = R/R,
where p and M are linear and angular momenta vectors, respectively; r is the radius vector of the electron. At the quasi-crossing, the terms are characterized by the same energy E and by the same projection M of the angular momentum on the inter-nuclear axis, but differ by the projection Az of vector A on the inter-nuclear axis. This extra conserved quantity Az controls the selection rule, allowing CE process at the quasi-crossing.
We note that CE could be possible not only due to quasicrossings, but also due to a rotational (Coriolis) coupling of terms (see, e.g., books [16,17]). Physically, the latter possibility is caused by a rotation of the internuclear axis; a simple yet general enough analytical treatment of this being given, e.g., in paper [18]. However, only CE due to quasicrossings causes X-dips – the formation of X-dips is intimately related to quasicrossings. We mention also that CE due to a rotational coupling usually occurs at significantly smaller internuclear distances than CE due to quasicrossings. Therefore, even if the rotational coupling would be able to cause an X-dip (though in reality it cannot), such dip would be practically impossible to observe; it would be located in a very far wing of the corresponding spectral line, where the experimental line profile merges with the noise. In short, an X-dip is a spectroscopic manifestation of CE, but not vice versa; not every CE causes an X-dip, but only CE due to a quasicrossing.
The transition energies ΔE(R) = ħω for the radiating ion Z, corresponding to the Stark components due to the static field produced by the Z’ ion (averaged over the ion distribution), yield the quasi-static profiles. These profiles are subjected to the dynamical broadening γ(R) due to electrons and ions.
Two independent complementary mechanisms explain the formation of X-dips in spectral line profiles [15]: one through the behavior of ΔE(R) and another through the dynamical broadening γ(R). A sharp change of the slope of the transition energy ΔE(R) at the quasi-crossing Rc leads to a dip at large distances [14] that can be predicted using the expansion of ΔE(R) in powers of 1/R. The other mechanism is based on the fact that CE provides an extra channel for the decay of the excited state of the radiating ion Z—in addition to the decay at the rate γnonCE(R) caused by the dynamical Stark broadening [13]. As a consequence, at Rc, the intensity of the profile is smaller (the dip formation) and in the vicinity ΔR it is larger (the bump formation) than it would be without CE.
Figure 9 presents a magnified sketch of the quasi-crossing structure and the role of the dynamical broadening.
Figure 9. A magnified sketch of the quasi-crossing structure. The transition energy, the bold line, occupies a bandwidth γ(R). In the interval ΔR the transition has two branches.
Atoms 02 00178 g009
The transition energy Ze-Z’ (the bold line) occupies a bandwidth γ(R), which is controlled by the dynamical broadening γnonCE(R) caused by electrons and ions, and by the charge exchange increase γCE (R) i.e.:
γ(R) = γCE(R) + γnonCE(R).
It is important to emphasize that γCE(R) rapidly decreases away from Rc, while γnonCE(R) varies very slowly away from Rc. This explains that the dip itself is surrounded by two adjacent bumps.
The bump-to-dip ratio of intensities is a function of the ratio:
r = γCE(Rc)/γnonCE(Rc).
This function was calculated analytically in [15]. As r increases, the bumps move away from the center of the X-dip and their intensities decrease. The bump-to-dip ratio measurement rexp allows deducing the rate coefficient of charge exchange [15] as follows:
< v σCE(v)> = γnonCE(Rc) rexp/Ni,
where Ni is the ion density. The quantity γ ≡ γnonCE(Rcr) in Equation (7), representing the frequency of inelastic collisions with electrons and ions leading to virtual transitions from the upper state of the radiator to other states, can be calculated for given plasma parameters Ne, Ni, Te, and Ti by using one of few contemporary theories (presented, e.g., in the book [19]).
The experimental determination of the rate coefficients of charge exchange from the dip structure is an important reference data that is virtually inaccessible by other experimental methods.
Figure 10. The X-dip structure in the blue side of the Hα line emitted by hydrogen atoms perturbed by fully stripped helium.
Atoms 02 00178 g010

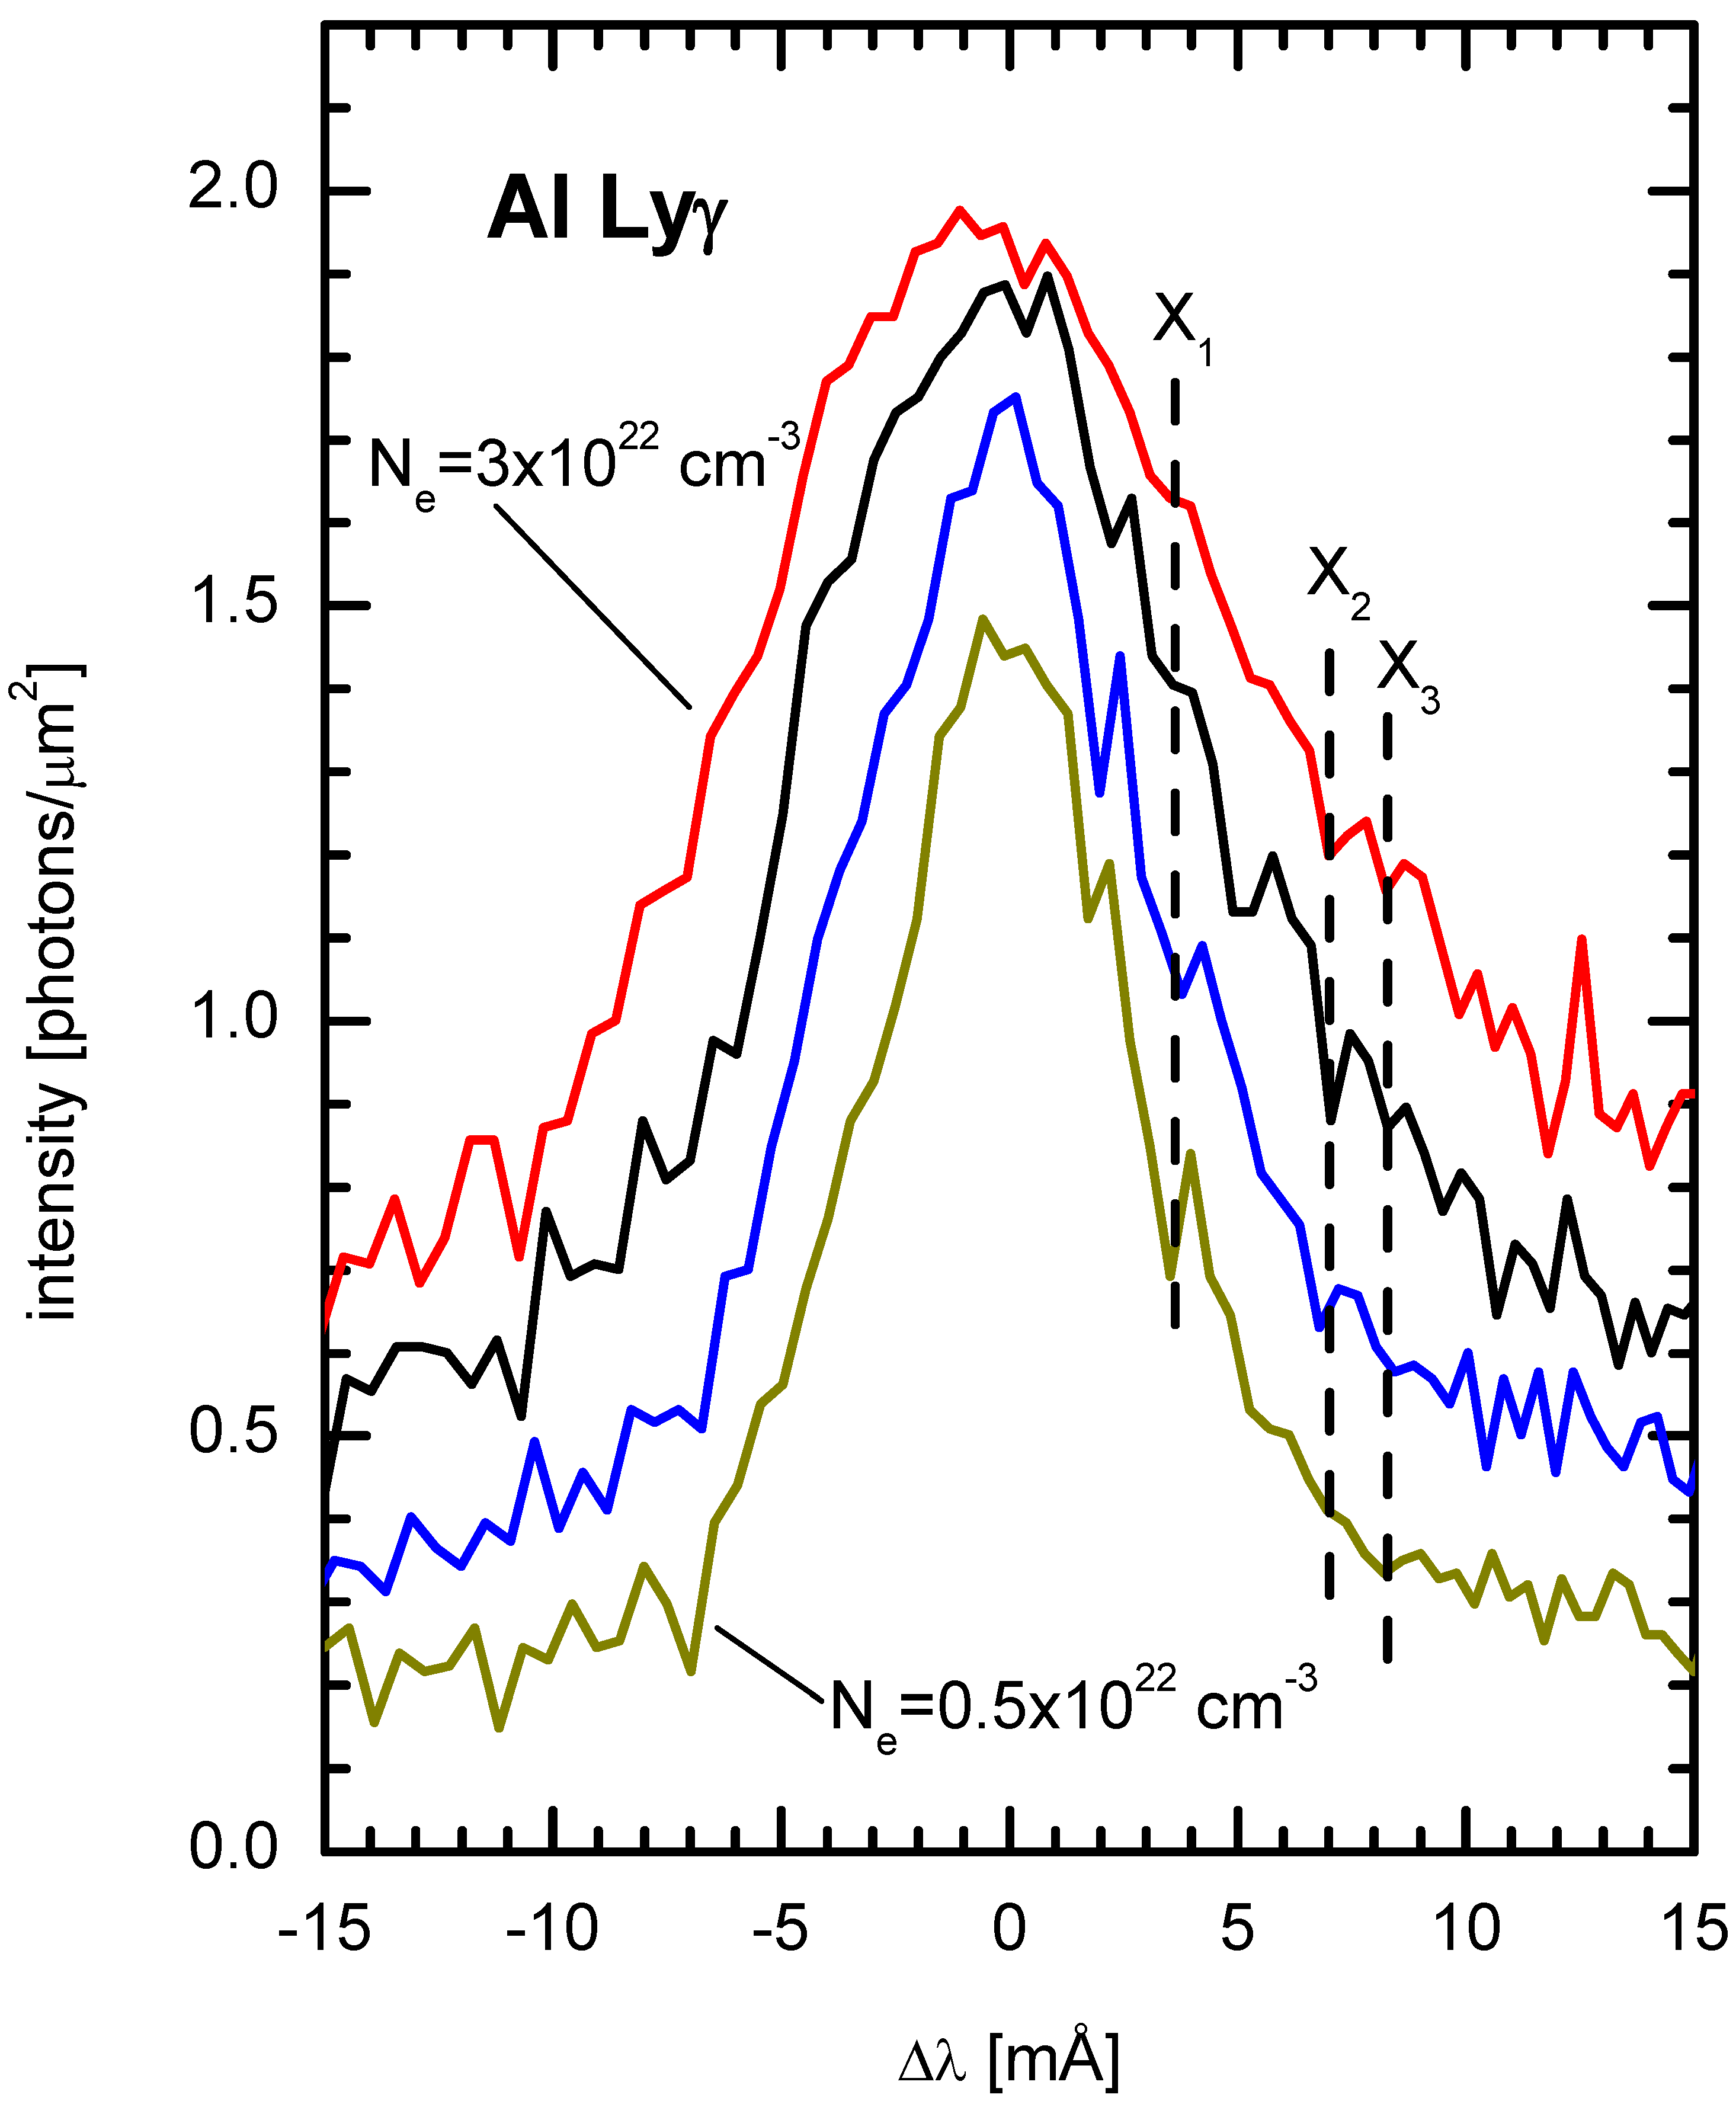
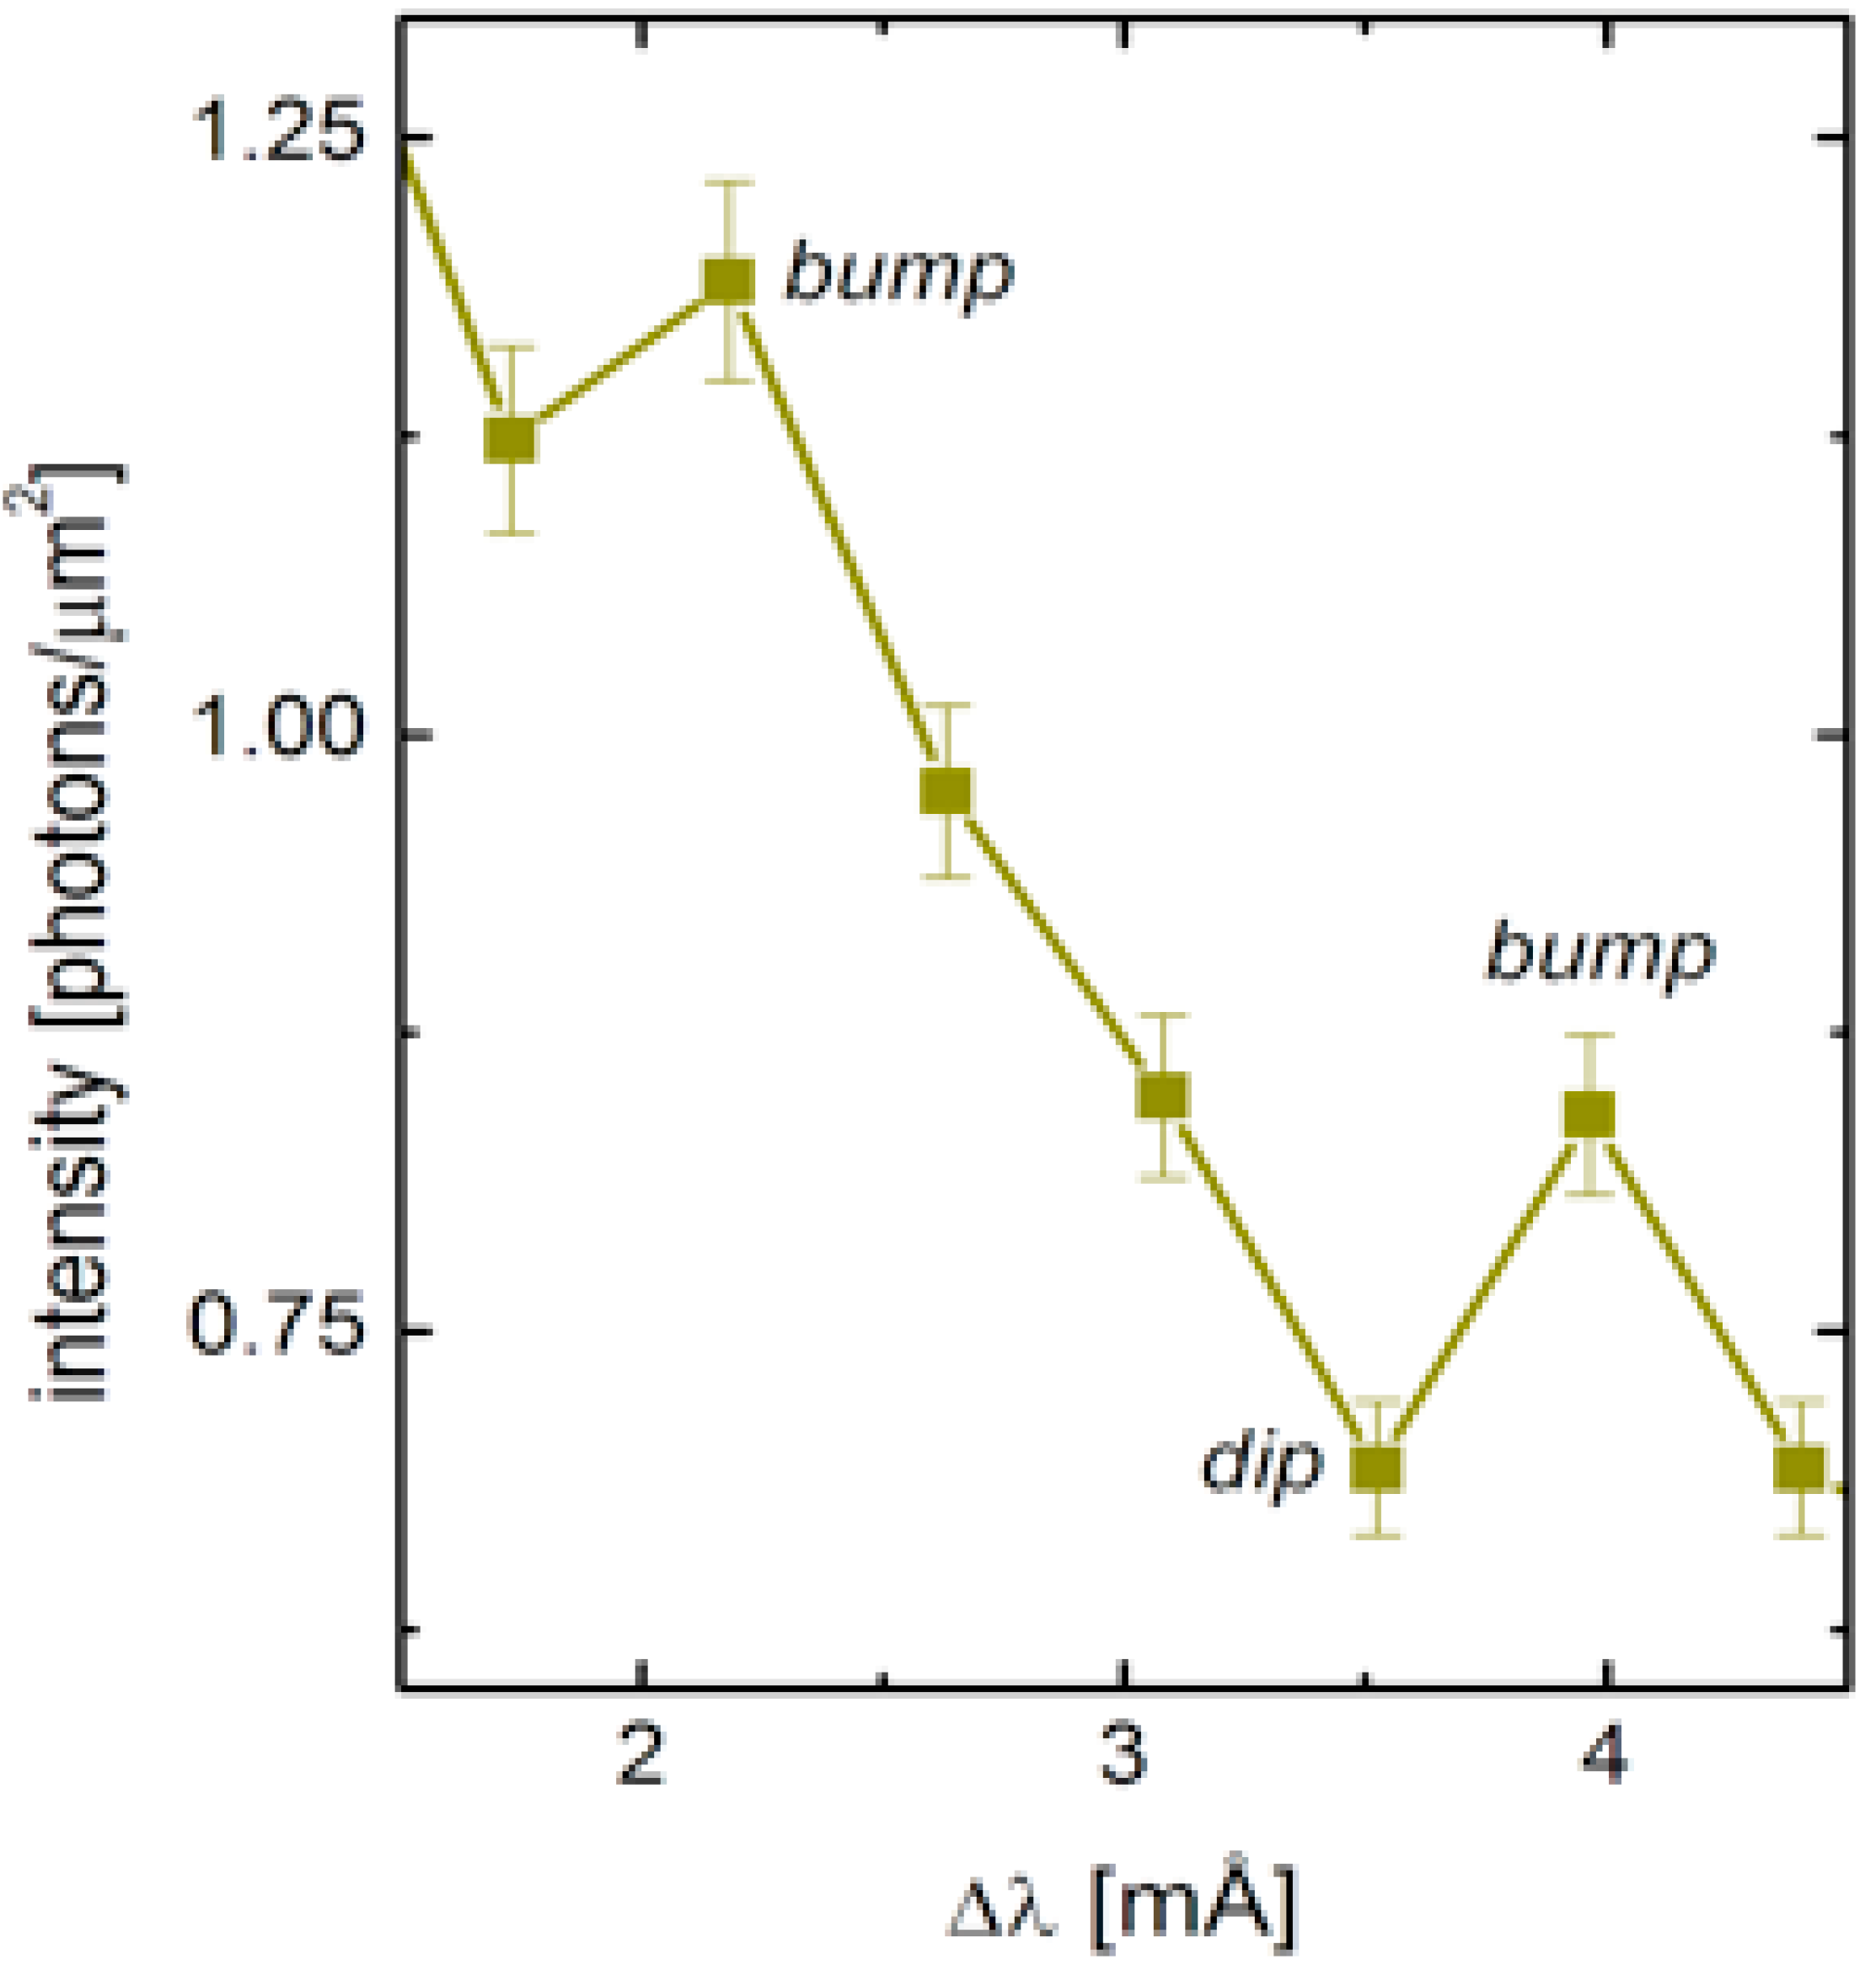
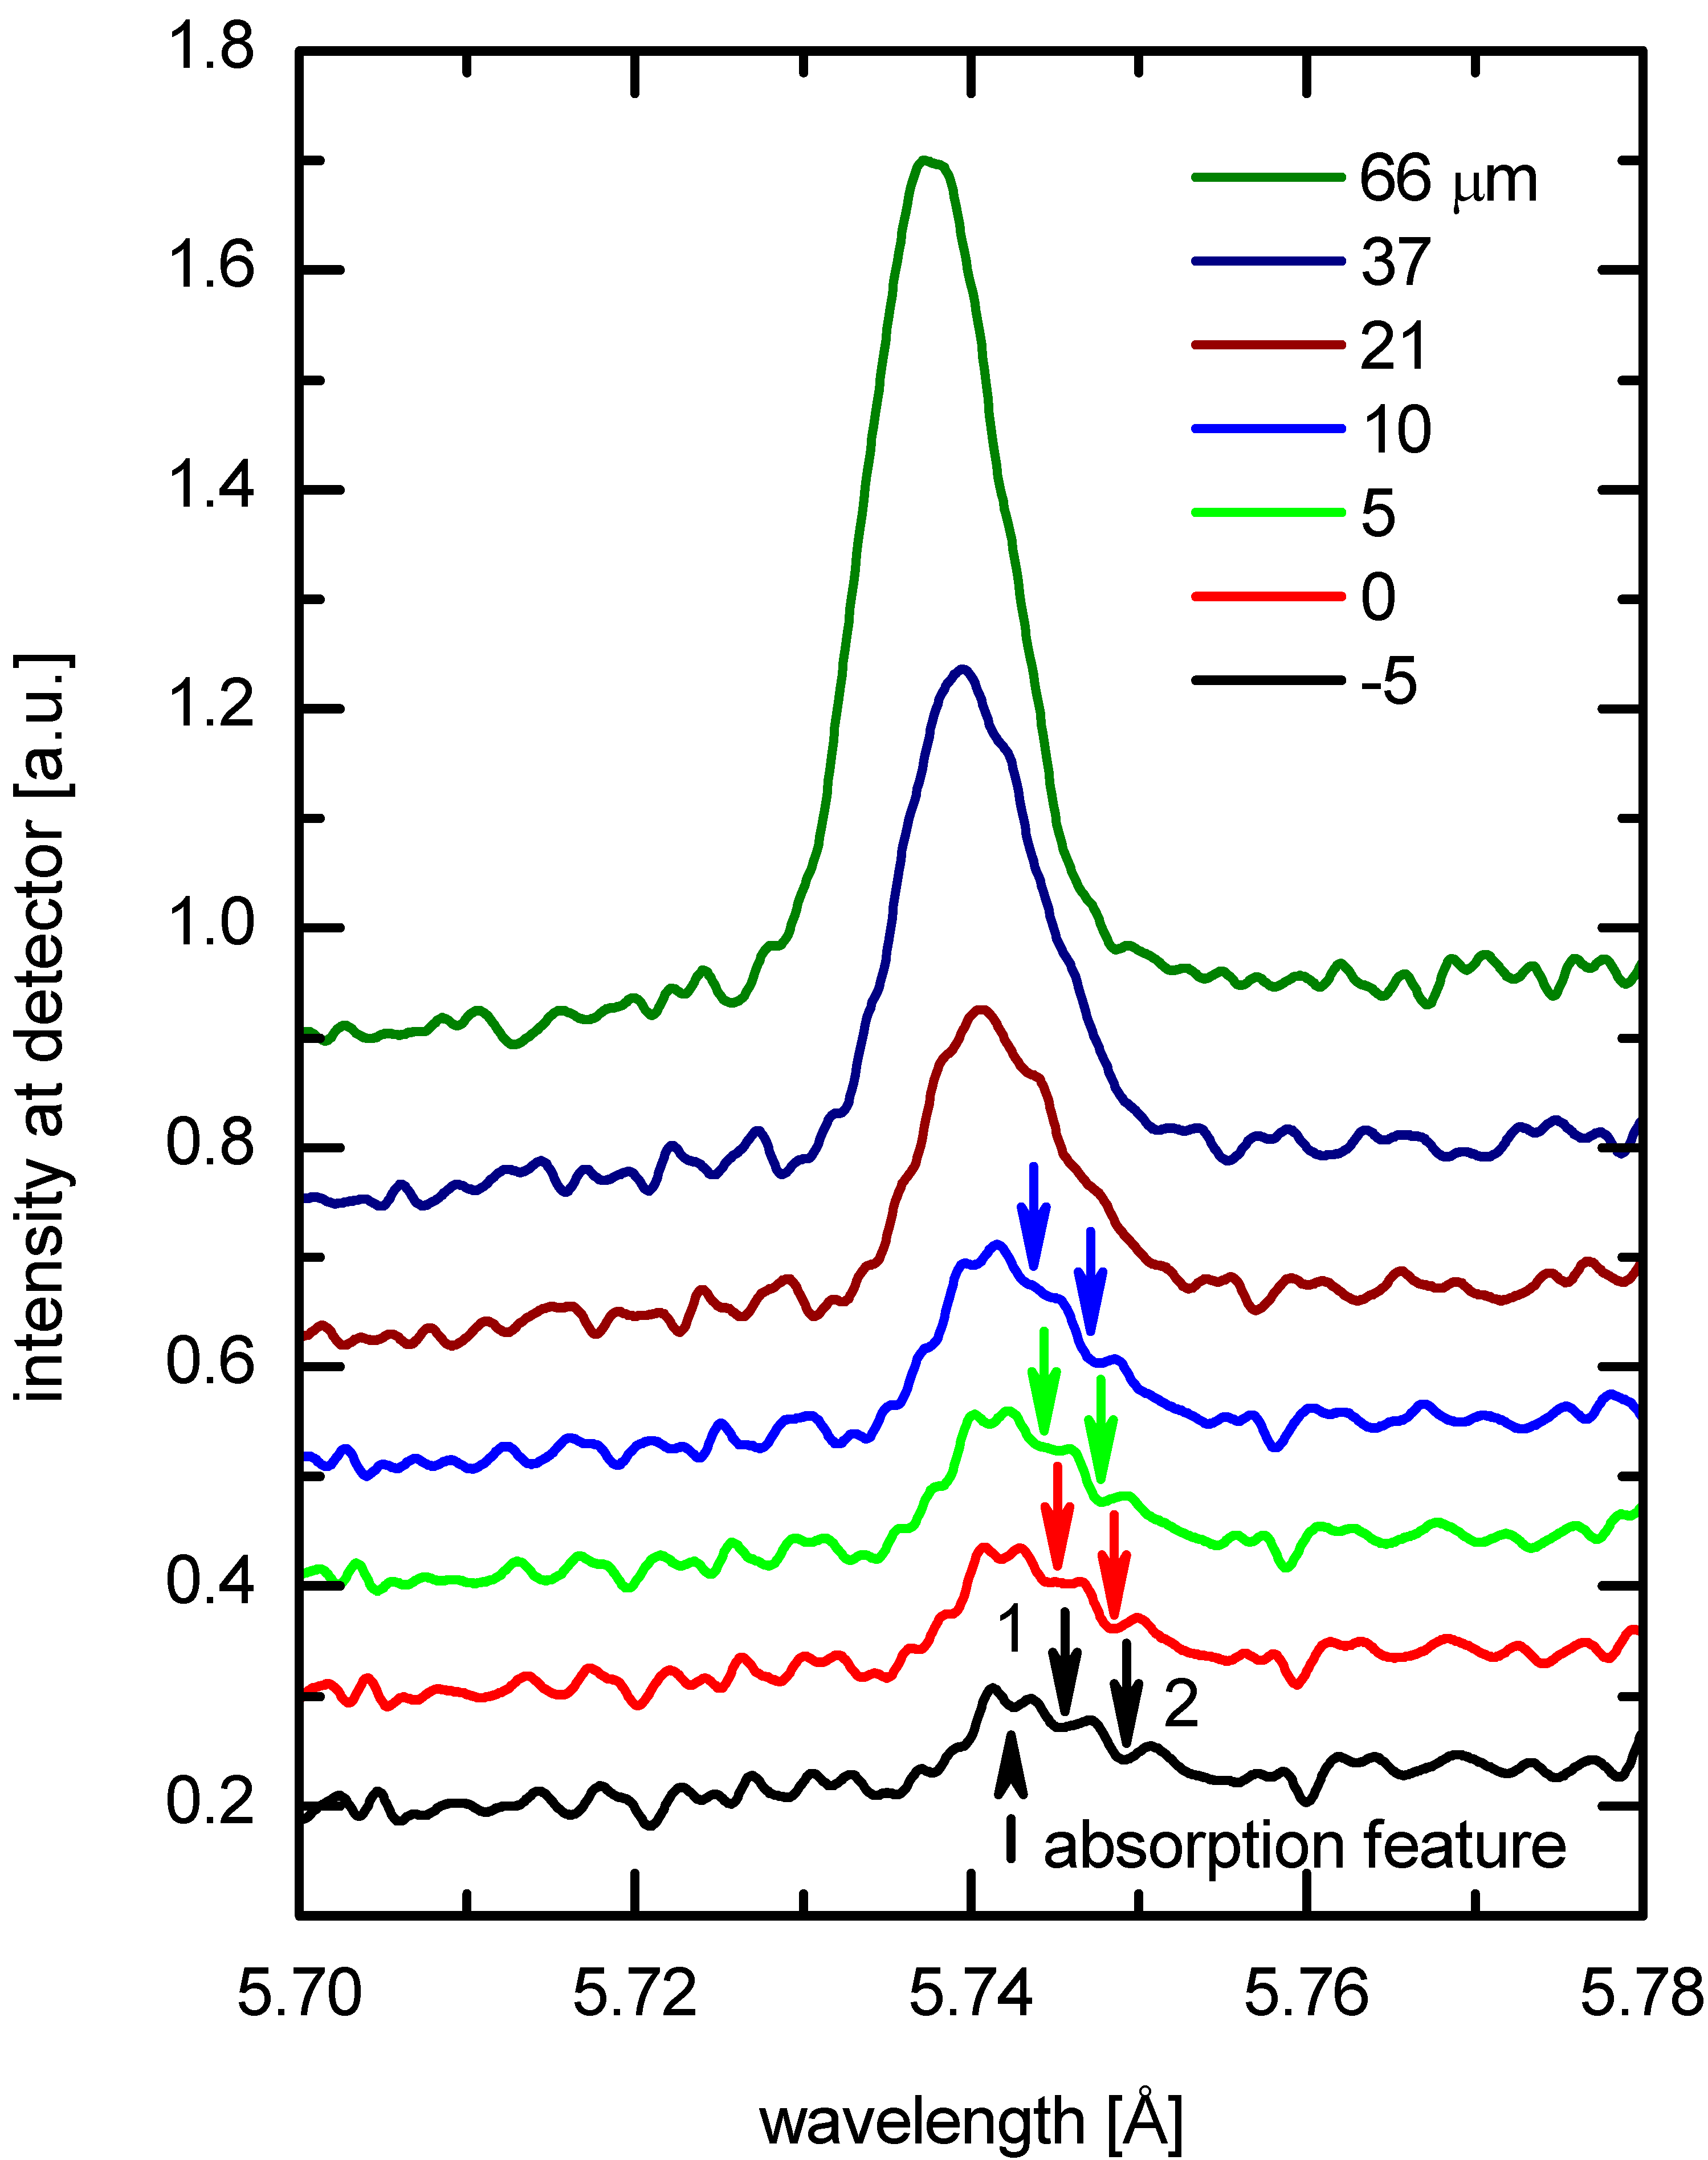
2.2 Experimental Observations of X-dips

The first observation in the gas-liner pinch (Kunze’s group 1995). The first observation of X-dips was made in the gas-liner pinch [13] in the blue side of the Hα line emitted by hydrogen atoms H (Z = 1) perturbed by fully stripped helium He (Z’ = 2) (Figure 10). The dips were observed for a relatively small range of electron densities around 1018 cm−3. For lower densities, the quasi-crossing distance Rc was much lower than the mean inter-ionic distance Ri and for higher densities, the dynamical broadening γnonCE(Rc) was smoothing the dip structure, both reasons being unfavorable for experimental observations. In these experiments the electron density Ne was measured by Thomson scattering and it was verified that the positions of the X-dips did not depend on Ne.
Figure 11. Observation of the X-dip structures X1, X2, X3 in the red wing of the Al XIII Lyγ line perturbed by carbon in laser-produced plasma experiments at LULI. The L-dips are also visible, but less pronounced than the X-dips.
Atoms 02 00178 g011
Figure 12. A magnified plot of the observed X1-dip structure, used for deducing the rate coefficient of CE.
Atoms 02 00178 g012
Laser Produced Plasma Experiments at LULI (Laboratoire pour l’Utilisation des Lasers Intenses) (E. Dalimier et al 2001). Later, the X-dips were observed in laser-produced plasmas characterized by a high electron density 1022 – 3 × 1022 cm−3 [15,20]. The setup was implemented at the laser facility LULI using the same nanosecond laser at 1014 W/cm2 and the same high-resolution Vertical-geometry Johann Spectrometer (R = 8,000) as in the experiments devoted to the observation of L-dips [7,8]. The targets used for the observation of X-dips were aluminum carbide Al4C3 strips inserted in carbon substrate. The emission from the heterogeneous plasma made up of Al and C ions exhibited spectroscopic signatures of CE. X-dips were observed for the first time in the experimental profile of the Lyγ line of Al XIII (Z = 13) perturbed by fully stripped carbon CVI (Z’ = 6), as shown in Figure 11. The positions of the dips did not vary significantly in the small density domain. For smaller densities the line is too narrow to allow the visibility of the exotic X-dip structures and at higher densities the dips are smoothed out.
From the experimental bump-to-dip ratio, the rate coefficient of charge exchange between a hydrogenic aluminum ion in the state n = 4 and a fully stripped carbon was found to be [15]:
< v σCE(v)> = (5.2 ± 1.1) 10−6 cm3/s
A magnified plot of the X1-dip structure, used for deducing the rate coefficient of CE, is presented in Figure 12.
Laser-produced plasma experiments at PALS (O. Renner et al 2012). The latest experimental study of X-dips was performed in 2012; in Plasma Wall Interaction (PWI) experiments performed at PALS [21]. A plasma jet of aluminum ions, produced by the nanosecond iodine laser of the intensity 3 × 10¹⁴ Wcm−2 incident on a foil, interacted with a massive carbon target. The high spectral and spatial resolution Vertical-geometry Johann Spectrometer was adjusted for the observation of X-dips in the experimental profile of the Lyγ line of Al XIII (Z = 13) (Figure 13). The dips X1 and X2, clearly visible in the red wing, are the signatures of CE phenomena accompanying the PWI. The electron densities involved in the experiment and simulated by codes PALE [22] and MULTIF [23] can reach 5 × 1022 cm3, which is higher than those achieved at LULI during the study of the same line (Figure 11). It is important to note that a weak dependence of the positions of the dips on the density has been detected. Simulations can explain this dependence [21]. The dip, visible in the far-red wing, is an L-dip corresponding to a possible multi-quantum resonance, thus providing a spectroscopic diagnostic of the electron density.
Figure 13. Observation of the X-dip structures X1 and X2, in the red wing of the Al XIII Lyγ line in the Plasma-Wall Interaction experiments at PALS (aluminum plasma interacting with carbon wall).
Atoms 02 00178 g013
Table 1. Prospective He-like lines and reciprocal cases of H-like lines, and solid targets for observing X-dips in laser-produced plasmas.
LinePerturberReciprocal CaseTarget
O VII He-gamma 17.78 ALi+3Li III L-alpha 135.0 A perturbed by O+7Lithium oxide (lithia) Li2O (solid)
Si XIII He-beta 5.681 ABe+4 Be-Si binary alloy or beryllium-doped silicon
Mg XI He-gamma 7.473 AB+5B V L-alpha 48.59 A perturbed by Mg+11Boracite Mg3B7O13Cl (mineral)
Si XIII He-gamma 5.405 AC+6C VI L-alpha 33.74 A perturbed by Si+13Silicon carbide (carborundum) SiC (solid)
Ca XIX He-beta 2.705 AC+6 Calcium carbonate CaCO3 (the common substance found in rocks and the main component of shells of marine organisms, snails, and egg shells)
S XV He-gamma 4.089 AN+7N VII L-alpha 24.78 A perturbed by S+15Ammonium sulfate (NH4)2SO4 (crystals/granules)
V XXII He-beta 2.027 AN+7 Vanadium nitride VN (solid)
Fe XXV He-beta 1.574 AO+8 Iron oxides FeO, Fe3O4, Fe2O3 (crystalline solid)
Ca XIX He-gamma 2. 57 AF+9F IX L-alpha 14.99 A perturbed byCa+19Calcium fluoride (fluorite) CaF2 (mineral/solid)
Cu XXVIII He-beta 1.257 AF+9 Copper fluoride CuF2 (crystalline solid)

2.3 The Latest Development on X-dips

Up to now, the X-dip phenomena were considered to be possible only in spectral lines of hydrogen-like ions perturbed by fully stripped ions. The reason is the existence of an additional conserved quantity for the corresponding two-center Coulomb system with one bound electron. Recently we showed that X-dip phenomena are possible in spectral lines of helium-like ions from laser-produced plasmas [24,25]. The reason is the existence of an approximate additional conserved quantity for the corresponding two-center Coulomb system with two bound electrons [26]. This offers a new opportunity to extend the range of fundamental data on charge exchange.
Table 1 presents 15 prospective He-like spectral lines and 10 corresponding solid targets for observing X-dips in laser-produced plasmas.

3. Conclusions

The conclusion of the review paper is focused on the importance of L-dips and X-dips phenomena.
First, there is rich physics in both phenomena, involving connections between different topics, i.e., Atomic/Molecular Physics and Plasma Physics.
Second, high-resolution spectroscopy was crucial in all these studies and it resulted in new dense plasma diagnostic methods and in the production of new fundamental reference data, i.e., the amplitude of the electric field of Langmuir waves from L-dips, the first spectroscopic signature allowing also an accurate measure of the electron density; the rate coefficient of CE between multi-charged ions from X-dips. The rate coefficient of CE is important for inertial fusion in laser-generated plasmas, for magnetic fusion in Tokamaks, for population inversion in soft X-ray and VUV ranges, for ion storage devices, and for astrophysics phenomena. The X-dips method presented here has shown its efficiency over a very large range of electron densities.

Acknowledgements

The participation of O. Renner in this work was supported by the Academy of Sciences of the Czech Republic, project M100101208.

Author Contributions

All authors contributed equally to this review.

Conflicts of Interest

The authors declare no conflict of interest.

References

  1. Gavrilenko, V.P.; Oks, E. A new effect in the Stark spectroscopy of atomic hydrogen: Dynamic resonance. Sov. Phys. JETP-USSR 1981, 53, 1122–1127. [Google Scholar]
  2. Zhuzhunashvili, A.I.; Oks, E. Technique of optical polarization measurements of the plasma Langmuir turbulence spectrum. Sov. Phys. JETP-USSR 1977, 46, 1122–1132. [Google Scholar]
  3. Oks, E.; Rantsev-Kartinov, V.A. Spectroscopic observation and analysis of plasma turbulence in a Z-pinch. Sov. Phys. JETP-USSR 1980, 52, 50–58. [Google Scholar]
  4. Gavrilenko, V.P.; Oks, E. Multiphoton resonance transitions between “dressed” atom sublevels separated by Rabi frequency. Sov. Phys. Plasma Phys. 1987, 13, 22–28. [Google Scholar]
  5. Oks, E. Plasma Spectroscopy: The Influence of Microwave and Laser Fields; Springer Series on Atoms and Plasmas; Volume 9, Springer: New York, NY, USA, 1995. [Google Scholar]
  6. Oks, E.; Böddeker, St.; Kunze, H.-J. Spectroscopy of atomic hydrogen in dense plasmas in the presence of dynamic fields: intra-Stark spectroscopy. Phys. Rev. A 1991, 44, 8338–8347. [Google Scholar] [CrossRef]
  7. Renner, O.; Dalimier, E.; Oks, E.; Krasniqi, F.; Dufour, E.; Schott, R.; Förster, E. Experimental evidence of Langmuir-wave-caused features in spectral lines of laser-produced plasmas. J Quant. Spectr. Rad. Transfer 2006, 99, 439–450. [Google Scholar] [CrossRef]
  8. Krasniqi, F.; Renner, O.; Dalimier, E.; Dufour, E.; Schott, R.; Förster, E. Possibility of plasma density diagnostics using Langmuir-wave-caused dips observed in dense laser plasmas. Eur. Phys. J. D 2006, 39, 439–444. [Google Scholar] [CrossRef]
  9. Jian, L.; Shali, X.; Qingguo, Y.; Lifeng, L.; Yufen, W. Spatially resolved spectra from a new uniform dispersion crystal spectrometer for characterization of Z-pinch plasmas. J. Quant. Spectr. Rad. Transfer 2013, 116, 41–48. [Google Scholar] [CrossRef]
  10. von Neumann, J.; Wigner, E. Über das verhalten von Eigenwerten bei adiabatischen Prozessen. Phys. Z. 1929, 30, 467–470. [Google Scholar]
  11. Gershtein, S.S.; Krivchenkov, V.D. Electron terms in the field of 2 different Coulomb centers. Sov. Phys. JETP-USSR 1961, 13, 1044. [Google Scholar]
  12. Kryukov, N.; Oks, E. Super-generalized Runge-Lenz vector in the problem of two Coulomb or Newton centers. Phys. Rev. A 2012, 85, 054503. [Google Scholar] [CrossRef]
  13. Boeddeker, S.; Kunze, H.-J.; Oks, E. A Novel structure in the H-alpha line profile of hydrogen in a dense helium plasma. Phys. Rev. Lett. 1995, 75, 4740–4743. [Google Scholar] [CrossRef]
  14. Oks, E.; Leboucher-Dalimier, E. Spectroscopic signatures of avoided crossings caused by charge exchange in plasmas. J. Phys. B: Atom. Mol. Opt. Phys. 2000, 33, 3795–3806. [Google Scholar] [CrossRef]
  15. Dalimier, E.; Oks, E.; Renner, O.; Schott, R. Experimental determination of rate coefficients of charge exchange from X-dips in laser-produced plasmas. J. Phys. B: Atom. Mol. Opt. Phys. 2007, 40, 909–919. [Google Scholar] [CrossRef]
  16. Bransden, B.H.; McDowell, M.R.C. Charge Exchange and the Theory of Ion-Atom Collisions; Oxford University Press: Oxford, United Kingdom, 1992. [Google Scholar]
  17. Smirnov, B.M. Physics of Atoms and Ions; Springer: Berlin, Germany, 2003; Section 14.3. [Google Scholar]
  18. Demkov, Yu.N.; Kunasz, C.V.; Ostrovskii, V.N. United-atom approximation in the problem of Σ−Π transitions during close atomic collisions. Phys. Rev. A 1978, 18, 2097–2106. [Google Scholar] [CrossRef]
  19. Oks, E. Stark Broadening of Hydrogen and Hydrogenlike Spectral Lines in Plasmas: The Physical Insight; Alpha Science International: Oxford, United Kingdom, 2006. [Google Scholar]
  20. Leboucher-Dalimier, E.; Oks, E.; Dufour, E.; Sauvan, P.; Angelo, P.; Schott, R.; Poquerusse, A. Experimental discovery of charge-exchange-caused dips in spectral lines from laser-produced plasmas. Phys. Rev. E 2001, 64, 065401(R). [Google Scholar]
  21. Renner, O.; Dalimier, E.; Liska, R.; Oks, E.; Šmíd, M. Charge exchange signatures in X-ray line emission accompanying plasma-wall interaction. J. Phys. Conf. Ser. 2012, 397, 012017. [Google Scholar] [CrossRef]
  22. Liska, R.; Limpouch, J.; Kucharik, M.; Renner, O. Selected laser plasma simulations by ALE method. J. Phys. Conf. Ser. 2008, 112, 022009. [Google Scholar] [CrossRef]
  23. Chenais-Popovics, C.; Renaudin, P.; Rancu, O.; Guilleron, F.; Gauthier, J.C.; Larroche, O.; Peyrusse, O.; Dirksmöller, M.; Sondhauss, P.; Missalla, T.; et al. Kinetic to thermal energy transfer and interpenetration in the collision of laser-produced plasmas. Phys. Plasmas 1997, 4, 190–208. [Google Scholar] [CrossRef]
  24. Dalimier, E.; Oks, E. Dips in spectral lines of He-like ions caused by charge exchange in laser-produced plasmas. Intern. Review of Atomic and Molec. Phys. 2012, 3, 85–92. [Google Scholar]
  25. Dalimier, E.; Oks, E. Analytical theory of charge-exchange-caused dips in spectral lines of He-like ions from laser-produced plasmas. J. Phys. B: Atom. Mol. Opt. Phys. 2014, 105001. [Google Scholar] [CrossRef]
  26. Nikitin, S.I.; Ostrovsky, V.N. On the classification of doubly-excited states of the two-electron atom. J. Phys. B: Atom. Mol. Opt. Phys. 1976, 9, 3141–3148. [Google Scholar] [CrossRef]

